Article

Predictors of Drought in Inland Valley Landscapes and Enabling Factors for Rice Farmers’ Mitigation Measures in the Sudan-Sahel Zone

by
Elliott R. Dossou-Yovo
1,*,
Sander J. Zwart
2,
Amadou Kouyaté
3,
Ibrahima Ouédraogo
4 and
Oladele Bakare
5
1
Africa Rice Center, 01 BP 2551, Bouake, Cote d’Ivoire
2
International Water Management Institute (IWMI), PMB CT 112 Cantonments, Accra, Ghana
3
Institute of Rural Economy, BP 16, Sikasso, Mali
4
National Institute for the Environment and Agricultural Research, 01 BP 910 Bobo Dioulasso 01, Burkina Faso
5
Agricultural Research Council of Nigeria, PMB 5026, Abuja, Nigeria
*
Author to whom correspondence should be addressed.
Sustainability 2019, 11(1), 79; https://doi.org/10.3390/su11010079
Submission received: 13 October 2018 / Revised: 7 November 2018 / Accepted: 9 November 2018 / Published: 24 December 2018

Abstract

:
Drought is a noteworthy cause of low agricultural profitability and of crop production vulnerability, yet in numerous countries of Africa little to no consideration has been paid to readiness for drought calamity, particularly to spatial evaluation and indicators of drought occurrence. In this study, biophysical and socio-economic data, farmers’ community surveys and secondary data from remote sensing on soil characteristics and water demand were used to evaluate the predictors of drought in inland valley rice-based production systems and the factors affecting farmers’ mitigation measures. The study intervened in three West African countries located in the Sudan-Sahel zone, viz. Burkina Faso, Mali and Nigeria. Significant drying trends occurred at latitudes below 11°30′ whilst significant wetting trends were discerned at latitude above 11°30′. Droughts were more frequent and had their longest duration in the states of Niger and Kaduna located in Nigeria and in western Burkina Faso during the period 1995–2014. Among 21 candidate predictors, average annual standardized precipitation evapotranspiration index and duration of groundwater availability were the most important predictors of drought occurrence in inland valleys rice based-production systems. Land ownership and gender affected the commitment of rice farmers to use any mitigation measure against drought. Drought studies in inland valleys should include climatic water balance and groundwater data. Securing property rights and focusing on women’s association would improve farmers’ resilience and advance drought mitigation measures.

1. Introduction

Rice has become a major staple food and an increasing source of calories in Sub-Saharan Africa (SSA) as economic growth and increasing urbanization have changed consumption patterns and preferences towards rice and away from traditional food [1]. In most of the sub-Saharan countries, the rice production is far below the rice demand [2]. The self-sufficiency ratio in SSA measured by the ratio of production over consumption is on average 47% and varies from as low as 19% in Cameroon and Niger to as high as 93% in Mali [3]. Most countries therefore depend heavily on imports to meet their growing rice demands.
In Asia, the Green Revolution achieved significant increase in rice production in irrigated environments. However, in rainfed systems, the Green Revolution had little effect on rice yield due to recurrent drought and other biophysical constraints [4]. Ninety percent of the rice production in SSA occurs under rainfed conditions [5]. Therefore, rainfall is a major determinant in farming activities planning by the majority of small scale farmers [6]. Small scale farmers cultivate small parcels of land and they often lack reliable access to water. They are consequently vulnerable to environmental risks including drought and shortage of water for irrigation. The high exposure to environmental risks inhibits farmers’ investment in agricultural inputs (seed, labor, agro-chemical, etc.) and mechanization to increase rice productivity [7]. They practice low-input agriculture and average yields are low, often not exceeding 2 tons ha−1 [8,9].
Broader areas have been affected by drought since the 1970s, especially in SSA, due to an increase in temperature and a decrease in precipitation [10]. It is now more certain that climate change contributes to enhanced drought severity in drought-vulnerable regions, thereby increasing small farming households’ food insecurity risk [11]. Regardless of the climate conditions, the poor physical properties of weathered and coarse-textured soils in many parts of SSA induce low water-holding capacity and establish water deficit as a major constraint [12]. Besides climate change, high competition among different users of scare water resources and inadequate water management further enhance drought impacts [13].
Inland valleys landscapes are widespread and estimated to account for 85 million ha in SSA [14]. Given the high agricultural production potential, due to better soil fertility and water availability than uplands, inland valleys are increasingly being considered as SSA’s future food basket [15]. Although inland valleys offer favorable conditions, drought is the most important abitioc stress negating rice production in this ecosystem and is estimated to have affected 38% of the total inland valley area in SSA in 2008, causing 29% of rice yield loss [1]. The measures to reduce drought impact in inland valley rice-based production systems include changes in the growing period to escape dry spells, supplemental irrigation and reduction of unproductive water losses to save more water for productive transpiration [16]. However, gains from the above-mentioned measures have been modest [17], in part because there has been insufficient farmer involvement in the development of the measures [18] and little effort for defining target population of drought-prone inland valleys and support farmers to implement appropriate measures [19]. Furthermore, few studies were conducted on drought occurrence in inland valley rice-based production systems and were based on experts’ opinions [1], soil water-holding capacity only [12] and crop modelling with limited ground validation [20].
This study used a large geo-located multidisciplinary database of 300 surveyed inland valleys in 14 regions in three West African countries. The objectives of the study were to assess the predictors for occurrence of drought in inland valleys rice-based production systems and to inventory enabling factors for small scale farmers to mitigate its effects. Farmer surveys on the biophysical and socioeconomic characteristics of the rice production environment were implemented in 300 inland valleys. Additional parameters, such as rainfall, minimum and maximum air temperatures, soil particle size distribution and soil organic carbon were extracted from freely available spatial datasets using the geolocation of the inland valleys and then added to the survey database. Random Forest analysis was used to determine the predictors of drought and logistic regression analysis was conducted to investigate the determinants of farmers’ commitment to use drought mitigation measures using the package ‘RandomForest’ and the function ‘glm’ of the statistical program R [21], respectively on the database. Improved knowledge on the occurrence of drought and the enabling environment for mitigation that is generated in this study will support governments, donors and agricultural development projects to better target drought-prone areas and support farmers to implement appropriate measures.

2. Materials and Methods
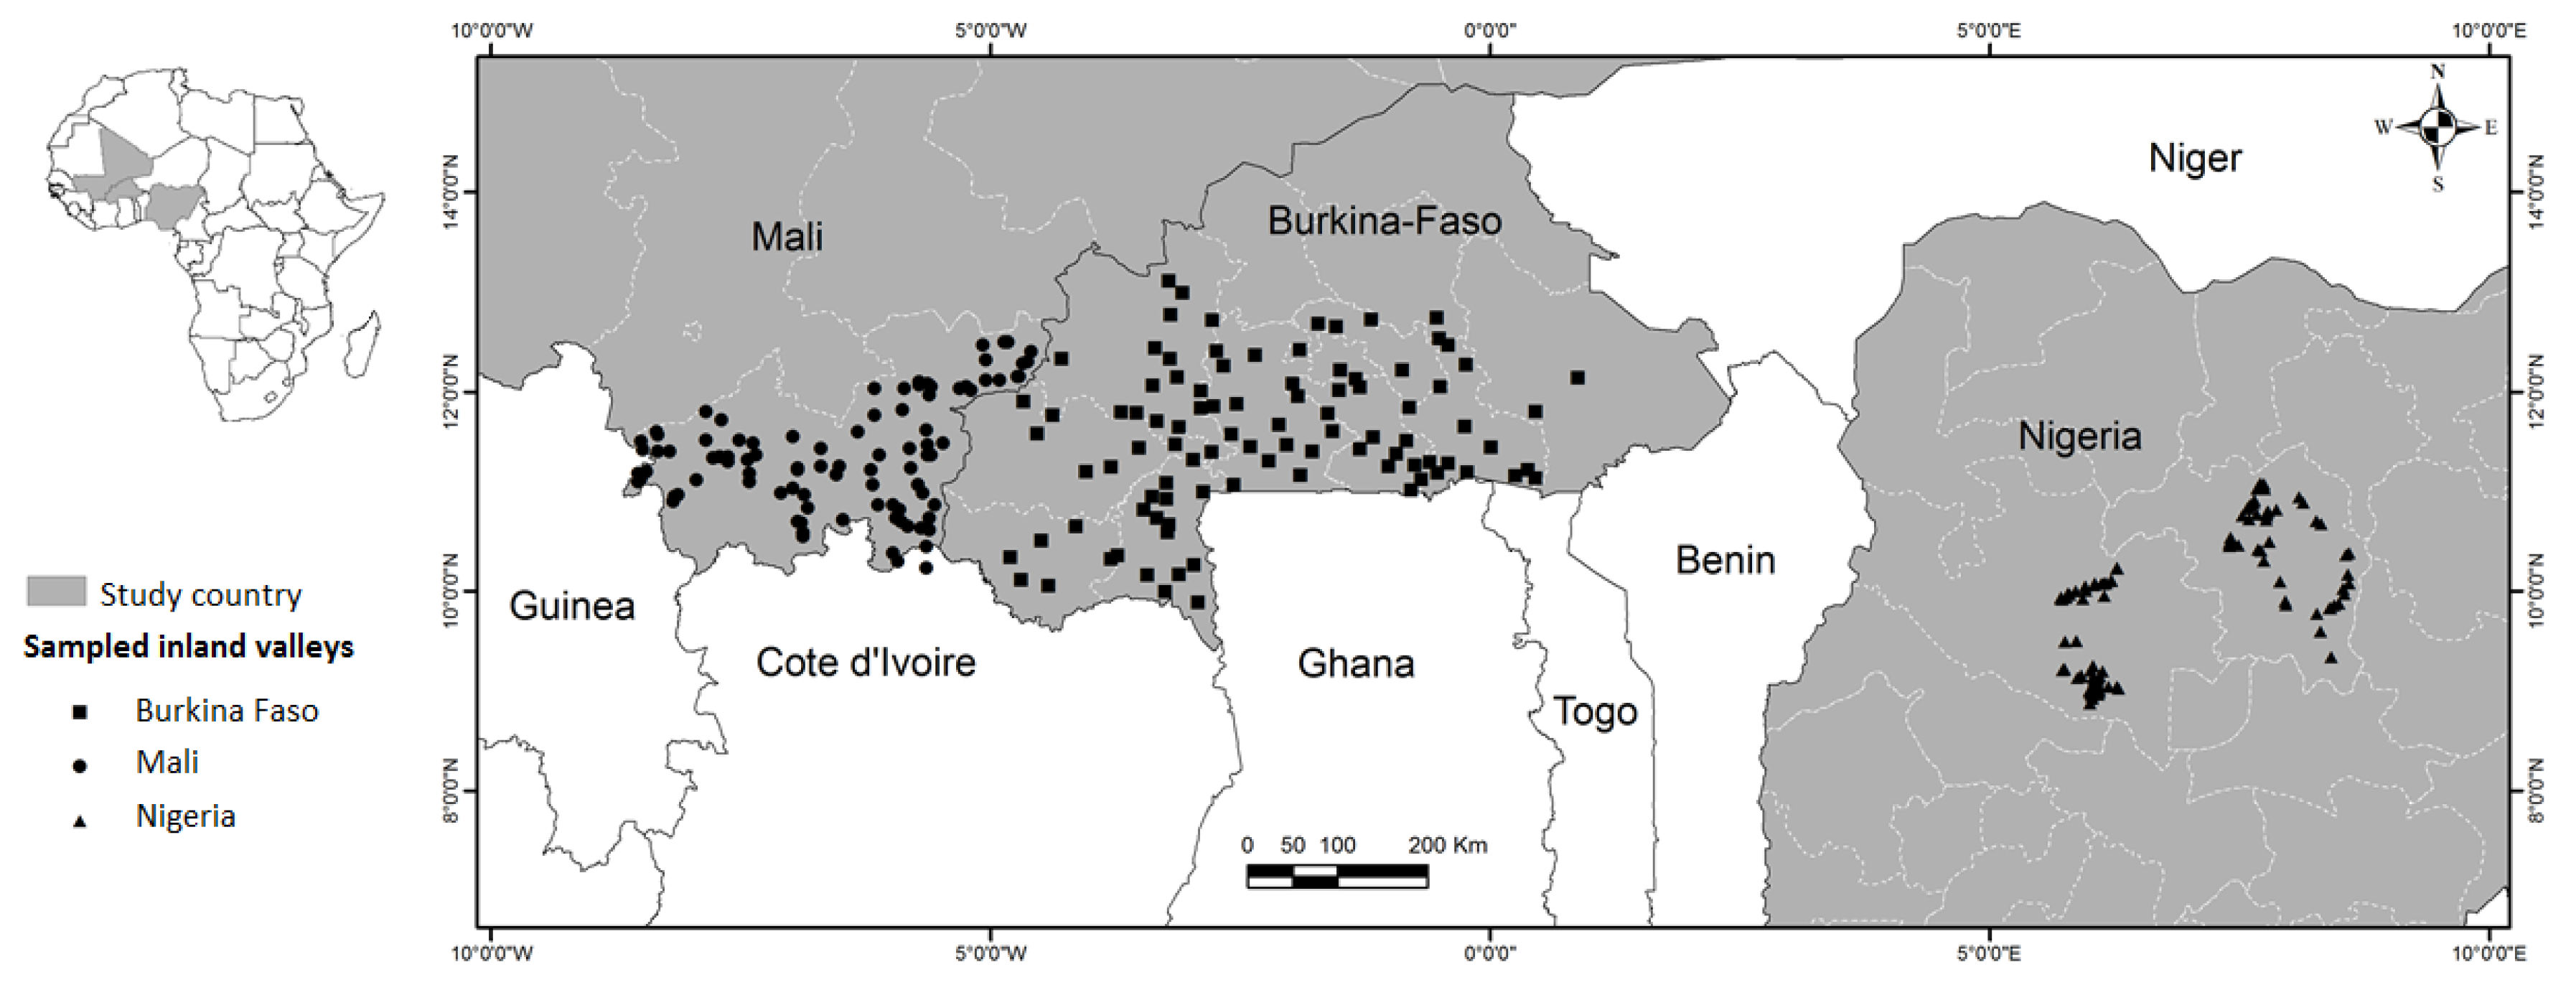
2.1. Study Zone

The study was conducted in 300 inland valleys in Nigeria, Burkina Faso and Mali (Figure 1). The period 1995–2014 was used for reporting average rainfall, temperature and evapotranspiration in the study area. In Nigeria, the study area covered the states of Kaduna and Niger which are located between 5°5′ E and 8°7′ E longitude and 8°5′ N and 11°5′ N latitude (Figure 1). These states are largely located in the Guinea Savanna agro-ecological zone. Average annual rainfall varies from 900 to 1300 mm and occurs mainly during the rainy season from May to October. Average annual potential evapotranspiration ranged from 2194 to 2822 mm year−1 and mean annual air temperatures vary between 26 and 30 °C. In Burkina Faso, the study area is located between 0°9′ E and 5°0′ W longitude and 9°5′ N and 13°5′ N latitude (Figure 1). This area is characterized by a sub-humid dry to semi-arid climate following the gradient South-North. Average annual rainfall varies between 700 and 1000 mm occurring during May to October. Average annual potential evapotranspiration ranges from 1600 to 2080 mm year−1 and average annual air temperatures vary from 28 to 30 °C [22]. In Mali, the study area covered the region of Sikasso which is located between 4°5′ W and 8°8′ W longitude and 10°1′ N and 12°8′ N latitude (Figure 1). The climate in this region is typical of the sudano-sahelian zone. Average annual rainfall varies between 900 and 1300 mm. The rainy season extends from May to October and the seasonal average air temperature is 29 °C. The average annual potential evapotranspiration amounts to approximately 2060 mm year−1. In the study area, crop production is unfeasible during the dry season (November–April) without irrigation [23].

2.2. Inland Valleys Surveys

Inland valleys surveys were conducted in February 2013 to select the study area and during the rainy season (May–October) of 2013 to locate the inland valleys and to collect data using questionnaires and informal interviews. Topographic maps and high resolution satellite imagery provided in Google Earth were used to identify inland valleys following the approach described by Reference [24]. Digital elevation maps and field surveys were used to obtain data on inland valleys morphology following the approach of Reference [25]. The surveyed inland valleys were delineated using a global positioning system device and mapped using ArcGIS 10.2 (Environmental Systems Research Institute).
Bio-physical and socio-economic characteristics of inland valleys as well as farmers’ experience with drought and mitigation measures were assessed based on questionnaires and informal interviews conducted in the farmers’ native languages. The information was collected from small groups of 5 to 20 farmers for each inland valley. In total, 41 variables (nominal, ordinal and numerical) were collected during the inland valleys surveys and were divided into six themes: farmers’ experience with drought, mitigation measures, management practices, physical characteristics, hydrology and socio-economic characteristics of inland valleys (Table 1).

2.3. Spatial Datasets

The spatial variables concerned soil’s physical properties (clay, silt, sand and organic carbon contents), flow accumulation, daily rainfall and minimum and maximum air temperature data. Soil properties in the first 30 cm of soil depth were obtained from the Africa Soil Information Service (AfSIS) project website [26]. High resolution (30 m) Shuttle Radar Topography Mission (SRTM) was used to derive flow accumulation. Flow accumulation represents the number of cells that flow into the downslope cell of the outlet of inland valley. Here, an inland valley was subdivided into grid-cells. Flow accumulation was calculated using the Flow Accumulation function in ArcGIS. Flow accumulation was used as a proxy for the volume of water that can be accumulated in inland valleys. Gridded daily rainfall and temperature data covering the period 1995–2014 obtained from the POWER database [27] were used to calculate the standardized precipitation evapotranspiration index (SPEI), a drought index which includes a comprehensive climatic water balance [28]. Detailed information on the calculation of the SPEI can be found in Reference [29]. Table 2 describes the categorization of dryness/wetness grade by the SPEI.

2.4. Data Analysis

Data analysis consisted of three steps. Firstly, drought trends, duration and frequency were analyzed using the standardized precipitation evapotranspiration index to assess the spatial variation of drought severity in the study area. Secondly, a binary tree-based machine-learning method, Random Forest (RF), was used to determine the predictors of drought occurrence in inland valleys rice-based production systems. Thirdly, the logistic regression model was applied to investigate the determinants of farmers’ commitment to mitigate the drought affecting rice production in their inland valleys.

2.4.1. Drought Trends, Duration and Frequency

Drought trends, duration and frequency in the study area were assessed following the procedures described by Reference [30]. The SPEI was calculated for a 12-month timescale for the analysis of drought trends and a 3-month time scale for the analysis of drought duration and frequency by using monthly precipitation and air temperature data from 1995 to 2014 in 300 inland valleys. The SPEI at 3-month and 12-month timescales were used to explore drought variation at inter-seasonal and inter-annual timescales, respectively. The non-parametric Mann-Kendall (MK) test was applied for the existence of a possible trend of annual dry conditions based on the calculated SPEI. Trends in annual precipitation, temperature and their relationships with trends in annual SPEI were examined afterwards. Since no serial correlation was identified in the temporal data series, the results of the Mann-Kendall test were judged to be sufficiently robust to depict possible trends in the annual dry conditions. Besides, the spatial variation of drought duration (longest period of consecutive months with SPEI <−1) and drought frequency (frequency of 3-month SPEI < −1) over the period 1995–2014 were examined.

2.4.2. Random Forest Analysis for Identification of Drought Predictors

Farmers’ experience of drought affecting rice production in the inland valley was the dependent variable. A binary tree-based machine-learning method, Random Forest [31], was used to select among 21 variables of the themes: physical characteristics, hydrological characteristics and management practices (Table 1), those of which can predict the occurrence of drought in an inland valley rice based-production system. Random Forest is known as a variable selection method based on the algorithmic approach which can be applied when many potential predictors exist with excellent predictive performance compared to other methods [32]. The principle of random forest (RF) is to randomly choose a subset of explanatory variables at each node after combining many binary decision trees built using several bootstrap samples. The first step of the method is the building of the tree with the random selection, and with replacement of a bootstrap sample of observations (called the “in-bag”). The set of observations which are not used for building the tree is referred to as ‘Out-Of-Bag’ data (OOB) which is used to estimate the prediction error. The second step involves the identification of important variables (m) highly related to the response variable. During the third step, a tree is built based on the in-bag data and m variables selected. This third step is repeated n times, to generate n tree bootstrap samples and trees.
Two important variables are needed for generating the RF model: the number of trees desired, (k), and the number of prediction variables (m) [33]. Breiman [31] suggested that the generalization error converges when increasing the number of trees desired. On the other hand, the model’s accuracy increases when reducing the number of prediction variables due to reduced correlation between trees. Therefore, optimizing the parameters k and m is required to minimize the error. In this study, the statistical program R [21] along with the package ‘randomForest’ with the following settings (k = 600, m = 5) was used. The number of trees was set at 600, identified as the threshold above which an increase in the number of trees brought no significant performance gain (Figure 2). The number of prediction variables was set at five, being the lowest value of m that achieved the highest performance gain (Figure 2). The importance of the contribution of each variable to the RF model was evaluated with the Mean Decreased Accuracy (MDA) and Gini index. The MDA of a variable indicates the number of observations that will be misclassified if the variable is removed from the model. The Gini index measures the average gain of purity by splits of a given variable. For both statistics (MDA and Gini index), a variable with a larger importance score relative to other variables indicates that the variable is important to the dependent variable. Rather than evaluate a relationship between potential predictors and the dependent variable, MDA and Gini index are robust statistics related to a variable importance in the RF’s simulation of the natural mechanism behind the data [33].

2.4.3. Logistic Regression for Assessing Determinants of Rice Farmers Commitment to Use Drought Mitigation Measures

The logistic model was applied to investigate the determinants of inland valley rice farmers’ commitment to use drought mitigation measures. Logistic regression is used when the dependent variable is dichotomous and the independent variables are of any type. Logistic regression applies the Maximum Likelihood Estimation (MLE) after transforming the dependent dichotomy variable (use of measures to mitigate drought) into a logit variable, that is [34]:
ln ( P 1 P ) = a + bX
where P is the probability of the event occurrence, X are independent variables, ln is the natural logarithm, and a and b are the parameters to be estimated by the model.
The logistic prediction equation is:
Y = b 0 + b 1 X 1 + b 2 X 2 + + b n X n
where b 0 is a constant term, X 1 , X 2 ,…, X n are independent variables likely to explain farmers’ commitment to mitigate drought, and b 1 , b 2 , …, b n are the coefficients to be estimated. The dependent variable (Y) was defined as a set of strategies with multiple modalities (Yi). Each modality represented a farmer’s adaptation decision and was considered as binary variable. Hence, for k adaptation decisions, the Equation (2) became:
{ Y 1 = b 1 + b i 1 X 1 + b i 2 X 2 + + b i n X n Y 2 = b 2 + b j 1 X 1 + b j 2 X 2 + + b j n X n . . . Y k = b k + b k 1 X 1 + b k 2 X 2 + +   b k n X n
For each adaptation decision, Yi = {1 if that adaptation decision is used by farmers and 0 otherwise}.
The generalized linear model (glm) function was used in R software to compute logistic regression.

3. Results

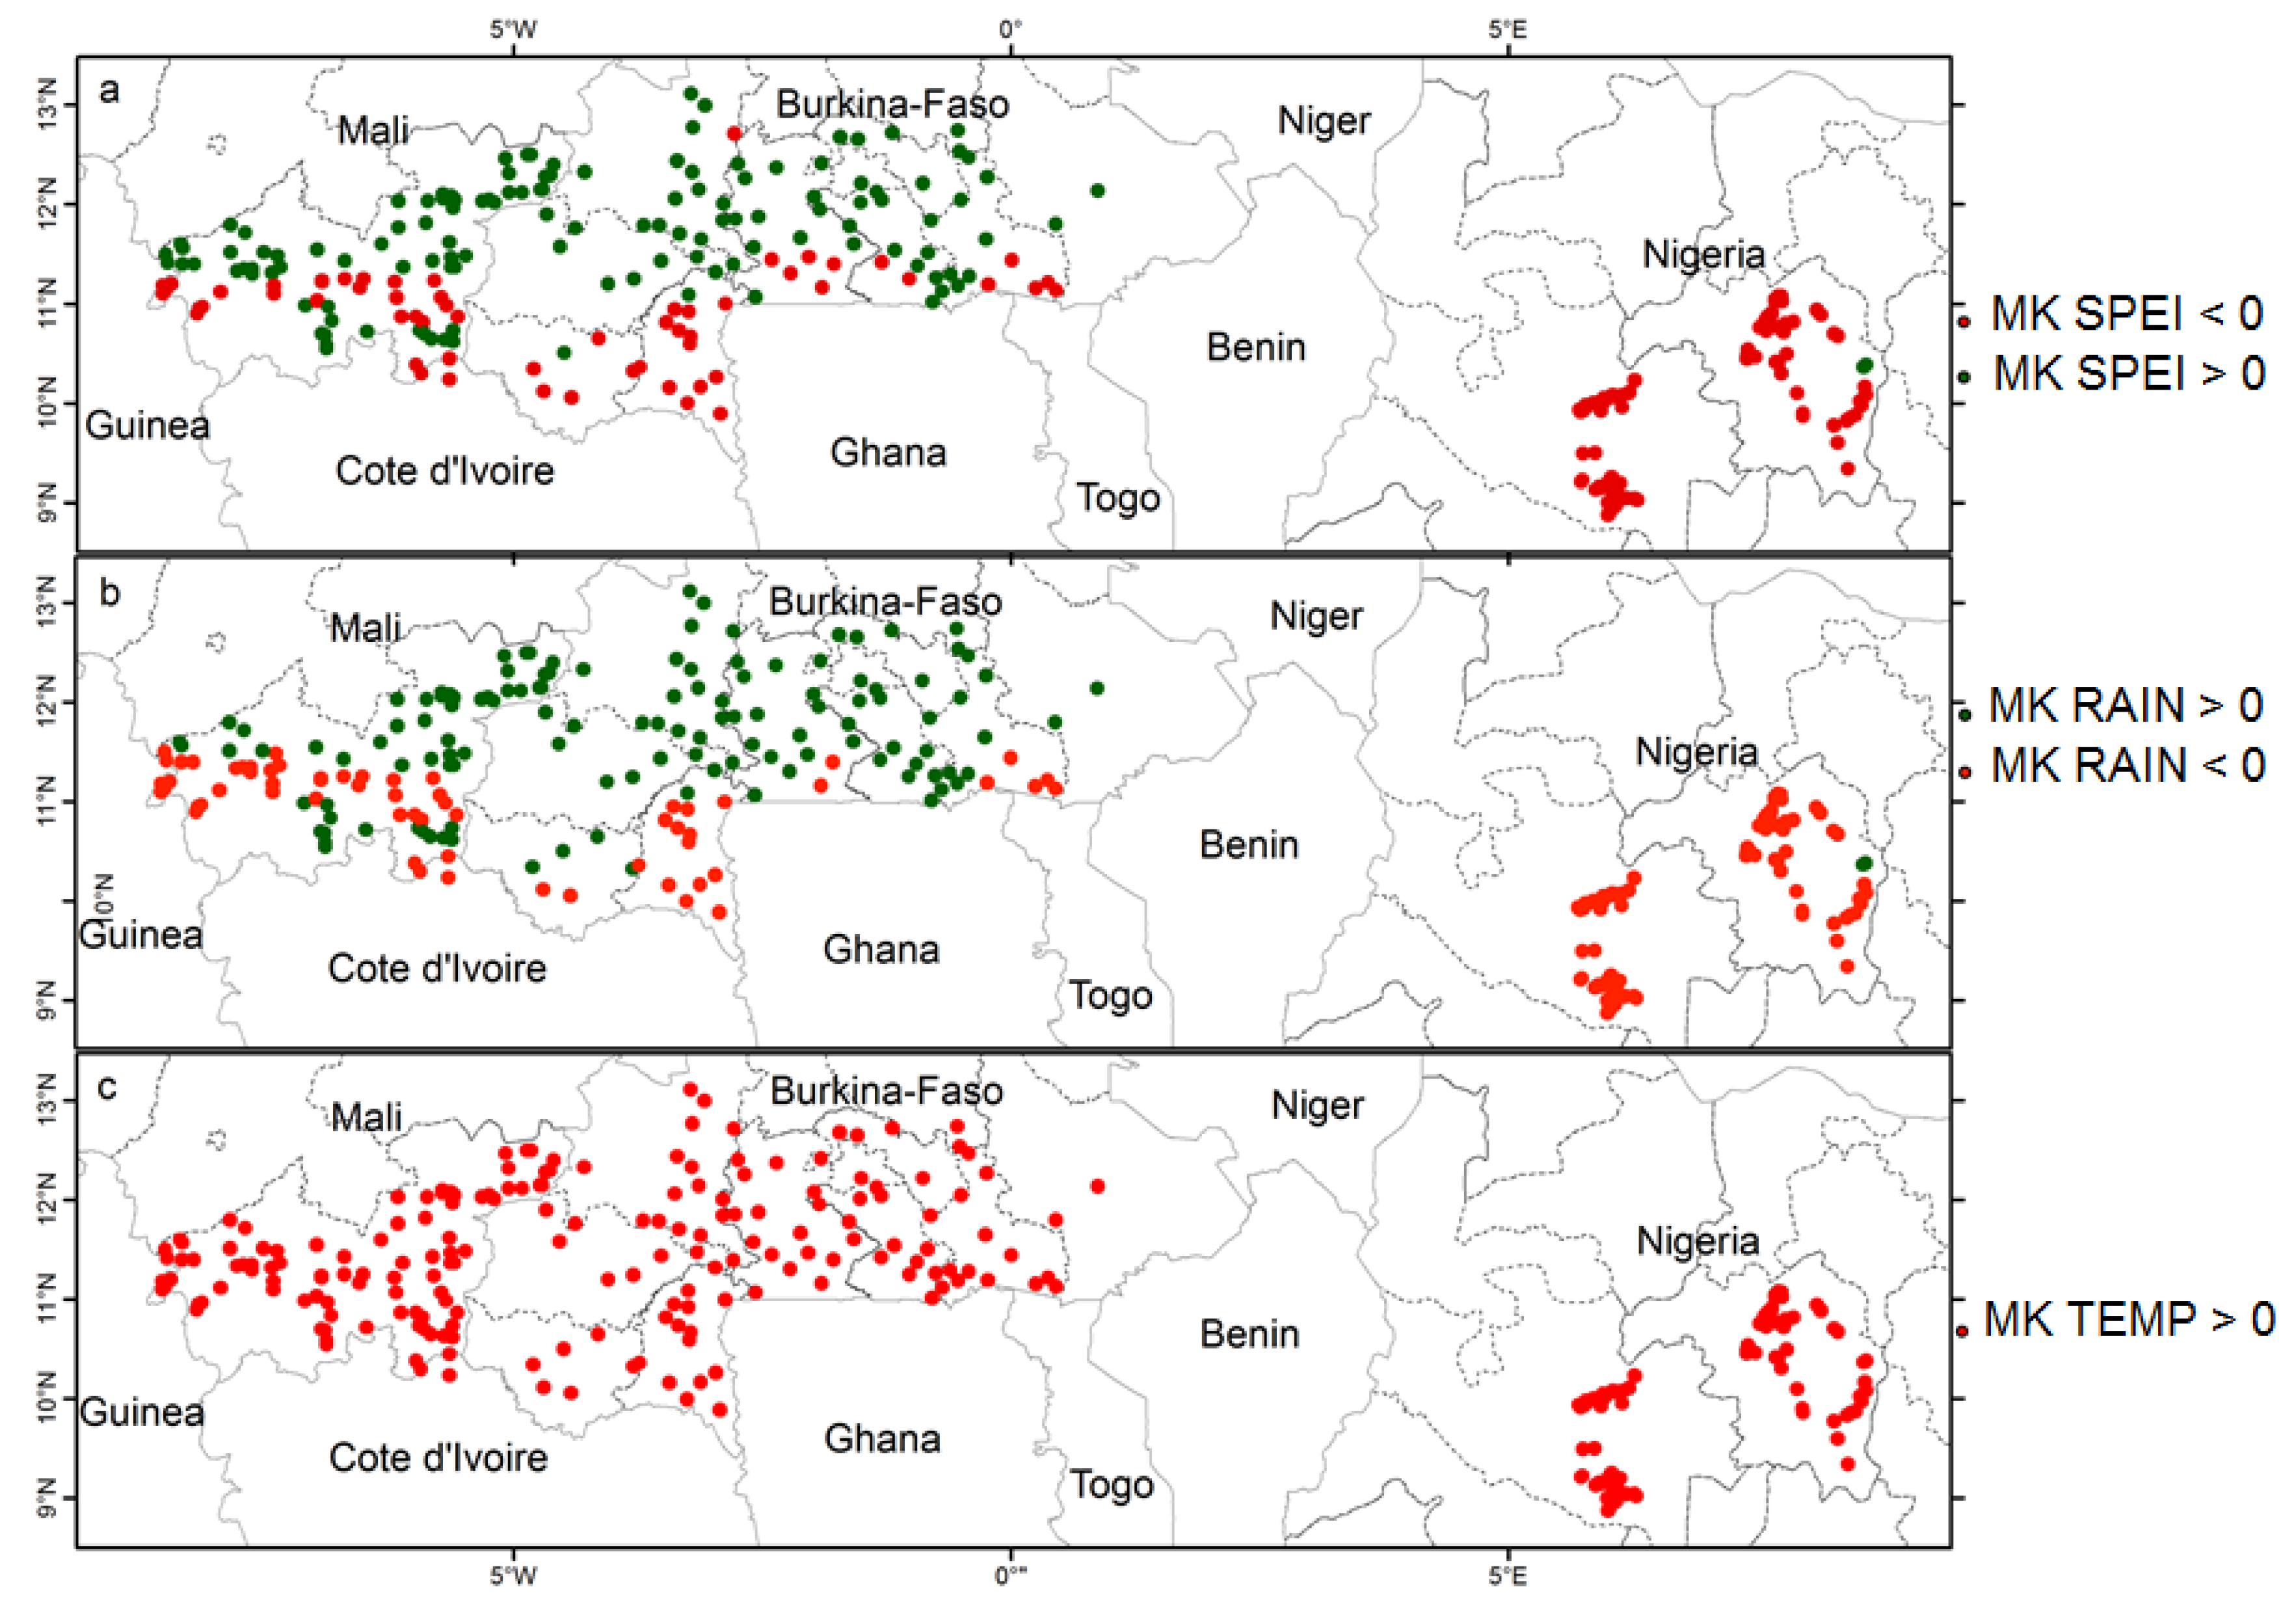
3.1. Spatial Variation of Drought Severity

Figure 3 presents the spatial distribution of the significant Mann-Kendall trend statistic at 90% confidence level for annual SPEI, precipitation and temperature. The annual SPEI and precipitation presented notable spatial variations patterns with a significant drying trend at latitude below 11°30′, whilst a significant upward wetting was discerned at latitude above 11°30′ (Figure 3). Conversely, the annual temperature presented a significant upward trend at all the investigated inland valleys. The annual SPEI and the annual precipitation both exhibited the most significant drying areas, which demonstrated that the drying trend discerned at a latitude below 11°30′ can be explained by the significant reduction in rainfall.
The longest duration and the highest frequency of drought were detected in Niger and Kaduna states and in western Burkina Faso with more than 4 months and 40%, respectively (Figure 4). This reveals that droughts were more severe in Niger and Kaduna states and western Burkina Faso during the period 1995–2014.

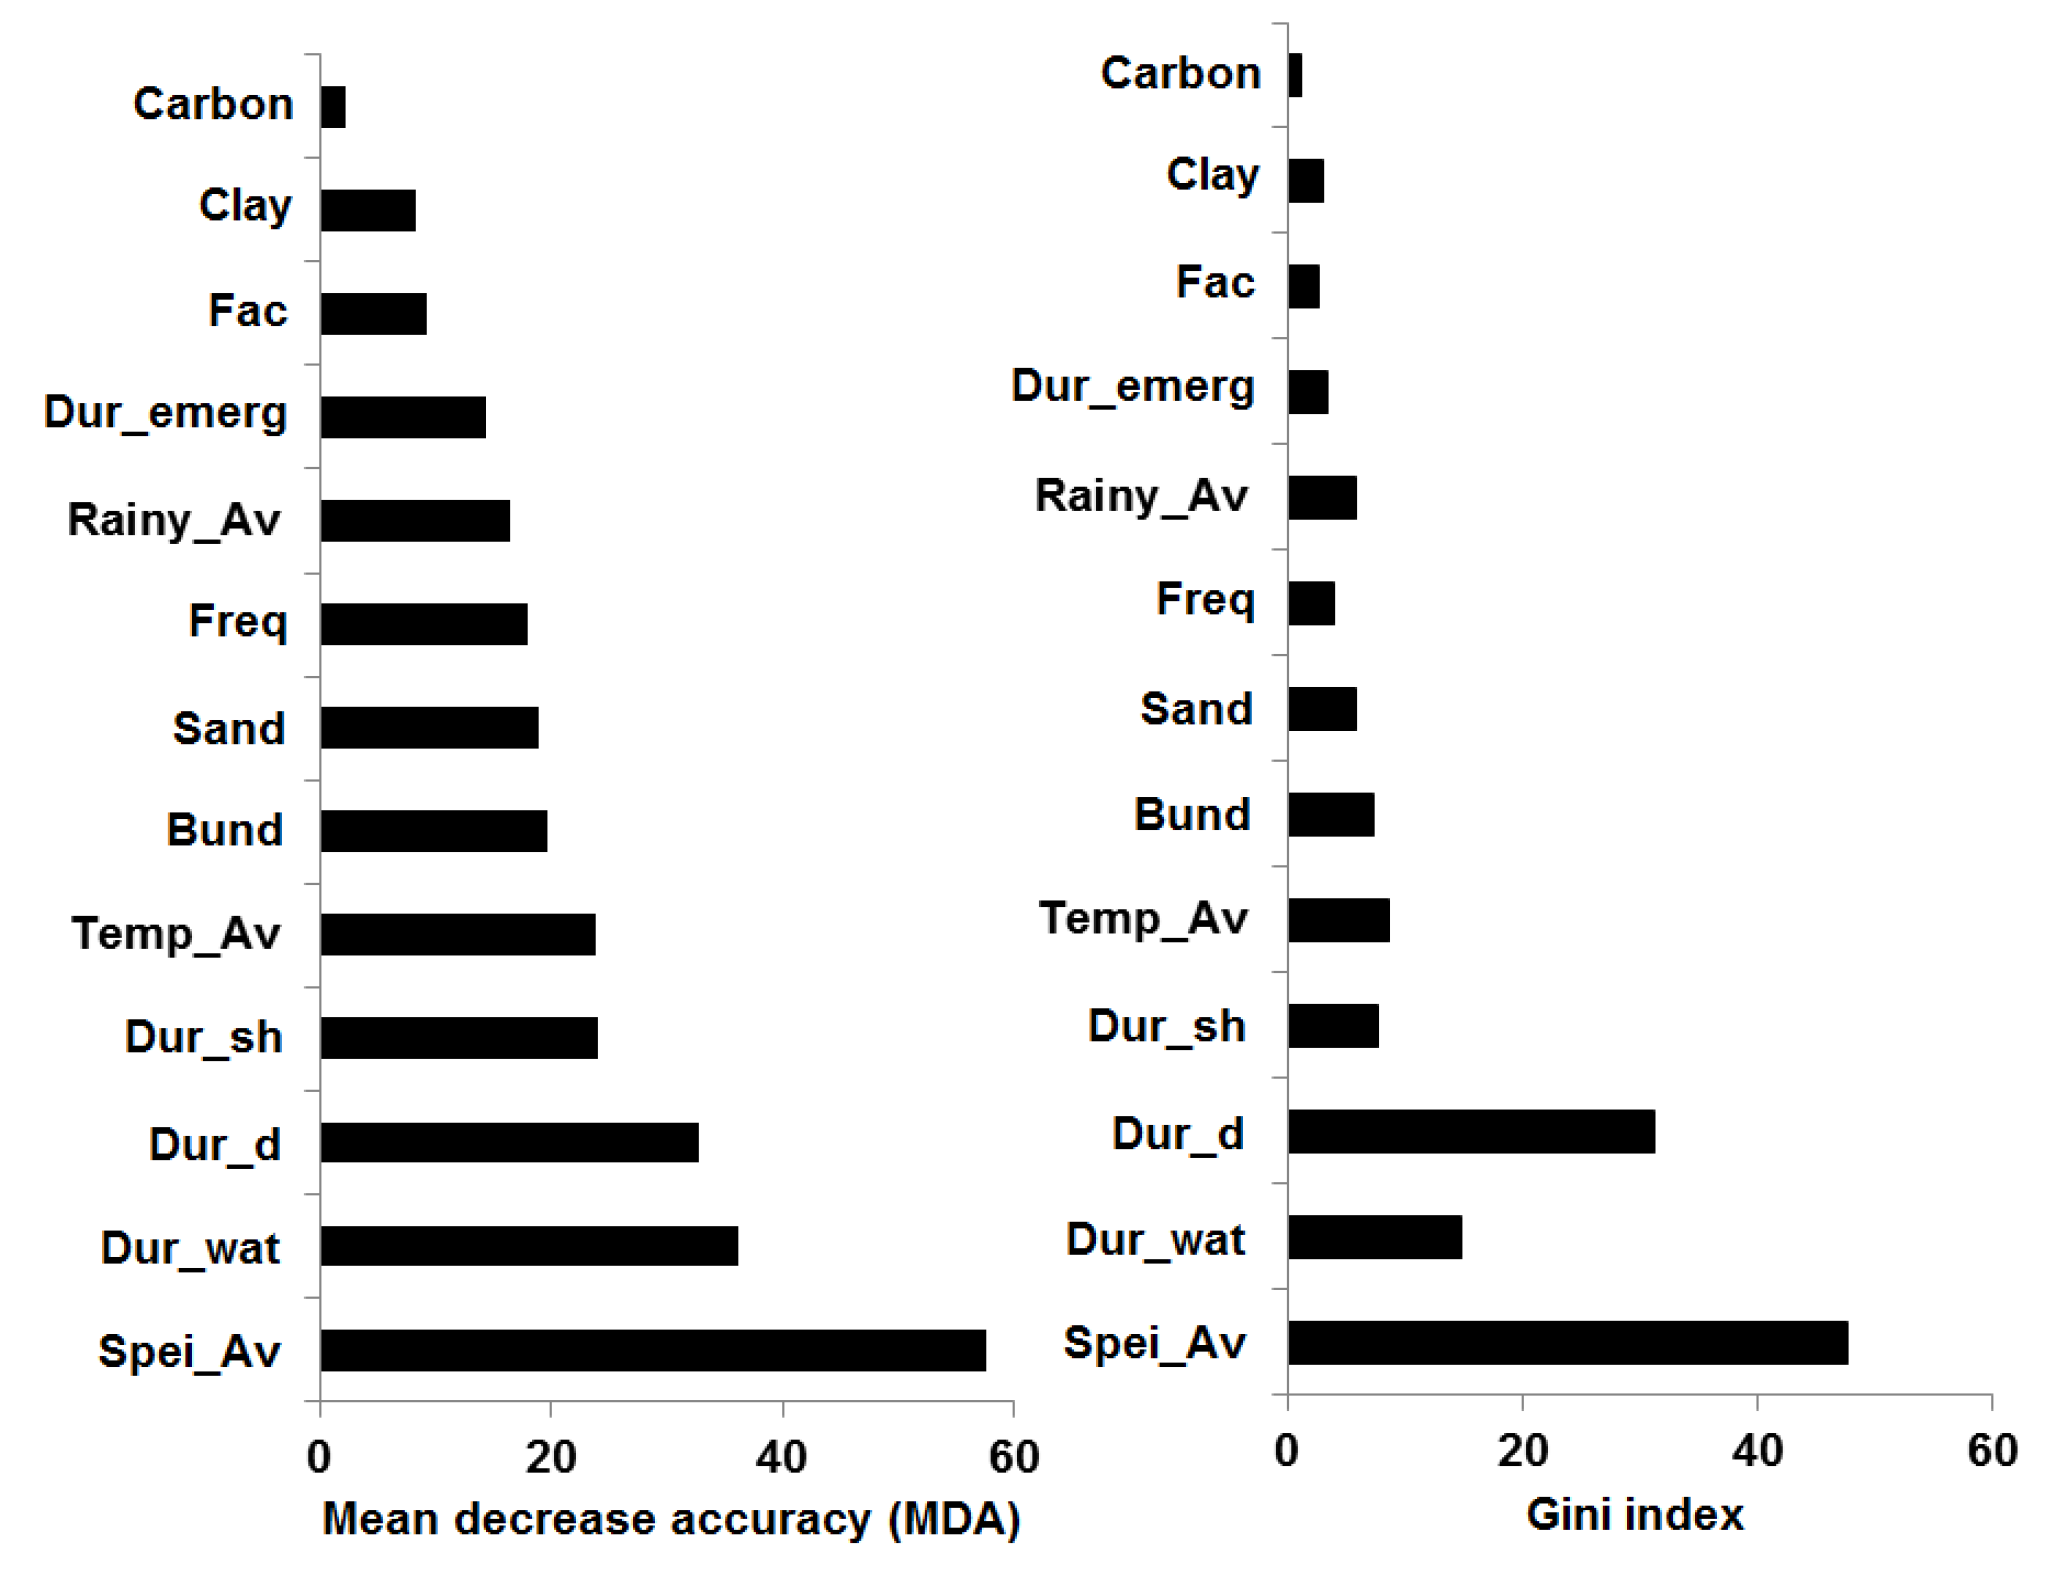
3.2. Predictors of Drought Occurrence in Inland Valley Rice-Based Production System

The variables with higher contribution to the RF model were average annual SPEI, duration of water flow, duration of dry period, duration of groundwater and average annual temperature (Figure 5).
Figure 6 displays the importance of the contribution of each variable to the RF model accuracy of the specific country. The same behavior regarding the overall contribution was detected except for the variable ‘bund’ in Burkina Faso.
The classification tree of the RF model partitioned the sample of inland valleys into seven clusters groups (Table 3). Drought-prone inland valleys were predominant in clusters 3, 6 and 7 while inland valleys not affected by drought were predominant in clusters 1, 2, 4 and 5. The key variables that significantly differentiated the clusters groups 3, 6 and 7 on one hand and the clusters groups 1, 2, 4 and 5 on the other hand were average annual SPEI and duration of groundwater (Table 3). Drought-prone inland valleys were characterized by average annual SPEI lower than −0.02 and duration of groundwater shorter than 15 weeks.

3.3. Drought Mitigation Measures in Inland Valleys Rice-Based Production System

Three groups of measures were used by farmers to mitigate drought affecting inland valleys rice fields. These embraced crop diversification, farming practices and land use measures. Mitigation through crop diversification comprises the use of different crops, drought resistant and short duration varieties. Mitigation through farming practices included micro-level irrigation, change in sowing method, double sowing, change in planting dates, change in the doses of fertilizers and construction of bunds around rice fields. Mitigation through land use included crops transfer from one production site to another site and agroforestry.
The results of the multi logistic models indicated that land ownership and percentage of women determined farmers’ commitment to use any mitigation measure against drought (Table 4). Role of rice farming in the production system and affiliation with farmers’ organization determined the farmers’ commitment to use crop diversification to mitigate drought. Mitigation through farming practices was dependent on the source of seeds, origin of inland valley users and affiliation with farmers organization. Distance to the main road, role of rice in the production system and source of seeds were the main factors affecting farmers commitment to use land use measures to mitigate drought (Table 4).

4. Discussion

We used both biophysical and socio-economic data, farmers’ community surveys and secondary data from remote sensing on soil characteristics, and water demand to identify the determinants of drought and the factors affecting farmers’ mitigation measures in inland valley rice-based production systems in the Sudan-Sahel Zone. Overall, average annual SPEI was one of the most important predictors, suggesting that increase in evapotranspiration coupled with precipitation deficit determined drought occurrence in inland valleys rice fields. These results concur well with References [35,36] who applied regression tree and correlation approaches to link drought occurrence in agricultural fields with SPEI.
The annual SPEI and rainfall presented remarkable similar patterns with an increase into wetter conditions above the latitude 11°30′ while a decrease into drier conditions was observed below the latitude 11°30′ (Figure 1), suggesting a rewetting of the northern (Sahelian) part of the study area. Rewetting of the Sahel was also detected by Reference [37] who argued that the increase in sea surface temperature enhances local evaporation and the moisture content of the lower troposphere. This additional moisture is advected southward across the eastern Sahara by the mean flow, leading to enhanced low-level moisture convergence over the Sahel, which feeds enhanced rainfall. According to Reference [38], the variation in sea surface temperature is mostly determined by the phase of the Atlantic Multidecadal Oscillation (AMO) which is a large-scale pattern of variability connected to the oceanic meridional overturning circulation [39]. The current increase in the Sahel rainfall was explained by the change to a positive phase of the AMO due to a northward displacement of the Inter Tropical Convergence Zone while the Sahel drought in the 1980s was attributed to the change to a negative phase of the AMO [38].
In addition to the average annual SPEI, drought occurrence in inland valleys rice-based production systems was determined by the duration of groundwater availability. Soils had limited effects on differences in drought occurrence between the inland valley rice fields. Such a result was unexpected since previous studies defined drought prone environments based on soil water holding capacity [16]. However, a low soil water holding capacity cannot be considered as a limiting factor in humid climates or in areas with high groundwater levels. This was particularly the case for the sample of inland valleys used in this study which was characterized by sandy clay loamy texture, low organic carbon content and low water holding capacity, but exhibiting different susceptibilities to drought as a function of climatic water balance and duration of groundwater availability. Therefore, drought studies in inland valleys without climatic water balance and groundwater data may have very limited value.
The three most important predictors for the occurrence of drought in inland valleys rice-based production systems were: average annual SPEI, duration of emerging water table and duration of dry period in Burkina Faso; average annual SPEI, duration of dry period and frequency of dry period in Mali; and duration of dry period, duration of surface water flow and average annual SPEI in Nigeria. Across the three countries, average annual SPEI and the duration of the dry period were among the three most relevant predictors for drought occurrence in inland valleys rice-based production systems. Duration of emerging water table was highly important for inland valleys specifically located in Burkina Faso. This could be attributed to spatial variability in inland valleys hydrogeology which translated into variation in water table dynamics. Future studies should investigate the influence of inland valleys hydrogeology on agricultural drought. In the states of Niger and Kaduna in Nigeria, duration of surface water flow was a relevant predictor for drought occurrence in inland valleys rice-based production systems. A longer duration of surface water flow is often associated with a better opportunity for farmers to irrigate rice plants, thereby mitigating drought effects on rice production similar to the findings of Reference [40] in northern Benin.
Numerous mitigation measures were used by farmers against drought in inland valley rice–based production systems. They encompassed crops diversification, farming practices and land use measures. Land ownership and the gender of farmers influenced farmers’ commitment to use any mitigation measure against drought (Table 4). Farmers were not willing to implement any measure when their land was not secure or when they did not have full rights on the aforesaid land. Likewise, following Reference [41], when property rights are not secure, there is a probability of expropriation which acts as a disincentive to invest. Indeed, a farmer is more motivated to invest when he inherits or purchases the land. However, he is less willing to invest in the land when he knows that the land can be sold. Therefore, policies to secure property rights could promote farmers’ investment in labour, input and other resources to mitigate drought and sustain productivity. Women were more likely to use mitigation measures against drought than men. This could be explained by the fact that in the study area, men were more interested in investing in cash crops such as cocoa, cotton and sesame than in rice [42]. Women lacked land and capital to invest in cash crops [43] and focused on rice production to improve the livelihood of their households. Recognizing the greater ability of women to mitigate drought in inland valleys rice-based production systems than their male counterparts could be particularly important in focusing on women’s association for advancing drought mitigation measures.

5. Conclusions

This study combined biophysical and socio-economic data, farmers’ community surveys and secondary data from remote sensing on soil characteristics and water demand to examine the predictors for the occurrence of droughts in inland valley rice-based production systems and enabling factors for small scale farmers to mitigate its effects in three West African countries located in the Sudan-Sahel zone, viz. Nigeria, Burkina-Faso and Mali. Average annual standardized precipitation evapotranspiration index and duration of groundwater availability were the most important predictors for drought occurrence in inland valleys rice-based production systems. Land ownership and gender influenced the commitment of rice farmers to use any mitigation measure against drought. Drought studies in inland valleys should include climatic water balance and groundwater data. Policies that secure property rights and focus on women’s association would strengthen farmers’ resilience and advance drought mitigation measures. Since high-resolution soil datasets were not available, differences in soil properties between inland valleys might have not been properly captured in this study. Future research may investigate the influence of different soil databases on modelling of drought occurrence in inland valleys rice-based production systems.

Supplementary Materials

The following are available online at https://www.mdpi.com/2071-1050/11/1/79/s1, Figure S1: Coordinates of inland valleys, Figure S2: Database for number of trees and random split variables, Figure S3 Man Kendall trend statistics, Figure S4 Drought duration and frequency, Figure S5 Mean Decrease in Accuracy and Gini Index, Figure S6 Variable contribution in Burkina-Faso, Mali and Nigeria, Table S1: Themes and variables, Table S3: Inland valleys characteristics, Table S4: Mitigation measures to drought. All data used in this study have been made publicly available by [44].

Author Contributions

Conceptualization, E.R.D.-Y. and S.J.Z.; Methodology, E.R.D.-Y. and S.J.Z.; Software, E.R.D.-Y.; Validation, E.R.D.-Y., S.J.Z., A.K., I.O. and O.B.; Formal analysis, E.R.D.-Y. and S.J.Z.; Investigation, A.K., I.O., O.B.; Resources, S.J.Z.; Data curation, E.R.D.-Y.; Writing—original draft preparation, E.D.; Writing—review and editing, E.R.D.-Y., S.J.Z., A.K., I.O. and O.B.; Visualization, E.R.D.-Y. and S.J.Z.; Supervision, S.J.Z.; Project administration, S.J.Z.; Funding acquisition, S.J.Z.

Funding

This research was funded by the Global Challenge Programs, grant number G7010.04.01 and the open access publication of the manuscript was funded by the CGIAR Big Data Platform in Agriculture project.

Acknowledgments

The authors are grateful to field staff of the Institute of Rural Economy of Mali, the National Institute for the Environment and Agricultural Research of Burkina Faso and the National Crops Research Institute of Nigeria involved in the field surveys.

Conflicts of Interest

The authors declare no conflict of interest. The funders had no role in the design of the study; in the collection, analyses, or interpretation of data; in the writing of the manuscript, or in the decision to publish the results.

References

  1. Diagne, A.; Amovin-Assagba, E.; Futakuchi, K.; Wopereis, M.C.S. Estimation of cultivated area, number of farming households and yield for major rice-growing environments in Africa. In Realizing Africa’s Rice Promise; Wopereis, M., Jonhson, D., Ahmadi, N., Tollens, E., Jalloh, A., Eds.; 2013; pp. 35–45. ISBN 978-1-84593-812-3. [Google Scholar]
  2. Seck, P.A.; Touré, A.; Coulibaly, J.Y.; Diagne, A.; Wopereis, M.C.S. Africa’ s Rice Economy Before and After the 2008 Rice Crisis. In Realizing Africa’s Rice Promise; Wopereis, M., Jonhson, D., Ahmadi, N., Tollens, E., Jalloh, A., Eds.; CAB International: Wallingford, UK, 2013; pp. 24–34. [Google Scholar]
  3. Index-Mundi 2016. Available online: http://www.indexmundi.com (accessed on 15 November 2016).
  4. Serraj, R.; McNally, K.L.; Slamet-Loedin, I.; Kohli, A.; Haefele, S.M.; Atlin, G.; Kumar, A. Drought Resistance Improvement in Rice: An Integrated Genetic and Resource Management Strategy. Plant Prod. Sci. 2011, 14, 1–14. [Google Scholar] [CrossRef] [Green Version]
  5. Balasubramanian, V.; Sie, M.; Hijmans, R.J.; Otsuka, K. Increasing rice productivity in sub-Saharan Africa: challenges and opportunities. Adv. Agron. 2007, 94, 55–133. [Google Scholar] [CrossRef]
  6. Thornton, P.K.; Jones, P.G.; Ericksen, P.J.; Challinor, A.J. Agriculture and food systems in sub-Saharan Africa in a 4 °C+ world. Philos. Trans. R. Soc. A: Math. Phys. Eng. Sci. 2011, 369, 117–136. [Google Scholar] [CrossRef] [PubMed]
  7. Delaney, S.; Livingston, G.; Schonberger, S. Right place, right time: Increasing the effectiveness of agricultural development support in sub-Saharan Africa. South African J. Int. Aff. 2011, 18, 341–356. [Google Scholar] [CrossRef]
  8. Niang, A.; Becker, M.; Ewert, F.; Dieng, I.; Gaiser, T.; Tanaka, A.; Senthilkumar, K.; Rodenburg, J.; Johnson, J.M.; Akakpo, C.; et al. Variability and determinants of yields in rice production systems of West Africa. F. Crop. Res. 2017, 207, 1–12. [Google Scholar] [CrossRef]
  9. Dossou-Yovo, E.R.; Brüggemann, N.; Ampofo, E.; Igue, A.M.; Jesse, N.; Huat, J.; Agbossou, E.K. Combining no-tillage, rice straw mulch and nitrogen fertilizer application to increase the soil carbon balance of upland rice field in northern Benin. Soil Tillage Res. 2016, 163, 152–159. [Google Scholar] [CrossRef]
  10. Dai, A.; Trenberth, K.E.; Qian, T. A Global Dataset of Palmer Drought Severity Index for 1870–2002: Relationship with Soil Moisture and Effects of Surface Warming. J. Hydrometeorol. 2004, 5, 1117–1130. [Google Scholar] [CrossRef] [Green Version]
  11. Stocker, T.F.; Qin, D.; Plattner, G.-K.; Tignor, M.; Allen, S.K.; Boschung, J.; Nauels, A.; Xia, Y.; Bex, V.M.P. (Eds.) IPCC Technical Summary. In Climate Change 2013: The Physical Science Basis. Contribution of Working Group I to the Fifth Assessment Report of the Intergovernmental Panel on Climate Change; Cambridge University Press: Cambridge, UK, 2013; pp. 33–115. ISBN 9781107661820. [Google Scholar]
  12. Haefele, S.M.; Nelson, A.; Hijmans, R.J. Soil quality and constraints in global rice production. Geoderma 2014, 235–236, 250–259. [Google Scholar] [CrossRef]
  13. Van Loon, A.F.; Laaha, G. Hydrological drought severity explained by climate and catchment characteristics. J. Hydrol. 2015, 526, 3–14. [Google Scholar] [CrossRef]
  14. Kiepe, P. Characterization of three key environments for integrated irrigation–aquaculture and their local names. In Integrated Irrigation and Aquaculture in West Africa: Concepts, Practices and Potential; Halwart, M., van Dam, A., Eds.; Food and Agriculture Organization of the United Nations: Rome, Italy, 2006; pp. 1–5. [Google Scholar]
  15. Rodenburg, J.; Zwart, S.J.; Kiepe, P.; Narteh, L.T.; Dogbe, W.; Wopereis, M.C.S. Sustainable rice production in African inland valleys: Seizing regional potentials through local approaches. Agric. Syst. 2014, 123, 1–11. [Google Scholar] [CrossRef]
  16. Haefele, S.M.; Bouman, B.A.M. Drought-prone rainfed lowland rice in Asia: limitations and management options. Drought Front. Rice 2009, 211–232. [Google Scholar] [CrossRef]
  17. Ward, P.S.; Makhija, S. New modalities for managing drought risk in rainfed agriculture: Evidence from a discrete choice experiment in Odisha, India. World Dev. 2018, 107, 163–175. [Google Scholar] [CrossRef] [PubMed]
  18. Djagba, J.F.; Rodenburg, J.; Zwart, S.J.; Houndagba, C.J.; Kiepe, P. Failure and success factors of irrigation systems developments: A case study from the Oueme and Zou valleys in Benin. Irrig. Drain. 2014, 63, 328–339. [Google Scholar] [CrossRef]
  19. Haefele, S.; Mussgnug, F.; Saito, K.; Nelson, A.; N’Diaye, K.; Wopereis, M. Increasing rice productivity through improved nutrient use in Africa. In Realizing Africa’s Rice Promise; Wopereis, M., Jonhson, D., Ahmadi, N., Tollens, E., Jalloh, A., Eds.; CAB International: Wallingford, UK, 2013; pp. 250–264. ISBN 1845938127. [Google Scholar]
  20. Van Oort, P.A.J. Mapping abiotic stresses for rice in Africa: Drought, cold, iron toxicity, salinity and sodicity. F. Crop. Res. 2018, 219, 55–75. [Google Scholar] [CrossRef] [PubMed] [Green Version]
  21. R Development Core Team R. A Language and Environment for Statistical Computing. R Foundation for Statistical Computing: Vienna, Austria, 2011; Available online: www.R-project.org/ (accessed on 19 December 2016).
  22. Hermann, S.; Welsch, M.; Segerstrom, R.E.; Howells, M.I.; Young, C.; Alfstad, T.; Rogner, H.H.; Steduto, P. Climate, land, energy and water (CLEW) interlinkages in Burkina Faso: An analysis of agricultural intensification and bioenergy production. Nat. Resour. Forum 2012, 36, 245–262. [Google Scholar] [CrossRef]
  23. Baudron, A.R.; Needle, C.L.; Rijnsdorp, A.D.; Tara Marshall, C. Warming temperatures and smaller body sizes: synchronous changes in growth of North Sea fishes. Glob. Chang. Biol. 2014, 20, 1023–1031. [Google Scholar] [CrossRef] [PubMed] [Green Version]
  24. Dossou-Yovo, E.R.; Baggie, I.; Djagba, J.F.; Zwart, S.J. Diversity of inland valleys and opportunities for agricultural development in Sierra Leone. PLoS ONE 2017, 12, e0180059. [Google Scholar] [CrossRef] [PubMed]
  25. Windmeijer, P.; Andriesse, W. Inland Valleys in West Africa: An Agro-ecological Characterization of Rice Growing Environments; International Institute for Land Reclamation and Improvement: Wageningen, The Netherlands, 1993. [Google Scholar]
  26. Hengl, T.; De Jesus, J.M.; Heuvelink, G.B.M.; Gonzalez, M.R.; Kilibarda, M.; Blagotić, A.; Shangguan, W.; Wright, M.N.; Geng, X.; Bauer-Marschallinger, B.; et al. SoilGrids250m: Global gridded soil information based on machine learning. PLoS ONE 2017, 12, 1–40. [Google Scholar] [CrossRef] [PubMed]
  27. Stackhouse, P. Prediction of Worldwide Energy Resources. Available online: http://power.larc.nasa.gov (accessed on 18 November 2016).
  28. Beguería, S. Standardized precipitation evapotranspiration index (SPEI) revisited: parameter fitting, evapotranspiration models, tools, datasets and drought monitoring. Int. J. Climatol. 2014, 3023, 3001–3023. [Google Scholar] [CrossRef]
  29. Vicente-Serrano, S.M.; Beguería, S.; López-Moreno, J.I. A multiscalar drought index sensitive to global warming: The standardized precipitation evapotranspiration index. J. Clim. 2010, 23, 1696–1718. [Google Scholar] [CrossRef]
  30. Yu, M.; Li, Q.; Hayes, M.J.; Svoboda, M.D.; Heim, R.R. Are droughts becoming more frequent or severe in China based on the standardized precipitation evapotranspiration index: 1951–2010? Int. J. Climatol. 2014, 34, 545–558. [Google Scholar] [CrossRef]
  31. Breiman, L. Random forests. Mach. Learn. 2001, 45, 5–32. [Google Scholar] [CrossRef]
  32. Prasad, A.M.; Iverson, L.R.; Liaw, A. Newer classification and regression tree techniques: Bagging and random forests for ecological prediction. Ecosystems 2006, 9, 181–199. [Google Scholar] [CrossRef]
  33. Rodriguez-Galiano, V.F.; Ghimire, B.; Rogan, J.; Chica-Olmo, M.; Rigol-Sanchez, J.P. An assessment of the effectiveness of a random forest classifier for land-cover classification. ISPRS J. Photogramm. Remote Sens. 2012, 67, 93–104. [Google Scholar] [CrossRef]
  34. Garson, G.D. Fundamentals of Hierarchical Linear and Multilevel Modeling; Sage Publications, Inc.: Thousand Oaks, CA, USA, 2012; ISBN 1412998859. [Google Scholar]
  35. Bachmair, S.; Kohn, I.; Stahl, K. Exploring the link between drought indicators and impacts. Nat. Hazards Earth Syst. Sci. 2015, 15, 1381–1397. [Google Scholar] [CrossRef] [Green Version]
  36. Stagge, J.H.; Kohn, I.; Tallaksen, L.M.; Stahl, K. Modeling drought impact occurrence based on meteorological drought indices in Europe. J. Hydrol. 2015, 530, 37–50. [Google Scholar] [CrossRef]
  37. Olsson, L.; Eklundh, L.; Ardö, J. A recent greening of the Sahel—Trends, patterns and potential causes. J. Arid Environ. 2005, 63, 556–566. [Google Scholar] [CrossRef]
  38. Mohino, E.; Janicot, S.; Bader, J. Sahel rainfall and decadal to multi-decadal sea surface temperature variability. Clim. Dyn. 2011, 37, 419–440. [Google Scholar] [CrossRef]
  39. Knight, J.R.; Folland, C.K.; Scaife, A.A. Climate impacts of the Atlantic multidecadal oscillation. Geophys. Res. Lett. 2006, 33, 1–4. [Google Scholar] [CrossRef]
  40. Djagba, J.F.; Sintondji, L.O.; Kouyaté, A.M.; Baggie, I.; Agbahungba, G.; Hamadoun, A.; Zwart, S.J. Predictors determining the potential of inland valleys for rice production development in West Africa. Appl. Geogr. 2018, 96, 86–97. [Google Scholar] [CrossRef]
  41. Yegbemey, R.N.; Yabi, J.A.; Tovignan, S.D.; Gantoli, G.; Haroll Kokoye, S.E. Farmers’ decisions to adapt to climate change under various property rights: A case study of maize farming in northern Benin (West Africa). Land Use Policy 2013, 34, 168–175. [Google Scholar] [CrossRef]
  42. Fenske, J. Land tenure and investment incentives: Evidence from West Africa. J. Dev. Econ. 2011, 95, 137–156. [Google Scholar] [CrossRef]
  43. Villamor, G.B.; Van Noordwijk, M.; Djanibekov, U.; Chiong-Javier, M.E.; Catacutan, D. Gender differences in land-use decisions: Shaping multifunctional landscapes? Curr. Opin. Environ. Sustain. 2014, 6, 128–133. [Google Scholar] [CrossRef]
  44. Dossou-Yovo, E.R.; Kouyaté, A.M.; Sawadogo, T.; Ouédraogo, I.; Bakare, O.S.; Zwart, S.J. A geospatial database of drought occurrence in inland valleys in Mali, Burkina Faso and Nigeria. Data Br. 2018, 19, 2008–2014. [Google Scholar] [CrossRef] [PubMed]
Figure 1. Location of the investigated inland valleys in Nigeria, Burkina Faso and Mali (see Figure S1).
Sustainability 11 00079 g001
Figure 2. Effects of number of trees (k) and random split variables (m) on Out-Of-Bag (OOB) error (see Figure S2).
Sustainability 11 00079 g002
Figure 3. Trend variations of (a) annual SPEI, (b) annual rainfall and (c) annual temperature in the study area (see Figure S3).
Sustainability 11 00079 g003
Figure 4. Spatial distribution of (a) drought duration and (b) drought frequency in the study area during the period 1995–2014 (see Figure S4).
Sustainability 11 00079 g004
Figure 5. Variable importance contribution in terms of Mean Decrease in Accuracy and Gini Index (see Figure S5). Spei_Av: average annual SPEI, Dur_wat: duration of water flow, Dur_d: duration of dry period, Dur_sh: duration of groundwater, Temp_Av: average annual temperature, Bund: bund around rice field, Freq: frequency of dry period, Sand: percentage of sand in the first 30 cm of soil, Rainy_Av: average annual rainfall, Dur_emerg: duration of emerging water table, Clay: percentage of clay in the first 30 cm of soil, Fac: flow accumulation, Carbon: Carbon content in the first 30 cm of soil.
Sustainability 11 00079 g005
Figure 6. Variable importance contribution as measured by the Mean Decrease in Accuracy in (a) Burkina-Faso, (b) Mali and (c) Nigeria (see Figure S6). Spei_Av: average annual SPEI, Dur_wat: duration of water flow, Dur_d: duration of dry period, Dur_sh: duration of groundwater, Temp_Av: average annual temperature, Bund: bund around rice field, Freq: frequency of dry period, Sand: percentage of sand in the first 30 cm of soil, Rainy_Av: average annual rainfall, Dur_emerg: duration of emerging water table, Clay: percentage of clay in the first 30 cm of soil, Fac: flow accumulation, Carbon: Carbon content in the first 30 cm of soil.
Sustainability 11 00079 g006
Table 1. Description of themes and variables included in the inland valley database (cf. Table S1).
VariablesScale TypeScale ClassSource of Data
Theme 1: Farmers’ experience with drought in the last 10 years
Occurrence of droughtnominalYes, noSurvey
Frequency of drought eventsordinalEvery year, every 2 or 3 years, every 4 or 5 years, more than every 5 yearsSurvey
Frequency of entire rice harvest lossordinalAll years, in 1 to 2 years, in 3 to 6 years, in 7 to 9 years, neverSurvey
Frequency of rice yield reductionordinalAll years, in 1 to 2 years, in 3 to 6 years, in 7 to 9 years, neverSurvey
Theme 2: Mitigation measures of rice farmers against drought
Use of drought resistant varietiesnominalYes, noSurvey
Change in cultivation areasnominalYes, noSurvey
Investment in irrigation facilitiesnominalYes, noSurvey
Change in cropping seasonsnominalYes, noSurvey
OthersnominalYes, noSurvey
Theme 3: Physical characteristics
Inland valley size (ha)numeric-SRTM a
Average width (m)numeric-SRTM
Cross-sectional shapenominalConvex, concave, flatSurvey
Particle size distribution (%)numeric-AfSIS b
Soil organic carbon (%)numeric-AfSIS
Daily minimum temperature from 1995 to 2014numeric-POWER database
Daily maximum temperature from 1995 to 2014numeric-POWER database
Daily rainfall from 1995 to 2014numeric-POWER database
Average annual standardized precipitation evapotranspiration indexnumeric-Authors computation
Duration of droughtnumeric-Authors computation
Frequency of droughtnumeric-Authors computation
Theme 4: Hydrology
Water sourcenominalSpring, river, otherSurvey
Flooding regimeordinalSporadic, seasonal, permanentSurvey
Duration of flooding (week)numeric-Survey
Duration of emerging water table (week)numeric-Survey
Number of weeks when groundwater table is within 50 cm from the soil surface (week)numeric-Survey
Drainage/irrigation infrastructurenominalNo drainage, canals for drainage and/or irrigationSurvey
Flow accumulationnumeric-SRTM
Theme 5: Management practices
Rice varietiesnominalLocal, improved, or bothSurvey
Soil fertility managementnominalNo fertilizer, mineral, or both (mineral +organic fertilizers)Survey
BundsnominalNo bunding, simple bunding, contour bundsSurvey
Theme 6: Socio-economic characteristics
Distance to road and distance to market (km)numeric-Survey
Quality of road to marketnominalNo road, path, dirt road, paved roadSurvey
Land ownershipnominalIndividual, family, village, stateSurvey
Origin of inland valley usersnominalNative, migrantSurvey
Percentage of women in the inland valleys (%) numeric-Survey
Mode of exploitationnominalIndividual, collective, bothSurvey
Source of seeds and other agricultural inputsordinalIn the village, at <25 km, 25–50 km, 51–100 km, >100 kmSurvey
Support from institutionnominalYes, noSurvey
Affiliation with farmers’ organizationnominalYes, noSurvey
Role of rice farming in production systemnominalMain activity, secondary major activity, marginal activitySurvey
a Shuttle Radar Topography Mission (SRTM), URL: http://srtm.csi.org. b Africa Soil Information Service (AfSIS).
Table 2. Categorization of dryness/wetness grade by the SPEI.
Categories SPEI Values
Extreme drynessLess than −2
Severe dryness−1.99 to −1.5
Moderate dryness−1.49 to −1.0
Near normal−1.0 to 1.0
Moderate wetness 1.0 to 1.49
Severe wetness1.50 to 1.99
Extremely wetnessMore than 2
Source: [30].
Table 3. Characteristics of inland valleys (IV) clusters identified in the study area (cf. Table S3).
ClusterAverage Annual SPEIDuration of Water Flow (Week)Average Annual Temperature (°C)BundingDuration of Shallow Aquifer (Week)Duration of Dry Period (Month)Percentage of IV Affected by Drought (%)
Cluster 10.06 ± 0.0038 ± 228.5 ± 0.1Bund (74%)19 ± 1 6 ± 0.10
Cluster 20.03 ± 0.0152 ± 026.6 ± 0.1Bund (11%)19 ± 3 6 ± 0.3 11
Cluster 3−0.02 ± 0.0152 ± 028.3 ± 0.1Bund (100%)12 ± 3 6 ± 0.6 78
Cluster 40.06 ± 0.0115 ± 128.8 ± 0.1Bund (100%)18 ± 3 6 ± 0.4 19
Cluster 50.03 ± 0.009 ± 129.2 ± 0.1Bund (29%)17 ± 6 6 ± 0.6 14
Cluster 6−0.03 ± 0.0019 ± 228.5 ± 0.1Bund (100%)12 ± 27 ± 0.5 90
Cluster 7−0.04 ± 0.0121 ± 128.3 ± 0.1Bund (0%)11 ± 1 7 ± 0.3 92
SED 0.023.50.18-81.1-
p value<0.001<0.001<0.001-0.0030.02-
IV: Inland valley; SED: Standard error of the difference.
Table 4. Logistic regression estimates of mitigation measures to drought model (cf. Table S4).
VariablesCrop Diversification Farming Practices Land Use Measures
CoefficientP > zCoefficient P > zCoefficient P > z
Distance to road0.024 (0.08)0.7700.114 (0.09)0.2360.193 (0.09) **0.042
Percentage of women0.005 (0.008) *0.0510.006 (0.01) *0.0670.017 (0.01) **0.044
Mode of exploitation0.534 (0.56)0.3440.778 (0.58)0.1790.780 (0.57)0.168
Role of rice farming in production system1.694 (0.60) ***0.0050.394 (0.55)0.4770.990 (0.56) *0.076
Distance from IV to market−0.033 (0.09)0.699−0.081 (0.09)0.382−0.029 (0.08)0.729
Support from institution−0.290 (0.62)0.6400.177 (0.61)0.7710.993 (0.64)0.121
Source of seed−0.695 (2.09)0.740−14.191 (0.67) ***0.00014.034 (0.77) ***0.000
Source of other input0.364 (1.28)0.776−0.308 (1.10)0.7791.420 (1.36)0.297
Origin of IV users0.571 (0.62)0.3581.390 (0.66) **0.034−0.117 (0.66)0.860
Land ownership 0.026 (0.61) *0.0700.813 (0.62) *0.0930.768 (0.63) **0.020
Affiliation with farmers’ organization 1.327 (0.59) **0.0201.243 (0.57) **0.0280.030 (0.54)0.960
Log likelihood = −112.02
LR chi2 = 134.60
Prob > chi2 = 0.04 **
Log likelihood = −88.12
LR chi2 = 13.01
Prob > chi2 = 0.05 **
Log likelihood = −63.59
LR chi2 = −20.84
Prob > chi2 = 0.08 *
NB: the values in bracket are the standard-errors. * Significant at 10% (p ≤ 0.10). ** Significant at 5% (p ≤ 0.05). *** Significant at 1% (p ≤ 0.01). IV: Inland valley.

