A Coupling Relationship between the Eco-Environment Carrying Capacity and New-Type Urbanization: A Case Study of the Wuhan Metropolitan Area in China


School of Business Administration, Zhongnan University of Economics and Law, Wuhan 430073, China
*
Author to whom correspondence should be addressed.
Sustainability 2018, 10(12), 4671; https://doi.org/10.3390/su10124671
Submission received: 11 November 2018
/
Revised: 3 December 2018
/
Accepted: 5 December 2018
/
Published: 7 December 2018
(This article belongs to the Special Issue Urban Sprawl and Sustainability)
Abstract
:Ongoing global urbanization is imposing tremendous pressure on the eco-environment. Research on the coupling of the eco-environment and urbanization has important significance for the sustainable development of urban metropolitan. Looking at the Wuhan Metropolitan Area, which includes nine cities, as a case study area, this paper describes an empirical study done to uncover the interactive coupling relationship between the eco-environment and new-type urbanization in the urban metropolitan area from the perspective of eco-environment carrying capacity. The eco-environment carrying capacity evaluation index system was set up using the pressure-state-response (PSR) model, and then the coupling model was built. The results indicate that the eco-environment carrying capacity in the Wuhan Metropolitan Area is generally sustainable and has three grades. The quality of new-type urbanization in the nine cities in the Wuhan Metropolitan Area shows clear spatial heterogeneity. There are five types of the coupling relationship including moderate coordinated development, elementary coordinated development, reluctant coordinated development, edge of maladjustment, and mild maladjustment between the eco-environment carrying capacity and new-type urbanization level in the Wuhan Metropolitan Area. Therefore, this paper proposes corresponding policies from the aspects of coordinating the industrial division of labor, focusing on the eco-environment carrying threshold and strengthening policy guidance.
1. Introduction
The process of urbanization, which began in North America and Western Europe, is now mainly occurring in developing nations. It is bringing major social–ecological change to humankind and especially is imposing tremendous pressure on the eco-environment [1,2]. Researchers have been sharing growing concerns about the relationship between urbanization and the eco-environment [3,4], which simultaneously has become an indispensable part of sustainability research. A growing number of studies consider urban sprawl as a land use change driver affecting the provision of ecosystem services [5,6,7], which produced global problems, notably climate change, air pollution, as well as food, water, and energy availability et al. [8,9,10]. Wachsmuth et al. [11] determined that ecological issues related to sustainability problems are generally on a regional or global scale, but current urban policies usually focus on one aspect of ecological issues in a single city. Therefore, sustainability research must shift its focus from a single city to an urban metropolitan area. In the past few decades, China has achieved rapid economic growth relying on the extensive urban development pattern, which features farmland consumption, cheap labor force supply, and environmental deterioration. On the one hand, population gathering, resource shortage and environmental pollution have already exerted a huge pressure on the ecosystem [12]. On the other hand, economic and social development is increasingly restricted by resource availability and the environment, which hinders the process and speed of urbanization development to some extent [13]. This type of coupling relationship between the eco-environment and urbanization, characterized by the negative impact of high-speed urbanization on the eco-environment and the restricting effect of the eco-environment on the process and mode of urbanization, is particularly significant in urban metropolitan areas that are experiencing high-speed urbanization [14]. The concept of ‘New-type urbanization’, proposed in 2013 under the guidance of a sustainable development strategy, is different from China’s previous mode of urbanization. Promoting the intensive growth of resources and paying close attention to the protection of the eco-environment are its core principles. In the National Plan on New-type Urbanization (2014–2020) issued in 2014 by the National Development and Reform Commission, PRC pointed out that the current unreasonable spatial distribution and scale structure of urban in China is not well matched to the carrying capacity of resources and the environment, which increases the cost of economic society and the eco-environment. The Wuhan Metropolitan Area, also known as Wuhan “1 + 8” City Circle, is in the middle of China. This area is centered on Wuhan, the largest city in central China, and includes eight medium-sized neighbor cities, including Huangshi, Ezhou, Huanggang, Xiaogan, Xianning, Xiantao, Qianjiang, and Tianmen (Figure 1). In 2007, the State Council of the People’s Republic of China formally approved the Wuhan Metropolitan Area as the “Resources-saving and Environment-friendly Comprehensive Reform Experimental Area” that aims to explore the roadmap of new-type urbanization development and promote the coordination of population, economy, resource and eco-environment. Therefore, the interactive coupling relationship between the eco-environment and urbanization in the urban metropolitan area represented by the Wuhan Metropolitan Area is a problem worth exploring.
With the recent development of interdisciplinary and comprehensive global change research, such as the International Human Dimension Programme on Global Environmental Change (IHDP) and the Millennium Ecosystem Assessment (MA), the coupling relationship between the eco-environment and urbanization has received extensive attention and has become one of the cutting-edge interdisciplinary fields of earth system science and sustainable research [15,16]. Scholars have discussed the coupling relationship between urbanization and the eco-environment from different disciplinary perspectives, such as water resources use [17], land use change [18], atmospheric environment [19,20] and biodiversity and ecosystems [21]. Most of the research has found either a completely negative relationship between urbanization and eco-environment, or diverse relationships due to different urbanization factors or levels [4,22,23]. For example, Kumar et al. [24] found that human activities affect local water quality and threaten regional stability in the Pasig-Marikina River Basin area, and they argued that rapid urbanization is one of the reasons for river pollution. Land cover change caused by urbanization may lead to local changes, such as hydrologic processes, in water resources within the basin [25]. Henderson et al. [26], through analysis of the climatic conditions and urbanization in sub-Saharan African districts, held that climate can impact urban population and urbanization rates. The research by Galletti et al. [27] suggested that the number of types of cloud forest of Dhofar in Oman decreased due to urban expansion and grazing activities and that this change has threatened biodiversity and ecosystems. The existing literature usually uses quantitative modeling to discuss the coupling relationship between urbanization and the eco-environment [2]. Liu et al. [28] set up the evaluation index system according to a sustainable development approach and adopted an interpretive structural model and gray relational technology to assess the coupling relationship between urbanization and the eco-environment. Some scholars have attempted to use new methods, such as the STIRPAT model [29] or big data and computing models [30], to explore the coupling relationship between urbanization and the eco-environment. Research on this relationship has also attracted the attention of scholars in developing countries with high-speed urbanization. The coupling model has been extensively used in China. Zhou et al. [31] discussed the coupling relationship between regional economy, eco-environment, and tourism industry and predicted the coupling coordinative degree of these three systems in the following several years by the GM(1,1) forecasting model. However, there are many disputes about the theoretical basis of the coupling relationship and the classification of a standard of coupling degrees. For example, Chen et al. [32] measured the coupling degree of new-type urbanization and the eco-environment carrying capacity in the Yangtze River Delta Urban Metropolitan based on Leopold’s earth ethics and classified the degree into three types: breaking-in stage, antagonistic stage, and moderate coordination stage. Wang et al. [33] divided the coordination pattern into eight types, including comprehensive coordination, lagging economy, and unsustainable, based on the change rate of the eco-environment, and the economic growth rate.
The impact of human activities on the eco-environment must be maintained within the boundary of the planet, which is the safe threshold and operating space of the earth’s systems [34]. Threshold changes at the local or regional scale can affect functioning at the planetary level, so local or regional boundaries are necessary to be estimated in the process of urbanization [35]. On this basis, some studies identified the thresholds of ESs response to population and economic urbanization [4]. The eco-environment has a specific demographic, economic, and social carrying capacity and safe minimum standards in different regions, which is one of the essential characteristics of the eco-environment [36]. This provides a basis for analyzing the interaction relationship between the eco-environment and urbanization from the perspective of the eco-environment carrying capacity. However, as an important part of the eco-environment, the eco-environment carrying capacity has not been given appropriate consideration in the investigation of the interactive coupling relationship of the eco-environment and urbanization. Moreover, with the development of urbanization and regional economic integration in China, the circulation of population, resources, technology and other factors among cities is accelerating; thus, some regions gradually form a geographical economic circle, an industrial circle and even an ecological circle [36,37]. The interplay of human activities and the environment in the urban agglomeration area is particularly notable [12]. Therefore, it is of great practical and theoretical significance for the benign coupling of the eco-environment and urbanization in the urban metropolitan area that researchers understand the relationship between economic and social activities, natural resources, and spatial differentiation.
The paper first presents the interactive coupling relationship between the eco-environment carrying capacity and new-type urbanization from a theoretical point of view. Then, the eco-environment carrying capacity evaluation index system is set up using the pressure-state-response (PSR) model, and the coupling model is built. Next, the paper presents the results that discuss the eco-environment carrying capacity, new-type urbanization level and the coordination degree of the Wuhan Metropolitan Area in 2016. The discussion that follows reviews the research on the coupling relationship between the two systems. Finally, the paper provides some policy recommendations and suggestions for future work.
2. The Interactive Coupling Relationship of the Eco-Environment Carrying Capacity and Urbanization
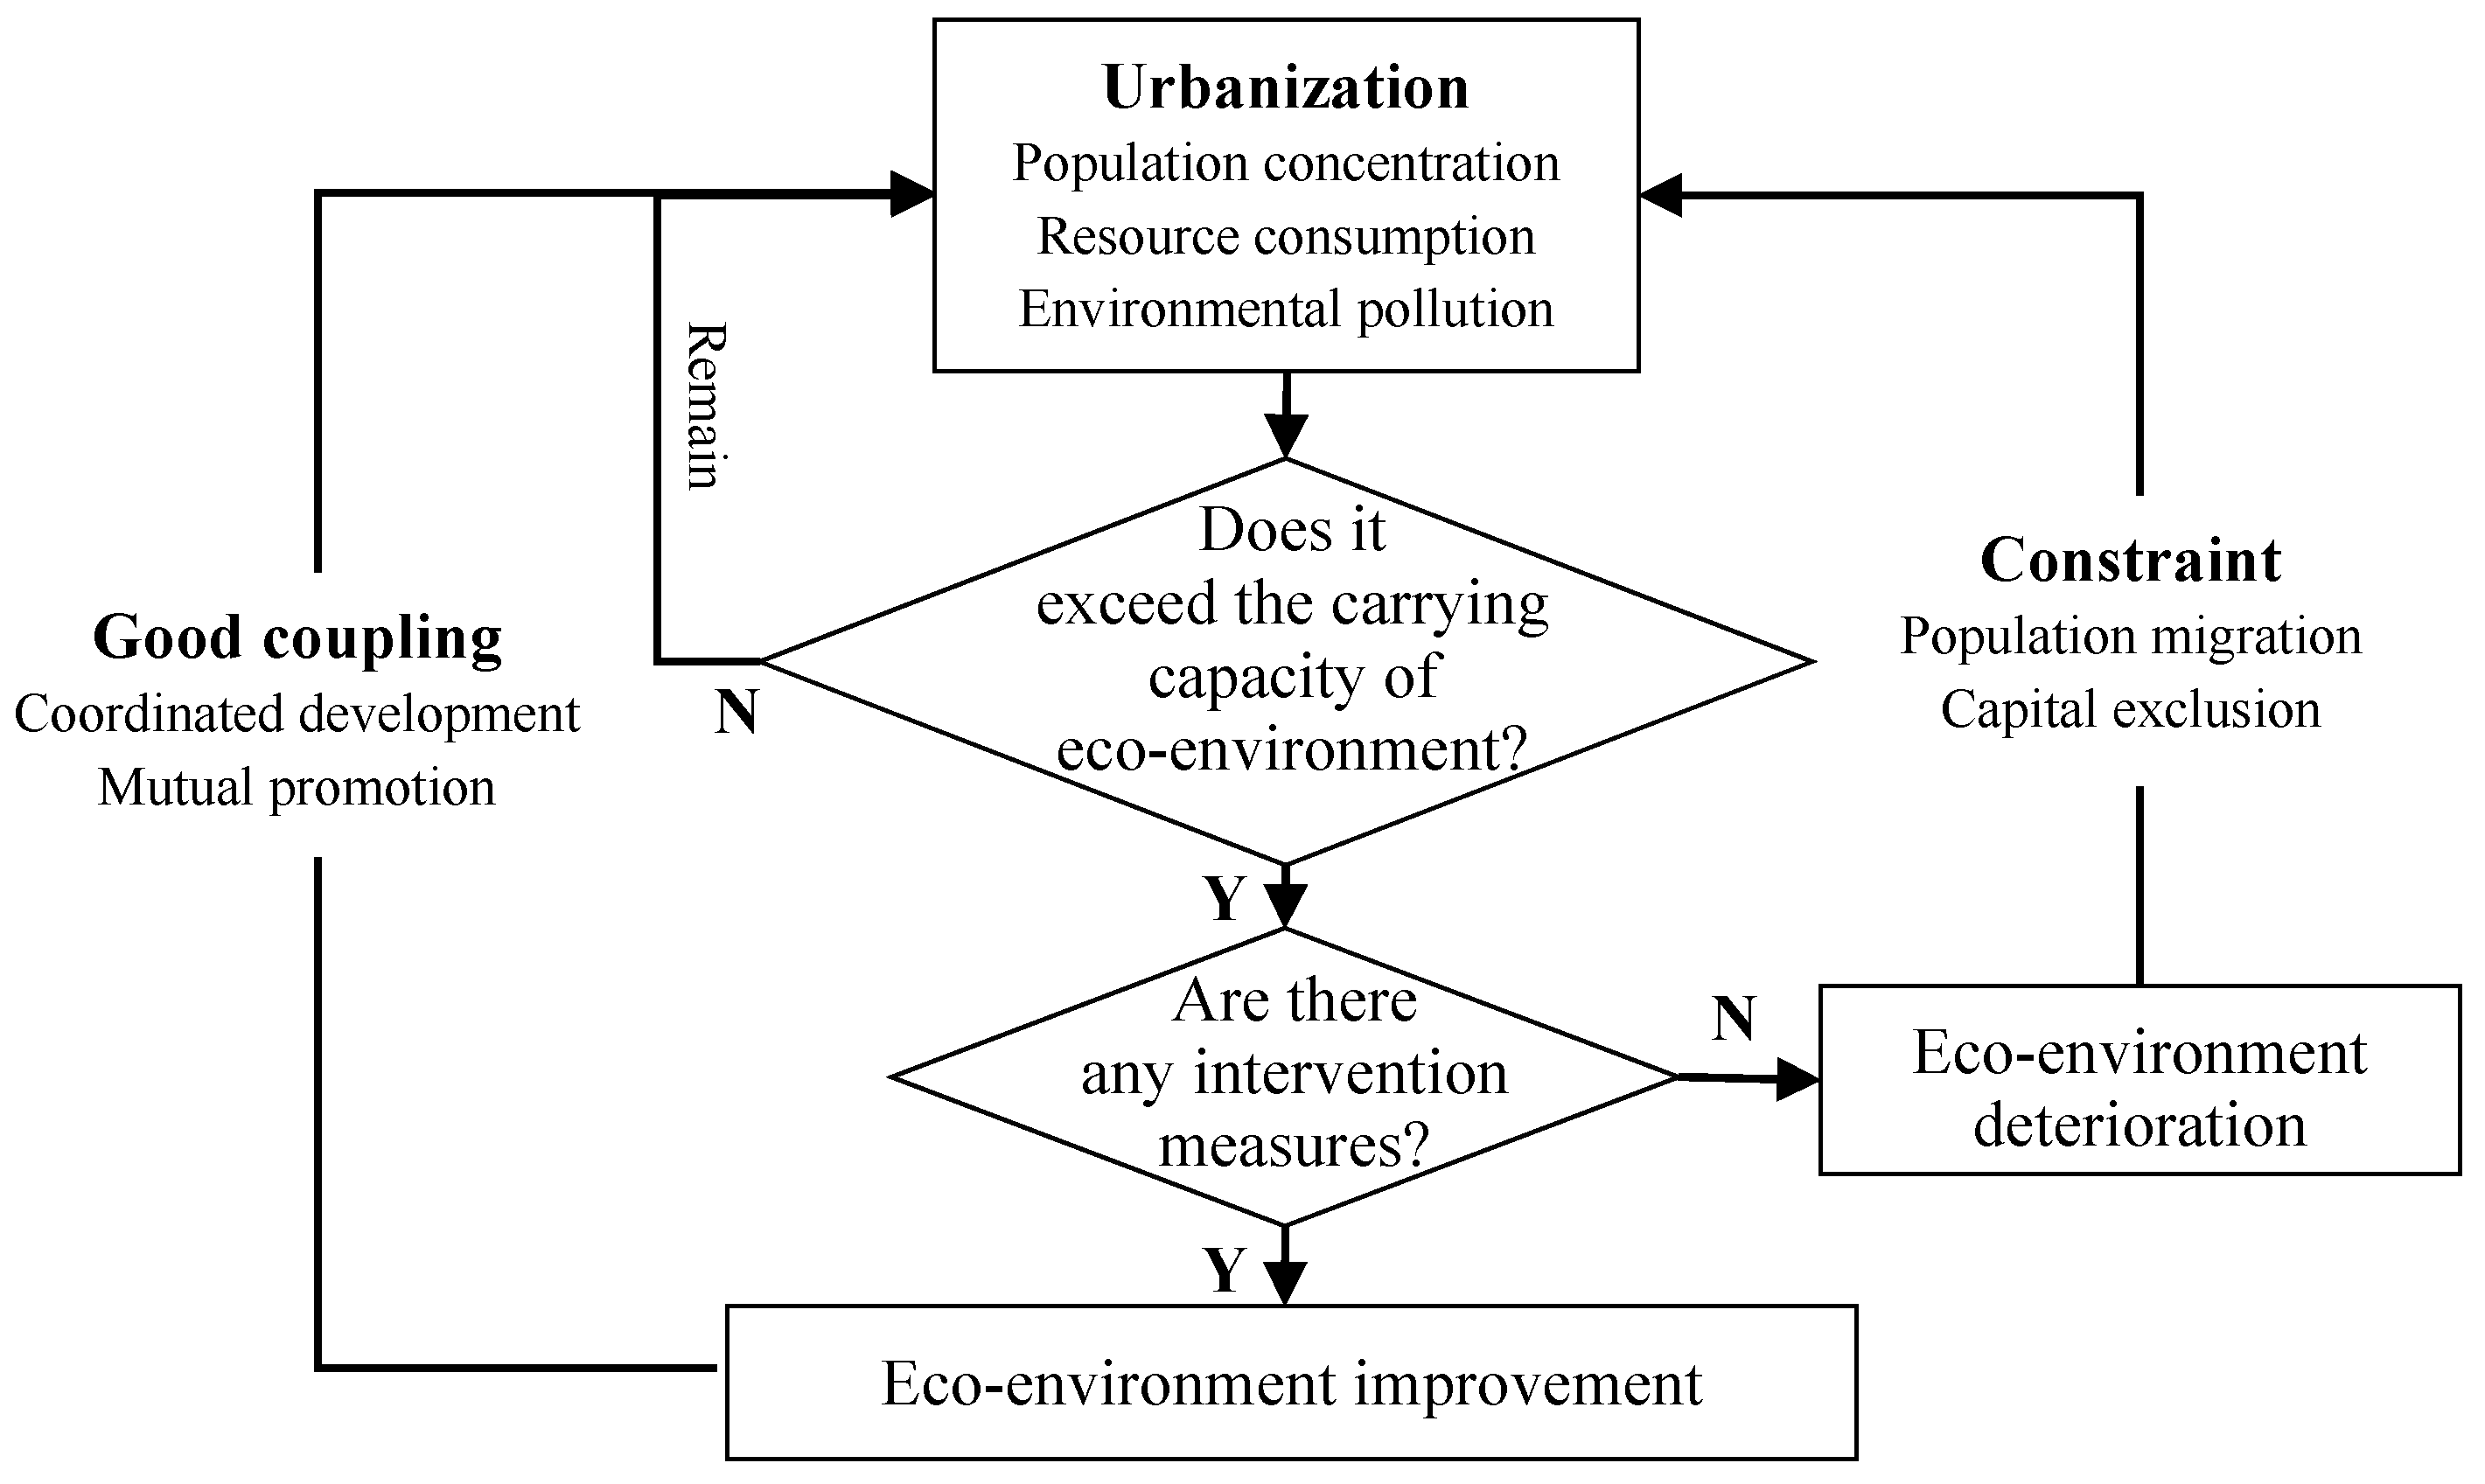
The interactive coupling effect of the eco-environment and urbanization is the process by which two systems interact and influence each other through their respective elements. On the one hand, urbanization affects the quality of the eco-environment through population, air, land, and other factors [38,39,40]. Specifically, with the migration of rural populations into urban areas and the concentration of nonagricultural industries in urban areas, the scale of urban development land expands continuously [41]. The consumption of water, grain, energy, land, and other environmental elements by social and economic activities has gradually increased, which has resulted in a large amount of domestic waste and industrial pollution and has caused the deterioration of the eco-environment [42,43]. In addition, the growing economic strength of the city has caused the government to promote the use of renewable energy resources and increase investment in environmental protection, which improves the environment to some extent. On the other hand, the eco-environment can also affect the development of urbanization. Environmental pollution may damage human health and lead to population migration and capital exclusion in the form of the relocation of high-tech enterprises with substantial environmental requirements and the emigration of high-quality talents [44]. The pattern that sets a priority on economic development over environmental protection often leads to a decline in the quality and stability of the environment, which will drain follow-up funds for economic development and undermine the progress that urbanization has made [35,45].
The eco-environment carrying capacity refers to the ability of an ecosystem to support the scale of economy and population, which is an important basis for measuring the coordination degree of social and economic development and the ecosystem [46,47]. The resource endowment and environmental capacity of the ecosystem in each city are finite, and development and utilization levels in each city are different; thus, the eco-environment carrying capacity is also finite and heterogeneous [48,49]. The characteristics of carrying capacity have an influence on the regional industrial structure and industrial layout, which, in turn, profoundly affect the direction and urbanization development pattern of each city. Moreover, if the impact of human activities is within the threshold of the eco-environment, the eco-environment and urbanization will support each other and achieve harmonious development. However, once the intensity and the scale of urbanization exceed the carrying capacity of the eco-environment, the environment will deteriorate, and the process of urbanization will be hindered correspondingly. In contrast, urbanization also exerts an influence on the eco-environment carrying capacity. During the early industrialization, wastewater and waste gas are wantonly discharged into local waterways and airsheds [35]. These environmental damages, caused by industrialization and urbanization, lead to a decrease in the threshold and carrying capacity of the eco-environment, which is often irreversible [48]. However, if the investment intensity of environment construction exceeds the ability of the regional economy, the process of urbanization will also be delayed due to the shortage of funds, and as a result, the eco-environment will not be sustainable without economic support (Figure 2).
3. Materials and Methods
3.1. Data Preprocessing
The statistical data are available from the statistical yearbook and the water conservancy annals of Hubei Province. Because the dimension and attribute of the evaluation indicators are inconsistent, the indicators should be dealt with using nondimensional processing. Min-Max normalization is the most common method, but some results of this method are equal to 0, which limits the use of the entropy method [50]. Since the efficiency coefficient method can solve this problem [51], this paper selected the efficiency coefficient method to standardize the data. Equation (1) was used as a positive indicator, and Equation (2) was used as a negative indicator.
where xij and Xij are the original value and the normalized value of indicator j of region i, respectively; max{xj} and min{xj} are the maximum value and minimum value of indicator j, respectively. γ represents the adjustment coefficient and ranges from 0 to 1. With the growth of γ, the influence of 1 − γ gradually decreases, the distortion of the original data is smaller, and the influence of γ on the results is smaller. Therefore, this paper made γ equal to 0.9999 so that a value of 0 can be avoided and the influence of the efficacy coefficient method can be minimized.
3.2. Method
3.2.1. Index System of the Eco-Environment Carrying Capacity
Sustainable development theory, the state space method and PSR model provide a theoretical basis for the construction of an evaluation index system of eco-environment carrying capacity. The PSR model is an environmental problem analysis framework that was proposed by the Organization for Economic Cooperation and Development (OECD) and the United Nations Environment Programme (UNEP) in the late 1980s [52]. Because the PSR model can effectively reflect the causal relationship of pressure, state, and response, it is widely used in ecological security, evaluation of the eco-environment carrying capacity, and other studies [53]. The PSR model can reflect the interaction relationship between humans and the environment. Specifically, how the resource consumption of water, soil, air, and the like exerts pressure on the eco-environment, which results in a decline in environmental quality [54]. These changes in the environment, in turn, affect human consciousness and behavior so that people will mitigate or eliminate these negative effects of human activities through environmental protection and economic policy [55]. This process forms a pressure-state-response relationship between humans and the eco-environment.
In keeping with the PSR model and relevant literature [56,57], this paper selected 17 indicators to analyze the eco-environment carrying capacity in the Wuhan Metropolitan Area (Table 1). The pressure index reflects the negative impact of human activities on the ecosystem during the process of urbanization development. This paper selected seven basic indicators (energy consumption per 104 yuan worth of gross industrial out value, water consumption per 104 yuan worth of GDP, discharged volume of industrial SO2 per capita, discharge of wastewater per capita, land deterioration index, fertilizer use intensity, value of noise pollution) to address the actual ecological situation of the Wuhan Metropolitan Area. There are some environmental problems in the Wuhan Metropolitan Area, such as the loss of agricultural land, the destruction of forests, water pollution and soil pollution. Accordingly, this paper selected six indicators, including per capita water resources, per capita agricultural land and organism abundance index, to measure the current state of the eco-environment. The response index refers to the policies and measures to restore and improve the eco-environment and includes four indicators (sewage treatment rate, industrial solid waste comprehensively rate, garbage harmless treatment rate, proportion of environmental protection expenditure to GDP).
3.2.2. New-Type Urbanization Index System
The existing literature has analyzed the level of urbanization development from economic development, urban population growth and urban spatial expansion. New-type urbanization focuses on the living standards of people, industrial transformation and upgrading, ecological civilization, and urban and rural development [58]. To get closer to the actual situation of China, this paper measured the urbanization level of the Wuhan Metropolitan Area from the perspective of new-type urbanization. This research constructed the evaluation index system of the eco-environment carrying capacity from the three dimensions of pressure, state and response. Therefore, the environmental factors were no longer considered separately in the index system of new-type urbanization. This research measured the quality of new-type urbanization of nine cities in the Wuhan Metropolitan Area through five first-grade indexes (population urbanization, economy urbanization, space urbanization, social urbanization, and urban–rural integration) and sixteen basic indicators (proportion of the urban population to the total population, urban population density, per capita GDP, etc.) (Table 1).
First, some scholars select the indicators of numbers of students in college per 104 persons and numbers of sickbeds per 104 persons to reflect the recessive population urbanization [59]. However, this research argues that population urbanization emphasizes the process of rural population concentration in cities and towns. Many scholars agree with this view and classify these recessive indicators as reflecting social urbanization [60]. Therefore, this paper chose two indicators, urban population density and the proportion of the urban population within the total population, which together represent urban population expansion and population agglomeration. Second, new-type urbanization emphasizes the transformation of industrial structure and the driving role in economic development. This research selected four basic grade indexes to characterize economy urbanization (per capita GDP, proportion of the value of the secondary and tertiary industry to GDP, proportion of the added value of the high-tech industry in GDP, proportion of foreign investment actually utilized to GDP). Third, new-type urbanization refers to the expansion of urban areas in geographical space, which can be represented by the proportion of built-up areas to urban areas. It also refers to the input and output of land-intensive use, which can be represented by per-unit area financial revenue and per-unit area investment in fixed assets. Fourth, new-type urbanization considers the development of humankind as the core goal and aims to improve the quality of life for urban and rural residents and the level of urban public services. Accordingly, this paper selected indexes of social urbanization using social security, employment, education and medical care. Finally, new-type urbanization contributes to the narrowing of the income gap between urban and rural residents and the sharing of modernization achievements [61]. The ratio of urban households’ to rural households’ per capita disposable income, ratio of urban households’ to rural households’ per capita consumption expenditure, and ratio of urban households’ to rural households’ Engel coefficient were selected to measure the level of urban and rural development.
In this research, the entropy method was adopted to determine the weight of each index, shown in Table 1, and then the comprehensive index of the eco-environment carrying capacity and new-type urbanization was calculated according to the standardized value of each index (Equations (3) and (4)).
where f(x) stands for the general function of eco-environment carrying capacity and g(y) stands for the general function of new-type urbanization. Xi and wi are the values of indicator i of eco-environment carrying capacity and its weight, respectively. Yj and wj are the values of indicator j of new-type urbanization and its weight, respectively.
3.2.3. Coupling Model
Many studies have used static coupling models, which are based on the studies of Liao [62] and Liu et al. [63], to analyze the coordination degree of two systems. However, there are many problems, including the error of equation and the inconsistency between calculation result and equation, in the application of static coupling models. Based on the above problems, this paper discusses the use of static coupling models of two systems in the existing literature. Liu et al. [63] proposed the multisystem coupling model (Equation (5)) and the coupling model for urbanization and the eco-environment based on the concept of physics coupling. They classified the coupling degree C into four stages: (1) when 0 < C ≤ 0.3, it is low-level coupling stage; (2) when 0.3 < C ≤ 0.5, it is antagonistic stage; (3) when 0.5 < C ≤ 0.8, it is break-in stage; and (4) when 0.8 < C ≤ 1, it is high-level coupling stage. However, this research finds that the coupling model of urbanization and the eco-environment is not consistent by comparing these two papers (Equations (6) and (7)). Although this inconsistency does not affect the ordering of the coupling degree, it has led to the misuse of the equation and the stage of coupling degree in some studies. From the value range and the stage of the coupling degree, the coupling degree of two systems should be measured by Equation (7). However, from the general function of the multisystem coupling model (Equation (5)), the coefficient that is equal to 2 in Equation (7) will be discussed. Meanwhile, when k = 0.5 in Equation (8), Equation (7) is equal to Equation (8). The previous study has shown that the value of k has a great influence on the distribution of coupling degree C [63]. When k is less than or equal to 0.5, the value of the coupling degree C is highly concentrated in [0.8, 1]. Therefore, the accuracy and rationality of Equation (7) need to be further explored.
In accordance with the principle of the minimum of the mean square deviation, Liao [62] proposed the coupling degree and the coupling and coordination development degree to measure the synergy between economy and environment. That study also suggests that the coupling and coordination development degree is more stable than the coupling degree and that coupling and coordination development is most suitable to evaluate the coordination between the two systems in different regions or in different periods. Subsequently, many scholars have carried out extensive research on the coupling relationship of two systems [64]. Therefore, the present study measured the coupling degree and the coupling and coordination development degree of nine cities in 2016 and classified the coupling and coordination development degree into ten types, shown in Table 2, based on the research of Liao [62] (Equations (8)–(10)).
where C represents the coupling degree and k is the adjustment coefficient (k ≥ 2). T stands for the overall benefit of the eco-environment carrying capacity and new-type urbanization. α and β are undetermined coefficients (α = β = 0.5). The coupling and coordination degree is represented by D. Considering the distribution of the coupling degree, this research made k equal to 2. As mentioned in the introduction, the eco-environment carrying capacity and new-type urbanization influence each other. They are both important in the process of urbanization development, so putting particular emphasis on one of them could damage the development of urbanization [65]. Therefore, in this paper, both α and β are made equal to 0.5.
4. Results
The results of the coupling model are presented in Table 3. Based on the above results, this paper analyzes the level of the eco-environment carrying capacity, the quality of new-type urbanization and the coordination of the two systems in the Wuhan Metropolitan Area in 2016.
4.1. Spatial Distribution Characteristics of the Eco-Environment Carrying Capacity
To clearly illustrate the spatial distribution characteristics of the eco-environment carrying capacity, this research divided the eco-environment carrying capacity into five types: (1) when 0 ≤ f(x) ≤ 0.2, it is poor; (2) when 0.2 < f(x) ≤ 0.4, it is relatively poor; (3) when 0.4 < f(x) ≤ 0.6, it is average; (4) when 0.6 < f(x) ≤ 0.8, it is relatively good; and (5) when 0.8 < f(x) ≤ 1, it is good. The Jenks natural breaks classification method is a data clustering approach that finds the optimal arrangement of data sets by calculating each class’s average deviation within classes and between classes [66,67]. This method was adopted to analyze the spatial differentiation characteristics of pressure, state, and response (Figure 3).
As shown in Figure 3, the eco-environment carrying capacity in the Wuhan Metropolitan Area in 2016 is relatively sustainable, with values distributed between 0.3149 and 0.6770. There were three types of eco-environment carrying capacity identified: relatively poor, average, and relatively good, which accounted for 22.61%, 30.35%, and 47.04% of the total area of the Wuhan Metropolitan Area, respectively. First, the eco-environment carrying capacities of Ezhou (0.3149), Xiaogan (0.3909), and Tianmen (0.3759) are classified as relatively poor. This indicates that social and economic activities have exerted great stress on the environment and that local governments pay insufficient attention to the eco-environment. Second, the eco-environment carrying capacities of Wuhan, Huangshi, Qianjiang, and Xiantao are classified as average. This suggests that the impact of human activities on the eco-environment in these regions remains within the threshold of the ecosystem. The resources and the environment can meet the needs of the current regional economic development. Third, the eco-carrying capacities identified as relatively good, including Huanggang and Xianning, are the most widely distributed.
These data show different spatial distribution characteristics from the perspective of each dimension of the eco-environment carrying capacity in Figure 3. First, the index of pressure is a negative indicator, which means that the smaller the index value is, the greater the pressure of the regional eco-environment will be. Ezhou is dominated by traditional industries that consume large amounts of resources and release large pollutant emissions. The value of traditional industries accounted for more than 60% of the total industrial output value in 2016, which is the greatest environmental pressure in Ezhou (0.2827) in Figure 3a. Figure 3b reflects the current state of the regional ecosystem. Xianning, which has the important national ecological functional zones and is the main production district of farm products, has good water and biological and forest resources with the highest index of state (0.8224). In contrast, Wuhan has a large population and a large amount of construction land. Tail gas pollution and raised dust pollution in Wuhan are particularly significant, and the index of state in Figure 3b is at the lowest level (0.2142). Second, as shown in Figure 3c, the indexes of response in Ezhou (0.2960) and Xiaogan (0.3173) are very low in the Wuhan Metropolitan Area because the index of environmental protection expenditure has a great influence on the index of response.
4.2. Spatial Distribution Characteristics of New-Type Urbanization
To clearly describe the spatial distribution characteristics of new-type urbanization with each dimension in the Wuhan Metropolitan Area, this study adopted the Jenks natural breaks classification method to analyze the urbanization level of nine cities. As shown in Figure 4f, the quality of new-type urbanization in nine cities shows clear spatial heterogeneity, which means that they are in uneven states of development. The average quality of new-type urbanization is 0.3071, and only Wuhan, Ezhou and Huangshi are more than the average. Moreover, new-type urbanization in Wuhan (0.8021) is significantly higher than that in other cities (≤0.3512).
Figure 4 shows that the cities have different spatial distribution characteristics in each dimension of new-type urbanization. First, as shown in Figure 4a, Wuhan, followed by Ezhou, is dominant in terms of population urbanization. The quality of population urbanization in Xianning (0.0652) and Huanggang (0.0228) is low. The proportion of the urban population to the total population in Wuhan is 35.01% higher than that in Huanggang, and the urban population density in Wuhan is 87.03% higher than that in Xianning. Second, as the engine of economic development in the Wuhan Metropolitan Area, Wuhan still has great advantages in economy urbanization. The proportion of the value of the secondary and tertiary industry to GDP and the proportion of the added value of the high-tech industry in GDP in Wuhan rank first in the Wuhan Metropolitan Area. Ezhou has developed rapidly in recent years. The index of economy urbanization (0.5769) of Ezhou has exceeded that of Huangshi, which is a subcentral city of Hubei Province. The economy of Xiaogan, Qianjiang, and other cities is relatively weak, especially Huanggang. Third, Figure 4c shows that the Wuhan Metropolitan Area is in “a dominant” situation in terms of space urbanization. Wuhan, followed by Ezhou, has the highest proportion of built-up area in urban zones and land use efficiency. The value of the space urbanization index in other cities is less than 0.2000. Fourth, as shown in Figure 4d and Table 2, there is a significant gap in social urbanization in the Wuhan Metropolitan Area, reflecting the uneven distribution of medical, social security, education, and municipal construction in nine cities. Last, because the income and consumption expenditures of urban households and rural households in Qianjiang, Xiantao, and Ezhou are quite different, the degree of urban–rural integration in these regions is at a low level (Figure 4e). The gap in income and expenditure between urban areas and rural areas in Huanggang and Huangshi is small, so the degree of urban–rural integration is relatively high.
4.3. Spatial Distribution Characteristics of the Coupling and Coordination Development Degree
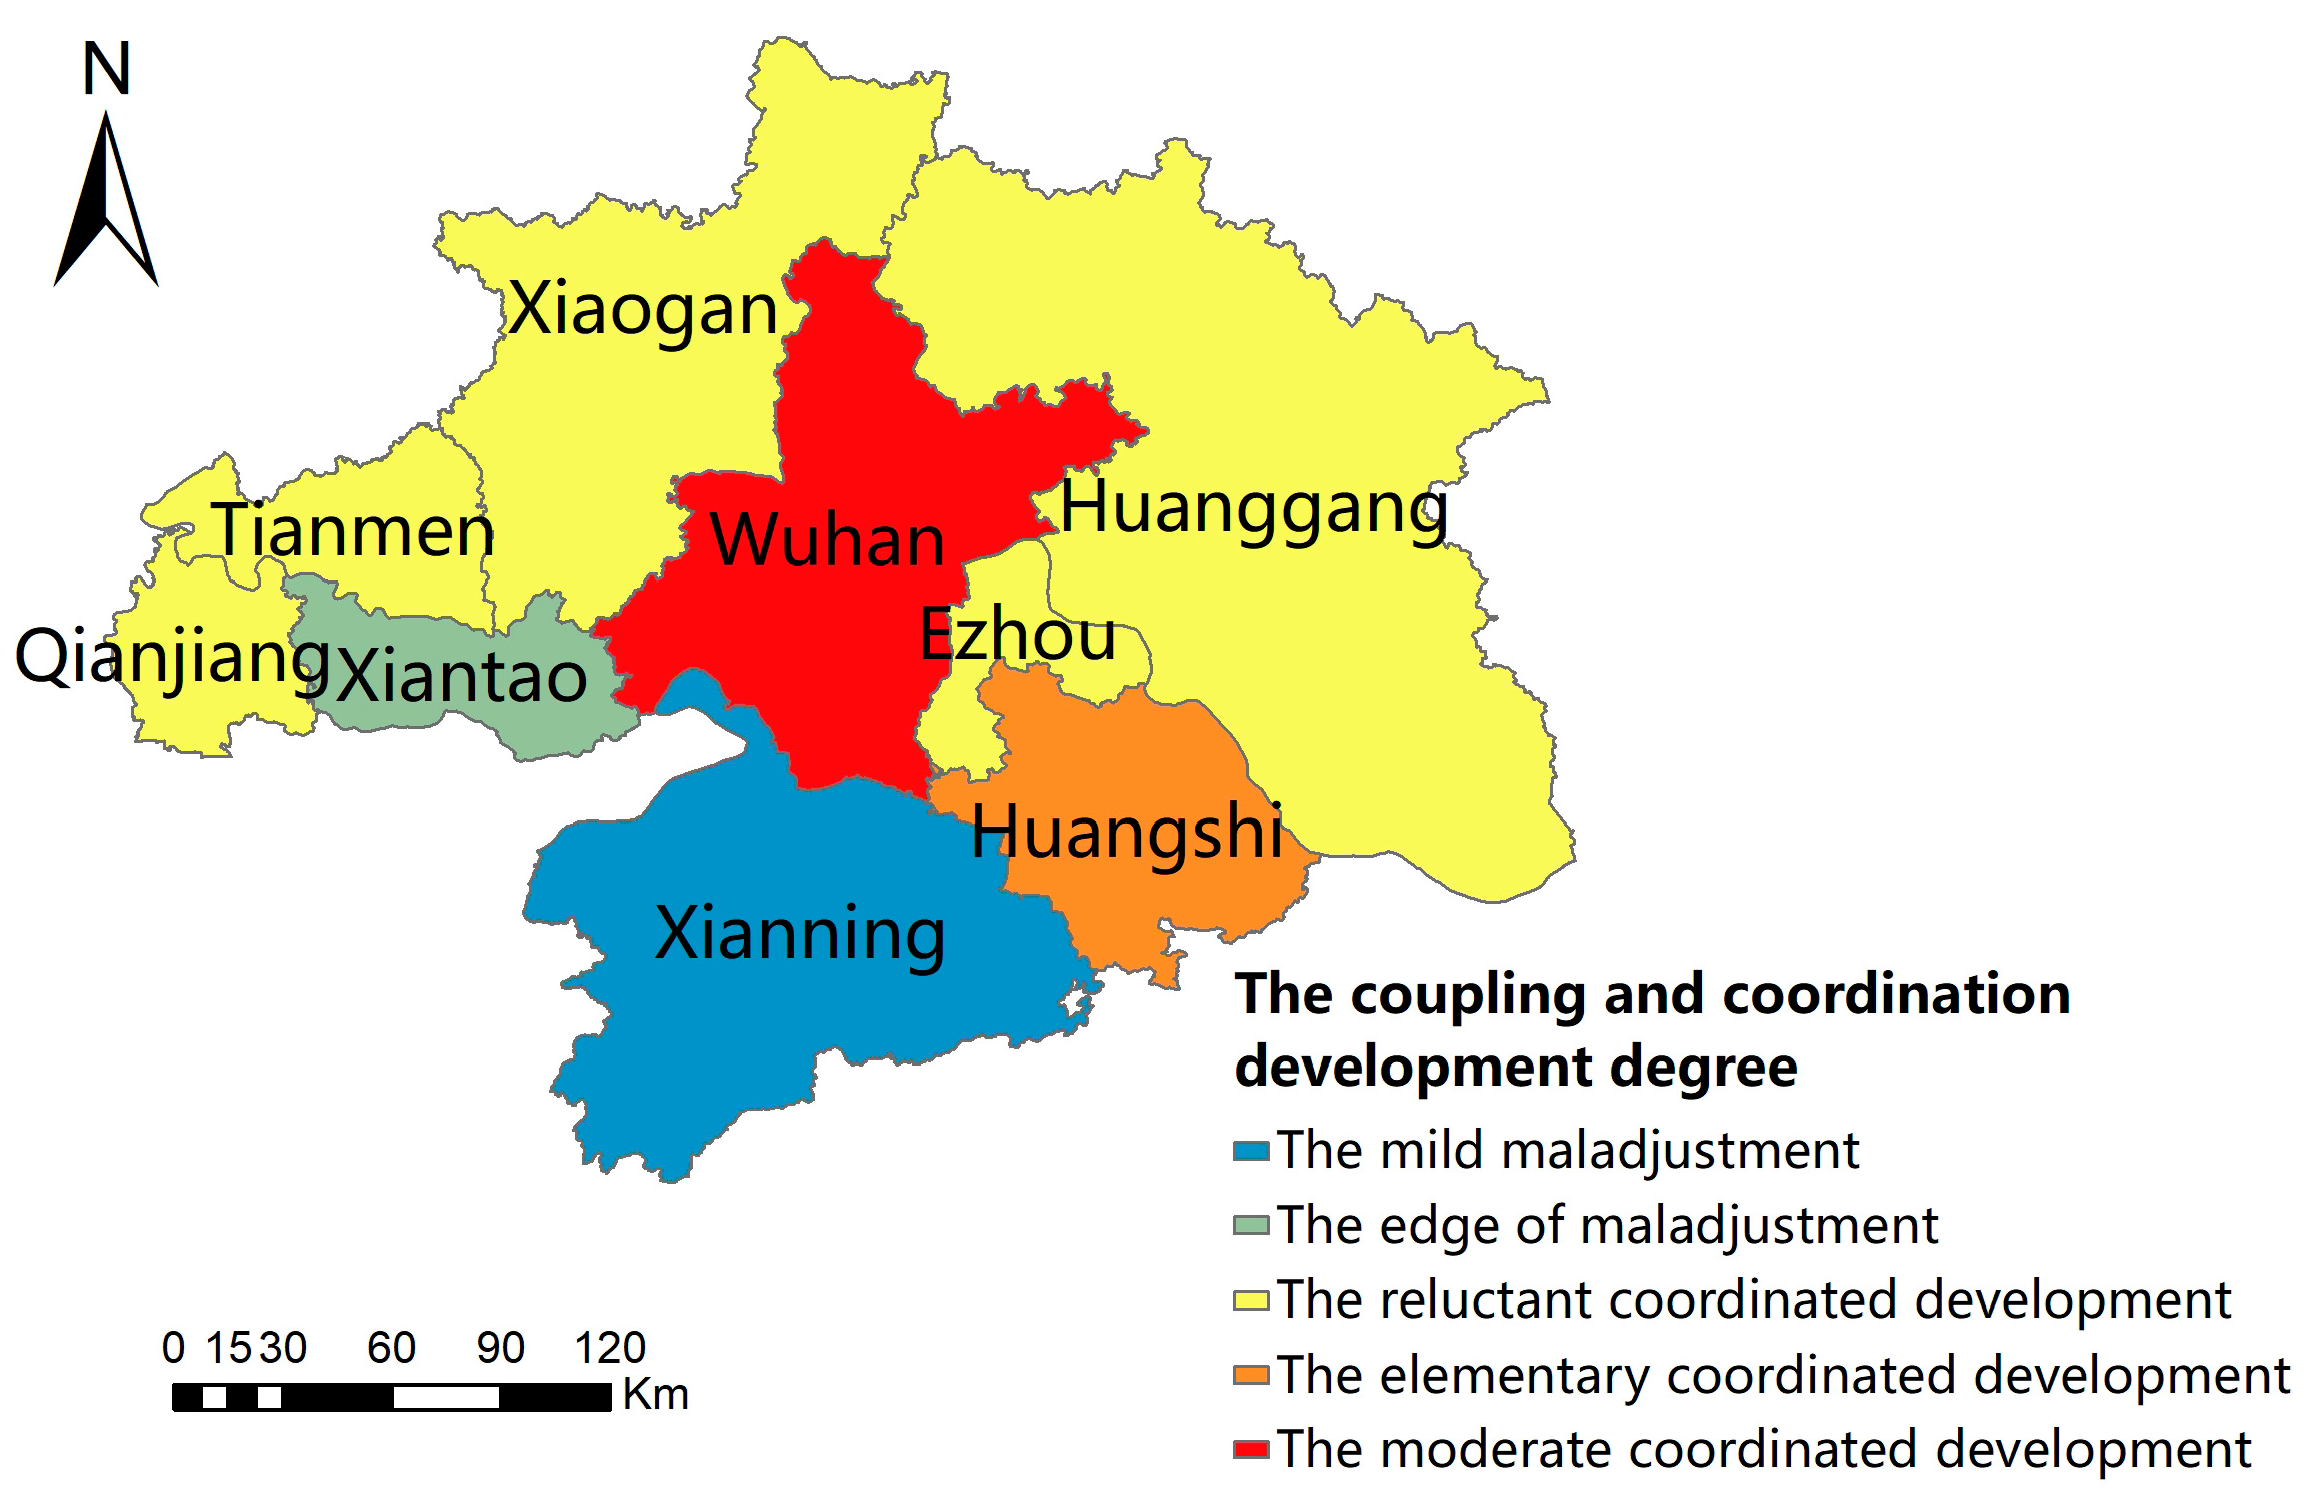
As shown in Table 2 and Figure 5, there are significant differences in the coordination degree between the eco-environment carrying capacity and new-type urbanization in the Wuhan Metropolitan Area. The coupling and coordination development degree, which ranges from 0.3433 to 0.7108, can be classified into five types. The coupling and coordinated development degree in the Wuhan Metropolitan Area is no more than 0.5, excepting Wuhan and Huangshi (Table 2). There are seven cities that are classified as having reluctant coordinated development (Figure 5).
First, Figure 5 shows that Wuhan is classified as having moderate coordinated development. Although Wuhan is an economy-lagged city, the eco-environment carrying capacity in Wuhan is still classified as relatively good. This is because the value of the tertiary industry accounts for a high proportion of overall industry (52.84%) and the industrial structure is upgraded rapidly. In addition, awareness of environmental protection has been continuously improved. This region needs to upgrade traditional industries, such as steel, automobile, and building material. Based on the existing advantages, new industries, such as information technology, biological, and new material industries, should be systematically developed. Moreover, it is necessary to strengthen dust control and tail gas treatment and carry out ecological restoration of lake, soil and contaminated sites to form a benign interaction between the eco-environment and new-type urbanization.
Second, as shown in Table 2 and Figure 5, the index of the eco-environment carrying capacity of Huangshi (0.5352) is larger than the index of new-type urbanization (0.3081), which means that Huangshi is classified as economy-lagged and having elementary coordinated development. Due to the reduction of mineral resources in Huangshi, the number of metallurgy, energy, and building materials industries relying on mineral resources has gradually declined. It is essential to improve the quality and efficiency of economic development by seeking out and promoting substituted industrial development.
Third, Figure 5 shows that Ezhou, Huanggang, Xiaogan, Qianjiang, and Tianmen are classified as having reluctant coordinated development. This type is the most widely distributed in the Wuhan Metropolitan Area. Specifically, Ezhou is an environment-lagged city. The economic development of Ezhou is still dominated by heavy chemical industries with high consumption and high pollution, which has resulted in environmental pollution and ecological deterioration. The restriction of resources on urbanization development is increasing. Thus, seeking industrial optimization and upgrading is one of the major problems in Ezhou. As shown in Table 2, Huanggang, Xiaogan, Qianjiang, and Tianmen are classified as economy-lagged. The impact of social and economic activities on the eco-environment in these regions is still within the threshold of the carrying capacity of the eco-environment. The coupling degrees of Xiaogan (0.8944), Qianjiang (0.8999), and Tianmen (0.8998) are relatively high. However, the coupling and coordination development degrees of the three cities, which are 0.5325, 0.5681, and 0.5251, respectively, are not high. However, if the natural resources are overexploited in these regions, the carrying capacity of the eco-environment will decline, and the state of regional coordination will be broken. Therefore, coordinating the relationship between economic development and eco-environment construction is particularly important for these regions. As shown in Table 2, the quality of new-type urbanization of Huanggang (0.2247) is close to that of Xiaogan (0.2431), Qianjiang (0.2773), and Tianmen (0.2369), but the eco-environment carrying capacity of Huanggang (0.6135) is much higher than that of these three cities (from 0.3759 to 0.4399). Huanggang has rich ecological tourism resources and historical and cultural heritage, and it belongs to the Dabie Mountains Red Tourist Area [68]. Red tourism is a kind of tourism product with Chinese characteristics, which refers to various tourism resources related to the Chinese revolution and aims to promote patriotism and revolutionary spirit [69]. This indicates that Huanggang fails to make full use of rich natural resources, especially red tourism resources.
Fourth, Figure 5 shows that Xiantao is classified as on the edge of maladjustment. As shown in Table 2, the eco-environment carrying capacity of Xiantao is relatively high (0.5032), but the level of new-type urbanization is low (0.1905), which results in a lower degree of coupling and coordination development (0.4693). This suggests that many local resources have not been effectively utilized. The region should increase infrastructure investment and appropriately expand the scale of the city. At the same time, Xiantao should take advantage of local resource endowments to develop modern agriculture.
Finally, Figure 5 shows that Xianning is classified as having mild maladjustment. As shown in Table 2, the index of the eco-environment carrying capacity (0.6770) is much higher than the index of new-type urbanization (0.1300). The coupling degree (0.3064) and the coupling and coordination development degree (0.3433) in Xianning are the lowest in the Wuhan Metropolitan Area. In fact, with the unique superiority in agricultural and traveling resources, Xianning can develop ecological agriculture and ecological tourism to promote the development of urbanization. More significantly, since Xianning undertakes the dual functions of economic development and ecological conservation, it must protect natural conditions and the eco-environment as a precaution in case of the deterioration of the ecosystem.
5. Discussion
As mentioned in the introduction, this paper aimed to uncover the interactive coupling relationship between the eco-environment and new-type urbanization in the Wuhan Metropolitan Area from the perspective of the eco-environment carrying capacity. This research found that the spatial distribution of the eco-environment carrying capacity in the Wuhan Metropolitan Area was different. Some researchers have suggested that the carrying capacity is varied and dynamic and depends on resource endowments and the interaction between humans and the environment [48,70]. In fact, many subsystems of the earth, such as climate change, groundwater exploitation, and biodiversity loss, have reached or are approaching their natural limits [34,71,72]. Lifestyles and socioeconomic activities need to be coordinated with the finite carrying capacity and environmental conditions in different regions [47]. In addition, this paper confirms what previous studies have indicated that the character and quality of new-type urbanization vary greatly from region to region, and differentiated urbanization development models need to be adopted [73]. The level of new-type urbanization in the urban metropolitan area often presents a “dominant” situation, such as that found in the Central Plains [74].
Using the coupling degree and the coupling and coordination development degree, this paper analyzed the relationship between the two systems. It has been proved that the coupling and coordinated development degree is more suitable to analyze the coordination degree of the two systems in different regions than the coupling degree [62]. The value of the coupling degree is highly concentrated from 0.8 to 1, and it is more stable for measuring the coordination degree of the two systems by using the coupling and coordinated development degree [56]. Similarly, this research showed that the coupling degree of the Wuhan Metropolitan Area is mostly distributed between 0.8 and 0.9. The distribution of the coupling and coordinated development degree is more uniform than the coupling degree. In addition, by comparing the coupling degree and the coupling and coordination development degree of the nine cities in the Wuhan Metropolitan Area, it can be found that there is no positive correlation between the two values. The coupling degree does not necessarily match the coupling and coordination development degree, and the high coupling level does not necessarily lead to a high coupling coordination level. Many scholars have studied the relationship between human activities and the environment in different ways. Wang et al. [33] adopted the double-exponential curve to analyze the relationship between urbanization and the eco-environment and the results indicated that the relationship can be described as an inverted U-shaped curve, which is called “The inverted-U shape environmental Kuznets curve (EKC)” [75]. However, some studies have argued that the EKC is insufficient to describe the complexity of the relationship between environment and economic development [76]. Stevenson [77] has shown that the threshold is a key element for coupled human and natural systems and it provides a basis for developing natural resources and preventing catastrophic changes. In addition, various approaches have been used to build the model of coupling social–ecological systems (SES) to explore the interaction relationship between human activities and nature, which can generate the synergistic effect among disciplines related to systemic change [78,79]. But there is still a serious challenge in modeling systemic changes in of the SES—the model may need to be reconstructed if the system undergoes changes [80,81,82]. A number of new methods and theories have been proposed in recent years which provide a broader analytical perspective with respect to the interactive relationship between human activities and nature. For example, Liu et al. [83] proposed the concept of telecoupling that refers to the interaction between human activities and nature over distances.
This paper showed that the coupling and coordination development degree of the Wuhan Metropolitan Area is not high. Only Wuhan and Ezhou are classified as having moderate or elementary coordinated development. In some areas, the problem that the development of urbanization does not match the eco-environment carrying capacity exists. On the one hand, the resources cannot be effectively exploited and utilized in some regions. Some researchers argue that resource distribution and the flow of production factors are more efficient in the metropolitan area due to the advantage of the economies of scale [84]. However, local governments at all levels will inevitably consider their own benefits, such as GDP, fiscal revenue, and tax losses, which will lead to the failure of voluntary cooperation and the inefficient utilization of resources [85]. Although the National Plan on New-type Urbanization (2014–2020) has already provided specific guidance for all levels of government, including cooperation, the implementation of policy is a long-term process and has many obstacles. The Wuhan Metropolitan Area occupies a leading position and is now in a period of rapid growth where the gather function is stronger than the spreads function. This paper also showed that the overall urbanization development quality of the Wuhan Metropolitan Area is not high, and Wuhan plays a major role in population urbanization, economy urbanization, and space urbanization. In 2016, the National Development and Reform Commission (NDRC) supported Wuhan in beginning to building a national central city, which means that many labor, material, finance, and other elements with high quality will be transferred from other cities to Wuhan. The radiation effect of Wuhan on surrounding cities will also be weakened. Due to inadequate investment, superior characteristic industries of these regions, such as the hot spring tourism of Xianning and the red tourism of Huanggang, will not be fully developed. Therefore, it is important to implement differential industry strategies and appropriate urbanization development patterns for nine cities to coordinate resources among cities and avoid industrial convergence.
On the other hand, economic development exceeds the carrying capacity of the eco-environment in some regions. Since the idea of constructing a resource-saving and environmentally friendly society was put forward in 2007, the government of Hubei province has also made many attempts at industrial structure optimization, traffic network construction and regional coordination and communication mechanisms, such as the intercity railway of the Wuhan Metropolitan Area. The economies of surrounding cities rely on Wuhan and have had a certain degree of development, especially those of Ezhou and Huangshi. Due to geographic position, traffic conditions, industrial structure, and historical factors, Wuhan has a great impact on the social and economic development of Ezhou and Huangshi [86,87]. The results also support the view that the quality of urbanization in Ezhou and Huangshi is relatively high. However, environmental pollution in these regions is becoming increasingly serious, though the government pays less attention to environmental governance. For example, Ezhou is facing the greatest ecological pressure in the Wuhan Metropolitan Area, while its index of response is the lowest. Accordingly, how to solve the conflict between economic development and environmental protection is the key issue for these environment-lagged regions.
6. Conclusions
The Wuhan Metropolitan Area is now in a period of rapid growth. With the expansion of scale and space, many regions are also facing increasingly severe challenges related to resources and the environment. Therefore, this paper proposes corresponding policies from the aspects of coordinating the industrial division of labor, focusing on the eco-environment carrying threshold and strengthening policy guidance in an attempt to achieve the sustainable development of society, economy and eco-environment.
First, it is essential to clarify the development direction and function orientation of each city. The local industrial structure and the proper regional functional system must be established based on comparative advantage. The correlative and synergetic effect of industries should be fully developed to promote the coordinated development of Wuhan and surrounding cities. Second, due to the spatial heterogeneity of the eco-environment carrying capacity of the region, close attention should be paid to the threshold of the eco-environment carrying capacity and set up of the risk warning of the eco-environment for each city. A differentiated urbanization development strategy that is compatible with each city’s eco-environment carrying capacity should be formulated. Last, policy guidance from the government at all levels is needed. To properly utilize natural resources, differentiated development patterns, including the regional industrial layout and spatial development pattern, should be scientifically planned. The government should strengthen the connection between urban master planning and general land use planning between cities and the Wuhan Metropolitan Area.
This paper analyzes the interactive coupling relationship between the eco-environment carrying capacity and new-type urbanization in the Wuhan Metropolitan Area by using data from 2016. It can provide some recommendations for guiding rational urbanization development. However, the static coupling model cannot show the internal interaction of systems such as water, land, air and population, so the question of the internal structure of the systems remains to be discussed.
Author Contributions
M.S. had the original idea for the study; M.S. and C.H. conceived and designed this research; C.H. was responsible for data collecting; and C.H. and M.S. carried out the analyses and wrote the paper.
Acknowledgments
The authors acknowledge the funding received from the project “Differential Eco-compensation Mechanism for Farmland Protection under the Spatial Control of Land Use: Scale Dependence and Spatial difference (No. 71774174)” of the National Natural Science Foundation of China (NSFC).
Conflicts of Interest
The authors declare no conflict of interest.
References
- Lederbogen, F.; Kirsch, P.; Haddad, L.; Streit, F.; Tost, H.; Schuch, P.; Wüst, S.; Pruessner, J.C.; Rietschel, M.; Deuschle, M.; et al. City living and urban upbringing affect neural social stress processing in humans. Nature 2011, 474, 498–501. [Google Scholar] [CrossRef]
- Fang, C.; Liu, H.; Li, G. International progress and evaluation on interactive coupling effects between urbanization and the eco-environment. J. Geogr. Sci. 2016, 26, 1081–1116. [Google Scholar] [CrossRef] [Green Version]
- García-Nieto, A.P.; Geijzendorffer, I.R.; Baró, F.; Roche, P.K.; Bondeau, A.; Cramer, W. Impacts of urbanization around Mediterranean cities: Changes in ecosystem service supply. Ecol. Indic. 2018, 91, 589–606. [Google Scholar] [CrossRef] [Green Version]
- Peng, J.; Tian, L.; Liu, Y.; Zhao, M.; Hu, Y.; Wu, J. Ecosystem services response to urbanization in metropolitan areas: Thresholds identification. Sci. Total Environ. 2017, 607–608, 706–714. [Google Scholar] [CrossRef]
- Bengston, D.N.; Fletcher, J.O.; Nelson, K.C. Public policies for managing urban growth and protecting open space: Policy instruments and lessons learned in the United States. Landsc. Urban Plan. 2004, 69, 271–286. [Google Scholar] [CrossRef]
- Yue, W.; Liu, Y.; Fan, P. Measuring Urban Sprawl and Its Drivers in Large Chinese Cities: The Case of Hangzhou. Land Use Policy 2013, 31, 358–370. [Google Scholar] [CrossRef]
- He, C.; Zhang, D.; Huang, Q.; Zhao, Y. Assessing the potential impacts of urban expansion on regional carbon storage by linking the LUSD-urban and InVEST models. Environ. Model. Softw. 2016, 75, 44–58. [Google Scholar] [CrossRef]
- Mentens, J.; Raes, D.; Hermy, M. Green roofs as a tool for solving the rainwater runoff problem in the urbanized 21st century? Landsc. Urban Plan. 2006, 77, 217–226. [Google Scholar] [CrossRef]
- Lowe, M.R.; Peterson, M.S. Effects of Coastal Urbanization on Salt-Marsh Faunal Assemblages in the Northern Gulf of Mexico. Mar. Coast. Fish. 2014, 6, 89–107. [Google Scholar] [CrossRef] [Green Version]
- Ding, L.; Zhao, W.; Huang, Y.; Cheng, S.; Liu, C. Research on the Coupling Coordination Relationship between Urbanization and the Air Environment: A Case Study of the Area of Wuhan. Atmosphere 2015, 6, 1539–1558. [Google Scholar] [CrossRef] [Green Version]
- Wachsmuth, D.; Cohen, D.A.; Angelo, H. Expand the frontiers of urban sustainability. Nature 2016, 536, 391–393. [Google Scholar] [CrossRef]
- Mohan, M.; Kandya, A. Impact of urbanization and land-use/land-cover change on diurnal temperature range: A case study of tropical urban airshed of India using remote sensing data. Sci. Total Environ. 2015, 506–507, 453–465. [Google Scholar] [CrossRef] [PubMed]
- Cumming, G.S.; Buerkert, A.; Hoffmann, E.M.; Schlecht, E.; von Cramon-Taubadel, S.; Tscharntke, T. Implications of agricultural transitions and urbanization for ecosystem services. Nature 2014, 515, 50–57. [Google Scholar] [CrossRef]
- Guo, Q.; Liu, J.; Wang, T. Spatio-temporal distribution research on the ecological response of urbaniza-tion in Wuhan Metropolitan Area. China Popul. Resour. Environ. 2016, 26, 137–143. [Google Scholar]
- Reid, W.V.; Chen, D.; Goldfarb, L.; Hackmann, H.; Lee, Y.T.; Mokhele, K.; Ostrom, E.; Raivio, K.; Rockström, J.; Schellnhuber, H.J. Earth System Science for Global Sustainability: Grand Challenges. Science 2010, 330, 916–917. [Google Scholar] [CrossRef] [PubMed]
- Bonan, G.B.; Doney, S.C. Climate, ecosystems, and planetary futures: The challenge to predict life in Earth system models. Science 2018, 359, eaam8328. [Google Scholar] [CrossRef] [PubMed]
- Srinivasan, V.; Seto, K.C.; Emerson, R.; Gorelick, S.M. The impact of urbanization on water vulnerability: A coupled human-environment system approach for Chennai, India. Glob. Environ. Chang. 2013, 23, 229–239. [Google Scholar] [CrossRef]
- Grimm, N.B.; Faeth, S.H.; Golubiewski, N.E.; Redman, C.L.; Wu, J.; Bai, X.; Briggs, J.M. Global Change and the Ecology of Cities. Science 2008, 319, 756–760. [Google Scholar] [CrossRef]
- Kalnay, E.; Cai, M. Impact of urbanization and land-use change on climate. Nature 2003, 423, 528–531. [Google Scholar] [CrossRef]
- Paul, S.; Ghosh, S.; Mathew, M.; Devanand, A.; Karmakar, S.; Niyogi, D. Increased Spatial Variability and Intensification of Extreme Monsoon Rainfall due to Urbanization. Sci. Rep. 2018, 8, 3918. [Google Scholar] [CrossRef]
- Rodríguez-Echeverry, J.; Echeverría, C.; Oyarzún, C.; Morales, L. Impact of land-use change on biodiversity and ecosystem services in the Chilean temperate forests. Landsc. Ecol. 2018, 33, 439–453. [Google Scholar] [CrossRef]
- Li, J.; Zhou, Z.X. Natural and human impacts on ecosystem services in Guanzhong—Tianshui economic region of China. Environ. Sci. Pollut. Res. 2016, 23, 6803–6815. [Google Scholar] [CrossRef] [PubMed]
- Pickard, B.R.; Van Berkel, D.; Petrasova, A.; Meentemeyer, R.K. Forecasts of urbanization scenarios reveal trade-offs between landscape change and ecosystem services. Landsc. Ecol. 2017, 32, 617–634. [Google Scholar] [CrossRef]
- Kumar, P.; Masago, Y.; Mishra, B.K.; Fukushi, K. Evaluating future stress due to combined effect of climate change and rapid urbanization for Pasig-Marikina River, Manila. Groundw. Sustain. Dev. 2018, 6, 227–234. [Google Scholar] [CrossRef]
- Konar, M.; Evans, T.P.; Levy, M.; Scott, C.A.; Troy, T.J.; Vörösmarty, C.J.; Sivapalan, M. Water resources sustainability in a globalizing world: Who uses the water? Hydrol. Process. 2016, 30, 3330–3336. [Google Scholar] [CrossRef]
- Henderson, J.V.; Storeygard, A.; Deichmann, U. Has climate change driven urbanization in Africa? J. Dev. Econ. 2017, 124, 60–82. [Google Scholar] [CrossRef] [PubMed] [Green Version]
- Galletti, C.S.; Ii, B.L.T.; Myint, S.W. Land changes and their drivers in the cloud forest and coastal zone of Dhofar, Oman, between 1988 and 2013. Reg. Environ. Chang. 2016, 16, 1–13. [Google Scholar] [CrossRef]
- Liu, Y.; Yao, C.; Wang, G.; Bao, S. An integrated sustainable development approach to modeling the eco-environmental effects from urbanization. Ecol. Indic. 2011, 11, 1599–1608. [Google Scholar] [CrossRef]
- Shahbaz, M.; Loganathan, N.; Muzaffar, A.T.; Ahmed, K.; Jabran, M.A. How urbanization affects CO2 emissions in Malaysia? The application of STIRPAT model. Renew. Sustain. Energy Rev. 2016, 57, 83–93. [Google Scholar] [CrossRef]
- Pijanowski, B.C.; Tayyebi, A.; Doucette, J.; Pekin, B.K.; Braun, D.; Plourde, J. A big data urban growth simulation at a national scale: Configuring the GIS and neural network based Land Transformation Model to run in a High Performance Computing (HPC) environment. Environ. Model. Softw. 2014, 51, 250–268. [Google Scholar] [CrossRef]
- Zhou, C.; Feng, X.G.; Tang, R. Analysis and Forecast of Coupling Coordination Development among the Regional Economy-Ecological Environment-Tourism Industry—A Case Study of Provinces along the Yangtze Economic Zone. Economic Geography 2016, 32, 73–84. [Google Scholar]
- Chen, X.F.; Guo, J.F.; Yao, S.M. Study on the Coupling Between Ecological Capacity and New Urbanization in Yangtze River Delta Agglomeration: Based on the Leopold’s Earth Ethics. Resour. Environ. Yangtze Basin 2018, 4, 715–724. [Google Scholar]
- Wang, S.J.; Ma, H.; Zhao, Y.B. Exploring the relationship between urbanization and the eco-environment—A case study of Beijing–Tianjin–Hebei region. Ecol. Indic. 2014, 45, 171–183. [Google Scholar] [CrossRef]
- Rockström, J.; Steffen, W.; Noone, K.; Persson, A.; Lambin, E.; Lenton, T.; Scheffer, M.; Folke, C.; Schellnhuber, H. A safe operating space for humanity. Nature 2009, 461, 472–475. [Google Scholar] [CrossRef] [PubMed] [Green Version]
- Steffen, W.; Richardson, K.; Rockström, J.; Cornell, S.E.; Fetzer, I.; Bennett, E.M.; Biggs, R.; Carpenter, S.R.; Vries, W.D.; Wit, C.A.D. Planetary boundaries: Guiding human development on a changing planet. Science 2015, 347, 1259855. [Google Scholar] [CrossRef] [PubMed]
- Ready, R.C.; Bishop, R.C. Endangered Species and the Safe Minimum Standard. Am. J. Agric. Econ. 1991, 73, 309–312. [Google Scholar] [CrossRef]
- Gao, J.X. The basic theoretical exploration of regional ecology. China Environ. Sci. 2013, 33, 1252–1262. [Google Scholar]
- McKinney, S.A.; Joo, C.; Taekjip, H. Analysis of Single-Molecule FRET Trajectories Using Hidden Markov Modeling. Biophys. J. 2006, 91, 1941–1951. [Google Scholar] [CrossRef]
- Lambin, E.F.; Meyfroidt, P. Global land use change, economic globalization, and the looming land scarcity. Proc. Natl. Acad. Sci. USA 2011, 108, 3465–3472. [Google Scholar] [CrossRef] [Green Version]
- Van Vuuren, D.P.; Bayer, L.B.; Chuwah, C.; Ganzeveld, L.; Hazeleger, W.; Hurk, B.V.D.; Van Noije, T.; Oneill, B.; Strengers, B.J. A comprehensive view on climate change: Coupling of earth system and integrated assessment models. Environ. Res. Lett. 2012, 7, 24012–24021. [Google Scholar] [CrossRef]
- Chan, K.W.; Hu, Y. Urbanization in China in the 1990s: New Definition, Different Series, and Revised Trends. China Rev. 2003, 3, 49–71. [Google Scholar]
- Rees, W.E. Revisiting carrying capacity: Area-based indicators of sustainability. Popul. Environ. 1996, 17, 195–215. [Google Scholar] [CrossRef]
- Foley, J.; Defries, R.; Asner, G.; Barford, C.; Bonan, G.; Carpenter, S.; Chapin, F.; Coe, M.; Daily, G.; Gibbs, H. Global consequences of land use. Science 2005, 309, 570–574. [Google Scholar] [CrossRef] [PubMed]
- Saha, N.; Rahman, M.S.; Ahmed, M.B.; Zhou, J.L.; Ngo, H.H.; Guo, W. Industrial metal pollution in water and probabilistic assessment of human health risk. J. Environ. Manag. 2017, 185, 70–78. [Google Scholar] [CrossRef] [PubMed]
- Griggs, D.; Stafford-Smith, M.; Gaffney, O.; Rockström, J.; Ohman, M.C.; Shyamsundar, P.; Steffen, W.; Glaser, G.; Kanie, N.; Noble, I. Sustainable development goals for people and planet. Nature 2013, 495, 305–307. [Google Scholar] [CrossRef] [PubMed]
- Gao, J.; Qiao, R. Analysis on variation in farmers welfare after rural-urban land conversion. China Popul. Resour. Environ. 2011, 21, 99–105. [Google Scholar]
- Lane, M. The carrying capacity imperative: Assessing regional carrying capacity methodologies for sustainable land-use planning. Land Use Policy 2010, 27, 1038–1045. [Google Scholar] [CrossRef] [Green Version]
- Arrow, K.; Bolin, B.; Costanza, R.; Dasgupta, P.; Folke, C.; Holling, C.S.; Jansson, B.O.; Levin, S.; Maler, L.G.; Perrings, C. Economic Growth, Carrying Capacity, and the Environment. Science 1996, 1, 104–110. [Google Scholar]
- Fang, C.; Zhou, C.; Wang, Z. Sustainable development strategy and priorities of spatially differentiated development of urban agglomerations along the Yangtze River Economic Belt. Prog. Geogr. 2015, 34, 1398–1408. [Google Scholar]
- Sun, L.; Xing, X.; Zhou, D. The improvement of entropy methods. Stat. Decis. 2010, 21, 153–154. [Google Scholar]
- Zhu, X.; Wei, G. Discussion on the fine standard of dimensionless method in entropy method. Stat. Decis. 2015, 12, 12–15. [Google Scholar]
- Wolfslehner, B.; Vacik, H. Evaluating sustainable forest management strategies with the Analytic Network Process in a Pressure-State-Response framework. J. Environ. Manag. 2008, 88, 1–10. [Google Scholar] [CrossRef] [PubMed]
- Sekovskia, I.; Dennison, W.C. Megacities in the coastal zone: Using a driver-pressure-state-impact-response framework to address complex environmental problems. Estuar. Coast. Shelf Sci. 2012, 96, 48–59. [Google Scholar] [CrossRef]
- Hughey, K.F.; Cullen, R.; Kerr, G.N.; Cook, A.J. Application of the pressure-state-response framework to perceptions reporting of the state of the New Zealand environment. J. Environ. Manag. 2004, 70, 85–93. [Google Scholar] [CrossRef]
- Pirrone, N.; Trombino, G.; Cinnirella, S.; Algieri, A.; Bendoricchio, G.; Palmeri, L. The Driver-Pressure-State-Impact-Response (DPSIR) approach for integrated catchment-coastal zone management: Preliminary application to the Po catchment-Adriatic Sea coastal zone system. Reg. Environ. Chang. 2005, 5, 111–137. [Google Scholar] [CrossRef]
- Ma, L.; Niu, S.; Li, Y. Quantitative analysis of coupling between urbanization and ecological environ-ment in Gansu Province. Urban Dev. Stud. 2010, 17, 52–58. [Google Scholar]
- Peng, J.; Wu, J.; Pan, Y.; Han, Y. Evaluation for Regional Ecological Sustainability Based on PSR Model: Conceptual Framework. Prog. Geogr. 2012, 31, 933–940. [Google Scholar]
- Shan, Z.; Huang, Y. An Analysis of the Concept, Goals, Contents, Planning Strategies and Misunderstandings of New-type urbanization. Urban Plan. Forum 2013, 2, 16–22. [Google Scholar]
- Cao, W.; Zhang, X.; Yiyong, P.; Zhang, C. Coordinate Development among Population, Land and Economy Urbanization in Developed Area: The Case of Jiangsu Province. China Popul. Resour. Environ. 2012, 4, 141–146. [Google Scholar]
- Wang, L.; Li, J. Quality Evaluation and Mechanism of Capital City Urbanization in North-West China Based on New Urbanization. Econ. Geogr. 2014, 34, 55–61. [Google Scholar]
- Siciliano, G. Urbanization strategies, rural development and land use changes in China: A multiple-level integrated assessment. Land Use Policy 2012, 29, 165–178. [Google Scholar] [CrossRef]
- Liao, C. Quantitative judgement and classification system for coordinated development of environment and economy: A case study of the City Group in the Pearl River Delta. Trop. Geogr. 1999, 19, 171–177. [Google Scholar]
- Liu, Y.; Song, X. Coupling degree model and its forecasting model of urbanization and ecological environment. J. China Univ. Min. Technol. 2005, 34, 91–96. [Google Scholar]
- Lu, J.; Chang, H.; Wang, Y. Dynamic evolution of provincial energy economy and environment coupling in China’s regions. China Popul. Resour. Environ. 2017, 27, 60–68. [Google Scholar]
- Gao, J. The exploration of essential theories about regional ecology. Chin. Sci. Bull. 2018, 63, 693–700. (In Chinese) [Google Scholar] [CrossRef]
- Jenks, G.F. The Data Model Concept in Statistical Mapping. Int. Yearb. Cartogr. 1967, 7, 186–190. [Google Scholar]
- Yao, X.; Zeng, J.; Li, W. Spatial correlation characteristics of urbanization and land ecosystem service value in Wuhan Urban Agglomeration. Trans. Chin. Soc. Agric. Eng. 2015, 31, 249–256. [Google Scholar]
- Chen, L.J.; Zhen-Tang, K.E.; Wang, J.S. Investigation, Evaluation and Exploitation of Red Tourism Resources in Huanggang City. Hubei Agric. Sci. 2012, 51, 5517–5520. [Google Scholar]
- Yin, X.Y.; Hong, Z.; Gan, M.Y. Study on product characteristics and developing modes of red tourism. Hum. Geogr. 2005, 2, 34–37. [Google Scholar]
- Wang, W.; Zhang, T.; Wang, X.; Wen, C. Spatial and temporal pattern of urban ecological carrying capacity in Yangtze River Economic Zone. Resour. Environ. Yangtze Basin 2017, 26, 1963–1971. [Google Scholar]
- Vörösmarty, C.J.; Mcintyre, P.B.; Gessner, M.O.; Dudgeon, D.; Prusevich, A.; Green, P.; Glidden, S.; Bunn, S.E.; Sullivan, C.A.; Liermann, C.R. Global threats to human water security and river biodiversity. Nature 2010, 467, 555–561. [Google Scholar] [CrossRef] [PubMed] [Green Version]
- Running, S. A measurable planetary boundary for the biosphere. Science 2012, 337, 1458–1459. [Google Scholar] [CrossRef] [PubMed]
- Fang, C.; Ma, H.; Wang, J. A Regional Categorization for “New-Type Urbanization” in China. PLoS ONE 2015, 10, e0134253. [Google Scholar] [CrossRef] [PubMed]
- Cu, M. The relationship of coupling coordination between urbanization and eco-environment—A case of urban cluster in the Central Plains. Econ. Geogr. 2015, 35, 72–78. [Google Scholar]
- Dinda, S. Environmental Kuznets Curve Hypothesis: A Survey. Ecol. Econ. 2004, 49, 431–455. [Google Scholar] [CrossRef] [Green Version]
- Kijima, M.; Nishide, K.; Ohyama, A. Economic models for the environmental Kuznets curve: A survey. J. Econ. Dyn. Control 2010, 34, 1187–1201. [Google Scholar] [CrossRef]
- Stevenson, R.J. A revised framework for coupled human and natural systems propagating thresholds and managing environmental problems. Phys. Chem. Earth 2011, 36, 342–351. [Google Scholar] [CrossRef]
- Reinette, B.; Carpenter, S.R.; Brock, W.A. Turning back from the brink: Detecting an impending regime shift in time to avert it. Proc. Natl. Acad. Sci. USA 2009, 106, 826–831. [Google Scholar] [Green Version]
- Staver, A.C.; Archibald, S.; Levin, S. Tree cover in sub-Saharan Africa: Rainfall and fire constrain forest and savanna as alternative stable states. Ecology 2011, 92, 1063–1072. [Google Scholar] [CrossRef]
- Beck, M.B. Environmental foresight and structural change. Environ. Model. Softw. 2005, 20, 651–670. [Google Scholar] [CrossRef]
- Polhill, J.G.; Filatova, T.; Voinov, A. Modelling systemic change in coupled socio-environmental systems. Environ. Model. Softw. 2016, 75, 318–332. [Google Scholar] [CrossRef]
- Filatova, T.; Polhill, J.G.; Ewijk, S.V. Regime shifts in coupled socio-environmental systems: Review of modelling challenges and approaches. Environ. Model. Softw. 2015, 75, 333–347. [Google Scholar] [CrossRef]
- Liu, J.; Hull, V.; Batistella, M.; Defries, R.; Dietz, T.; Fu, F.; Hertel, T.; Cesar Izaurralde, R.; Lambin, E.F.; Li, S.; et al. Framing Sustainability in a Telecoupled World. Ecology and Society 2013, 36, 7870–7885. [Google Scholar] [CrossRef]
- Newton, K. Is small really so beautiful? Is big really so ugly? Size, effectiveness, and democracy in local government. Polit. Stud. 2010, 30, 190–206. [Google Scholar] [CrossRef]
- Basolo, V. US Regionalism and Rationality. Urban Stud. 2003, 40, 447–462. [Google Scholar] [CrossRef]
- Sun, B.; Li, X.; Zhang, Y. Research on multi-center collaborative development of Wuhan City Circle. Reg. Econ. Rev. 2016, 6, 86–91. [Google Scholar]
- Li, X.; Sun, B. Regional integration of the Yangtze River middle reaches urban agglomerations: Measuring and comparison. Resour. Environ. Yangtze Basin 2013, 22, 996–1103. [Google Scholar]
Figure 1.
Study area.

Figure 2.
The coupling relationship between the eco-environment carrying capacity and urbanization.

Figure 3.
Spatial distribution of the eco-environment carrying capacity with each dimension in the Wuhan Metropolitan Area. (a) Pressure (b) State (c) Response (d) The eco-environment carry capacity.
Figure 3.
Spatial distribution of the eco-environment carrying capacity with each dimension in the Wuhan Metropolitan Area. (a) Pressure (b) State (c) Response (d) The eco-environment carry capacity.

Figure 4.
Spatial distribution of new-type urbanization with each dimension in the Wuhan Metropolitan Area. (a) Population urbanization (b) Economy urbanization (c) Space urbanization (d) Social urbanization (e) Urban-Rural integration (f) New-type urbanization.
Figure 4.
Spatial distribution of new-type urbanization with each dimension in the Wuhan Metropolitan Area. (a) Population urbanization (b) Economy urbanization (c) Space urbanization (d) Social urbanization (e) Urban-Rural integration (f) New-type urbanization.

Figure 5.
The spatial distribution of the coupling and coordination development degree in the Wuhan Metropolitan Area.
Figure 5.
The spatial distribution of the coupling and coordination development degree in the Wuhan Metropolitan Area.


Table 1.
Evaluation index system of the eco-environment carrying capacity and new-type urbanization.
Table 1.
Evaluation index system of the eco-environment carrying capacity and new-type urbanization.
| System | First Grade Index | Basic Grade Index | Weight |
|---|---|---|---|
| Eco-environment Carrying capacity | Pressure | Energy consumption (tons of standard coal) per 104 Yuan output value | 0.0538 |
| Water consumption per 104 Yuan worth of GDP (m3) | 0.0776 | ||
| Discharged volume of industrial SO2 per capita (kg/capital) | 0.0606 | ||
| Discharge of wastewater per capita (ton/capital) | 0.0398 | ||
| Land deterioration index (%) | 0.0517 | ||
| Fertilizer use intensity (kg/hm2) | 0.0287 | ||
| Value of noise pollution (db) | 0.0652 | ||
| State | Per capita water resources (m3/person) | 0.0655 | |
| Per capita agricultural land (m2/capital) | 0.0423 | ||
| Organism abundance index (%) | 0.1100 | ||
| Vegetation cover index (%) | 0.0443 | ||
| Rivers density index (%) | 0.0938 | ||
| Proportion of days with good air quality (%) | 0.0557 | ||
| Response | Sewage treatment rate (%) | 0.0377 | |
| Industrial solid waste comprehensively rate (%) | 0.0456 | ||
| Garbage harmless treatment rate (%) | 0.1023 | ||
| Proportion of environmental protection expenditure to GDP (%) | 0.0252 | ||
| New-type Urbanization | Population urbanization | Proportion of the urban population to the total population (%) | 0.0404 |
| Urban population density (persons/km2) | 0.0751 | ||
| Economy urbanization | Per capita GDP (Yuan) | 0.0567 | |
| Proportion of the value of the secondary and tertiary industry to GDP (%) | 0.0302 | ||
| Proportion of the added value of the high-tech industry in GDP (%) | 0.0876 | ||
| Proportion of foreign investment actually utilized to GDP (%) | 0.0728 | ||
| Space urbanization | Proportion of built-up areas to urban areas (%) | 0.0729 | |
| Per-unit area financial revenue (104 Yuan/km2) | 0.1720 | ||
| Per-unit area investment in fixed assets (104 Yuan/km2) | 0.0892 | ||
| Social urbanization | Proportion of public security and employment expenditure to financial expenditure (%) | 0.0851 | |
| Proportion of education expenditure to GDP (%) | 0.0423 | ||
| Numbers of sickbeds per 104 persons | 0.0281 | ||
| Gas utilization rate (%) | 0.0316 | ||
| Urban–rural integration | Ratio of urban households’ to rural households’ per capita disposable income (%) | 0.0627 | |
| Ratio of urban households’ to rural households’ per capita consumption expenditure (%) | 0.0287 | ||
| Ratio of urban households’ to rural households’ Engel coefficient (%) | 0.0246 |
Notes: The indexes of Pressure are negative.
Table 2.
Criteria and types of the coupling and coordination development degree.
| Type | Value Interval (D) | Subtype |
|---|---|---|
| The coordinated development | 0.9001–1.0000 | The best coordinated development |
| 0.8001–0.9000 | The good coordinated development | |
| 0.7001–0.8000 | The moderate coordinated development | |
| 0.6001–0.7000 | The elementary coordinated development | |
| Excess | 0.5001–0.6000 | The reluctant coordinated development |
| 0.4001–0.5000 | The edge of maladjustment | |
| Maladjustment | 0.3001–0.4000 | The mild maladjustment |
| 0.2001–0.3000 | The moderate maladjustment | |
| 0.1001–0.2000 | The severe maladjustment | |
| 0.0000–0.1000 | The extreme maladjustment |
Table 3.
Comprehensive index and coupling degree of the eco-environment carrying capacity and new-type urbanization in the Wuhan Metropolitan Area.
Table 3.
Comprehensive index and coupling degree of the eco-environment carrying capacity and new-type urbanization in the Wuhan Metropolitan Area.
| Region | Eco-Environment Carrying Capacity f(x) | New-Type Urbanization g(y) | The Coupling Degree C | The Overall Benefit T | The Coupling and Coordination Development Degree D |
|---|---|---|---|---|---|
| Wuhan | 0.4269 | 0.8021 | 0.8223 | 0.6145 | 0.7108 |
| Huangshi | 0.5352 | 0.3081 | 0.8602 | 0.4216 | 0.6023 |
| Ezhou | 0.3149 | 0.3512 | 0.9941 | 0.3330 | 0.5754 |
| Xiaogan | 0.3909 | 0.2431 | 0.8944 | 0.3170 | 0.5325 |
| Huanggang | 0.6135 | 0.2247 | 0.6161 | 0.4191 | 0.5082 |
| Xianning | 0.6770 | 0.1300 | 0.2921 | 0.4035 | 0.3433 |
| Xiantao | 0.5032 | 0.1905 | 0.6349 | 0.3469 | 0.4693 |
| Qianjiang | 0.4399 | 0.2773 | 0.8999 | 0.3586 | 0.5681 |
| Tianmen | 0.3759 | 0.2369 | 0.8998 | 0.3064 | 0.5251 |
© 2018 by the authors. Licensee MDPI, Basel, Switzerland. This article is an open access article distributed under the terms and conditions of the Creative Commons Attribution (CC BY) license (http://creativecommons.org/licenses/by/4.0/).
Share and Cite
MDPI and ACS Style
Song, M.; Hu, C. A Coupling Relationship between the Eco-Environment Carrying Capacity and New-Type Urbanization: A Case Study of the Wuhan Metropolitan Area in China. Sustainability 2018, 10, 4671. https://doi.org/10.3390/su10124671
AMA Style
Song M, Hu C. A Coupling Relationship between the Eco-Environment Carrying Capacity and New-Type Urbanization: A Case Study of the Wuhan Metropolitan Area in China. Sustainability. 2018; 10(12):4671. https://doi.org/10.3390/su10124671
Chicago/Turabian StyleSong, Min, and Can Hu. 2018. "A Coupling Relationship between the Eco-Environment Carrying Capacity and New-Type Urbanization: A Case Study of the Wuhan Metropolitan Area in China" Sustainability 10, no. 12: 4671. https://doi.org/10.3390/su10124671
Note that from the first issue of 2016, this journal uses article numbers instead of page numbers. See further details here.