Abstract
Land price sustainability issues have been addressed by many authors in the past. Most of these researchers used land prices (from land price maps) as the primary data source in their studies. Only a few papers analysed official land price maps, which are available very rarely. For this reason, we studied the spatial and temporal changes of land prices in the city of Olomouc based in an analysis of official land price maps from 1993 to 2017. We proposed several research hypotheses to confirm some general statements about land price changes. We concluded that some economic indicators had a significant impact on changes in land prices. In the residential and commercial areas and historical centre, land prices are significantly higher than in other monitored aspects (land-use types). We also concluded that no link existed between land-use stability and land price stability. Surprisingly, no long-term stable areas were found in the area of interest. The analysis also confirmed that land price and its change over time varied in different spatial aspects. Unexpectedly, the smallest influence was reflected in the economic aspect. Regarding natural events in recent decades, we observed a significant drop in land prices in the vicinity of watercourses threatened by flooding. These findings can assist in better understanding local development and changes in land price. The results of this study can help in gaining better understanding of economic, social, and environmental aspects of sustainability of land price changes.
1. Introduction
1.1. Land Price Sustainability
Land price plays an important role in guiding land resource allocation for urban planning and development, particularly in big cities of fast developing countries where infrastructures and populations change frequently [1]. This is one of the main reasons why land price sustainability issues have been previously addressed by other authors (e.g., [2,3]). The research centres on issues linked to land price volatility [4,5], inflation [3], structure [6], changes [7,8,9], and factors influencing land price [1,10,11,12]. An estimation of the effect of environmental factors on the real estate prices caused by environmental change has been analysed in the research of Del Giudice and Massimo [13,14]. Their case study deals with noise pollution influence on residential units. The result of econometric analysis proves that real estate price is reduced by the negative quality of living, here represented by noise pollution. The specific research field deals with predictive models [15], implementation of GIS (Geographic Information System) software [16], and many others [17].
Regarding the city sustainability, price map plays an undeniable role, when information about real estate and its price is essential for fast decision-making. For that reason, price information can be used not only for private purposes but also at a level of policy-making potential. Integration with the concept of smart cities should be considered—sophisticated ICT technologies, which enables communication between the important authorities, are a crucial basis of smart cities. Relevant questions dealing with the smart-cities concept in conjunction with sustainability and planning are discussed by Lytras and Visvizi [18,19].
Researchers in the Czech Republic studied land prices after the Velvet Revolution in 1989. After 40 years of communism, ownership of land was returned in restitution processes to the original owners (or their descendants), and prices started to grow rapidly. Almost all Czech studies have looked at general housing prices issues or land price analysis at the regional or state level (e.g., [20]). Lux and Musil [21,22,23] studied the housing system and its development during the transition period. Sklenička et al. [24] focused their research on farmland prices; Temelová et al. [25] elaborated on housing estate issues that are associated with segregation. Other researchers examined price bubbles and their determinants in the Czech Republic [26] and compared the housing system to those in other countries [20].
Another area of research investigated land price maps of building parcels. Official land price maps are essential documents that influence and control the real estate market in the big cities of the Czech Republic. They are one of the most critical aspects of a city’s economy for entrepreneurs and citizens. Land price map analysis in the Czech Republic has been pursued by only a few authors [27,28,29,30,31,32,33]. Dobiášová [27] compared the price maps of selected European Union (EU) countries, Chrudimská [28] and Pászto et al. [32] proposed a new procedure for updating the land price map of Olomouc in the ArcGIS for Desktop software. Emphasis was placed on the technological process, which would automate and improve the efficiency of processing land price maps. Šindelářová [33] and Kovaříková [30] also analysed price maps, describing the changes and practical use of price maps in the Czech Republic while using the price maps of Brno and Olomouc. The land price map in relation to rent was discussed in a PhD thesis [31]. The author investigated the relationship between land rent and price in price maps of the Czech Republic. The author questioned whether it was possible to use this to determine the rental price of similar plots in the same way as with price maps. According to Kubíček [31], with a sufficient amount of quality data it would be possible to set a coefficient for price conversion in the price map to the rental price of the land.
Only a few authors performed a detailed analysis of land price at a local level (municipality) [29,33]. This is surprising, because local studies can explain many connections, relationships, and dependencies that are not visible at a national level. This is due to the fact that only a few cities in the Czech Republic produce land price maps as the primary land price data source. For this reason, we decided to perform an in-depth analysis of land prices in the city of Olomouc, which has produced land price maps since 1993. This issue has not been previously studied and it is currently highly relevant because land prices in Olomouc (100,494 population in 2018) are the third highest in the Czech Republic after Brno (379,527 population in 2018) and Prague (1,294,513 population in 2018) [34,35]. This is mainly explained by the high attractiveness of Olomouc (UNESCO heritage, quiet city, high standard of living), which is, however, in contrast to average regional salaries (third lowest in the Czech Republic) [2].
Based on these findings, our study examined the spatial and temporal changes of land prices in Olomouc by analysing the official land price maps from 1993 to 2017. For this purpose, the following research hypotheses were proposed: (1) Changes of land prices are dependent on macro-economic indicators; (2) The highest increase in land prices can be observed in residential and commercial areas and the historical city centre; (3) Stable areas exist (comparable to stabilized land-use) where land prices do not change over time; and, (4) Land price sustainability is influenced by spatial factors (environmental, economic, and social). To test these hypotheses, we performed spatial (overlay) and regression analysis. To analyse the possible dependencies between economic, social, and demographic indicators, methods of correlation, and regression analysis were used. This approach could help for better understanding of economic, social, and environmental aspects of sustainability of land price changes.
1.2. Land Price Maps in the Czech Republic
Two land price sources can be found in the Czech Republic in the form of official or unofficial land price maps. The official land price map (land price map of building plots) is defined by the relevant legislation ([36,37]) and its acquisition and updating is maintained by the respective municipality. This type of map displays the prices of building plots and it is created according to prices in purchase contracts (managed by the regional cadastral offices) and is modified according to the type of land and its other characteristics.
According to Act No. 151/1997 Coll. [36], the land price map is defined as a graphical representation of land price and building plots in the territory of a municipality with a scale of 1: 5000 or more detailed level. Building parcels on the price map are valued by the actually negotiated prices contained in the purchase contracts (base price), although it is not always possible to value all parcels. In some cases, it is not possible to determine an actual price or the price data is out of date or not comparable to the prices of similar parcels (too high or too low price). Very heterogeneous prices on adjacent parcels may also cause problems. In this case, prices are determined by the prices of comparable parcels in the municipality or a similar municipality (according to the legislation, [37]). A comparable parcel means land that is intended for the same use and is located in a similar location as the parcel being valued. The final price of a building parcel is calculated as a multiple of the base price of the group of land to which it belongs and its total area in square metres. The price of the parcel is then increased by the price of the building(s) standing on the parcel and by the price of green areas. The price map does not include prices of agricultural or forested land or water areas. Information about the parcel is taken from the Land Register of the Czech Republic.
The land price map is updated at the end of each year by adding new prices of land parcels. After the price map is processed, the municipality is obliged to submit a proposal to the Ministry of Finance of the Czech Republic, which subsequently publishes it in the Price Bulletin. Any citizen can see the content of the price map of a given municipality free of charge. The land price map serves as a basis for evaluating issues that are addressed by court experts, banks, or government officials.
Land price maps have been created in the Czech Republic since 1991 for 54 municipalities, but many municipalities have ceased this activity due to fluctuating prices and the need for regular updates. Eight municipalities in the Czech Republic have created more than ten price maps. Most of these were published in Ostrava (18), Prague (21), and Olomouc (21). Currently (3 October 2018), price maps are valid only in seven municipalities in the Czech Republic.
Besides the price maps governed by law, several unofficial price maps (e.g., [38]) are also available and are usually created by real estate agencies who process them very individually. These maps, however, do not show land prices but rather the average prices of apartments and houses or rents. Data sources are most often recorded by real estate agencies from achieved sales or rentals. The validity of these maps is not guaranteed by law and depends only on the quality of processing [33]. Access to these maps often requires payment.
1.3. Land Price Map of the City of Olomouc
The first land price map of Olomouc was created in 1939 because people had foreknowledge of the Second World War. During the 1930s, many Czech people invested their money primarily in real estate, which caused a disproportionate increase in land prices. The government was therefore forced to fix prices at the level current at the time, which was subsequently taken into account in a price map to prevent further price increases. After the Second World War, land price maps were not used, and city development was mainly based on master plans [39,40]. The first modern land price map of Olomouc was created in 1993. The city was divided into zones according to the character and function of individual areas. For these zones, the average purchase price (base price) was used to calculate the actual price of a parcel. For each zone type, the coefficients were defined to multiply the base price. This procedure was based on the relevant legislation and has been preserved to this day, except for 1993, 1995, 1996, 2000, and 2002, when the price map was not updated because of minimal changes. The only significant difference in the pricing methodology was in connection with parcels that had not been valued. These are predominantly areas used for public administration, education, culture, health, security, defence, communications, and other technical equipment that practically do not change ownership and their price cannot be determined regularly.
In total, 21 price maps were created in Olomouc between 1993 and 2017. Since 2006, they have been created digitally (CAD and GIS) and are also published via the web map application that is available at http://apps.hfbiz.cz/apps/olomouc/cm/.
2. Data and Methods
2.1. Used Datasets
As our primary data source, official land price maps of the city of Olomouc in a scale of 1:5000 were used. The maps cover the whole Olomouc area (100,494 population; 103.4 km2). The city is the regional capital of the Olomouc Region. Land price maps from the period 1993–2005 are available only in analogue format (each map comprises 36–39 map sheets), and it was necessary to digitize them. Because digitization is extremely time-consuming, two representative time periods were selected (1993 and 1999). Data from 1993 represents the first available analogue data set, the year 1999 was selected in the middle of the period between 1993–2006. Land price maps from the period 2006–2017 are available in vector format (dgn), and all of them were used for the analysis.
In order to digitize and georeference analogue land price maps, cadastral maps from the comparable period were used. In order to analyze different land-use types, the master plans of the city of Olomouc from 1999 and 2016 were used. Master plans (land-use types, flood areas, evaluated soil ecological units, urban conservation areas, urban conservation zones), cadastral maps, and land price maps were obtained from the Magistrate of the City of Olomouc (Department of Research and Development).
For the statistical analysis, the following data sources were used: Czech Statistical Office—Statistical Yearbook of the Olomoucký Region [41], Statistics on Income and Living Conditions [42]; Czech National Bank—CNB official discount rates [43].
Details of the variables presented in the Table 1 are as follows: “Land price”—in Olomouc in CZK per square metre, calculated as a median of all prices of all land in Olomouc in certain years in the period 2006–2016; “GDP”—per capita in CZK per year, Olomouc Region [41]; “Income”—total net income per capita in CZK per year in municipalities with a population of 100,000+ [42]; “Unemployment”—number of unemployed people in thousands, Olomouc Region [41]; “Discount”—average discount rate per year, Czech Republic [43]; “Population”—number of inhabitants, district of Olomouc [41]; “Started flats”—number of started flats, district of Olomouc [41]; “Finished flats—number of finished flats, district of Olomouc [41]; “Econ. subjects”—registered economic entities (31 December), district of Olomouc [41]; “Year”—the period 2006–2016.

Table 1.
Descriptive Statistics—Correlation and Regression Analyses.
2.2. Data Processing
As mentioned above, land price maps were available in vector and analogue (printed) format. Data in digital format (dgn files) from 2006–2016 (11 layers) were imported into the spatial geodatabase in GIS. Analogue land price maps (maps from 1993 and 1999) were georeferenced (each map comprised 36–39 map sheets) and digitized. Historical cadastral maps from suitable years were used for georeferencing. The output polygons of land price maps were checked and repaired by using topology rules in ArcGIS for Desktop, and the final layers were imported into the spatial geodatabase of all land price maps.
Comparing the absolute values of land prices over the 15-year period was not appropriate. In such a timeframe, the impact of inflation must also be taken into account to make the prices between the years comparable. Inflation is a general rise in the price level in the economy—the value of the same amount of goods in the time interval changes, mostly upwards. This change in price level needs to be included in any analysis and the original absolute value of land prices over the reference period must be adjusted [44]. Inflation is monitored through several indexes, such as the consumer price index or the product price index. The CZSO monitors these in the Czech Republic. The calculated values of the average annual index were used to adjust land prices to a comparable level. The year 2016 was chosen as the reference year, and all other years across all dates were recalculated to produce a time series of comparable values.
2.3. Data Analysis
2.3.1. Spatial Analysis
Several basic statistical characteristics were calculated from the available data: mean, median, and mode. For the reasons given above, the same quantity of priced parcels was not available for each time interval. The number of valued parcels in the years had decreased from 44% to 28%. Medium-value indicators have served as a general tool for assessing land price changes over the past 15 years.
For spatial analysis of the changes of the land price map in Olomouc, the data were modified with overlay operations to be able to monitor the changes of land price at each location. Only three years were selected for spatial analyses: 1993, 2006, and 2016. These years have approximately the same time interval. Adding additional years would increase the number of unvalued parcels obtained by overlay operations. Using a GIS tool, a new layer was created to aggregate changes in the periods 1993–2006 and 2006–2016. This processing tool performs the geometric union of all input layers. The result contains information from all inputs, which allowsfor the changes in every part of the original area of interest to be analysed. Since not all parcels in the input data were valued, it was necessary to remove those areas where price for one of the years was absent. A total of 5020 new areas with an area of 4109 ha were created, of which 1999 ha (48.7%) were valued in all three years. In these areas, land prices were analysed to identify stable/changing sites. These were subsequently classified into synthetic classes describing the changes of land prices in years.
2.3.2. Regression Analysis
For the purposes of analysing possible dependencies between economic, social, and demographic indicators, methods of correlation and regression analysis were used. Since suitable data are not available for all years in the period 1993–2016 and both statistical methods are based on a regular time period, we used the data for the period 2006–2016.
Correlation analysis serves as a means for observing possible relationships between certain variables, mainly if a statistically significant positive or negative relationship exists. A Pearson correlation coefficient was therefore used.
The second step required a more complex model to be created in order to include all possible variables at once and to detect any variable(s) within the model, which could be important in increasing the land price in the selected region. Based on this key idea and the results that were obtained from the correlation analysis, different regression models were tested. For the purposes of our analysis, three regression models MOD1, MOD2, and MOD3 are presented. Certain models differ in parts of independent variables, while the dependent variable is the same in all tested models. MOD3 represents the most suitable model, MOD1 and MOD2 represent other selected models for the purposes of comparing and evaluating certain possibilities that include possible independent variables. MOD1 is based on indicators connected mainly with households and their behaviour, MOD2 represents the shorter version of MOD1, based on only statistically significant variables and MOD3 represents the model with no multicollinearity problems, no autocorrelation, and high statistical significance of selected variables. Detailed characteristics of regression models are as follows.
MOD1
where β0…β8 represent regression coefficients that can show the influence of independent variables on a dependent variable. Dependent variable Y is represented by land price in Olomouc in CZK per square metre, calculated as a median of all prices of all land in Olomouc in certain years of the period 2006–2016. Variable u represents a dummy variable. MOD1 is based on the following independent variables:
𝑌 = 𝛽0 + 𝛽1𝑋1 + 𝛽2𝑋2 + 𝛽3𝑋3 + 𝛽4𝑋4 + 𝛽5𝑋5 + 𝛽6𝑋6 + 𝛽7𝑋7 + 𝛽8𝑋8 + 𝑢
- -
- X1—GDP per capita per year, Olomouc Region (GDP);
- -
- X2—total net income per capita in CZK per year, municipalities with a population of 100,000+ (Inc);
- -
- X3—number of unemployed people in thousands, Olomouc Region (Unem);
- -
- X4—average discount rate per year, Czech Republic (Disc);
- -
- X5—population/number of inhabitants, district of Olomouc (Inhab);
- -
- X6—number of started flats, district of Olomouc (Flatst);
- -
- X7—number of finished flats, district of Olomouc (Flatfi); and,
- -
- X8—time/years 2006–2016 (Time).
MOD2
where β0…β5 represent regression coefficients that can show the influence of independent variables on a dependent variable. Dependent variable Y is represented by land price in Olomouc in CZK per square metre, calculated as a median of all prices of all land in Olomouc in certain years of the period 2006–2016. Variable u represents a dummy variable. MOD2 is based on the following independent variables:
𝑌 = 𝛽0 + 𝛽1𝑋1 + 𝛽2𝑋2 + 𝛽3𝑋3 + 𝛽4𝑋4 + 𝛽5𝑋5 + 𝑢
- -
- X1—GDP per capita per year, Olomouc Region (GDP);
- -
- X2—number of unemployed people in thousands, Olomouc Region (Unem);
- -
- X3—population/number of inhabitants, district of Olomouc (Inhab);
- -
- X4—number of started flats, district of Olomouc (Flatst); and,
- -
- X5—number of finished flats, district of Olomouc (Flatfi).
MOD3
where β0.…β2 represent regression coefficients that can show the influence of independent variables on a dependent variable. Dependent variable Y is represented by land price in Olomouc in CZK per square metre, calculated as a median of all prices of all land in Olomouc in certain years of the period 2006–2016. Variable u represents a dummy variable. MOD3 is based on the following independent variables:
𝑌 = 𝛽0 + 𝛽1𝑋1 + 𝛽2𝑋2 + 𝑢
- -
- X1—population/number of inhabitants, district of Olomouc (Inhab); and,
- -
- X2—number of finished flats, district of Olomouc (Flatfi).
3. Temporal Dependencies and Changes in Land Prices
3.1. Temporal Changes
The first analytical step was evaluating the temporal changes of the price map in Olomouc. Several basic statistical characteristics were calculated: the arithmetic mean, median, and mode. For the reasons given in the chapter on data, the same quantity of priced parcels was unfortunately not available for each time interval. The number of parcels had decreased over the monitored period from 44 to 28%. These indicators of central tendency have served as a general tool for assessing price changes over the past 15 years. The median was used as the main measurement of changes, which is not, as opposed to the mean, so affected by extreme values.
Two significant periods can be observed in the changes of prices. The first is in the period 1993–2006, when land prices fell slightly. In this post-revolutionary period, economic growth was not yet strong and people were not affluent, and there was therefore no leading demand for land. This claim is based only on three values, but the tendency is evident. The effect of adjusting price for inflation is significant: excluding inflation, prices are shown as slightly higher, whereas according to price levels from today’s point of view (2016), we see a slight decline. For comparison, see Figure 1. The most expensive land in the city centre was around CZK 9000 (1993), and in the following years, it dropped significantly (CZK 4600 in 1996). Until 2006, the median price was almost unchanged (around CZK 600), mainly because of the overall saturation of the real estate market that was caused by extensive construction of apartment buildings in the 1990s. Another event that affected land prices was the flood of 1997. This revealed the propensity of some urban areas to flooding, which may have contributed to price stability/decline.
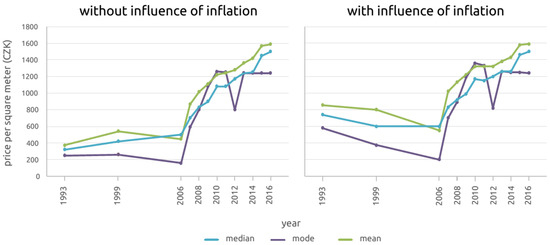
Figure 1.
Land price changes in Olomouc. The differences between the original and recalculated values (mean, median and mode) can be observed. The most significant differences are evident in the oldest records (1993 and 1999), where inflation was the most influential.
The year 2006 was a breakthrough in the second phase, in which a much more dynamic change of prices is observed, especially growth. Except for the period 2010–2011, when the median price dropped slightly, the value of land has increased since 2006. The reason is the re-awakening of demand for housing in the form of both dwellings and family houses. The most significant leap in the maximum price of land was in 2007, when the highest price increased from CZK 5900 to CZK 10,850. Stagnating prices in the period 2010–2011 can be attributed to the impact of the 2008 global financial crisis (visible in the Czech Republic after a two year delay).
3.2. Temporal Dependencies
Regarding the evaluation of temporal dependencies between economic, social, and demographic indicators, it is worth starting with a correlation analysis (Table 2). The results of the correlation analysis show possible relationships between certain variables, in our case, between “Land price”, “GDP”, “Income of households”, “Unemployment rate”, “Discount rate”, “Inhabitants”, “Started flats”, “Finished flats”, “Registered Economic Subjects”, and “Time”.
Table 2.
Correlation Analysis.
In the key variable “Land price”, we observe a statistically significant positive correlation between Price and GDP, Income, Inhabitants, and Time. By contrast, a statistically significant negative correlation can be seen between Price and Discount rate. The possible relationship between Price and Unemployment rate, Flats started and Flats finished is rather negative, but not statistically significant.
In the second step, we created and tested more complex regression models, working with all of the variables used in the correlation analysis. Based on the results of the correlation analysis, three regression models MOD1, MOD2, and MOD3, were created. Detailed characteristics of these regression models are described in Chapter 2. The Durbin-Watson test was used for the purposes of eliminating autocorrelation. The variance inflation factor (VIF) was used for detecting possible multicollinearity within the models.
All of the models work with the same dependent variable Y, which is represented by land price in Olomouc in CZK per square meter, calculated as a median of all prices of all land in Olomouc in certain years in the period 2006–2016. The key results of all regression models are shown in Table 3.
Table 3.
Regression Analysis.
The key question, also suggested at the beginning of our research as one of the hypotheses in our research, is whether land price is influenced by the changes of macroeconomic indicators. Focusing on regression models MOD1, MOD2, and MOD3, we can see that the answer is neither yes nor no. Generally, some of macroeconomic indicators are statistically significant in the selected models, namely GDP and unemployment. However, other economic indicators such as net income, average discount rate and number of registered economic entities are not statistically significant.
Looking at the models in more detail, MOD1 represents in general a statistically significant model, the Durbin-Watson test simultaneously confirming no autocorrelation. Not all of the included variables are statistically significant, though. Moreover, VIF coefficients are extremely high and show multicollinearity between the variables (Table 4). Therefore, we excluded some of the non-significant variables and created the shorter yet statistically significant model MOD2.
Table 4.
Overview of Variance Inflation Factors.
Model MOD2 also contains no autocorrelation. Regarding the significance of certain variables, we can distinguish 0.01 and 0.05 as two levels of significance. Regarding the 0.01 significance level, we can say that the number of inhabitants influences land price in Olomouc rather positively and the number of finished flats rather negatively. Other coefficients represent variables with 0.05 significance level, and their influence within the model is rather negative (GDP, unemployment, number of started flats). Focusing on multicollinearity issues, the VIF coefficients of GDP and the number of inhabitants are high. The multicollinearity problem can occur in connection with the number of observations and number of variables. Therefore, we excluded selected variables and created the shorter, statistically significant, model MOD3.
When compared to MOD1 and MOD2, MOD3 is based on only two independent variables, to diminish multicollinearity problem. MOD3 is statistically significant and the Durbin-Watson test proves no autocorrelation. The selected variables correspond with variables with the 0.01 significance level in MOD2. Similarly, as in MOD2, we can say that the number of inhabitants influences land price in Olomouc rather positively and the number of finished flats slightly negatively.
4. Spatial Relationships and Changes in Land Prices
The first objective was to identify areas where prices did not change significantly over time or where price changes might have been occurring. For this analysis, the data were modified as described in Chapter 2.3. First, the absolute price difference between two years was calculated, which was then converted to a relative value for better mutual comparison. The values were adjusted to logic: 0%—the price did not change; 100%—the price increased by 100%, (i.e., twice the original value), etc. Stable areas were defined as areas where the price changed by a maximum of 5%. Both absolute values and temporal changes were visualized (Figure 2 and Figure 3) and the basic spatial distribution of prices and changes was evaluated.
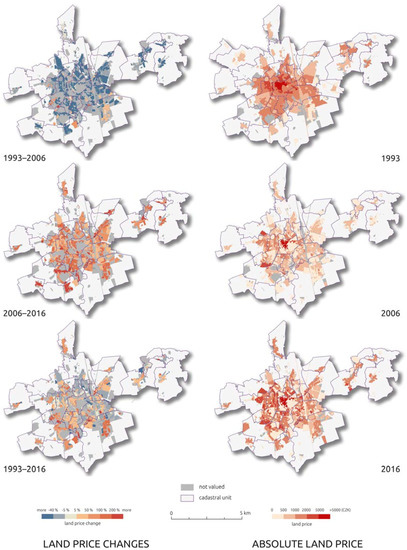
Figure 2.
Land price changes in Olomouc.
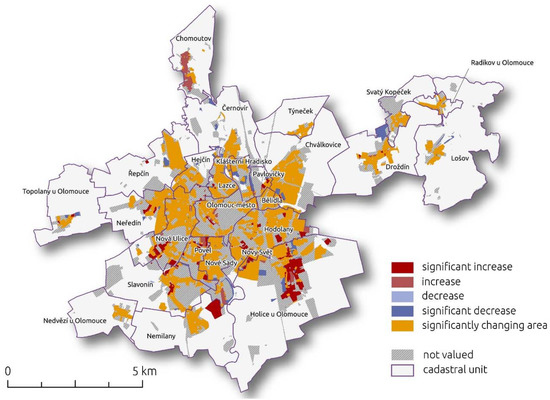
Figure 3.
Land price changes in Olomouc.
In the first part of the monitored period (1993–2006), the overall decline in prices in most parts of the city, even in the historical centre, which was the most expensive area (the absolute value of the land is still, however, in the highest category above CZK 5000), was observed. In this period, the value grew only in the south-eastern part Holice, where areas of individual housing dominate. A significant area of long-term growth is also located in the south of Nemilany, where a retail/industrial complex has gradually been established. The highest land prices were in the historical city centre. In the following period (2006–2016), prices increased across the city. Relevant growth was seen in the city districts Slavonín and Řepčín (the southern and north-western parts of the city), which both had new shopping centres that were established in 2002 and 2005. In part of the city centre, prices were strengthened, for example, by the completion of the Šantovka shopping centre, which increased the attractiveness of this locality. Another increase is also found in the Nedvězí and Nemilany cadastres. Here, areas of personal housing dominate, and the rise in prices is related to an overall trend of suburbanization when areas in the suburbs started being attractive for living and several new residential areas of individual housing were created.
Regarding the absolute price of parcels, spatial distribution changed over time. In 1993, it was possible to see a pattern of increasing prices towards the centre, the highest prices being in the historical centre of the town. In the peripheral areas, most of the parcels were in the two cheapest price categories, i.e., up to CZK 1000 (except for the eastern parts Svatý Kopeček, Lošov, and Radíkov). In 2006, the price of most parcels fell significantly, while the highest prices were maintained in the historical centre and in two areas on the outskirts—the new shopping centres (Olomouc City in Řepčín and Centrum Haná in Slavonín/Nová Ulice). By 2016, expensive land again remained in the historical centre, but the value of more parcels in the outer parts of the city was also increasing. By contrast, many areas in the inner part of the town had fallen to the lowest price category. From a temporal point of view, the permanent preservation of high prices in the historical centre is seen, other areas have changed over time, and peripheral areas have become more attractive.
However, the overall change in land price does not indicate the dynamics of the changes in the period analysed or the trend of price behaviour. For this reason, a typology of areas was designed concerning price changes. We determined whether a decrease or growth occurred in the time interval and whether this change was above the significance limit (i.e., greater than + 5%). The typology is summarized in Table 5.
Table 5.
Typology of Land Price Changes.
This analysis shows that the temporal evaluation dominates areas where the price has changed significantly in both directions and no clear trend can be observed. This behaviour follows the overall drop in prices in the initial period and their subsequent growth in the second half of the monitored period, as described in Chapter 3.1. No long-term stable areas were found in the area of interest (Figure 3), with a 5% tolerance of change. Different tolerance limits were tested: with 15% tolerance, only 1.3% is stable; with 20% tolerance, 4.5% is stable; and, with 30% tolerance, 6% is stable. Even with higher tolerances for change, an insignificant number of areas is categorized as stable in terms of price. This is surprising, because several stabilized areas exist, as defined by Burian [40,45], from the master plans of the city of Olomouc. Probably, there is no correlation between stability of land-use and stability of land prices. Long-term rising price parcels are located mainly in the suburbs; their largest representation is in the residential south-eastern part of the city.
Since the changing patterns of parcel price dominate the typology, we concluded that partial temporal changes and trends are not significantly decisive for overall spatial assessment. Therefore, relative price changes in the period 1993–2016 followed by absolute price in 2016 were used to assess overall sustainability in three individual aspects (environmental, social, and economic). These were defined as a key part of evaluating sustainability changes. In each aspect, we identified several topics for assessing price changes in a spatial context. All topics and their values are presented in the Figure 3, Figure 4 and Figure 5 and subchapters.
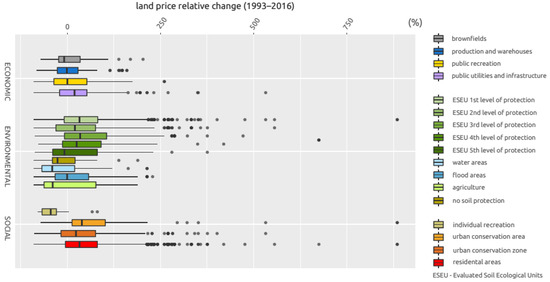
Figure 4.
Land price changes related to economic, environmental, and social aspects.
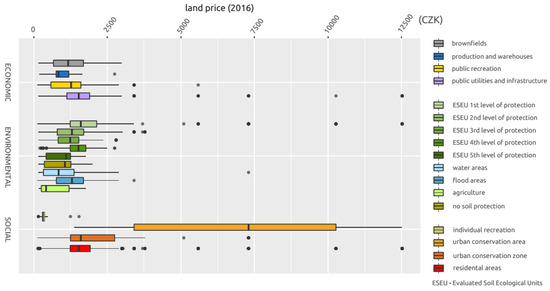
Figure 5.
Land prices related to economic, environmental, and social aspects.
4.1. Economic Aspects
From an economic point of view, land prices were analysed in categories defined by the Olomouc master plan as brownfields, production and warehouses, public recreation, and public utilities and infrastructure (Figure 4, Figure 5 and Figure 6). The aim was to elaborate on the relationships between land-use type and land price and to find out whether any land-use category was more significant for the real estate market than others. Surprisingly, prices did not change as dramatically as in other aspects. For brownfields, we observed even a slight overall decline in prices, as these locations are probably not interesting to investors, perhaps because of the higher costs for reconstruction and the elimination of environmental burdens. From a spatial point of view, these categories do not have any spatial pattern, except for production and warehouses located mainly in the eastern part of the city near rail transport. Generally, it is possible to say that the four selected economic spatial aspects are the most stable in terms of price changes and they did not record any dramatic changes in the monitored period. Also, regarding absolute price (2016), the price of most land in economic land-use categories did not exceed CZK 2500.
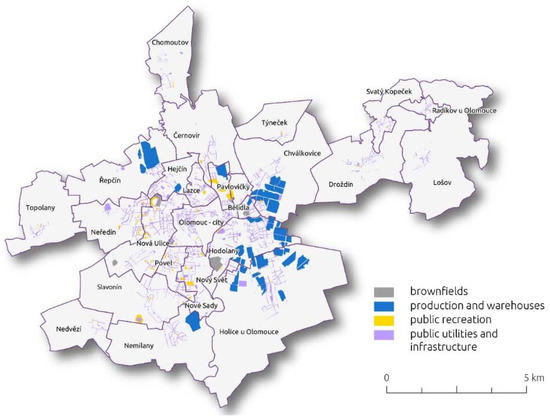
Figure 6.
Spatial distribution of economic aspects.
4.2. Environmental Aspects
From an environmental point of view (Figure 4, Figure 5 and Figure 7), the significant impact of soil protection level (ESEU—Evaluated Soil Ecological Unit) on the changes of its price is evident. The highest increase is in the price of land in the first and third protection levels, which covers the majority of the area of priced parcels. The zone of these soils passes through the city from north to south and occupies more than 50% of parcels. However, a noticeable stagnation/decrease can be seen for the fifth level of soil protection and soils without any ecological protection. These areas are in the eastern outskirts of the city (Droždín, Lošov, Svatý Kopeček, and Radíkov). In this part of the city, the slope of the terrain changes significantly and increases the degree of afforestation. Top quality soils (the first four degrees of protection) went up considerably in price over the years. Their absolute price is also higher than for the remaining levels (fifth level and land without protection). An interesting category is land related to watercourses—parcels in the flood zone of 20-year water and areas classified as ‘water areas’ (which are the closest parcels to watercourses) were selected. These categories (as one of the few) declined in price. This is probably due to the floods in 1997 (100-year floods), which had a significant impact on the city. Disastrous floods affected one-third of the city, 50 people died, and more than 26,000 inhabitants were evacuated from the area [46]. The propensity of these locations to flooding was therefore reflected in the price of land. The most significant decline occurred in the northern part of the city in the Černovír, Klášterní Hradisko, and Lazce cadastral units. The flood area mostly comprises areas of individual housing. Least important for the analysis is the agricultural area category, which covers only a few parcels of the monitored area. Similarly, the water area category includes only a limited number of parcels, but flood areas complement it.
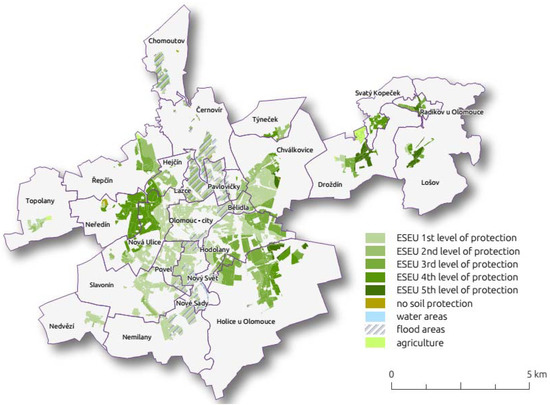
Figure 7.
Spatial distribution of environmental aspects.
4.3. Social Aspects
The social aspect (Figure 4, Figure 5 and Figure 8) is the most interesting to analyse regarding land price. The most significant changes and overall price increases were expected in residential areas. For this assessment, residential areas, individual recreational areas, and parcels located in the urban conservation zone and area (historical centre of the city) were selected. Individual recreational areas, most of them being gardening and cottage areas, showed a strong drop in price. These areas have minor representation and they are located mainly in the city suburbs. Currently, interest in these gardening activities is low, engaging mainly seniors, and overall demand is declining. This is evident in the price trend, which has the most significant drop in all the monitored categories. Also, the absolute value of these parcels is the lowest. Progressing conversely, prices in residential areas and protected areas changed. The current demand for personal housing in Olomouc is very high and the price of these parcels is continually increasing. Several locations are experiencing intensive construction of new units designed for individual housing. Generally, residential areas are relatively equally distributed across the city. In the studied period, this category experienced a significant price increase across the city, even more extensively than in the urban conservation zone. Except for the city centre itself, price has grown significantly in peripheral parts of the city (the south-eastern cadastre of Holice and southwestern Slavonín, Nové Sady, and part of Nová Ulice). Concerning absolute price, however, conservation areas still lead. A specific category is the historical centre, which is protected as an urban conservation area. Here, a strong price increase is observed, and regarding absolute price, it is unequivocally the highest. The variation of prices here is also great; however, even 50% of all parcels in this category surpass all other assessed aspects.
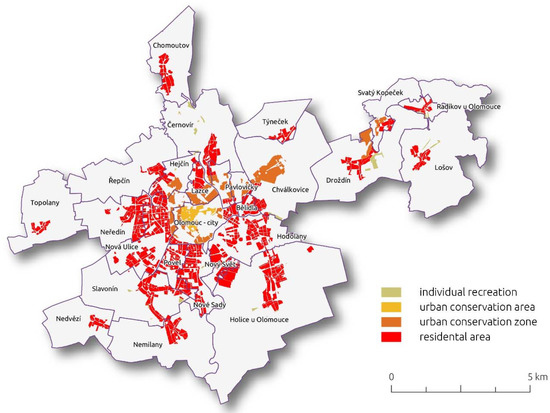
Figure 8.
Spatial distribution of social aspects.
The overall assessment points to the most significant impact of social and environmental spatial aspects: a rise in prices occurred in these categories. Categories with a decrease in price are minimal—these are primarily risk areas near watercourses that are prone to flooding. The growth of land prices for high-quality land is also significant. This might be because the Olomouc Region is characterized by soil of the highest quality in the Czech Republic. Parcels with lower soil quality were built on in the past and the city can now only be developed on parcels with higher soil protection levels. These classes compare to those of personal housing, which has seen increased interest in recent years and lead construction activities to being focused on this type of housing. The analysis confirmed the expectation that the most lucrative parcels are located in the city’s historical core. This is demonstrated both in the absolute price of land and its change over the monitored period.
5. Discussion
Regarding the influence of the changes of macroeconomic indicators on land price, the results of the regression analysis show that the most significant indicators for land price increase/decrease in time are the indicators “number of inhabitants” and “number of finished flats”. Other indicators with a significant impact can be “GDP”, “unemployment”, and “number of started flats”. It partially corresponds to the results of Yang [12], where the influence of immigrant population, GDP, and investment in residential buildings were observed. However, the influence of “net income per capita” is not significant for land price changes in Olomouc as compared to results that were obtained by Mou [10] in his analysis, which also includes the influence of average wages of employees on land price in selected cities.
It is important to emphasize that the results presented in this study are based on a detailed data set for one city: Olomouc. However, the studies mentioned above examine a selected group of cities, and their results show that the significance, direction, and magnitude of the relationships between selected factors can vary across cities [10]. For example, the impact of macroeconomic indicator GDP varied from relatively strong positive to strong negative impacts on residential land price in different cities in China, as observed by Yang [12].
Based on an analysis of master plans, Burian [40] explored the changes in several stable areas in Olomouc (450 ha of agricultural land; 352 ha of housing areas; and, 128 ha of city parks and public services areas). We assumed that these stable areas would have been linked to stable land prices. Surprisingly, no long-term stable areas were found in the area of interest, with a 5% (or higher) tolerance of change. There is a link, however, between price increase and some changes in the land-use type in the master plan. This study shows that long-term rising parcel prices are seen mainly in the suburbs, with their largest representation being in the residential south-eastern part of the city. Most are located in areas marked by Burian [40] as the most variable localities. Two of them are represented by commercial activities (Globus shopping centre in the Řepčín cadastre and Šantovka shopping centre in the city’s centre).
In relation to the spatial analysis of the impact of different aspects, some valued parcels overlap and a parcel may comprise several aspects (for example, parcels in the historical centre are included in both residential area and urban conservation area categories). As evaluation was performed from different points of view, this phenomenon cannot be avoided. This means that the differences in price changes in individual categories are not so significant, however, the analysis offers a more complex evaluation.
The overall assessment of total prices and their changes over the three time intervals revealed some patterns in price map behaviour. The most conspicuous is the city’s historical centre: here, we can see the highest long-term land prices, even in the period of decrease in prices. As we move away from the city centre, prices gradually decreased. In the second interval of the monitored period, the original spatial pattern disappeared as the value of peripheral parts of the city increased because of personal housing construction. The temporal changes described in Chapter 3.1 are also reflected in the spatial visualization. An overall decline in prices in most parts of the city, even in the most expensive historical centre, was observed. Between 1993 and 2016, there was primarily an increase of price; the decrease is particularly evident in some parts of the city, being affected mainly by the environmental aspect of flood areas.
6. Conclusions
Land price sustainability issues have been analysed by other authors previously. Based on the literature review, we discovered that only a few researchers had focused on an analysis of official land price maps, which are available very rarely. These maps are very significant documents that influence and control the real estate market in the larger cities of the Czech Republic. For this reason, we decided to perform an in-depth analysis of land prices of the city of Olomouc. Official land price maps from 1993 to 2016 were used as the primary data source for temporal and spatial relationships and changes in land prices in Olomouc. Spatial changes were analysed from three aspects of sustainability: economic, environmental, and social. We proposed several research hypotheses to confirm some general statements about land price changes.
The first research hypotheses concerned the link between changes in land prices and changes in macroeconomic indicators. The results of the regression analysis and consequent changes of certain variables for the observed period suggests the answer to this question is partially affirmative. Some macroeconomic indicators had significant impact on the changes in land prices in Olomouc in the period 2006–2016, but not in the case of all of the observed macroeconomic indicators. We can conclude that the changes of land prices are influenced by a mixture of economic, demographic, and social indicators. It is also important to highlight that the analysis is based on land prices in CZK per square meter in Olomouc, calculated as a median of all prices of all land in Olomouc only. In case of using different prices for different localities, the results can be more precise.
In the residential and commercial areas and historical centre, land prices are significantly higher than in other monitored aspects. Overall price is dominated by the city’s historical core. From the point of view of changes during the monitored period, part of the hypothesis can be rejected: no significant growth in the commercial categories (represented here by the economic aspect) was revealed. The price increase in three selected factors was quite low. Brownfields even showed a decrease in price. The hypothesis concerning residential areas and the historical centre is valid: price changes were the highest in the three monitored categories. Absolute price in residential areas, especially those located in the historical centre, have been highest in the long term.
We assumed that there would be stable areas with no land price change that were comparable to stabilized land-use. Based on our analysis, we conclude that no connection exists between land-use stability and land price stability. Surprisingly, no long-term stable areas were found in the area of interest. Parcels with changes in land-use type are located mostly in areas with a significant land price increase (commercial areas).
The analysis confirmed that land price and its change over time varied in different spatial aspects. Surprisingly, the smallest influence was reflected in the economic aspect. However, price was significantly affected by land quality and its location within or outside the protected urban conservation area, as discussed above. Regarding natural events in recent decades, we observed a significant drop in land prices in the vicinity of watercourses that are threatened by flooding.
Author Contributions
Conceptualization, J.B., J.Z. and K.M.; Methodology, J.B., J.Z. and K.M.; Investigation, J.Z., B.K. and K.M..; Data Curation, B.K. and K.M.; Writing-Original Draft Preparation, J.B., J.Z. and K.M.; Visualization, K.M.; Supervision, J.B.
Funding
The research was supported by the ERASMUS+ project no. 2016-1-CZ01-KA203-024040 and by the Internal Grant Agency of Palacký University Olomouc (project IGA_PrF_2018_028).
Conflicts of Interest
The authors declare no conflict of interest.
References
- Hu, S.; Yang, S.; Li, W.; Zhang, C.; Xu, F. Spatially non-stationary relationships between urban residential land price and impact factors in Wuhan city, China. Appl. Geogr. 2016, 68, 48–56. [Google Scholar] [CrossRef]
- Czech Statistical Office Average Salaries in Regions in 2018 [Průměrné mzdy—1. čtvrtletí 2018]. Available online: https://www.czso.cz/csu/czso/cri/prumerne-mzdy-1-ctvrtleti-2018 (accessed on 5 October 2018).
- Black, J.T.; Hoben, J.E. Land price inflation and affordable housing. Urban Geogr. 1985, 6, 27–47. [Google Scholar] [CrossRef]
- Benirschka, M.; Binkley, J.K. Land Price Volatility in a Geographically Dispersed Market. Am. J. Agric. Econ. 1994, 76, 185. [Google Scholar] [CrossRef]
- Sunega, P.; Lux, M.; Zemčík, P. Housing Price Volatility and Econometrics. Crit. Hous. Anal. 2014, 1, 1. [Google Scholar] [CrossRef]
- Colwell, P.F.; Munneke, H.J. The structure of urban land prices. J. Urban Econ. 1997. [Google Scholar] [CrossRef]
- Liu, Z.; Wang, P.; Zha, T. Land-Price Dynamics and Macroeconomic Fluctuations. Econometrica 2013, 81, 1147–1184. [Google Scholar] [CrossRef]
- Huang, D.; Yang, X.; Liu, Z.; Zhao, X.; Kong, F. The dynamic impacts of employment subcenters on residential land price in transitional China: An examination of the Beijing Metropolitan Area. Sustainability 2018, 10, 1016. [Google Scholar] [CrossRef]
- Rosenthal, S.S.; Helsley, R.W. Redevelopment and the urban land price gradient. J. Urban Econ. 1994, 35, 182–200. [Google Scholar] [CrossRef]
- Mou, Y.; He, Q.; Zhou, B. Detecting the spatially non-stationary relationships between housing price and its determinants in China: Guide for housing market sustainability. Sustainability 2017, 9, 1826. [Google Scholar] [CrossRef]
- Scott, J.T. Factors Affecting Land Price Decline. Am. J. Agric. Econ. 1983, 65, 796. [Google Scholar] [CrossRef]
- Yang, S.; Hu, S.; Li, W.; Zhang, C.; Torres, J.A. Spatiotemporal effects of main impact factors on residential land price in major cities of China. Sustainability 2017, 9, 2050. [Google Scholar] [CrossRef]
- Del Giudice, V.; De Paola, P.; Manganelli, B.; Forte, F. The Monetary Valuation of Environmental Externalities through the Analysis of Real Estate Prices. Sustainability 2017, 9, 229. [Google Scholar] [CrossRef]
- Massimo, D.E.; Del Giudice, V.; De Paola, P.; Forte, F.; Musolino, M.; Malerba, A. Geographically Weighted Regression for the Post Carbon City and Real Estate Market Analysis: A Case Study; Springer: Cham, Switzerland, 2019; pp. 142–149. [Google Scholar]
- Simlai, P. Estimation of variance of housing prices using spatial conditional heteroskedasticity (SARCH) model with an application to Boston housing price data. Q. Rev. Econ. Financ. 2014. [Google Scholar] [CrossRef]
- Xu, Z.; Li, Q. Integrating the empirical models of benchmark land price and GIS technology for sustainability analysis of urban residential development. Habitat Int. 2014, 44, 79–92. [Google Scholar] [CrossRef]
- Marek, L.; Tuček, P.; Pászto, V. Using geovisual analytics in Google Earth to understand disease distribution: A case study of campylobacteriosis in the Czech Republic (2008–2012). Int. J. Health Geogr. 2015. [Google Scholar] [CrossRef] [PubMed]
- Lytras, M.D.; Visvizi, A. Who Uses Smart City Services and What to Make of It: Toward Interdisciplinary Smart Cities Research. Sustainability 2018, 10, 1998. [Google Scholar] [CrossRef]
- Visvizi, A.; Lytras, M.D. Rescaling and refocusing smart cities research: From mega cities to smart villages. J. Sci. Technol. Policy Manag. 2018, 9. [Google Scholar] [CrossRef]
- Fearn, J. Too Poor to Move, Too Poor to Stay. A Report on Housing in the Czech Republic, Hungary and Serbia; Open Society Inst.: Budapest, Hungary, 2004. [Google Scholar]
- Lux, M. Housing Policy and Housing Finance in the Czech Republic during Transition: An Example of the Schism between the Still-Living Past and the Need of Reform; Delft University of Technology: Delft, The Netherlands, 2009; ISBN 1607500582. [Google Scholar]
- Lux, M.; Sunega, P. The future of housing systems after the transition—The case of the Czech Republic. Communist Post-Communist Stud. 2010, 43, 221–231. [Google Scholar] [CrossRef]
- Musil, J. The Czech Housing System in the Middle of Transition. Urban Stud. 1995, 32, 1679–1684. [Google Scholar] [CrossRef]
- Sklenicka, P.; Molnarova, K.; Pixova, K.C.; Salek, M.E. Factors affecting farmland prices in the Czech Republic. Land Use Policy 2013, 30, 130–136. [Google Scholar] [CrossRef]
- Temelová, J.; Novák, J.; Ouředníček, M.; Puldová, P. Housing Estates in the Czech Republic after Socialism. Urban Stud. 2011, 48, 1811–1834. [Google Scholar] [CrossRef]
- Hlaváček, M.; Komárek, L. Regional Analysis of Housing Price Bubbles and Their Determinants in the Czech Republic. Czech J. Econ. Financ. 2011, 61, 67–91. [Google Scholar]
- Dobiášová, S. Comparison of price maps of selected EU countries and the Czech Republic. Diploma Thesis, [Srovnání cenových map vybraných zemí Evropské unie a České republiky]. Bankovní institut vysoká škola Praha Katedra, Prague, Czech Republic, 2013. Available online: https://is.ambis.cz/th/l3xu6/Svatava_Dobiasova_Diplomova_prace_2013.pdf (accessed on 5 October 2018).
- Chrudimská, J. Innovation of Land Price Map of Olomouc City. Diploma Thesis, [Inovace cenové mapy města Olomouce]. Univerzita Palackého v Olomouci, Olomouc, Czech Republic, 2010. Available online: https://theses.cz/id/gdyrfu/127133-562522248.pdf (accessed on 5 October 2018).
- Kočvarová, B. Spatio-Temporal Analysis of Land Price Map of Olomouc City. Diploma Thesis, [Časoprostorová analýza cenové mapy Olomouce]. Univerzita Palackého v Olomouci, Olomouc, Czech Republic, 2018. Available online: https://theses.cz/id/9lciq2/Kocvarova_text_prace.pdf (accessed on 5 October 2018).
- Kovaříková, V. Land Price Maps. Diploma Thesis, [Cenové mapy]. Bankovní institut vysoká škola Praha, Prague, Czech Republic, 2012. Available online: https://is.ambis.cz/th/f402s/BP-cenove_mapy.pdf (accessed on 5 October 2018).
- Kubíček, J. Rents and the Land Price Relationship Based on the Price Map. Doctorate Thesis, [Vztah mezi nájemným a cenou pozemku v cenové mapě]. VUT v Brně, Brno, Czech Republic, 2009. [Google Scholar]
- Paszto, V.; Burian, J.; Macku, K. Mapping the Economic Data—Case Studies and Best Practices. In Proceedings of the 17th International Multidisciplinary Scientific GeoConference SGEM 2017, Albena, Bulgaria, 29 June–5 July 2017. [Google Scholar]
- Šindelářová, K. Price Maps in Public Administration Practice. Diploma Thesis, [Cenové mapy v praxi veřejné správy]. Masaryk University, Brno, Czech Republic, 2009. Available online: https://is.muni.cz/th/p570c/DIPLOMOVA_PRACE_-_Cenove_mapy_v_praxi_verejne_spravy.pdf (accessed on 5 October 2018).
- Realitymix Price per Square Meter to Buy Apartment. [Průměrná cena za 1 m2 bytu]. Available online: https://realitymix.centrum.cz/statistika-nemovitosti/byty-prodej-prumerna-cena-za-1m2-bytu.html (accessed on 5 October 2018).
- Czech Statistical Office Number of Inhabitants in Czech Municipalities. [Počet obyvatel v obcích—k 1.1.2018]. Available online: https://www.czso.cz/csu/czso/pocet-obyvatel-v-obcich-see2a5tx8j (accessed on 5 October 2018).
- Ministry of Finance Decree No. 151/1997 Coll. [Zákon č. 151/1997 Sb., o oceňování majetku a o změně některých zákonů (zákon o oceňování majetku)]. Prague, Czech Republic, 1997. Available online: https://www.zakonyprolidi.cz/cs/1997-151 (accessed on 5 October 2018).
- Ministry of Finance Decree No. 3/2008 Coll. [Vyhláška č. 3/2008 Sb., o provedení některých ustanovení zákona č. 151/1997 Sb., o oceňování majetku a o změně některých zákonů, ve znění pozdějších předpisů, (oceňovací vyhláška)]. Prague, Czech Republic, 2008. Available online: https://www.zakonyprolidi.cz/cs/2008-3 (accessed on 5 October 2018).
- Land Price Map. [Cenová mapa]. Available online: www.cenovamapa.cz (accessed on 4 October 2018).
- Burian, J.; Brychtová, A.; Vávra, A.; Hladišová, B. Analytical material for planning in Olomouc, Czech Republic. J. Maps 2016, 12, 649–654. [Google Scholar] [CrossRef]
- Burian, J.; Brus, J.; Voženílek, V. Development of Olomouc city in 1930–2009: Based on analysis of functional areas. J. Maps 2013, 9, 64–67. [Google Scholar] [CrossRef]
- Czech Statistical Office Time Series—Selected Indicators for Olomouc Region. [Časové řady za Olomoucký kraj]. Available online: https://www.czso.cz/csu/xm/casove-rady-vybrane-ukazatele-za-olomoucky-kraj (accessed on 5 October 2018).
- Czech Statistical Office Statistics on Income and Living Conditions. Households by Labour Activity and size of Municipality. [Příjmy a životní podmínky domácností—2017]. Available online: https://www.czso.cz/csu/czso/prijmy-a-zivotni-podminky-domacnosti-rn2to6gtkz (accessed on 5 October 2018).
- Czech National Bank Discount Rate Development. [Vývoj diskontní sazby]. Available online: http://www.cnb.cz/cs/faq/vyvoj_diskontni_historie.txt (accessed on 5 October 2018).
- Zimmermannova, J.; Skalickova, J.; Siroky, J. What can tax revenues tell us about the economic activity of Regions? Econ. Sociol. 2016, 9. [Google Scholar] [CrossRef] [PubMed]
- Burian, J.; Paszto, V.; Langrova, B. Possibilities of the definition of city boundaries in GIS—The case study of a medium-sized city. In Proceedings of the 14th SGEM GeoConference on Informatics, Geoinformatics and Remote Sensing, Albena, Bulgaria, 19–25 June 2014; Volume 3, pp. 777–784. [Google Scholar]
- Nétek, R.; Vožnílek, V.; Balun, M. Rich Internet Application for Crisis Management Support—Case Study on Floods in Olomouc City; Springer: Cham, Switzerland, 2014; pp. 111–120. [Google Scholar]
© 2018 by the authors. Licensee MDPI, Basel, Switzerland. This article is an open access article distributed under the terms and conditions of the Creative Commons Attribution (CC BY) license (http://creativecommons.org/licenses/by/4.0/).