Green Driver: Travel Behaviors Revisited on Fuel Saving and Less Emission
by
 , and
, and
Nurul Hidayah Muslim
1,2, 
Ali Keyvanfar
1,3,4,5,
Arezou Shafaghat
3,4,5,*,
Mu’azu Mohammed Abdullahi
6 and
Majid Khorami
1 1
Facultad de Arquitectura y Urbanismo, Universidad Tecnológica Equinoccial, Calle Rumipamba s/n y Bourgeois, Quito 170508, Ecuador
2
Faculty of Civil Engineering, Universiti Teknologi Malaysia, Skudai 81310, Johor, Malaysia
3
MIT-UTM MSCP Program, Institute Sultan Iskandar, Universiti Teknologi Malaysia, Skudai 81310, Malaysia
4
Department of Landscape Architecture, Faculty of Built Environment, Universiti Teknologi Malaysia, Skudai 81310, Johor, Malaysia
5
The School of Architecture and Environmental Design, Iran University of Science and Technology (IUST), Narmak Street, Tehran 1684613114, Iran
6
Civil Engineering Department, Jubail University College, Royal Commission of Jubail and Yanbu, Jubail 31961, Saudi Arabia
*
Author to whom correspondence should be addressed.
Sustainability 2018, 10(2), 325; https://doi.org/10.3390/su10020325
Submission received: 3 December 2017
/
Revised: 3 January 2018
/
Accepted: 16 January 2018
/
Published: 26 January 2018
(This article belongs to the Special Issue Travel Behaviour and Sustainable Transport of the Future)
Abstract
:Road transportation is the main energy consumer and major contributor of ever-increasing hazardous emissions. Transportation professionals have raised the idea of applying the green concept in various areas of transportation, including green highways, green vehicles and transit-oriented designs, to tackle the negative impact of road transportation. This research generated a new dimension called the green driver to remediate urgently the existing driving assessment models that have intensified emissions and energy consumption. In this regard, this study aimed to establish the green driver’s behaviors related to fuel saving and emission reduction. The study has two phases. Phase one involves investigating the driving behaviors influencing fuel saving and emission reduction through a systematic literature review and content analysis, which identified twenty-one variables classified into four clusters. These clusters included the following: (i) FEf1, which is driving style; (ii) FEf2, which is driving behavior associated with vehicle transmission; (iii) FEf3, which is driving behavior associated with road design and traffic rules; and (iv) FEf4, which is driving behavior associated with vehicle operational characteristics. The second phase involves validating phase one findings by applying the Grounded Group Decision Making (GGDM) method. The results of GGDM have established seventeen green driving behaviors. The study conducted the Green Value (GV) analysis for each green behavior on fuel saving and emission reduction. The study found that aggressive driving (GV = 0.16) interferes with the association between fuel consumption, emission and driver’s personalities. The research concludes that driver’s personalities (including physical, psychological and psychosocial characteristics) have to be integrated for advanced in-vehicle driver assistance system and particularly, for green driving accreditation.

1. Introduction
The transportation sector is the main fuel consumer in the world and road transport is responsible for 85% of the average global energy [1]. Fuel consumption trends from the global transportation perspective depend on drivers’ travel behavior [2]. United Kingdom (UK) consumes 33% of global fuel energy [3], followed by Portugal 40% [3], United States (US) 28% [4], China 19% [5], India 16.9% [6] and Malaysia 25.5% [7]. Likewise, the transportation sector is in second place of hazardous gas emission in the world [4]. The vehicle emission trends have been increasing. In particular, CO2 in UK is 25% [3], followed by Portugal 20% [3], US 28% [8], Japan 19% [9], China 23% [5], India 28.33% [10] and Malaysia 22.9% [11]. The rapid growth in global emissions was driven by emissions from the road sector (Figure 1). As passenger transport consumes more energy compared to freight transportation, most CO2 emissions belongs to road transport (Figure 2). The increasing number of cars has intensified the amount of environmental pollution, especially carbon dioxide (CO2), carbon monoxide (CO), particulate matter (PM) and etc. The elevated global CO2 emission has been increased by about 2.2% from 2012 levels and reached 32.2 GtCO2 in 2013 [5]. Nevertheless, the annual growth of CO2 was reported slightly lower by 2.5% since 2000 [2]. Approximately, 80% of road transportation oil consumption is highly associated with 23% of CO2 emissions in 2013 [2]. Road transport is responsible for 85% of the average global energy used in transportation (Rodrigue and Comtois, 2013). It is also reported that CO2 emissions from road transport and aviation both grew by 25% [12].
Travel behavior is the interaction between people and transport, which impacts to fuel consumption and CO2 emission [13,14]. Recently, travel behavior researchers have created a new term called driver behavior, which considerably contributes to reducing fuel consumption and CO2 emission. The driver behavior study involves three major components; included the driver, vehicle and environment [15]. The vehicle and environment are considered as physical factors, while driver has also psychological factors when measuring the driver’s travel behaviors [15]. In fact, the driver is a complex factor that constantly changes, and it is unpredictable. Therefore, it is very hard to translate driver’s behaviors accurately, due to the socio-demographic differences, preferences, beliefs, attitude, (including knowledge and self-awareness (i.e., insight) and upbringing issues. Besides, driver behavior is governed by emotions, mental activities and physical actions. The interaction between driver and environment or any physical surrounding may result in dramatic changes in the driver’s behavior and his/her actions as well as feedback, which is called the behavioral dynamics of the driver. There has been extensive research on human behavior across physiology, psychiatry, health, neural development, personality and attitude, psychopathology and brain stimulus. In addition, various models have been developed and applied in numerous applications, such as artificial intelligence, risk assessment, decision making, system safety analysis, human performance and so on [16]. However, these approaches have not been yet integrated with travel behavior studies.
In particular, previous researchers have identified drawbacks that hindered driver’s behaviors. Firstly, the repeatability and reliability of experiments is related to drivers’ behaviors. Most of the time, it is impossible to obtain a reliable measurement of behavior, because the experimental work measures physical factors more than the psychological factors [17]. For example, in examining the effect of driver behavior on emission and fuel consumption, the types of engine, speed and acceleration have been considered as the main factors, while human-related factors have not been estimated. Thus, it is crucial to incorporate the psychological factors of a driver (i.e., personality traits) [18], attitudes and intentions [19] and risk-taking [20] for fuel saving and emission reduction studies. Moreover, driver cognitive factors, such as management of attention [21], visual functions [22] and psychomotor behavior [22], have to be explored for emission reduction and fuel saving studies. Hence, the integration of psychological and technical experiments first remains as the main gap in driver travel behavior studies. Secondly, the development criteria and attributes are critical to obtain good driving measurements [17]. In fact, there is no specific measurement method or technique to evaluate ‘goodness’ of a driver [17]. It can be described through various ways. For instance, the reduction of accidents and fatalities greatly reflect the safety practice of a driver and it could be taken as a measure of the ‘goodness’ of a driver [17]. In another example, driving at a constant speed will reduce fuel consumption compared to aggressive driving practices, which can also be taken as a measure of goodness of a driver. Therefore, the existing in-vehicle driving assistance systems and simulators lack the incorporation of driver’s behaviors on reducing energy consumption. Furthermore, the vehicle emission model stands independently. Limited exploration of drivers’ competency in view of instantaneous decision making, planning, anticipation and driving goals as well as the scarcity of travel information makes it difficult to create fully accurate driving assessment models. Therefore, driver’s travel behaviors could not be translated adequately, interdependently and rigorously through these models [23].
On the other hand, the green concept is no longer limited to the construction and material fields of research. It has been recently applied to the transportation sector and various approaches of the green concept have been studied, such as green highway design and construction [24], green public transportation [25,26], bio-fuel improvement [27], green vehicles (or, Eco-vehicles) [28] and vehicle safety features [29]. However, transportation, as the major contributor of ever-increasing CO2 and greenhouse gas (GHG) emissions, has a significant role in green development agendas. In this regard, the transportation professionals and authorities have recently changed their approach to green transportation. The CO2 and GHG emission reduction is the main goal in the growth of green transportation [30]. So, it is essential to innovate the techniques reduce CO2 and GHG emissions [31,32]. Doppelt and Markowitz [33] state that “there does not appear to be substantial research on how specific behavioral changes can lead to measurable reductions in GHG emissions ”. Previous studies determined that the selection of modes of travel (i.e., transit, carpool, metro, bus and taxi) that emit less greenhouse gasses [34,35] but are not sufficiently successful to sustain driver’s travel behavioral changes.
In this regard, the current study proposes a new angle to the green transpiration as; ‘Green Driver’ (see Figure 3), which may involve the driver’s attributes, especially driver’s psychological attributes in travel behavior studies. The green driver is defined as the driver’s psychological attributes (including personalities, attitudes, cognitive and risks) contributing to fuel saving and emission reduction. Furthermore, the green driver concept may explore the driver’s dynamics, actions and reflections with regard to their driving personality. The concept is governed by human factors and their interaction with surrounding (i.e., environment and vehicle).
According to above-mentioned issues and gaps, the current study aimed to establish the green driver behaviors for achieving fuel saving and emission reduction. To achieve the aim, the research has engaged two objectives; (i) to identify and establish the driver’s green travel behaviors influencing fuel saving and emission reduction; and (ii) to estimate the Green Value (GV) impact of those green travel behaviors. Corresponding to these objectives, the research methodology was structured into two phases. In phase one, a comprehensive list of driver’s travel behaviors incorporated to fuel consumption and tailpipe emission is first investigated through content analysis and systematic literature review methods. After this, the green travel behaviors out of all travel behaviors are identified and established using the Grounded Group Decision Making (GGDM) method. In the phase two, Green Value (GV) of these established green travel behaviors is analyzed, which indicates the green impact degree of each green behavior on fuel saving and emission reduction. The current study reports the requirements of developing the green driver behavior assessment index model and the developed model will be presented in future works.
The current study has drawn several scopes based on the environmental conditions, road design and rules, vehicle type, various circumstances and driver’s characteristics. The green driver behaviors can be considered to be almost same in all nations. However, these behaviors might be adjusted according to climate and weather conditions [36]. In this regard, Yan et al. [37], Jung et al. [38] and Hamdar et al. [39] stated that dynamic nature of driving is affected by weather conditions. The abnormal weather and other environmental conditions factors substantially impact traffic flow dynamics [40] as well as traffic congestion and crashes [39,41], which may affect driver behavior (for example, resulting in speed reductions). Ibrahim and Hall [42] has discovered that free-flow speed decreases by 23.6–31 mph during heavy snow, 1.9 mph in light snow and 3.1–6.2 mph in heavy rain. Evans [43] found that foggy weather significantly impacts the behavior of drivers in following cars, with reductions in speed and acceleration rates. However, Hamdar et al. [39] stated that quantifying the correlation between driving behavior and weather conditions requires further studies on the micro-scale. In particular, there are very few studies on the association of weather conditions with fuel consumption and emission factors. Therefore, the present study has considered the weather conditions as a control variable. In addition, this research has shown that the legislative bodies of governments and local authorities of countries have imposed their own road driving rules, while there are minor differences. For example, the speed limit is almost same around the world, but the nations have adjusted it according to their weather conditions, road designs and drivers’ modifiable factors (i.e., personalities, attitudes, cognitive and risk). Furthermore, this research has focused on petroleum-based vehicles since approximately 80% of current road fuels are derived from petroleum [44], while more than 75% of total CO2 emission was emitted from gasoline and diesel consumption [5]. Moreover, the current research explores the green driving behaviors without focusing on the level of experience (i.e., beginner, experienced levels), while more experienced drivers may influence fuel saving more effectively than beginners. As the scope of this research is on vehicle and environment dimensions, the association between the green driver’s behavior and safety will be reported in the next paper.
2. Identifying the Driver’s Travel Behaviors Affecting Less Fuel Consumption and Tailpipe Emission
2.1. Systematic Literature Investigation
Phase one identifies the comprehensive list of travel behaviors incorporate tailpipe emission and fuel consumption. The research conducted a systematic review analysis, as it is replicable, scientific and transparent method of literature review [45]. This method can minimize bias on literature review as it provides comprehensive decisions, procedures and conclusion from researchers. The variables (i.e., travel behaviors) have been collected through a systematic literature review using specific keywords and combination of keywords (included, driver behavior, travel behavior, vehicle fuel consumption, vehicle tailpipe emission and green transportation) in the available references. Both cited and referenced articles were extracted from ScienceDirect, Google Scholar, Scopus, Taylor and Francis, Emerald, Sage as the available databases. In specific, most of the articles downloaded were retrieved from specific related journals; included, Transport reviews, Journal of Automobile Engineering, Transportation Research Part F: Traffic Psychology, Transportation Research Part D: Transport and Environment, Transport Policy, Journal of the Transportation Research Board, Transportation Science, Atmospheric Environment and Government reports, Inventories, Database and Conference papers.
The methodology for a systematic literature was divided into four (4) stages; identification, screening, eligibility and synthesizing (Figure 4). Identification stage involved the process of collecting articles using relevant keywords combination including, “vehicle fuel consumption”, “vehicle tailpipe emission”, “driving behavior”, “driver behavior”, “eco driving” and “green transportation”. Total 100 numbers of articles were found in association with this study. However, only 67 numbers of articles were included and reviewed for this study which published between 1995 and 2017. According to Ariens et al.’s [46] and Lievense et al.’s [47] instructions, the identified literatures have been screened in terms of the consistency and quality of the findings. Among all screened articles, there were only 83 articles that incorporated driver factors in relation with energy and emission while the rest of articles have purely focused on vehicle and environmental factors. Six (6) articles were backdated and non-retrieved; hence deducted from the list. Next stage was called as eligibility. Those 71 articles were clustered into three (3) categories; highly relevance, moderately relevance and less relevance to verify the eligibility of the documents correspond to the topic of this study. In eligibility stage four (4) articles were excluded since had poor relevancy to this study. The eligibility stage was completed by 6 September 2017 and in the synthesizing stage the final 67 articles have been scanned in-depth.
Through content analysis method, all final 67 articles have been synthesized base on the codes (i.e., variables) extracted from each article. The result of synthesizing stage was tabulated in the form of content analysis table, which is presented in the following sections.
2.2. Literature Content Analysis and Synthesize
Table 1 presents collective literature on number of variables (i.e., driver behaviors) influence vehicle fuel consumption and tailpipe emission. The variables are classified into four (4) clusters (i.e., FEf.) which are; (i) FEf1. Driving style; (ii) FEf2. Driving behavior associated with vehicle transmission; (iii) FEf3. Driving behavior associated with road design and traffic rules and (iv) FEf4. Driving behavior associated with Vehicle operational characteristics. The following explains each cluster and involved variables;
(i) FEf1. Driving style; Previous literature has found that human behavior is a broad and uncertain subject as it is morally relative and differs from one person to another. There have been extensive studies conducted on human behavior, including physiology, psychiatry, health, neural development, personality and attitude, psychopathology and brain stimulus. Furthermore, various models have been developed and applied in numerous applications, such as artificial intelligence, risk assessment, decision making, system safety analysis, human performance, education etc. [48]. Most of the preferred developed models are based on the artificial neural network or genetic algorithms as it can generate and replicate substantial information in human research. Driving is also highly associated with human factors. Driving requires attention and multiple skills. Inattentive driving can possibly cause high energy (i.e., fuel) consumption and high emissions [43,49]. Driver behaviors are incorporated with human’s mental and psycho-physical coordination, which reflects the ability of a driver to perceive driving situations and deal with it, for example at the intersections. Eventually, driving behavior can alter or reveal drivers’ profile and personality after being subjected to the driving situations and road conditions. The behavior of drivers could be passive or aggressive, ignorant, alert, tolerant, competent, skillful and etc. According to De Vlieger [50], the amount of fuel consumption and tailpipe emission from aggressive driving increases by 20–40%, while calm driving results in a reduction of 5% compared to the normal driving. The existing driving behavior models capture drivers’ tactical decisions in numerous traffic conditions. In the traffic engineering, there are two types of driving behavior models: macroscopic and microscopic models. These models are basically developed to compute and analyze traffic safety, traffic capacity and flow characteristics. Macroscopic models encompass the overall average traffic behavior in a system using partial differential equation (PDE) with functions for density, velocity and flow. Microscopic models measure the motion of individual vehicles in a system using the ordinary differential equation (ODE) with functions for position, velocity and acceleration. Macro-models are very general on a larger scale compared to the micro-models, which focus more on vehicle dynamics. However, massive computational work is required as the ODE computes results in each vehicle. Macro- and micro-models are further segregated into sub-models, such as Aw and Rascle (AR) model, Zhang model, gap acceptance model, car-following model, LightHill, Whitham and Richards (LWR) model and lane-changing model [26]. However, these models have limited exploration of drivers’ competency in view of instantaneous decision making, planning, anticipation and driving goals. Moreover, scarcity of travel information and database has reduced the accuracy of these developed models. As a result, driving behavior cannot be translated adequately, interdependently and rigorously [23].
Recently, the concept of eco-driving has gained interest among researchers, which opposed the traditional driving style. Eco-driving reduces fuel consumption and emissions without reducing the average speed of vehicles [51,52]. Furthermore, it ensures a safer journey and increases social responsibilities [53]. Evans [43] recommended improving fuel economy by adjusting driver’s behavior to follow specific instructions regarding improving fuel economy, for example, to minimize trip time; to avoid vigorous acceleration and deceleration. Eco-driving has potential in fuel saving [54]. The International Energy Agency [5] and previous studies [2,55,56,57] have calculated various amounts of fuel consumption savings from eco-driving and reported the short-term and medium-term impacts of eco-driving training. Just after eco-driving training, the average fuel efficiency will be improved by 15% [5,54,58], while, in the long-term, 5% to10% improvement will be expected [59,60].
(ii) FEf2. Driving behavior associated with vehicle transmission; The researchers declared that the association between driving behavior and vehicular emission is not limited to driving characteristics (i.e., acceleration, deceleration, speed, idling, braking) [61]. There is evidence that speed and acceleration are the most preferred driving parameters used by previous studies to visualize energy consumption and emission in driving behavior studies. Joumard et al. [62] reported that CO emissions decrease linearly with speed. He used vehicles with additional instruments to understand the correlation between emissions with acceleration and speed. For instance, 10 g/h of NOX emissions were released at a constant vehicle speed (45 km/h) or zero acceleration. At negative acceleration (–5 km/h2), the amount of NOx emission is estimated as 5 g/h, while this is approximately 18.5 g/h for positive acceleration (+5 km/h2) [62]. Moreover, previous research has stated that the posted speed can enhance fuel efficiency by 2–18%, if the drivers comply with lower speeds. At the peak engine torque, the fuel efficiency is lower. However, at higher RPM (Revolutions per minute) (low engine torque), acceleration is maximized and thus, fuel efficiency is higher [63,64,65]. Nevertheless, quick acceleration is still recommended by experts, although this should be a smooth transition. Enhancing fuel efficiency when driving requires drivers to anticipate the upcoming traffic or driving situations ahead in order to optimize vehicle acceleration and braking [66]. Rolling resistance (tires > 25%) influenced fuel consumption by 3–5% [67].
(iii) FEf3. Driving behavior associated with road design and traffic rules; Literature has shown that road and street design and traffic rules play significant roles in vehicle fuel consumption and emission. For example, Varhelyi [68] has investigated the effect of roundabout replacement with signalized intersection and vice versa. However, at an average junction that was rebuilt as roundabout, fuel consumption increased by 3%, CO emissions by an average of 4% and NOx emissions by 6%. Thus, a large reduction in fuel consumption can be obtained by replacing roundabouts with signalized junction. However, it would still yield an equal amount if the roundabout was rebuilt with the signalized junction [69]. The effects of environmental factors (e.g., traffic volumes, traffic signs and controls towards the vehicle fuel and tailpipe emission) have also been studied. According to Al-Ghandour [70], the overall average of CO2 emission and fuel consumption in the roundabout was reduced to 27% and 26%, respectively.
Green driving is associated with the driver’s awareness of his/her driving context. The driving context refers to all features of travel behavior and traffic, such as traffic density, headway margin, traffic congestion, lane position, vehicle speed, aggressive driving, deceleration, acceleration, idling, etc. The driver’s awareness refers to the driver’s knowledge about their capabilities and limitations. Some studies have demonstrated that the driver’s awareness of headway and traffic density helps to save the fuel and consequently, reduces emission of hazardous gases. Vaezipour et al. [71] stated that reducing headway by maximizing the speed, rapid acceleration or driving in the highest possible gear leads to a disruption in the traffic pattern, which may increase traffic density. Vaezipour et al. [71] suggested that drivers should stay in a fuel-efficient gear and use in-vehicle systems (e.g., intelligent speed adoption, congestion assistants, satellite navigation systems, Intelligent Transport Systems, etc.) to control the spacing margin between vehicles (i.e., headway). Nasir et al. [72] stated that traffic density affects vehicle average speed and the traffic flow rate. A green driver is an assertive driver, who is aware of different traffic conditions and monitors his/her reflection constructively to avoid accidents with other drivers. Therefore, green driver make headway without obstructing other drivers and maintain the safe distance to other vehicles without compromising traffic flow. Tang et al. [73] have investigated the impact of traffic density to multiple headways from the perspective of fuel consumption. They found that at a 20-m initial headway, a lower car density (20 nos) results in 13.4 L/100 km fuel consumption compared to a higher car density (80 nos), which consumes 13.1 L/100 km under the influence of ramps. At a 40-m initial headway, a lower car density (20 nos) results in 10.78 L/100 km fuel consumption compared to a higher car density (80 nos), which consumes 10.89 L/100 km under the influence of ramps. At an 80-m initial headway, a lower car density (20 nos) results in 10.28 L/100 km fuel consumption compared to a higher car density (80 nos), which consumes 10.46 L/100 km under the influence of ramps. [71]. Moreover, according to De Vlieger [50], the fuel consumption rate and tailpipe emission in rural and motorway driving modes were determined to be 30–40% lower compared to the urban area, which is normally 10 L/100 km.
Moreover, the emission factor is derived from specific vehicle driving cycles in different driving situations, such as urban, rural and motorway modes. The estimated emissions represent average results of travel scenarios, which should be applied at both the microscopic level and macro-scale (i.e., national/regional level) for emission inventories. The microscopic level models are suitable for green driving studies, as they tend to be more accurate in representing instantaneous operational driving actions. Although the macro-level models use the traffic data extracted from micro-level models, the microscopic level models might not be highly useful for green driving studies due to the limited trajectory data on aggregate driving characteristics. For example, the average speed model is derived from numerous speed levels in several trips. As a result, these are less meaningful on a microscopic level for green driving studies, because it does not represent specific driving characteristics [74].
(iv) FEf4. Driving behavior associated with vehicle operational characteristics; The literature states that vehicle factors, such as types of engine, fuels, engine capacity, maintenance, air conditioned and tire pressure, have been shown to have a significant impact on tailpipe emission and fuel consumption. For instance, a conventional car consumes 12.6 L/100 km fuel with an average CO2 emission of around 260 g/km, while the hybrid car consumes 8.23 L/100 km fuel with an average CO2 emission of 180 g/km [75]. Vehicle model selection (e.g., eco-car) has the largest effect on fuel economy. Uneconomical fuel consumption was recorded as 800% for all passenger cars, 355% for fully electronic vehicles, 227% for fully electric and hybrid vehicles and 100% for all pickups. For example, the Toyota Prius (as a hybrid electric car) testing shows 62.6% fuel consumption of Yuanjian and 60% emission less than Yuanjian [76].
According to Table 1, the depth of citation by clusters shows that most previous studies have focused on driving behavior associated with vehicle operational characteristics 33.3%, driving behavior associated with vehicle transmission (32.5%) and driving behavior associated with road design and traffic rules (28.8%). Fewer travel behavior researches have been conducted from the perspective of driver factors, especially their driving style. That is a lack of research that shows linkages or relationships between humans and vehicles, humans and environment or humans and driving operations based on the collected papers and journals. The systematic literature review determined that the driving Style (5.4%) has not been sufficiently studied, which support this study’s claim on lack of strong incorporation of driving behavior with vehicle emission and fuel consumption. Driving style here simply describes the types of drivers on the roads. Normally, aggressive drivers can be easily distinguished from other types of drivers (calm, sensible, normal, or eco).
To sum up, the road, traffic and driving behavior associated with vehicle operational characteristics should be measured and controlled. However, conducting experiments of human behavior is more complex and difficult to translate. Driver behavior deals with multiple personalities, emotions, attitudes, norms and beliefs. As human body and minds are inseparable, the communications between our emotional and rational systems can be witnessed throughout the decision-making process.
3. Establishing the Driver’s ‘Green’ Travel Behaviors Affecting Less Fuel Consumption and Tailpipe Emission
In second phase, an expert input study was conducted to determine the green value of each variable; and consequently, establish the green set of variables influencing fuel consumption and tailpipe emission in association with driving behavior.
The expert input study is such a group decision making procedure [133]. The group decision making procedure was conducted applying the grounded group decision making (GGDM) method. This method is a dynamic and heterogeneous decision-making process that incorporates selection of factors and consensus process upon factors selection. The GGDM is a useful method to overcome limitations in both technical and logistical aspect of the existing decision-making models. Logistically, GGDM can simplify time arrangement between decision makers and reduce cost of delay for decision making sessions. Technically, GGDM introduces limit and specific number of experts whom are well-versed and skillful in a particular area of study to remediate the difficulties in a discussed matter upon reaching consensus. Therefore, high number of experts are encouraged in GGDM process as it enhances sounder conclusion from different experts’ points of view as well as voting powers in attaining consensus on the matter. In addition, the GGDM method allows experts to involve other experts who are well relevant and competent in that particular research area. In GGDM, the responsible decision maker called “GGDM researcher” which records the decision process and analyze the results [134,135,136]. If one of the proposed expert was duplicated or introduced again by the experts, the decision-making process will stop because GGDM method terminates any repetition of proposed experts in the loop in order to determine the most normalized final decision [136]. Lamit et al. [134] developed Equation (1), which extends to the final weight (FW) of issue number ‘i,’ ( of the discussion.
where:
- i, refers to criteria number (for i = 1, 2, 3, …., m).
- , refers to issue of discussion (i.e., Driver travel behavior variables).
- , refers to assigned weight by expert number ‘j’ in close group discussion for issue ‘’.
- , refers to assigned weight by resource(s) relevant to the issue, whom introduced by expert number ‘j’ in close group discussion for issue ‘’.
- , refers to sessions value of the close group discussion sessions considered by the decision researcher for the set of issues ‘.’
Equation (2) indicates the consensus calculation of GGDM for issue ‘’. If the final consensus calculated more than 70%, the alternative is selected, and that criterion is approved.
where, , referred to maximum possible weight can be given to the issue ‘.’
A questionnaire was designed to be filled up by experts during group decision making sessions. The questionnaire form was designed using 5-point Likert scaling from 1 to 5 (from strongly disagree up to strongly agree). Two groups of experts consist of academician and practitioners were adopted in this study. The selection of expert is based on few criteria such as; background, specialization and experiences. The first group consists of lecturers, associate professor and PhD candidates across different disciplines in urban and transportation fields of research; including highway and transportation, traffic engineering, driver behavior, adaptive behavior, transportation planning and urban design and landscape architecture. The second group consists of practitioners across different disciplines; included, traffic engineers, police officers and driving institute instructors. According to GGDM’s purposive sampling, fourteen (14) participants have been involved; where eight (8) of them were academician and the remaining six (6) were practitioners. The GGDM method is able to overcome the logistical difficulties in arranging a specific time with involved decision makers and in saving the cost of managing the decision-making sessions. The GGDM method is also capable to manage the technical difficulties of experts involved in the decision making. The method also allows the appointment of voting power to each multiple participants of close group discussion (CGD). The result of the GGDM process is tabulated in Table 2 (academic experts) and Table 3 (practitioners).
3.1. Expert Input Analysis and Results
For an academic group of experts, there are four (4) validation sessions required upon reaching consensus. Validation sessions were differentiated according to the experience of involved experts in each session. The first validation session was conducted among academicians with less than 10 years of experience. The second validation session was conducted among academicians with more than 10 and 15 years of experience. The third validation session was conducted among researchers without practical working experience. While, the final validation session was conducted among traffic engineers, police officers and driving instructors with less than 10 years of experience.
Table 2 and Table 3 show the summary of GGDM data collection and analysis results of experts’ judgments to each variable significantly influencing vehicle fuel consumption and tailpipe emission in association with driving behavior. The following presents an example of GGDM method application and calculation process on the variable FEf1.1. Avoiding aggressive driving.
Example (see Table 3):
FEf1.1. Avoiding aggressive driving:
- Step 1—Calculate the score ∑(Cwp × sv); Cwp is the minimum score,FW (ai) = ((Cwp1 × sv) + (Cwp2 × sv) + (Cwp3 × sv) + … (Cwpn × sv)) = ((4 × 2) + (4 × 2) + (4 × 2) + (3 × 2) + (4 × 2) + (5 × 2)) = 48
- Step 2—Calculate FW (ai)max, Max = 5FW (ai)max = (5 × sv × No. of participants) = (5 × 2 × 6) = 60
- Step 3—Calculate the consensus rate (%)Consensus (%) = FW (ai)/FW (ai)max = (48/60) × 100 = 80% > 70%, thus ‘approved’
Results are tabulated independently based on groups of experts. The initial results in Table 2 shows; all variables have been approved as green variables exempt two (2) variables which are, FEf3.2. Paying full attention and obeying traffic signs and signals (66%) and FEf3.6. Minding pedestrian crossings (60%) were not approved since the consensus percentages were less than 70% saturation threshold. Meanwhile, in Table 3 shows three (3) unapproved variables which are; FEf3.4. Caring of traffic flow at roadway/street intersections/junctions (67%), FEf3.6. Minding pedestrian crossings (60%) and FEf4.6. Regular service and check tires rolling resistance (67%) for the same uncovered 70% saturation threshold. So, these variables have been dropped from the initial list. The next section measures the GV of these established green variables using the results of depth of citation (i.e., frequency of citation) reported in the contents analysis Table 1.
3.2. Green Value (GV) Analysis of Driver’s Green Travel Behaviors
The green driver is defined as a driver who makes green-wise decisions in traveling focusing on safety, vehicle and environment, merges his/her psychological and psychosocial attributes and personality traits (i.e., preferences, beliefs, attitude, intention, cognition, attention and psychomotor behavior) with his/her technical knowledge in respect of reducing fuel consumption and emission. Accordingly, the Green Value (GV) assigns the green score which is drawn from evaluation and assessment of the driver’s behaviors, actions and reflections across these green characteristics. To analyze the GV of each variable, this section integrates the results output from the content analysis Table 1 (i.e., depth of citation) and expert input results (i.e., GGDM analysis results). The purpose of this section is to establish the green impact of those established variables output from GGDM analysis procedure. This section indicates some variables will be eliminated instantly, although the depth of citation is higher than the GGDM consensus rate. The depth of citation is determined using the citation frequency divided by total number of cited (i.e., output from 4th stage of the systematic literature review process) articles. Meanwhile, GGDM results from two groups of academics and practitioners were summed and divided into 2, to obtain the average values. Then, both values are multiplied as shown in the Equation (3) below.
where:
- i, refers to criteria number (for: 1, 2, 3, …., m).
- k; refers to article number (for k = 1, 2, 3, …, n).
- refers to Depth of Citation of factor ‘’ (extracted from Table 1: Content Analysis).
- C, number of referenced articles involved in content analysis Table (extracted from Table 1: Content Analysis).
- CR, number of articles have been cited for the factor ‘ ’ (extracted from Table 1: Content Analysis).
The following presents an example of Green Value (GV) analysis and calculation of Equation (3) on the variable FEf1.1. Avoiding aggressive driving (see Table 4).
Example:
FEf1.1. Avoiding aggressive driving:
Refereeing to Table 4 data, thus;
So, Green Value (GV) FEf1.1. = Average depth of citation FEf1.1. × Average GGDM consensus rate FEf1.1. = 0.18 × 0.89 = 0.16.
Table 5 shows the GV analysis of the green variables. The aim of this section is to indicate the green value of each driver behavior to tailpipe emission ad fuel consumption. According to Table 3, four (4) variables were not applicable in GV analysis with respect to results of previous section on low consensus rate of GGDM calculation (included, FEf3.4. Caring of traffic flow at roadway/street intersections/junctions (67%), FEf3.6. Minding pedestrian crossing 60%), FEf4.6. Regular service and check tires rolling resistance (67%) and FEf4.7. Regular service and check the vehicle’s routing system (69%).
Also, Green Value (GV) is folded into three (3) clusters of green impact degree as; (i) ≤0.3; (ii) 0.3–0.5; and (iii) ≥0.5.
- (i)
- if ≤0.3; has ‘weak’ contribution to the vehicle fuel and emission measurements.
- (ii)
- if 0.3–0.5; has ‘moderate’ contribution to the vehicle fuel and emission measurements.
- (iii)
- if ≥0.5; has ‘high’ contribution to the vehicle fuel and emission measurements.
According to Figure 5, driving speed (FEf2.2.) (0.76) and vehicle acceleration (FEf2.1.) (0.57) are categorized into the third cluster (i.e., high contribution), while vehicles associated with Vehicle operational characteristics included, capacity of engine (FEf4.2.) (0.51), vehicle horsepower (FEf4.3.) (0.45), vehicle weight (FEf4.5.) (0.39), roadway and street intersection design (FEf3.4.) (0.47) and traveling time and distance (FEf3.1.) (0.35) are categorized in the second cluster (i.e., moderate contribution). Last but not least, the remaining variables which are less than or equals to 0.3 are categorized under first cluster (i.e., minimum contribution). In particular, minimum focus on aggressive driving (FEf1.1.) (0.16) has hindered the association between fuel consumption, emission and human behavior. Hence, human factors remain unaccountable and non-measurable yet in green driver behavior studies. Scarcity of literature has evidenced that appropriate methods are intensely required to measure and translate drivers’ aggressiveness or personality towards fuel consumption and emission while driving.
4. Discussions
The fuel consumption can be considerably reduced by short-term and long-term training [137], however, Johansson et al. [138] expressed that “both training and motivation are needed for drivers to achieve long-term fuel savings”.
According to previous studies, drivers’ travel behaviors can be clustered to the following: (1) behavior in response to values and beliefs; (2) behavior in response to skills and capabilities; and (3) behavior in response to car environmental quality. In respect to each type of behavior, drivers may make different decisions on fuel economy improvement strategies, including strategic, tactical and operational decisions;
- Strategic decisions can reduce the environmental impact of travel [66]. For example, maintaining optimal tire pressure and the emission control system are the major driver’s strategic decisions, which can reduce 40% of vehicle emissions [139]. According to Sivak and Schoettle [66], in strategic decisions, the vehicle type has the greatest impact on (38%) the fuel economy. Congestion in tactical dimension and aggressive driving in operational dimension has more influence than other factors (40% and 30%, respectively).
- Tactical decisions aids to minimize the negative environmental impact of travel. Some tactical decisions include choosing smaller-engine vehicles [8], optimum choice of route [66], shortening the length/time of travel and choices of vehicle loading. According to EPA [8], each extra 45 kg of load causes a 2% increase in fuel consumption. The optimum choice of route contributes 15–40% increment in fuel economy [66]. This performance will be improved by 23% using a fuel-optimized navigation system [92].
- As operational decisions contribute to fuel consumption and emission reduction by 5–30% [110,140]. Training drivers to have more gradual and smooth driving style is an operational decision that helps to reduce fuel consumption in contrast with aggressive driving, hard acceleration and excessive speed [141].
In this research, twenty-one (21) driver travel behaviors were identified. All green travel behaviors (i.e., variables) were identified through a systematic literature review and were weighted based on the depth of citation (i.e., frequency of citation) and GGDM method’s consensus rate. Four (4) variables were dropped according to GGDM consensus condition (including, FEf3.2. Paying full attention and obeying traffic signs and signals, FEf3.6. Managing towards pedestrian crossings, FEf4.6. Aware of and managing the vehicle’s tire rolling resistance and FEf4.7. Managing and controlling the vehicle’s routing system) and the rest Seventeen (17) variables have been established as the green travel behaviors. The green impact analysis was incorporated to these variables. The green impact analysis indicated three (3) clusters of variables; (i) Green Value (GV) is less than or equals to 0.3; (ii) GV is in between 0.31 and 0.5; and (iii) GV is greater than or equals to 0.51. The green impact analysis resulted these variables have been classified in the Cluster i, as moderate to highly significant influencing on less fuel consumption and less emission; included, avoiding excessive/ inappropriate speed of vehicle (0.76), avoiding fast acceleration/ deceleration of vehicle (0.57), aware and monitoring the capacity of engine (0.51), caring of roadway and street design (0.47), aware of and monitoring vehicle’s horsepower (0.45), aware of and managing the vehicle’s weight (0.39) and managing the travelling time and travelling distance (0.35). Although the rest of variables can contribute to less consumption and emission, their impact would be minor.
For the speed variable, vehicle emission and fuel consumption are more sensitive to non-constant cruise-speed levels. Therefore, vehicle emission and fuel consumption rates will be considerably increased as a driver drives. However, converting the driver’s speed behavior to accurate amount of fuel consumed based on acceleration is a big challenge. The studies show that aggressive driving affects speed and therefore, will have an impact on fuel consumption and emission. Ogle [142] states “although aggression is not a behavioral consideration in fuel and emissions studies, similar definitions based on appropriate acceleration rates could possibly be used as surrogate measures for speeding, following too closely, improper lane change and perhaps other aggressive driving behaviors”. The research on driver speed behavior and acceleration have mostly focused to non-usual vehicles (i.e., hybrid cars, electric-cars, eco-cars, etc.).
For the acceleration variable, De Vlieger [50] identifies three types of driving behaviors associated with fuel consumption based on acceleration: calm driving (1–1.45 mph/s), normal driving (1.45–1.90 mph/s) and aggressive driving (1.90–2.45 mph/s). Nam et al. [143] and Zorrofi et al. [144] stated that aggressive driving behavior and higher fuel emissions are strongly correlated. Aggressive driving wastes gas mileage by 33% at highway speeds and by 5% around town [99]. Rakha and Ding [95] stated the constant deceleration rates (−0.25 to −1.50 m/s2) at increments of −0.25 m/s2 reduced the amount of fuel consumption by about 0.09 L/km.
For the road and street variables, Ericsson [86] stated that the street type significantly impacts to the fuel emissions and the driver’s aggressive acceleration behavior comes second. Hassan [145] stated “besides driver’s error, road characteristics play a major role in collision occurrence.” Furthermore, Austroads’ reports [146] expressed that “the relationship between vehicle speed, curve radius, pavement super-elevation, friction between tire and road surface and gravity is well documented” if there is a comprehensive road design guidance. Most of the research on road geometric design focuses on four areas: vehicle stability, operating speed, driver workload and alignment indices [147,148]. However, there are some factors, such as road slope, pavement, friction, weather conditions, level of skill, accident circumstances and so on, can be studied in future, as they would give a broader knowledge of how driver behavior is affected by road geometry and design features. Moreover, previous research has focused more on safety, especially as several studies have indicated that safety can be affected by road design. For example, Theeuwes et al. [149] expressed that the association between driver behavior and road design is a gap in previous research as it can reduce the accident severity and frequency. However, the triangulation between driver behavior, road design and energy saving/emission reduction has room to be analyzed and investigated.
For the vehicle horsepower variable, Brundell-Freji and Ericsson [96] state that the “power-to-weight ratio had a fairly large impact on overall driving style,” which was supported by Andre et al. [150]. Berry [151] and Zhang et al. [129] stated that vehicle design changes (such as higher number of gears and lower power-to-weight ratios) can increase the efficiency. Berry [151] expressed that the power-to-weight ratio in moderate-performance vehicles is not an effective factor in aggressive driving studies, although the triangulation with energy saving and emission reduction was not yet studied.
For the capacity of engine variable, reviewing the literature demonstrates that no triangulation between the driver behavior, capacity of engine, vehicle emission and fuel consumption have been conducted. Therefore, studying such triangulation analysis would be essential for transportation scholars and practitioners.
For the vehicle weight variable, there are very general and few studies that have examined the correlation between driver behavior, vehicle weight and vehicle emission and fuel consumption. For example, Wu et al. [152] suggest generally avoiding unnecessary weight and removing roof racks.
For the traveling distance and time variable, literature has indicated that vehicular emissions–distance models can also be used to represent the real driving behavior. However, such models are sophisticated and complex, require massive amount of data and can be particularly used in a microscopic level studies. Technically, such models show that the standard deviation of accelerator pedal/throttle is lower and thus, it verifies the correlation between emissions and driving style [75]. In comparison to the earlier models, these models are formulated based on the acceleration and speed of vehicles under different driving operations, which are idle, acceleration, deceleration and steady-state cruising speed. Even so, there are still gaps in the vehicular emission model development, especially in variation of vehicles and driving characteristics [74,153].
5. Conclusions
The behavior assessment of drivers is vital to improve the existing human travel behaviors. This study has investigated numerous driver behaviors that influence vehicle fuel consumption and tailpipe emission in association with driving behavior. According to the analysis, driver’s modifiable factors (i.e., personalities, attitudes, cognitive and risks) are seldom underestimated in consideration of fuel consumption and emission in driver travel behavior studies. Previous researchers were keen to investigate the environmental and vehicle effects on fuel and emission as these components have become more translatable and measurable compared to human behavior. This study declares that driver behavior is rather complex and is governed by psychological, psychosocial and cognitive attributes. Indeed, driver behavior can be highly associated with how well his/her brain makes decisions and translates the information through motor skills in driving activities. Thus, we highly recommend further investigation into driver behavior in fuel consumption and emission studies, with this study having explored and established a set of seventeen behaviors. The outcome of this research has constructed the firm platform for developing the green driver behavior index model, which can assess the green of any individual driver in fuel-saving and low-emission style of driving. To develop this index model, the established list of driver behaviors will be applied by researchers to carry out experimental works on measuring green driver behaviors. This index model will make the driver’s behavior more measurable in the future. Furthermore, the index model will able to explore and understand the driver’s mindset and decision-making patterns for green driving.
Transportation planners, urban designers and planners, consultants, authority may use this comprehensive list of seventeen green driver behaviors as a checklist for green accreditation, assessment and labeling the driver. Furthermore, the research states that weighted value (i.e., coefficient) of each behavior can be applied in the driver assessment indexing formula.
This research reports the first phase of a big project. This phase has shown that the development of continuous and advanced monitoring devices to assess driving behavior is highly treasured and thus, the green driver concept would be more measurable in future travel behavior studies. Particularly, psychological and personality traits could be incorporated into any established green travel behaviors and studied thoroughly. In the next phase, the established list of the green behaviors can be incorporated into the development of the green driver index assessment tool. In future works, correlation analysis between green driver behaviors and vehicle emission fuel consumption can be studied. Indeed, these established green travel behaviors can be used as a checklist to evaluate the driver’s performance with respect to green driving. In addition, this checklist can be upgraded to a stand-alone and/or web-based decision support system for assessing, monitoring, recording and publishing reports on a driver’s performance in green driving accreditation.
The findings of this study can be generalized to all nations, although according to the explained scopes of research in the introduction, there are some minor difference in terms of policies, culture, climate and so on of the nations. Hence, the list of green behaviors can be adjusted and expanded according to governmental transportation planning rules and policies as well as other related issues.
The Green Value (GV) index includes 2 parts: and . The is the coefficient for and thus, may have a minor impact on the final GV result. As the systematic literature review method has been applied to obtain the depth of the citation for each criterion, any changes to the systematic procedure may affect the although the impact of this on the final GV of that criterion should be very minor. The changes to this systematic procedure would be due to the sources available for literature collection, updated recent articles, increased citation of the selected articles and so on. Moreover, in this research, the GV was the measure of the association of green driver behaviors with fuel consumption and emissions through an expert input study so it was estimated qualitatively. As previously mentioned, we suggest that future works should measure this quantitatively as well.
At the end, this paper scoped to environment and vehicles dimension of the green driver concept, while the association between green driver behavior and safety will be investigated in future works.
Acknowledgments
The authors would like to thank the Malaysia Ministry of Science Technology and Innovation (MOSTI) grant vote No. R.J130000.7922.4S123. Also, the authors appreciate these organizations for their supports and contributions and Research Management Center at Universiti Teknologi Malaysia.
Author Contributions
The authors, Nurul Hidayah Muslim, Ali Keyvanfar, Arezou Shafaghat and Majid Khorami have all contributed to preparing this manuscript and Mu’azu Mohammed Abdullahi contributed towards structuring it.
Conflicts of Interest
The authors declare no conflict of interest.
References
- Rodrigue, J.P.; Comtois, C. Transportation and energy. In The Geography of Transport Systems; Routledge: Abingdon, UK, 2010. [Google Scholar]
- International Energy Agency (IEA). Key Trends—CO2 Emissions from Fuel Combustion; IEA: Paris, France, 2015. [Google Scholar]
- Eurostat European Commission. 2012. Available online: https://www.ec.europa.eu/eurostat/web/lucas/data/primary-data/2012 (accessed on 28 December 2015).
- Energy Information Administration (EIA). Transportation Sector Energy Consumption. 2015. Available online: https://www.eia.gov/outlooks/ieo/pdf/transportation.pdf (accessed on 28 December 2015).
- International Energy Agency (IEA). International Energy Outlook 2006. Available online: https://www.eia.gov/outlooks/ieo/pdf/0484(2016).pdf (accessed on 28 December 2015).
- The Energy and Resources Institute (TERI). 2015. Available online: http://www.teriin.org/ (accessed on 28 December 2015).
- Devaraj, A.; Colby, R.; Hess, W.P.; Perea, D.E.; Thevuthasan, S. Role of photoexcitation and field ionization in the measurement of accurate oxide stoichiometry by laser-assisted atom probe tomography. J. Phys. Chem. Lett. 2013, 4, 993–998. [Google Scholar] [CrossRef] [PubMed]
- Environmental Protection Agency (EPA). Green Vehicle Guide. 2016. Available online: https://www.epa.gov/greenvehicles (accessed on 28 December 2015).
- Matsumoto, Y.; Tsurudome, D. Evaluation of Providing Recommended Speed for Reducing CO2 Emissions from Vehicles by Driving Simulator. Transp. Res. Procedia 2014, 3, 31–40. [Google Scholar] [CrossRef]
- Kewat, P.; Narain, B.; Kumar, S. Monitoring CO2 Emission Due to Transportation. Int. J. Adv. Comput. Technol. Appl. 2017, 5, 11–13. [Google Scholar]
- Ong, H.C.; Mahlia, T.M.I.; Masjuki, H.H. A review on energy pattern and policy for transportation sector in Malaysia. Renew. Sustain. Energy Rev. 2012, 16, 532–542. [Google Scholar] [CrossRef]
- Olivier, J.G.J. En the Climate System; Berdowski, J., Guicherit, R.Y., Heij, B.J., Eds.; Swets & Zeitlinger: Lisse, The Netherlands, 2011; pp. 33–78. [Google Scholar]
- Anable, J. Complacent car addicts’ or aspiring environmentalists? Identifying travel behavior segments using attitude theory. Transp. Policy 2005, 12, 65–78. [Google Scholar] [CrossRef] [Green Version]
- Yang, R.; Long, R.; Bai, Y.; Li, L. The influence of household heterogeneity factors on the green travel behavior of urban residents in the East China region. Sustainability 2017, 9, 237. [Google Scholar] [CrossRef]
- Wang, P.; Rau, P.L.P.; Salvendy, G. Road safety research in China: Review and appraisal. Traffic Inj. Prev. 2010, 11, 425–432. [Google Scholar] [CrossRef] [PubMed]
- Bekiaris, E.; Stevens, A. Common risk assessment methodology for advanced driver assistance systems. Transp. Rev. 2005, 25, 283–292. [Google Scholar] [CrossRef]
- Forbes, T. Human Factors in Highway Traffic Safety Research; ARRB Group Limited: Leederville, Australia, 1972. [Google Scholar]
- Jovanović, D.; Lipovac, K.; Stanojević, P.; Stanojević, D. The effects of personality traits on driving-related anger and aggressive behavior in traffic among Serbian drivers. Transp. Res. F 2011, 14, 43–53. [Google Scholar] [CrossRef]
- Lucidi, F.; Mallia, L.; Lazuras, L.; Violani, C. Personality and attitudes as predictors of risky driving among older drivers. Accid. Anal Prev. 2014, 72, 318–324. [Google Scholar] [CrossRef] [PubMed]
- Cai, X.; Lu, J.J.; Xing, Y.; Jiang, C.; Lu, W. Analyzing driving risks of roadway traffic under adverse weather conditions: In case of rain day. Procedia Soc. Behav. 2013, 96, 2563–2571. [Google Scholar] [CrossRef]
- Mathias, J.L.; Lucas, L.K. Cognitive predictors of unsafe driving in older drivers: A meta-analysis. Int. Psychogeriatr. 2009, 21, 637–653. [Google Scholar] [CrossRef] [PubMed]
- Chakrabarty Kamini, N.G. Analysis of driver behavior and crash characteristics during adverse weather conditions. Procedia Soc. Behav. 2003, 104, 1048–1057. [Google Scholar] [CrossRef]
- Toledo, T. Driving behavior: Models and challenges. Transp. Rev. 2007, 27, 65–84. [Google Scholar] [CrossRef]
- Shafaghat, A.; Majid, M.Z.; Keyvanfar, A. Green Highway and Street Development; Lambert Academic Publisher: Berlin, Germany, 2016. [Google Scholar]
- The Canadian Renewable Fuels Association (CRFA). Biofuels Reduce GHG Emissions, Cleaner Fuel, Cleaner Air. 2010. Available online: http://greenfuels.org/ (accessed on 28 December 2015).
- Miller, V. Public Transportation Is a Green Industry and Going Greener; American Public Transportation Association: Washington, DC, USA, 2011. [Google Scholar]
- Natural Recourse Canada (NRCAN). Transportation. 2016. Available online: http://www.nrcan.gc.ca/energy/efficiency/transportation/7681 (accessed on 28 December 2015).
- Green Vehicle Guide. 2016. Available online: https://www.greenvehicleguide.gov.au/ (accessed on 20 January 2018).
- National Highway Traffic Safety Administration (NHTSA). Vehicle Safety. 2013. Available online: http://www.nhtsa.gov/Vehicle+Safety (accessed on 28 December 2015).
- Lee, D.H.; Park, S.Y.; Chul Hong, J.; Choi, S.J.; Kim, J.W. Analysis of the energy and environmental effects of green car deployment by an integrating energy system model with a forecasting model. Appl. Energy 2013, 103, 306–316. [Google Scholar] [CrossRef]
- Mikalsen, R.; Wang, Y.D.; Roskilly, A.P. A comparison of Miller and Otto cycle natural gas engines for small scale CHP application. Appl. Energy 2009, 86, 922–927. [Google Scholar] [CrossRef]
- McKinnon, A.; Allen, J.; Woodburn, A. Development of greener vehicles, aircraft and ships. In Green Logistics: Improving the Environmental Sustainability of Logistics; Kogan Page: London, UK, 2010; pp. 140–166. [Google Scholar]
- Doppelt, D.; Markowitz, E.M. Reducing Greenhouse Gas Emissions through Behavioral Change: An Assessment of Past Research on Energy Use, Transportation and Water Consumption; Climate Leadership Initiative: Eugene, OR, USA, 2009. [Google Scholar]
- Bamberg, S. Is a Stage Model a Useful Approach to Explain Car Drivers’ Willingness to Use Public Transportation? J. Appl. Soc. Psychol. 2007, 37, 1757–1783. [Google Scholar] [CrossRef]
- Saniul Alam, M.D.; McNabola, A. A critical review and assessment of Eco-Driving policy & technology: Benefits & limitations. Transp. Policy 2014, 35, 42–49. [Google Scholar]
- Jeffreys, I.; Graves, G.; Roth, M. Evaluation of eco-driving training for vehicle fuel use and emission reduction: A case study in Australia. Transp. Res. D 2016. [Google Scholar] [CrossRef]
- Yan, X.; Li, X.; Liu, Y.; Zhao, J. Effects of foggy conditions on drivers’ speed control behaviors at different risk levels. Saf. Sci. 2014, 68, 275–287. [Google Scholar] [CrossRef]
- Jung, S.; Jang, K.; Yoon, Y.; Kang, S. Contributing factors to vehicle to vehicle crash frequency and severity under rainfall. J. Saf. Res. 2014, 50, 1–10. [Google Scholar] [CrossRef] [PubMed]
- Hamdar, S.H.; Qin, L.; Talebpour, A. Weather and road geometry impact on longitudinal driving behavior: Exploratory analysis using an empirically supported acceleration modeling framework. Transp. Res. 2016, 67, 193–213. [Google Scholar] [CrossRef]
- Hoogendoorn, R.G.; Hoogendoorn, S.P.; Brookhuis, K.A.; Daamen, W. Simple and multi-anticipative car-following models: Performance and parameter value effects in case of fog. In Proceedings of the TFTC Summer Meeting, Annecy, France, 7–9 July 2010; pp. 2–16. [Google Scholar]
- Brackstone, M.; Waterson, B.; McDonald, M. Determinants of following headway in congested traffic. Transp. Res. F 2009, 12, 131–142. [Google Scholar] [CrossRef]
- Ibrahim, A.T.; Hall, F.L. Effect of Adverse Weather Conditions on Speed-Flow-Occupancy Relationships; Transportation Research Board: Washington, DC, USA, 1994. [Google Scholar]
- Evans, J.E.J. Transit Scheduling and Frequency; Transportation Research Board: Washington, DC, USA, 2004. [Google Scholar]
- Zholudeva, N. Transport Fuels. 2016. Available online: https://www.studentenergy.org/topics/transport-fuels (accessed on 28 December 2015).
- Wolf, F.M.; Shea, J.A.; Albanese, M.A. Toward setting a research agenda for systematic reviews of evidence of the effects of medical education. Teach. Learn. Med. 2001, 13, 53–60. [Google Scholar] [CrossRef]
- Ariens, G.A.M.; Vanmechelen, W.; Bongers, P.M.; Bouter, L.M.; Vanderwal, G. Psychosocial risk factors for neck pain: A systematic review. Am. J. Ind. Med. 2001, 39, 180–193. [Google Scholar] [CrossRef]
- Lievense, A.M.; Bierma-Zeinstra, S.M.A.; Verhagen, A.P.; Verhaar, J.A.N.; Koes, B.W. Prognostic factors of progress of hip osteoarthritis: A systematic review. Arthritis Care Res. 2002, 47, 556–562. [Google Scholar] [CrossRef] [PubMed]
- Shafaghat, A.; Keyvanfer, A.; Muslim, N.H.B. Drivers’ adaptive travel behaviors towards green transportation development: A critical review. Arch. Transp. 2016, 38, 49–70. [Google Scholar] [CrossRef]
- Handy, S.; Krizek, K. The Role of Travel Behavior Research in Reducing the Carbon Footprint: From the US Perspective; Lulu.com Publishers: Raleigh, NC, USA, 2012; pp. 37–58. [Google Scholar]
- De Vlieger, I.; De Keukeleere, D.; Kretzschmar, J.G. Environmental effects of driving behavior and congestion related to passenger cars. Atmos. Environ. 2000, 34, 4649–4655. [Google Scholar] [CrossRef]
- Barić, D.; Zovak, G.; Periša, M. Effects of eco-drive education on the reduction of fuel consumption and CO2 emissions. PROMET Traffic Transp. 2013, 25, 265–272. [Google Scholar] [CrossRef]
- Xiang, X.; Zhou, K.; Zhang, W.B.; Qin, W.; Mao, Q. A Closed-Loop Speed Advisory Model with Driver’s Behavior Adaptability for Eco-Driving. IEEE Trans. Intell. Transp. 2015, 16, 3313–3324. [Google Scholar] [CrossRef]
- European Commission. Ecodriving—Widespread Implementation for Learners and Licensed Drivers (ECOWILL); Intelligent Energy Europe: Brussels, Belgium, 2010; Available online: https://ec.europa.eu/ energy/intelligent/projects/en/projects/ecowill (accessed on 20 January 2018).
- Barla, P.; Gilbert-Gonthier, M.; Castro, M.A.L.; Miranda-Moreno, L. Eco-driving training and fuel consumption: Impact, heterogeneity and sustainability. Energy Econ. 2017, 62, 187–194. [Google Scholar] [CrossRef]
- Barth, M.; Boriboonsomsin, K. Energy and emissions impacts of a freeway-based dynamic eco-driving system. Transp. Res D 2009, 14, 400–410. [Google Scholar] [CrossRef]
- Xia, H.; Boriboonsomsin, K.; Barth, M. Dynamic eco-driving for signalized arEPAal corridors and its indirect network-wide energy/emissions benefits. J. Intell. Transp. Syst. 2013, 17, 31–41. [Google Scholar] [CrossRef]
- Prendinger, H.; Oliveira, J.; Catarino, J.; Madruga, M.; Prada, R. ICO2: A networked game for collecting large-scale eco-driving behavior data. IEEE Internet Comput. 2014, 18, 28–35. [Google Scholar] [CrossRef]
- Onoda, T. IEA policies-G8 recommendations and an afterwards. Energy Policy 2009, 37, 3823–3831. [Google Scholar] [CrossRef]
- Tulusan, J.; Staake, T.; Fleisch, E. Providing eco-driving feedback to corporate car drivers: What impact does a smartphone application have on their fuel efficiency? In Proceedings of the 2012 ACM Conference on Ubiquitous Computing, Pittsburgh, PA, USA, 5–8 September 2012; pp. 212–215. [Google Scholar]
- Mcllroy, R.C.; Stanton, N.A. Eco-Driving: From Strategies to Interfaces; CRC Press: Boca Raton, FL, USA, 2017. [Google Scholar]
- Shancita, I.; Masjuki, H.H.; Kalam, M.A.; Fattah, I.R.; Rashed, M.M.; Rashedul, H.K. A review on idling reduction strategies to improve fuel economy and reduce exhaust emissions of transport vehicles. Energy Convers. Manag. 2014, 88, 794–807. [Google Scholar] [CrossRef]
- Joumard, R.; Jost, P.; Hickman, J. Influence of Instantaneous Speed and Acceleration on Hot Passenger Car Emissions and Fuel Consumption (No. 950928); SAE Technical Paper; SAE International: Warrendale, PA, USA, 1995. [Google Scholar]
- Jansen, P.C.G.F. Driver Influence on the Fuel Consumption of a Hybrid Electric Vehicle. Ph.D. Thesis, Delft University of Technology, Delft, The Netherlands, 2012. [Google Scholar]
- Eisenberg, A. What’s Next: Dashboard Miser Teaches Drivers How to Save Fuel. New York Times. Available online: http://www.nytimes.com/2001/06/07/technology/what-s-next-dashboard-miser-teaches-drivers-how-to-save-fuel.html (accessed on 20 January 2018).
- Sivak, M.; Schoettle, B. Eco-Driving: Strategic, Tactical and Operational Decisions of the Driver That Improve Vehicle Fuel Economy; The University of Michigan Transportation Research Institute: Ann Arbor, MI, USA, 2011. [Google Scholar]
- Van Mierlo, J.; Maggetto, G.; Van de Burgwal, E.; Gense, R. Driving style and traffic measures-influence on vehicle emissions and fuel consumption. Proc. Inst. Mech. Eng. D 2004, 218, 43–50. [Google Scholar] [CrossRef]
- Lee, J.; Kim, J.; Park, J.; Bae, C. Effect of the air-conditioning system on the fuel economy in a gasoline engine vehicle. Proc. Inst. Mech. Eng. D 2012, 227, 66–77. [Google Scholar] [CrossRef]
- Várhelyi, A. Speed management via in-car devices: Effects, implications, perspectives. Transportation 2002, 29, 237–252. [Google Scholar] [CrossRef]
- Várhelyi, A. The effects of small roundabouts on emissions and fuel consumption: A case study. Transp. Res. D 2002, 7, 65–71. [Google Scholar] [CrossRef]
- Al-Ghandour, M. Analysis of fuel consumption and emissions at roundabout with slip lane, using SIDRA and validation by MOVES simulation. In Proceedings of the 2nd Transportation and Development Congress, Orlando, FL, USA, 8–11 June 2014. [Google Scholar]
- Tang, T.Q.; Li, J.G.; Yang, S.C.; Shang, H.Y. Effects of on-ramp on the fuel consumption of the vehicles on the main road under car-following model. Physica A 2015, 419, 293–300. [Google Scholar] [CrossRef]
- Vaezipour, A.; Rakotonirainy, A.; Haworth, N. Reviewing in-vehicle systems to improve fuel efficiency and road safety. Procedia Manuf. 2015, 3, 3192–3199. [Google Scholar] [CrossRef]
- Nasir, M.K.; Md Noor, R.; Kalam, M.A.; Masum, B.M. Reduction of fuel consumption and exhaust pollutant using intelligent transport systems. Sci. World J. 2014, 2014, 836375. [Google Scholar] [CrossRef] [PubMed]
- Esteves-Booth, A.; Muneer, T.; Kubie, J.; Kirby, H. A review of vehicular emission models and driving cycles. Proc. Inst. Mech. Eng. C 2002, 216, 777–797. [Google Scholar] [CrossRef]
- Alessandrini, A.; Filippi, F.; Orecchini, F.; Ortenzi, F. A new method for collecting vehicle behaviour in daily use for energy and environmental analysis. Proc. Inst. Mech. Eng. D 2006, 220, 1527–1537. [Google Scholar] [CrossRef]
- Song, G.H.; Yu, L.; Mo, F.; Zhang, X. PEMS-Based Comparative Study on Real-Road Emissions from Hybrid Electric and Gasoline Vehicles. In Proceedings of the International Conference on Transportation Engineering, Chengdu, China, 22–24 July 2007; pp. 1747–1752. [Google Scholar]
- Robertson, D.I.; Baker, R.T.; Lucas, C.F. Coordinating Traffic Signals to Reduce Fuel Consumption (No. LR 934 Monograph); Transport and Road Research Laboratory: Berks, UK, 1980. [Google Scholar]
- Descornet, G. Road-surface influence on tire rolling resistance. In Surface Characteristics of Roadways: International Research and Technologies; ASTM International: West Conshohocken, PA, USA, 1990. [Google Scholar]
- Fischer, K.; Müller, J.P.; Pischel, M.; Schier, D. A Model for Cooperative Transportation Scheduling. In Proceedings of the First International Conference on Multiagent Systems, San Francisco, CA, USA, 12–14 June 1995; pp. 109–116. [Google Scholar]
- Kelly, N.A.; Groblicki, P.J. Real-world emissions from a modern production vehicle driven in Los Angeles. Air Waste 1993, 43, 1351–1357. [Google Scholar] [CrossRef]
- Cicero-Fernández, P.; Long, J.R.; Winer, A.M. Effects of grades and other loads on on-road emissions of hydrocarbons and carbon monoxide. J. Air Waste Manag. Assoc. 1997, 47, 898–904. [Google Scholar] [CrossRef] [PubMed]
- Holmén, B.A.; Niemeier, D.A. Characterizing the effects of driver variability on real-world vehicle emissions. Transp. Res. D 1998, 3, 117–128. [Google Scholar] [CrossRef]
- Wipke, K.B.; Cuddy, M.R.; Burch, S.D. ADVISOR 2.1: A user-friendly advanced powertrain simulation using a combined backward/forward approach. IEEE Trans. Veh. Technol. 1999, 48, 1751–1761. [Google Scholar] [CrossRef]
- Höglund, P.G.; Niittymäki, J. Estimating vehicle emissions and air pollution related to driving patterns and traffic calming. In Proceedings of the 2nd KFB Research Conference, Lund, Sweden, 7–8 June 1999. [Google Scholar]
- Ntziachristos, L.; Samaras, Z. Speed-dependent representative emission factors for catalyst passenger cars and influencing parameters. Atmos. Environ. 2000, 34, 4611–4619. [Google Scholar] [CrossRef]
- Ericsson, E. Variability in exhaust emission and fuel consumption in urban driving. In Proceedings of the 2nd KFB Research Conference, Lund, Sweden, 7–8 June 1999. [Google Scholar]
- Hydén, C.; Várhelyi, A. The effects on safety, time consumption and environment of large scale use of roundabouts in an urban area: A case study. Accid. Anal. Prev. 2000, 32, 11–23. [Google Scholar] [CrossRef]
- Van der Voort, M.C. FEST. A New Driver Support Tool That Reduces Fuel Consumption and Emissions; The Institution of Engineering and Technology: Stevenage, UK, 2001. [Google Scholar]
- Boulter, P.G. The Impacts of Traffic Calming Measures on Vehicle Exhaust Emissions; Middlesex University: London, UK, 2001. [Google Scholar]
- Ericsson, E. Independent driving pattern factors and their influence on fuel-use and exhaust emission factors. Transp. Res. D 2001, 6, 325–345. [Google Scholar] [CrossRef]
- Rouphail, N.M.; Frey, H.C.; Colyar, J.D.; Unal, A. Vehicle emissions and traffic measures: Exploratory analysis of field observations at signalized arterials. In Proceedings of the 80th Annual Meeting of the Transportation Research Board, Washington, DC, USA, 7–11 January 2001. [Google Scholar]
- Ahn, K.; Rakha, H.; Trani, A.; Van Aerde, M. Estimating vehicle fuel consumption and emissions based on instantaneous speed and acceleration levels. J. Transp. Eng. 2002, 128, 182–190. [Google Scholar] [CrossRef]
- Cappiello, A.; Chabini, I.; Nam, E.K.; Lue, A.; Zeid, M.A. A statistical model of vehicle emissions and fuel consumption. In Proceedings of the IEEE 5th International Conference, Singapore, 6 September 2002; pp. 801–809. [Google Scholar]
- Mandavilli, S.; Russell, E.R.; Rys, M.J. Impact of modern roundabouts on vehicular emissions. In Proceedings of the 2003 Mid-Continent Transportation Research Symposium, Ames, IA, USA, 21–22 August 2003. [Google Scholar]
- Aerde, M.; Rakha, H.; Paramahamsan, H. Estimation of origin-destination matrices: Relationship between practical and theoretical considerations. Transp. Res. Record 2003, 1831, 122–130. [Google Scholar] [CrossRef]
- Brundell-Freji, K.; Ericsson, E. Influence of street characteristics, driver category and car performance on urban driving patterns. Transp. Res. D 2005, 10, 213–229. [Google Scholar] [CrossRef]
- Weilenmann, M.F.; Vasic, A.M.; Stettler, P.; Novak, P. Influence of mobile air-conditioning on vehicle emissions and fuel consumption: A model approach for modern gasoline cars used in Europe. Environ. Sci. Technol. 2005, 39, 9601–9610. [Google Scholar] [CrossRef] [PubMed]
- Daham, B.; Andrews, G.E.; Li, H.; Partridge, M.; Bell, M.C.; Tate, J.E. Quantitying the Effects of Traffic Calming on Emissions Using on-Road Measurement; Society of Automotive Engineers: Warrendale, PA, USA, 2005. [Google Scholar]
- El-Shawarby, I.; Ahn, K.; Rakha, H. Comparative field evaluation of vehicle cruise speed and acceleration level impacts on hot stabilized emissions. Transp. Res. D 2005, 10, 13–30. [Google Scholar] [CrossRef]
- Ericsson, E.; Larsson, H.; Brundell-Freij, K. Optimizing route choice for lowest fuel consumption—Potential effects of a new driver support tool. Transp. Res. C 2006, 14, 369–383. [Google Scholar] [CrossRef]
- Vermeulen, R.J. The Effects of a Range of Measures to Reduce the Tail Pipe Emissions and/or the Fuel Consumption of Modern Passenger Cars on Petrol and Diesel; Report IS-RPT-033-DTS-2006-01695; Nederlandse Organisatie voor Toegepast Natuurwetenschappelijk Onderzoek (TNO): Delft, The Netherlands, 2006. [Google Scholar]
- Greenwood, I.D.; Dunn, R.C.; Raine, R.R. Estimating the effects of traffic congestion on fuel consumption and vehicle emissions based on acceleration noise. J. Transp. Eng. 2007, 133, 96–104. [Google Scholar] [CrossRef]
- Strömberg, H.; Karlsson, I.M.; Rexfelt, O. Eco-driving: Drivers’ understanding of the concept and implications for future interventions. Transp. Policy 2015, 39, 48–54. [Google Scholar] [CrossRef]
- Mulandi, J.; Stevanovic, A.; Martin, P. Cross-evaluation of signal timing optimized by various traffic simulation and signal optimization tools. Transp. Res. Record 2010, 2192, 147–155. [Google Scholar] [CrossRef]
- Peng, Y.; Wang, X. Research on a vehicle routing schedule to reduce fuel consumption. In Proceedings of the 2009 International Conference on Measuring Technology and Mechatronics Automation, Zhangjiajie, China, 11–12 April 2009. [Google Scholar]
- Li, J.; Wang, C.; Li, Q.; Wang, B. Intelligent speed adaptation impact of fuel consumption and emission. In Proceedings of the International Conference on Transportation Engineering, Chengdu, China, 25–27 July 2009; pp. 1311–1316. [Google Scholar]
- Zlatkovic, M.; Stevanovic, A.; Cevallos, F.; Johnson, H.R. 35M MAX: The first bus rapid transit system in Salt Lake County. World Rev. Intermodal Transp. Res. 2010, 3, 103–120. [Google Scholar] [CrossRef]
- Alessandrini, A.; Filippi, F.; Stam, D.; Tripodi, A. Pre-design method for advanced public transport systems. Public Transp. 2010, 2, 5–23. [Google Scholar] [CrossRef]
- Shukla, A.; Alam, M. Assessment of real world on-road vehicle emissions under dynamic urban traffic conditions in Delhi. Int. J. Urban Sci. 2010, 14, 207–220. [Google Scholar] [CrossRef]
- Boriboonsomsin, K.; Barth, M.J.; Vu, A. Evaluation of Driving Behavior and Attitude toward Eco-Driving: Southern California Limited Case Study. In Proceedings of the Transportation Research Board 90th Annual Meeting, Washington, DC, USA, 23–27 January 2011. [Google Scholar]
- Kuo, Y. Using simulated annealing to minimize fuel consumption for the time-dependent vehicle routing problem. Comput. Ind. Eng. 2010, 59, 157–165. [Google Scholar] [CrossRef]
- Fonseca González, N.; Casanova Kindelán, J.; Espinosa Zapata, F. Influence of Driving Style on Fuel Consumption and Emissions in Diesel-Powered Passenger Car. In Proceedings of the 18th International Symposium Transport and Air Pollution, Zürich, Switzerland, 18–19 May 2010; pp. 1–6. [Google Scholar]
- Barth, M.; Mandava, S.; Boriboonsomsin, K.; Xia, H. Dynamic ECO-driving for arterial corridors. In Proceedings of the Integrated and Sustainable Transportation System (FISTS), Vienna, Austria, 29 June–1 July 2011; pp. 182–188. [Google Scholar]
- Wang, J.; Lei, L.; Zhang, H. Analysis of Traveling Speed and Fuel Consumption Based on Vehicle Traveling Data Recorder for BRT in Jinan. In Proceedings of the 11th International Conference of Chinese Transportation Professionals, Nanjing, China, 14–17 August 2011; pp. 2792–2803. [Google Scholar]
- Prasad, L.; Pradhan, S.; Madankar, C.S.; Das, L.M.; Naik, S.N. Comparative study of performance and emissions characteristics of a diesel engine fueled with Jatropha and Karanja biodiesel. J. Sci. Ind. Res. 2011, 70, 694–698. [Google Scholar]
- Alessandrini, A.; Cattivera, A.; Filippi, F.; Ortenzi, F. Driving Style Influence on Car CO2 Emissions. 2012. Available online: https://pdfs.semanticscholar.org/eb99/4b87a0a949a98d7858bcf6267884c0150a53.pdf (accessed on 20 January 2018).
- LaClair, T.J.; Truemner, R. Modeling of Fuel Consumption for Heavy-Duty Trucks and the Impact of Tire Rolling Resistance; SAE International: Warrendale, PA, USA, 2005. [Google Scholar]
- Iddo Riemersma, P.M. Influence of Rolling Resistance on CO2; International Council on Clean Transportation: Washington, DC, USA, 2012. [Google Scholar]
- Hari, D.; Brace, C.J.; Vagg, C.; Poxon, J.; Ash, L. Analysis of a driver behavior improvement tool to reduce fuel consumption. In Proceedings of the 2012 International Conference on Connected Vehicles and Expo, Beijing, China, 12–16 December 2012; pp. 208–213. [Google Scholar]
- Vagg, C.; Brace, C.; Wijetunge, R.; Akehurst, S.; Ash, L. Development of a new method to assess fuel saving using gear shift indicators. Proc. Inst. Mech. Eng. D 2012, 226, 1630–1639. [Google Scholar] [CrossRef] [Green Version]
- Shafie-Pour, M.; Tavakoli, A. On-road vehicle emissions forecast using IVE simulation model. Int. J. Environ. Res. 2013, 7, 367–376. [Google Scholar]
- Carrese, S.; Gemma, A.; La Spada, S. Impacts of driving behaviors, slope and vehicle load factor on bus fuel consumption and emissions: A real case study in the city of Rome. Procedia Soc. Behav. Sci. 2013, 87, 211–221. [Google Scholar] [CrossRef]
- Li, X.; Sun, J.Q. Effect of interactions between vehicles and pedestrians on fuel consumption and emissions. Physica A 2014, 416, 661–675. [Google Scholar] [CrossRef]
- Matsumoto, Y.; Ishiguro, S. Evaluation of CO2 Emission Reduction from Vehicles by Information Provision Using Driving Simulator. In Advanced Concepts, Methodologies and Technologies for Transportation and Logistics; Springer: Cham, Switzerland, 2016; pp. 290–304. [Google Scholar]
- Puan, O.C.; Nabay, M.M.; Ibrahim, M.N. Effect of Vehicular Traffic Volume and Composition on Carbon Emission. Jurnal Teknologi 2014. [Google Scholar] [CrossRef]
- Mensing, F.; Bideaux, E.; Trigui, R.; Ribet, J.; Jeanneret, B. Eco-driving: An economic or ecologic driving style? Transp. Res. C 2014, 38, 110–121. [Google Scholar] [CrossRef]
- Li, Y.; Sun, D.; Liu, W.; Zhang, M.; Zhao, M.; Liao, X.; Tang, L. Modeling and simulation for microscopic traffic flow based on multiple headway, velocity and acceleration difference. Nonlinear Dyn. 2011, 66, 15–28. [Google Scholar] [CrossRef]
- Matsumoto, Y.; Peng, G. Analysis of driving behavior with information for passing through signalized intersection by driving simulator. Transp. Res. Procedia 2015, 10, 103–112. [Google Scholar] [CrossRef]
- Zhang, J.; Zhao, Y.; Xue, W.; Li, J. Vehicle routing problem with fuel consumption and carbon emission. Int. J. Prod. Econ. 2015, 170, 234–242. [Google Scholar] [CrossRef]
- Pampel, S.M.; Jamson, S.L.; Hibberd, D.L.; Barnard, Y. How I reduce fuel consumption: An experimental study on mental models of eco-driving. Transp. Res. C 2015, 58, 669–680. [Google Scholar] [CrossRef]
- Zhao, X.; Wu, Y.; Rong, J.; Zhang, Y. Development of a driving simulator based eco-driving support system. Transp. Res. C 2015, 58, 631–641. [Google Scholar] [CrossRef]
- Srivatsa Srinivas, S.; Gajanand, M.S. Vehicle routing problem and driver behavior: A review and framework for analysis. Transp. Rev. 2017, 37, 590–611. [Google Scholar] [CrossRef]
- Lemaire, O.; Moneyron, A.; Masson, J.E. “Interactive technology assessment” and beyond: The field trial of genetically modified grapevines at INRA-Colmar. PLoS Biol. 2010, 8. [Google Scholar] [CrossRef]
- Lamit, H.; Shafaghat, A.; Majid, M.Z.; Keyvanfar, A.; Ahmad, M.H.B.; Malik, T.A. Grounded group decision making (GGDM) model. Adv. Sci. Lett. 2013, 19, 3077–3080. [Google Scholar] [CrossRef]
- Shafaghat, A.; Keyvanfar, A.; Manteghi, G.; Lamit, H. Environmental-Conscious Factors Affecting Street Microclimate and Individuals’ Respiratory Health in Tropical Coastal Cities. Sustain. Cities Soc. 2016, 21, 35–50. [Google Scholar] [CrossRef]
- Shafaghat, A.; Manteghi, G.; Lamit, H.; Saito, K.; Ossen, D.R.; Keyvanfar, A. Street Geometry Factors Influence Urban Microclimate in Tropical Coastal Cities: A Review. J. Environ. Clim. Technol. 2016, 17, 61–75. [Google Scholar] [CrossRef]
- Johansson, H.; Gustafsson, P.; Henke, M.; Rosengren, M. Impact of EcoDriving on emissions. In Proceedings of the International Scientific Symposium on Transport and Air Pollution, Avignon, France, 16–18 June 2003. [Google Scholar]
- Wåhlberg, A.E. Long-term effects of training in economical driving: Fuel consumption, accidents, driver acceleration behavior and technical feedback. Int. J. Ind. Ergon. 2007, 37, 333–343. [Google Scholar] [CrossRef]
- An, F.; Ross, M. A Simple Physical Model for High Power Enrichment Emissions. J. Air Waste Manag. Assoc. 1996, 46, 216–223. [Google Scholar] [CrossRef] [PubMed]
- Barkenbus, J.N. Eco-driving: An overlooked climate change initiative. Energy Policy 2010, 38, 762–769. [Google Scholar] [CrossRef]
- Shaheen, S.A.; Martin, E.W.; Finson, R.S. Understanding how Eco-Driving public education can result in reduced fuel use and greenhouse gas emissions. In Proceedings of the Transportation Research Board Annual Meeting, Washington, DC, USA, 22–26 January 2012. [Google Scholar]
- Ogle, J.H. Quantitative Assessment of Driver Speeding Behavior Using Instrumented Vehicles. Ph.D. Thesis, Georgia Institute of Technology, Atlanta, GA, USA, 2005. [Google Scholar]
- Nam, E.K.; Gierczak, C.A.; Butler, J.W. A comparison of real-world and modeled emissions under conditions of variable driver aggressiveness. In Proceedings of the 82nd Annual Meeting of the Transportation Research Board, Washington, DC, USA, 12–16 January 2003. [Google Scholar]
- Zorrofi, S.; Filizadeh, S.; Zanetel, P. A simulation study of the impact of driving patterns and driver behavior on fuel economy of hybrid transit buses. In Proceedings of the Vehicle Power and Propulsion Conference, Dearborn, MI, USA, 7–10 September 2009; pp. 572–577. [Google Scholar]
- Hassan, Y. Highway Design Consistency—Refining the State of Knowledge and Practice. In Proceedings of the 83rd Transportation Research Board Annual Conference, Washington DC, USA, 11–15 January 2004. [Google Scholar]
- Austroads. Guide to Road Design Part 3: Geometric Design; Austroads: Sydney, Australia, 2010. [Google Scholar]
- Awata, M.; Hassan, Y. Towards establishing an overall safety-based geometric design consistency measure. In Proceedings of the 4th Transportation Specialty Conference of the Canadian Society for Civil Engineering, Montreal, QC, Canada, 5–8 June 2002. [Google Scholar]
- Ng, J.C.; Sayed, T. Effect of geometric design consistency on road safety. Can. J. Civil Eng. 2004, 31, 218–227. [Google Scholar] [CrossRef]
- Theeuwes, J.; Alferdinck, J.W. Rear light arrangements for cars equipped with a center high-mounted stop lamp. Hum. Factors 1995, 37, 371–380. [Google Scholar] [CrossRef]
- André, M.; Journard, R.; Vidon, R.; Tassel, P.; Perret, P. Real-world European driving cycles, for measuring pollutant emissions from high- and low-powered cars. Atmos. Environ. 2006, 40, 5944–5953. [Google Scholar]
- Berry, I.M. The Effects of Driving Style and Vehicle Performance on the Real-World Fuel Consumption of US Light-Duty Vehicles. Ph.D. Thesis, Massachusetts Institute of Technology, Cambridge, MA, USA, 2010. [Google Scholar]
- Wu, Y.; Zhao, X.; Rong, J. The Long-Term Effectiveness of Eco-Driving Training: A Pilot Study. In Proceedings of the 8th International Driving Symposium on Human Factors in Driver Assessment, Training and Vehicle Design, Salt Lake City, UT, USA, 22–25 June 2015; pp. 212–218. [Google Scholar]
- Zachariadis, T.; Samaras, Z. Comparative assessment of European tools to estimate traffic emissions. Int. J. Veh. Des. 1997, 18, 312–325. [Google Scholar]
Figure 1.
Global energy consumption by transportation modes (Passenger and Freight (2005–2050); (Source: International Energy Agency (IEA) [5]).
Figure 1.
Global energy consumption by transportation modes (Passenger and Freight (2005–2050); (Source: International Energy Agency (IEA) [5]).

Figure 2.
Global CO2 emissions by transportation modes (a) Passenger; (b) Freight (2012–2040); (Source: International Energy Agency (IEA) [5]).
Figure 2.
Global CO2 emissions by transportation modes (a) Passenger; (b) Freight (2012–2040); (Source: International Energy Agency (IEA) [5]).

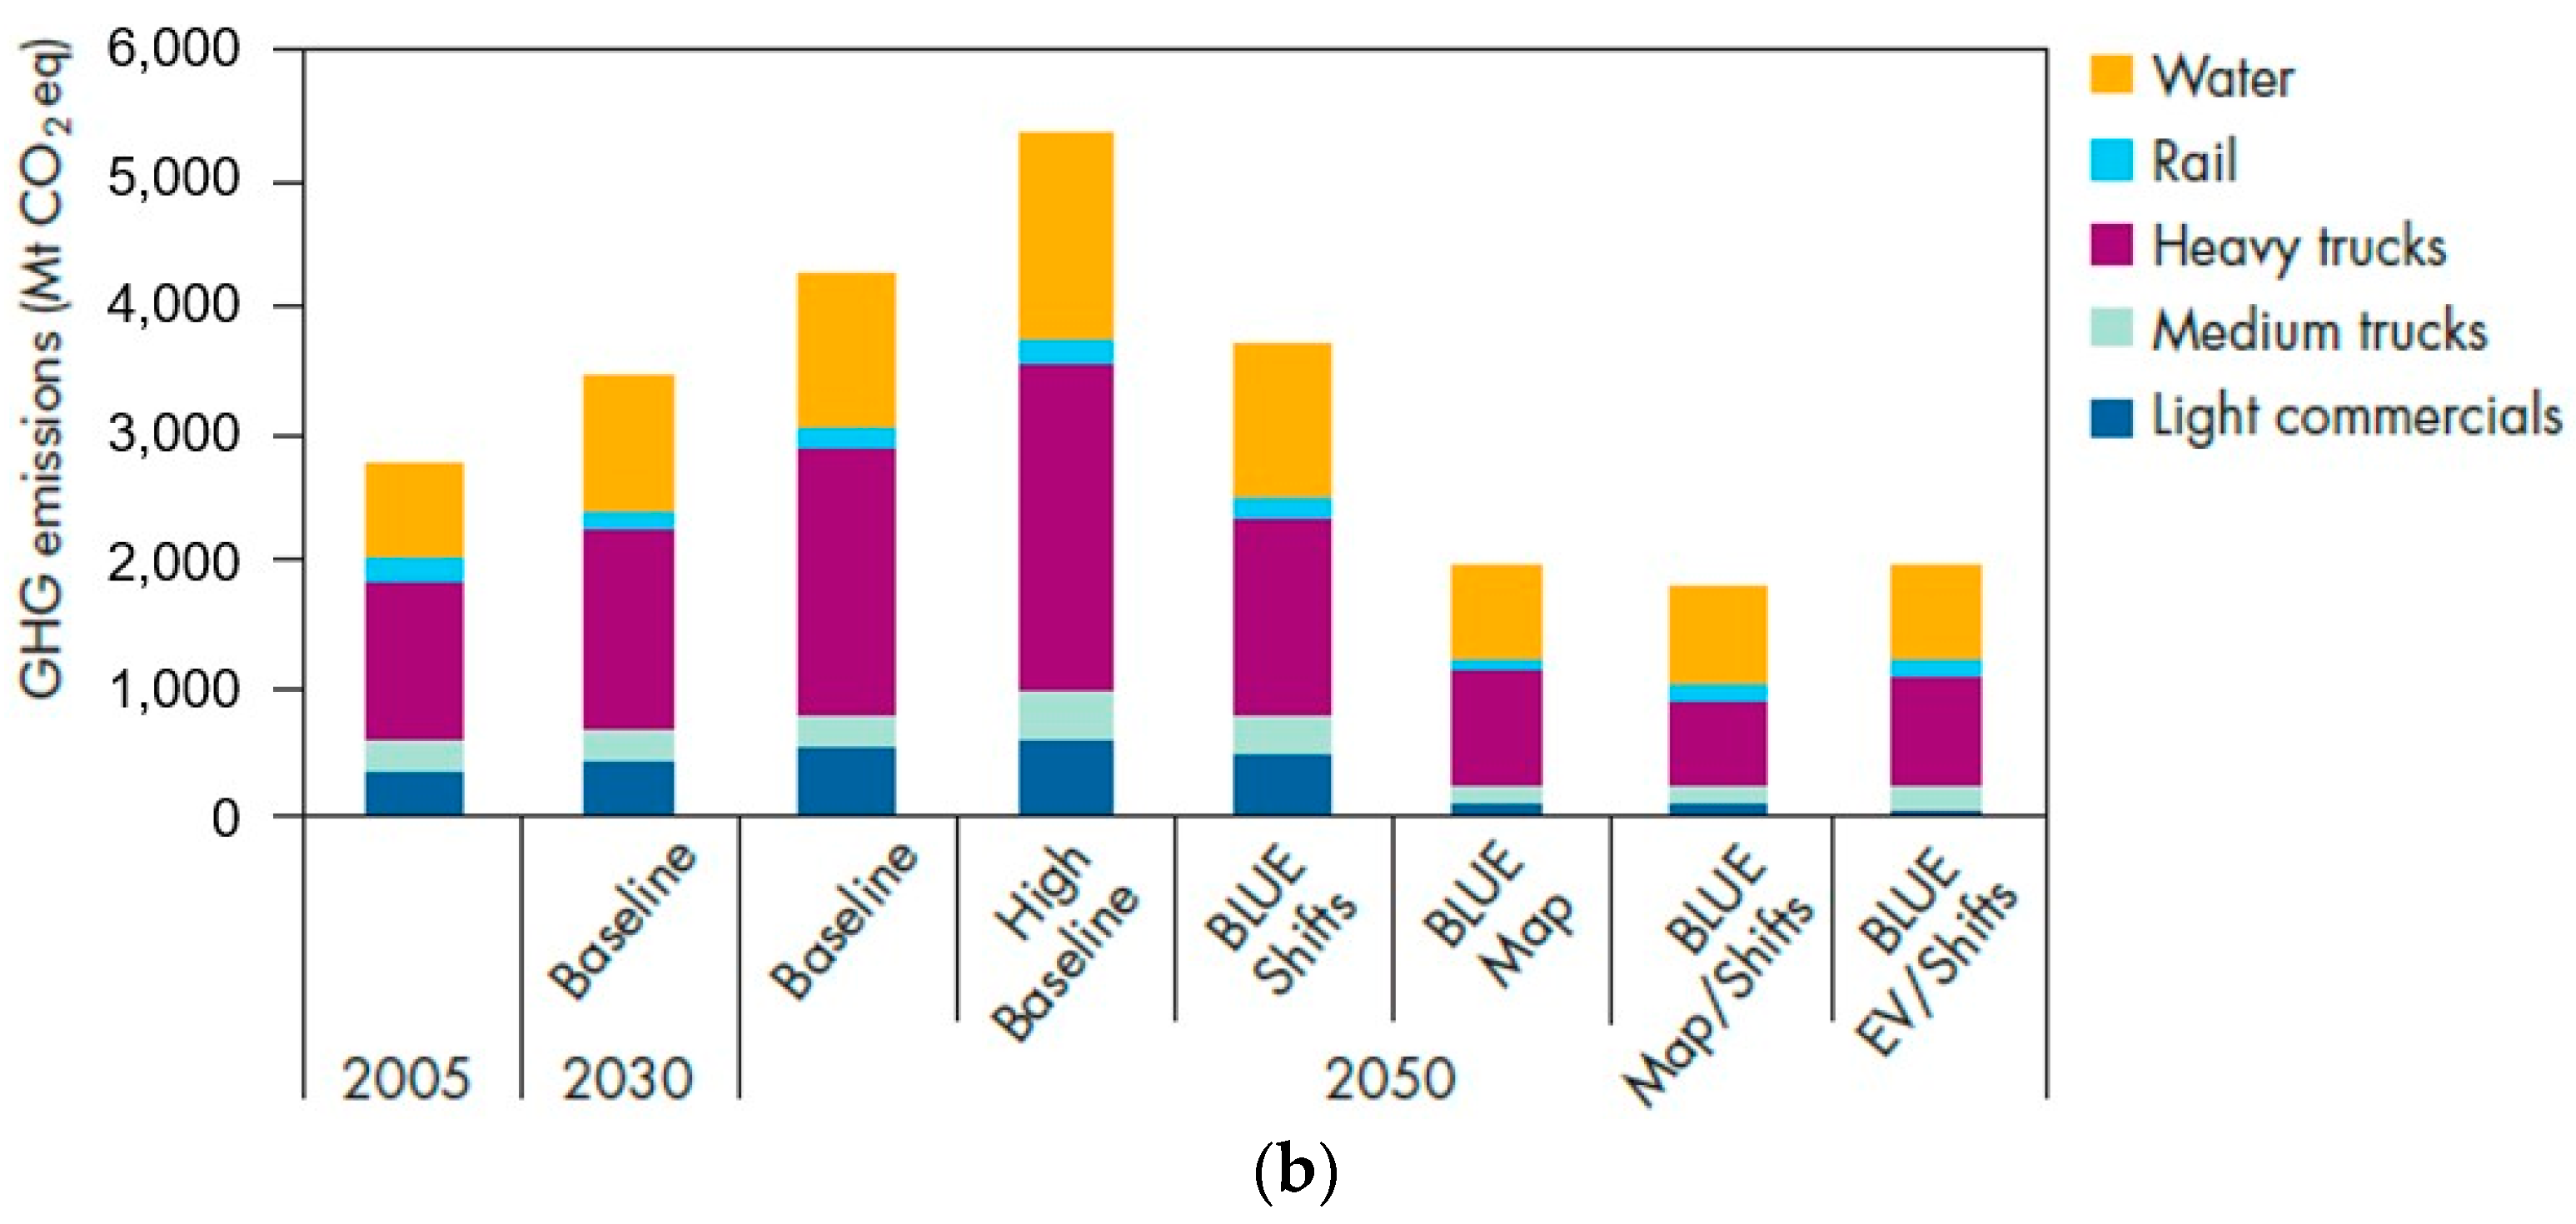
Figure 3.
The Green driver conceptual framework.

Figure 4.
Systematic literature review flowchart on green driver behaviors.
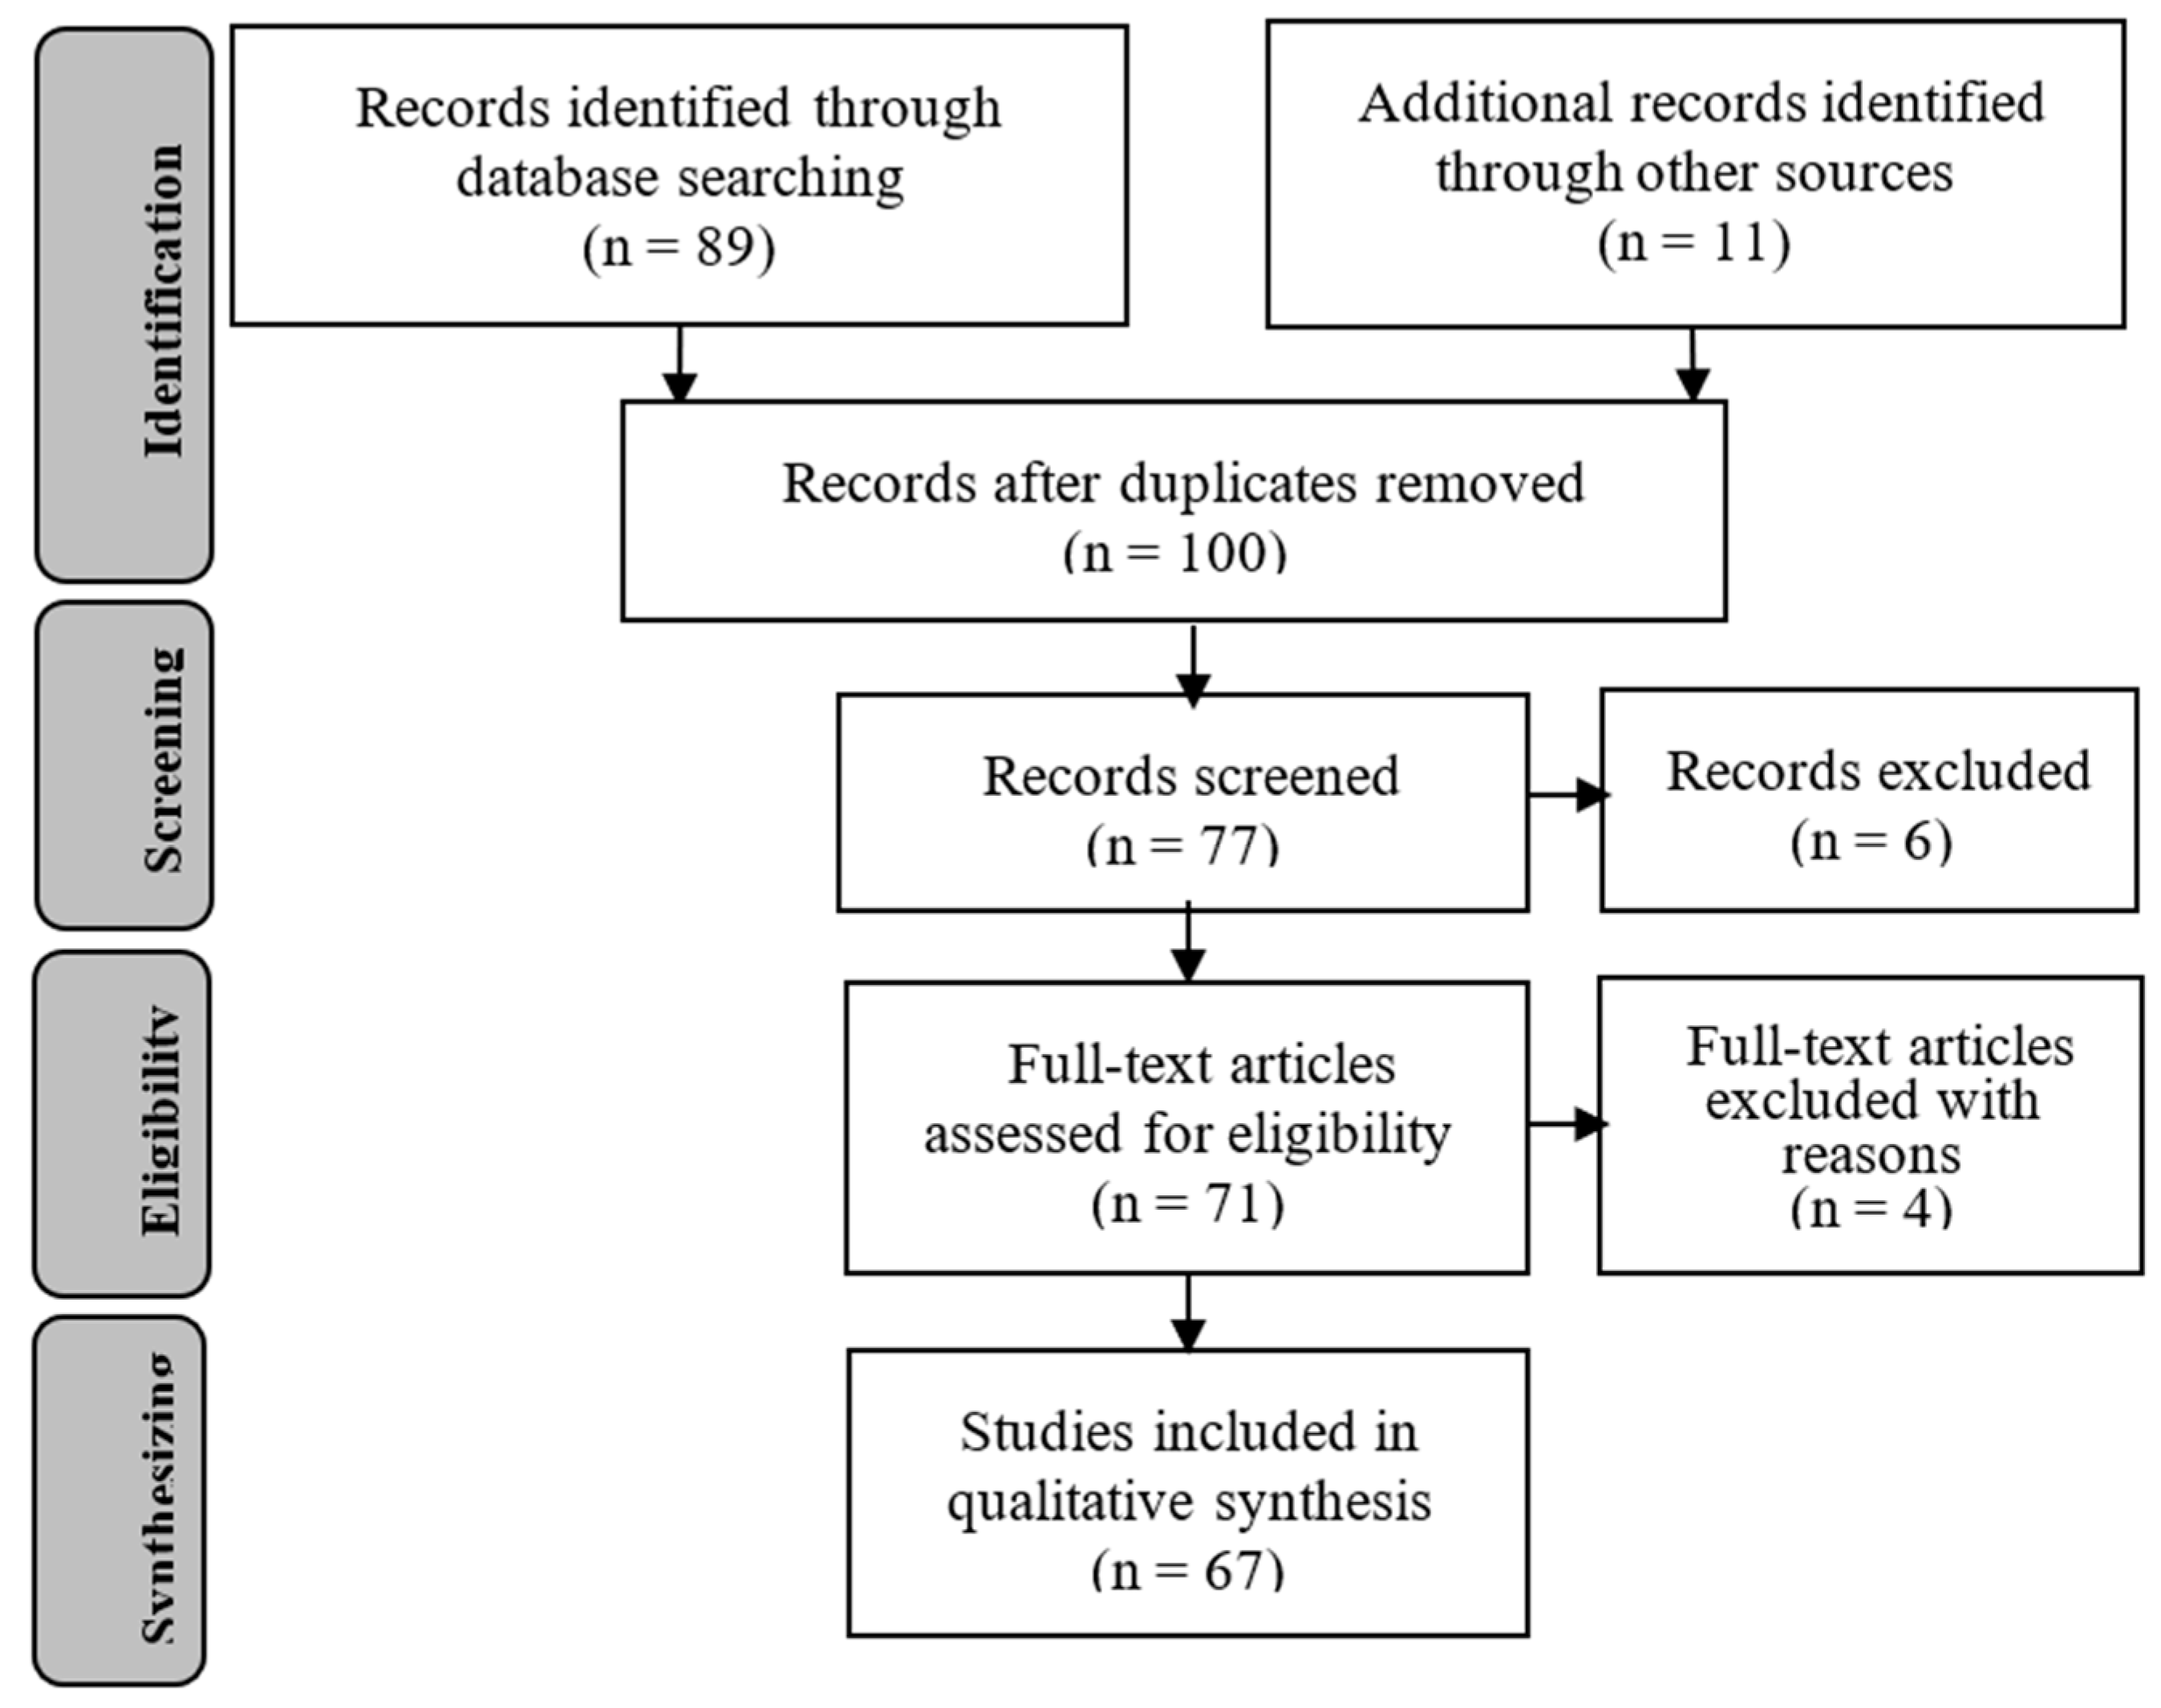
Figure 5.
Green Value (GV) analysis results of driver’s green travel behavior variables influencing less fuel consumption and tailpipe emission. The three (3) clusters of green impact degree are shown.
Figure 5.
Green Value (GV) analysis results of driver’s green travel behavior variables influencing less fuel consumption and tailpipe emission. The three (3) clusters of green impact degree are shown.
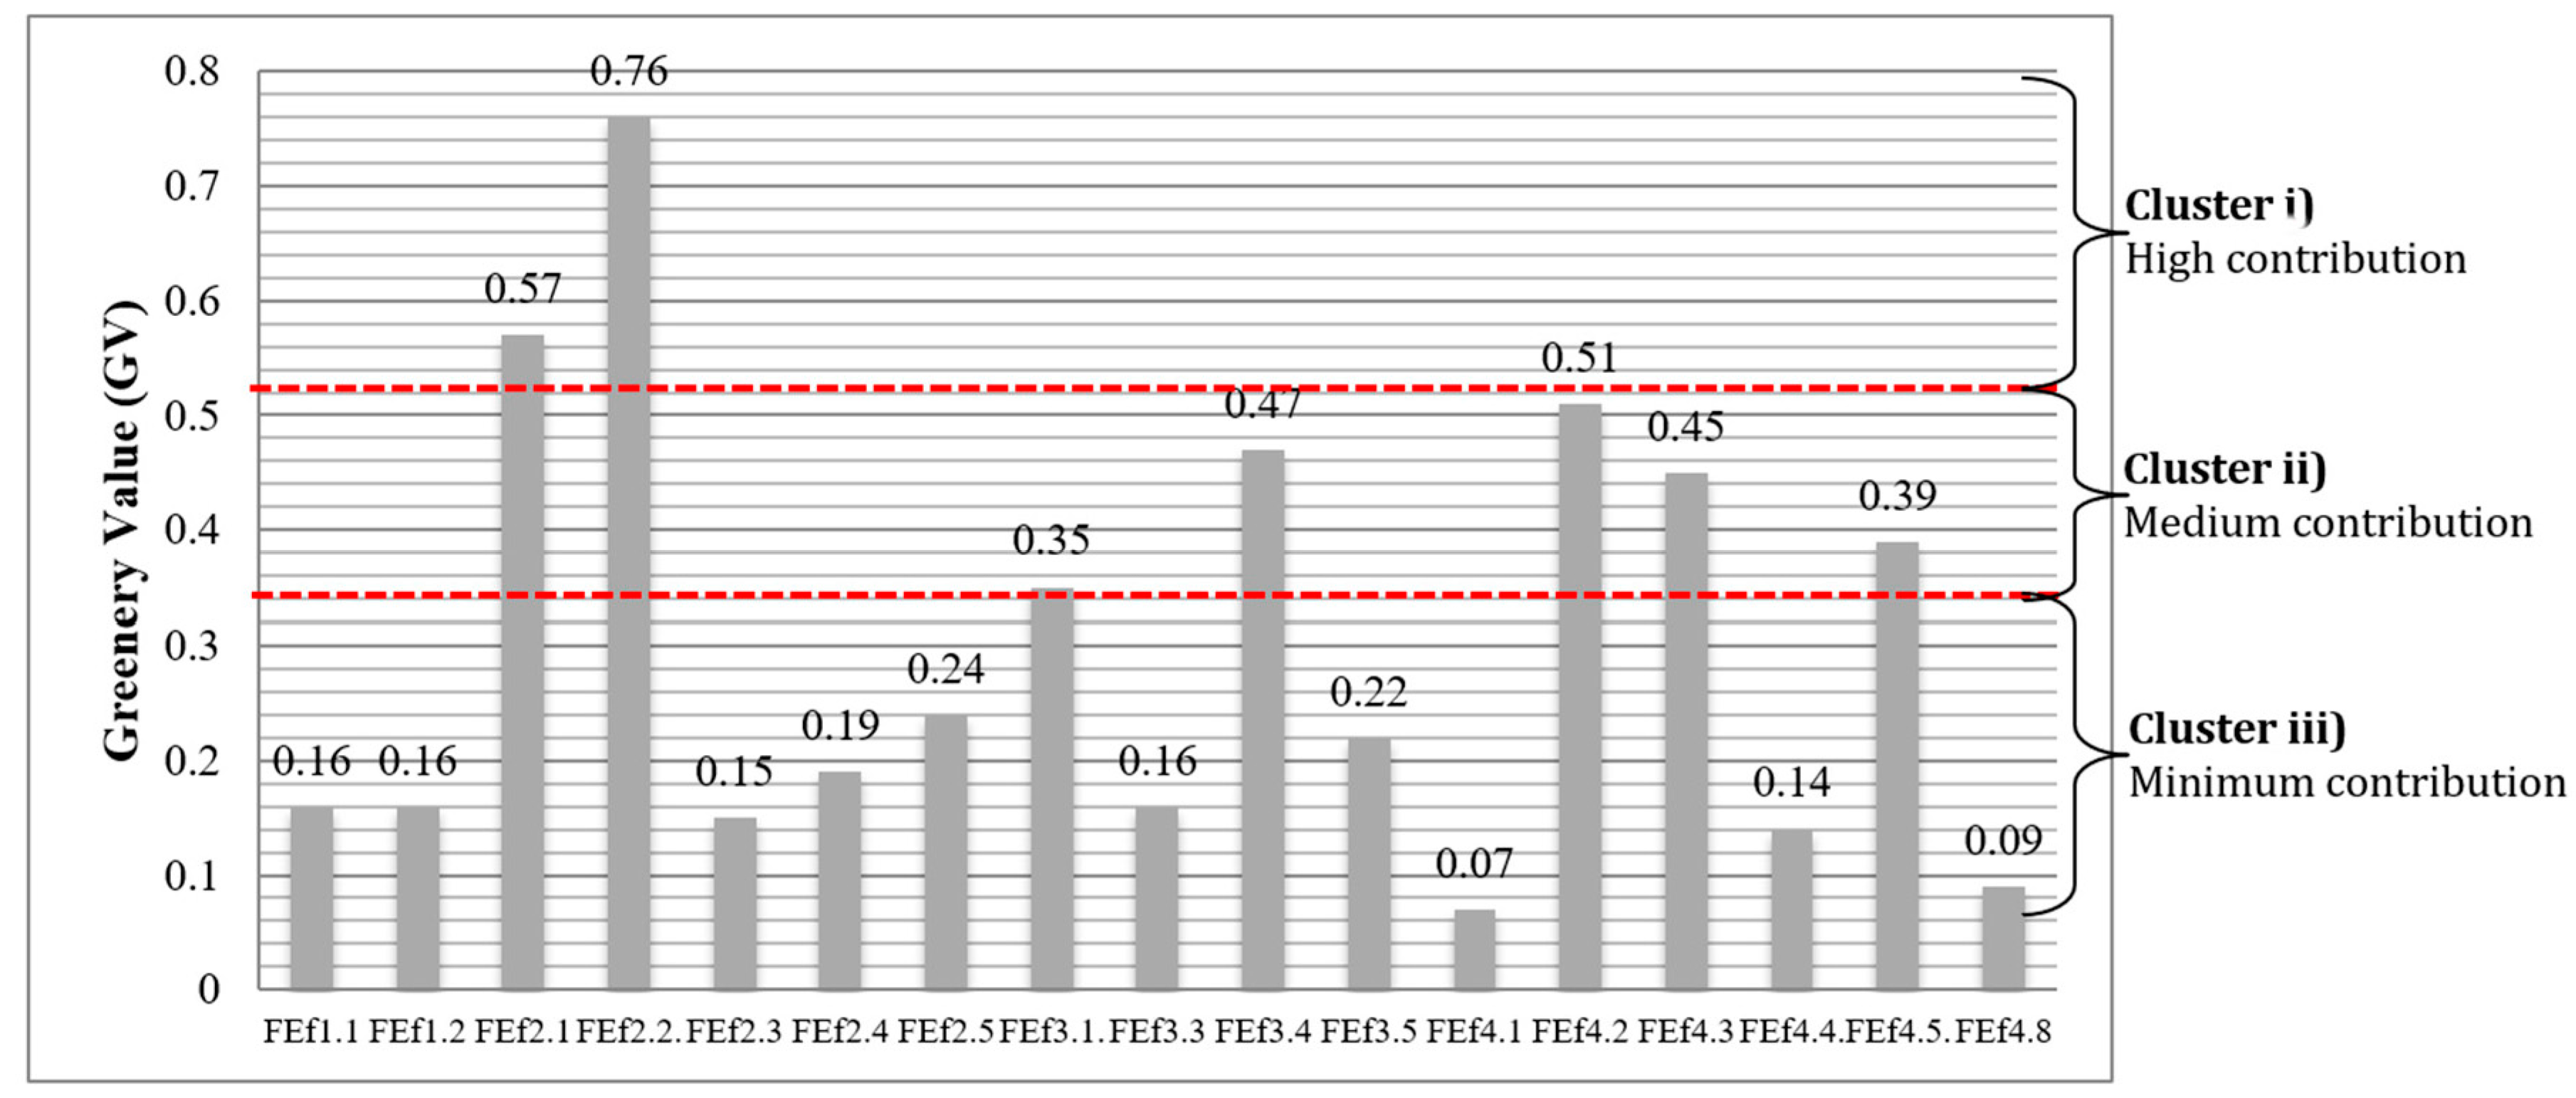

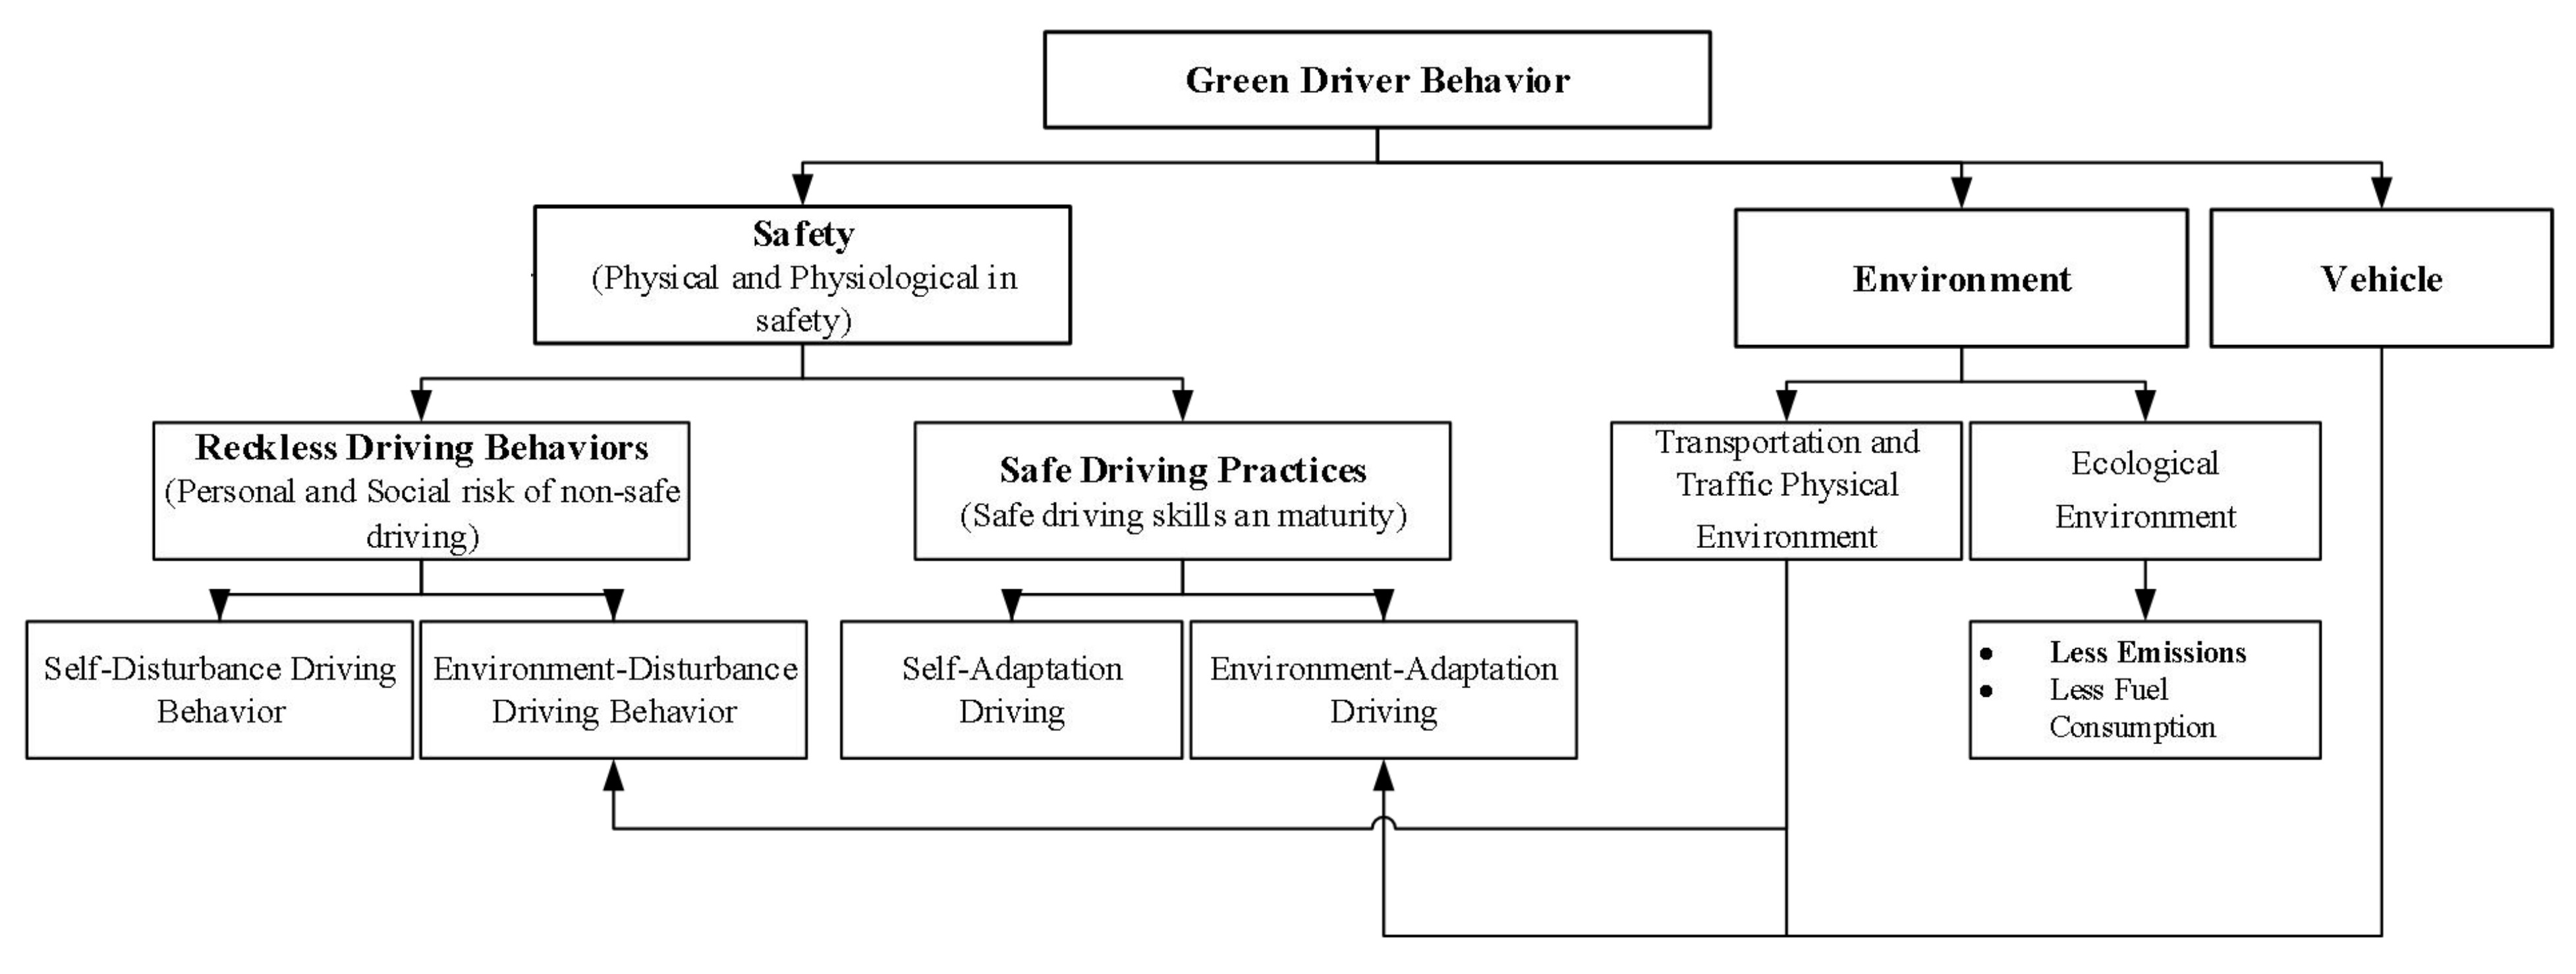
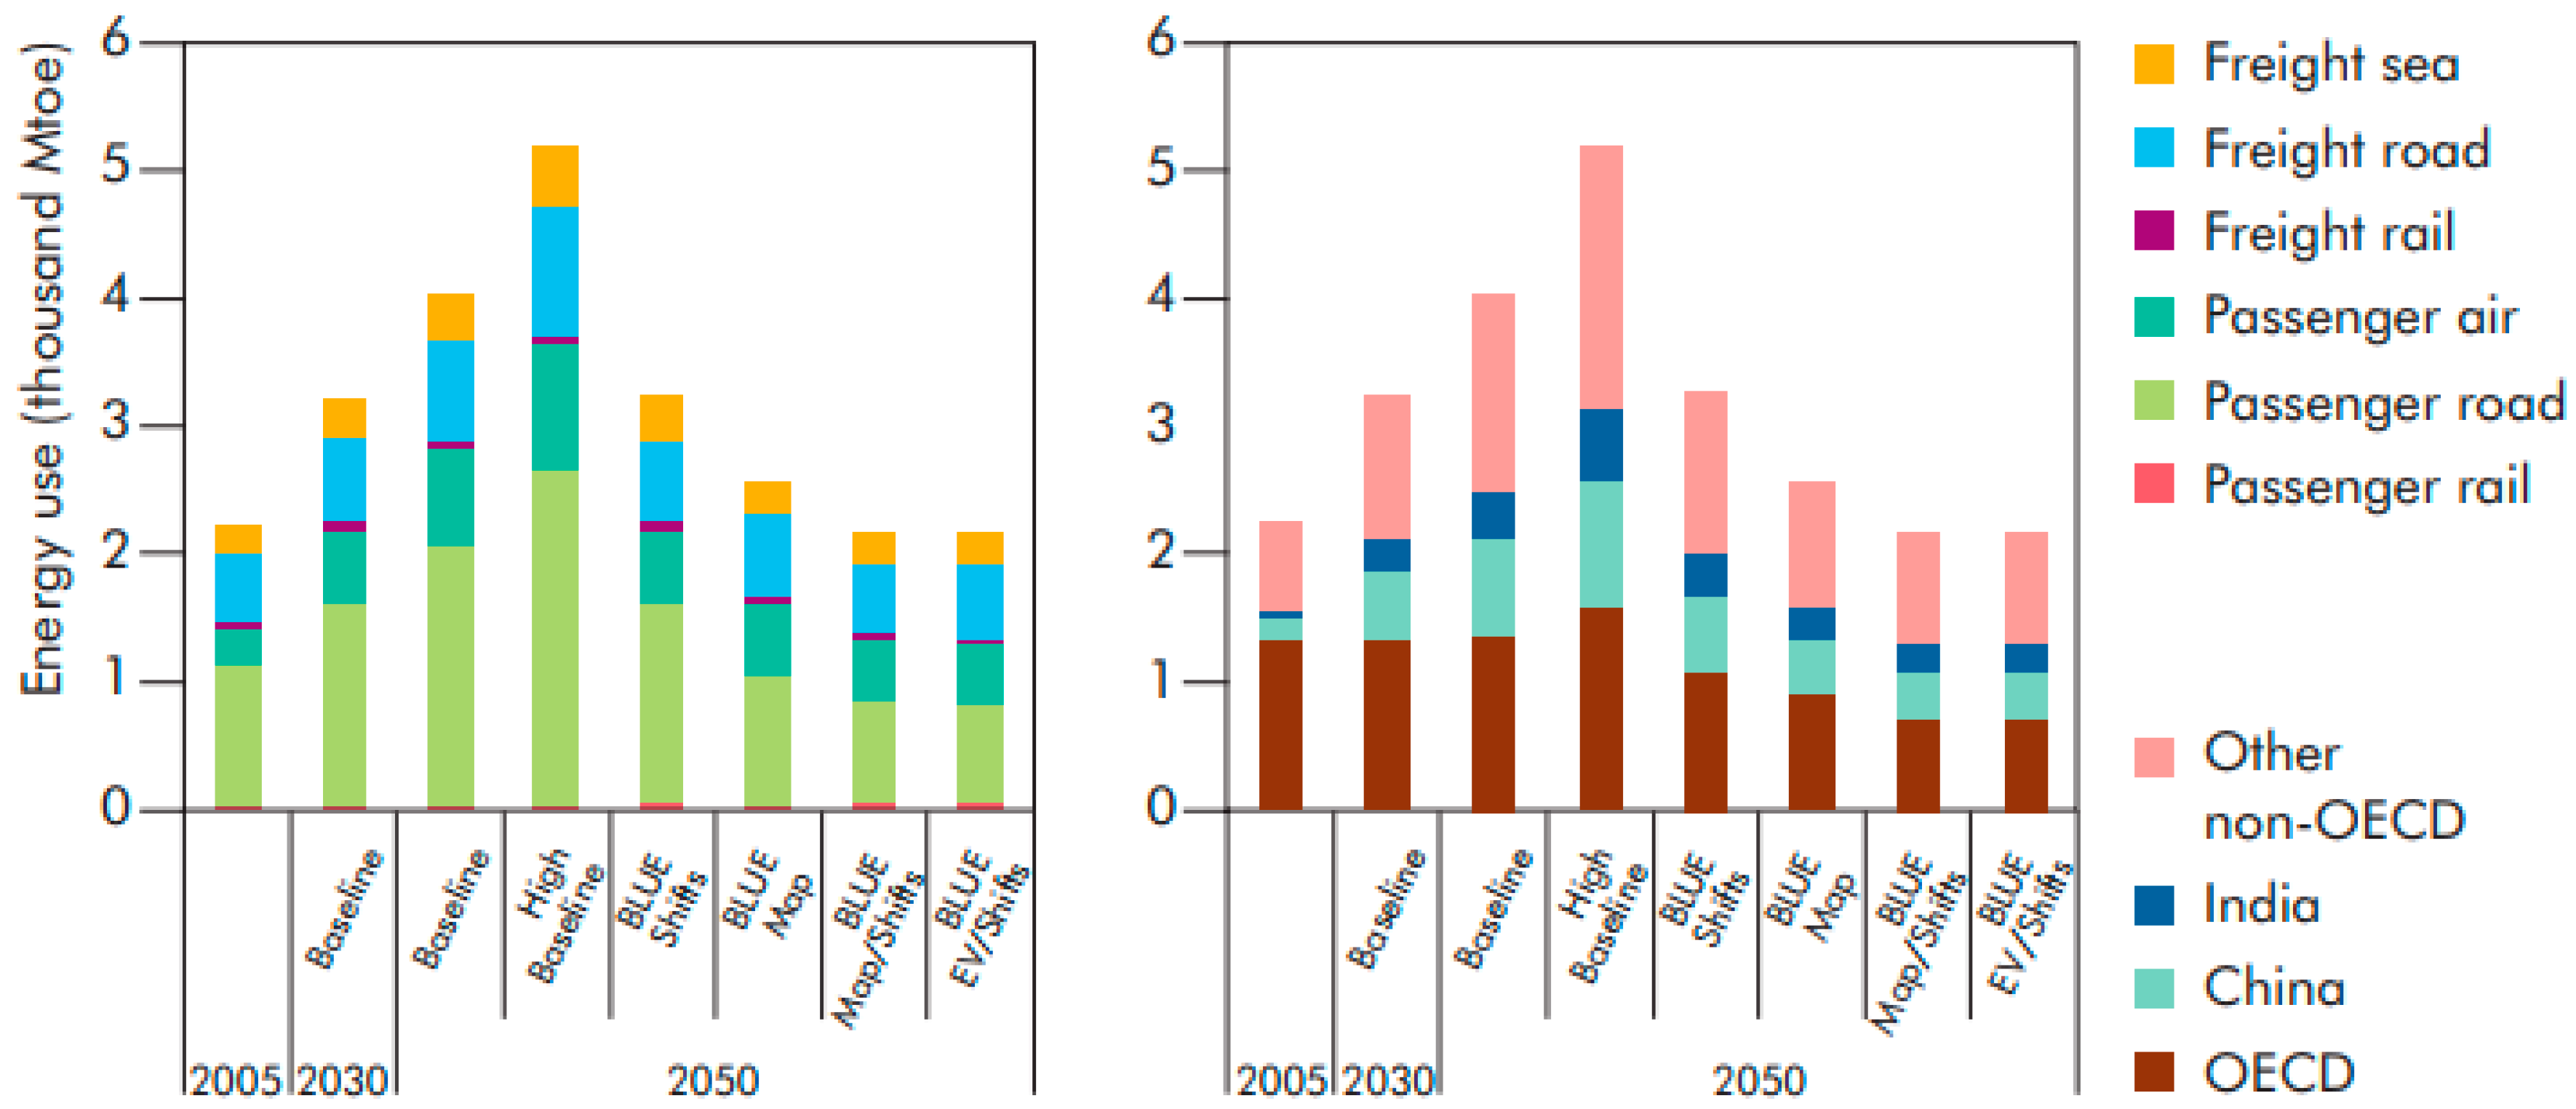
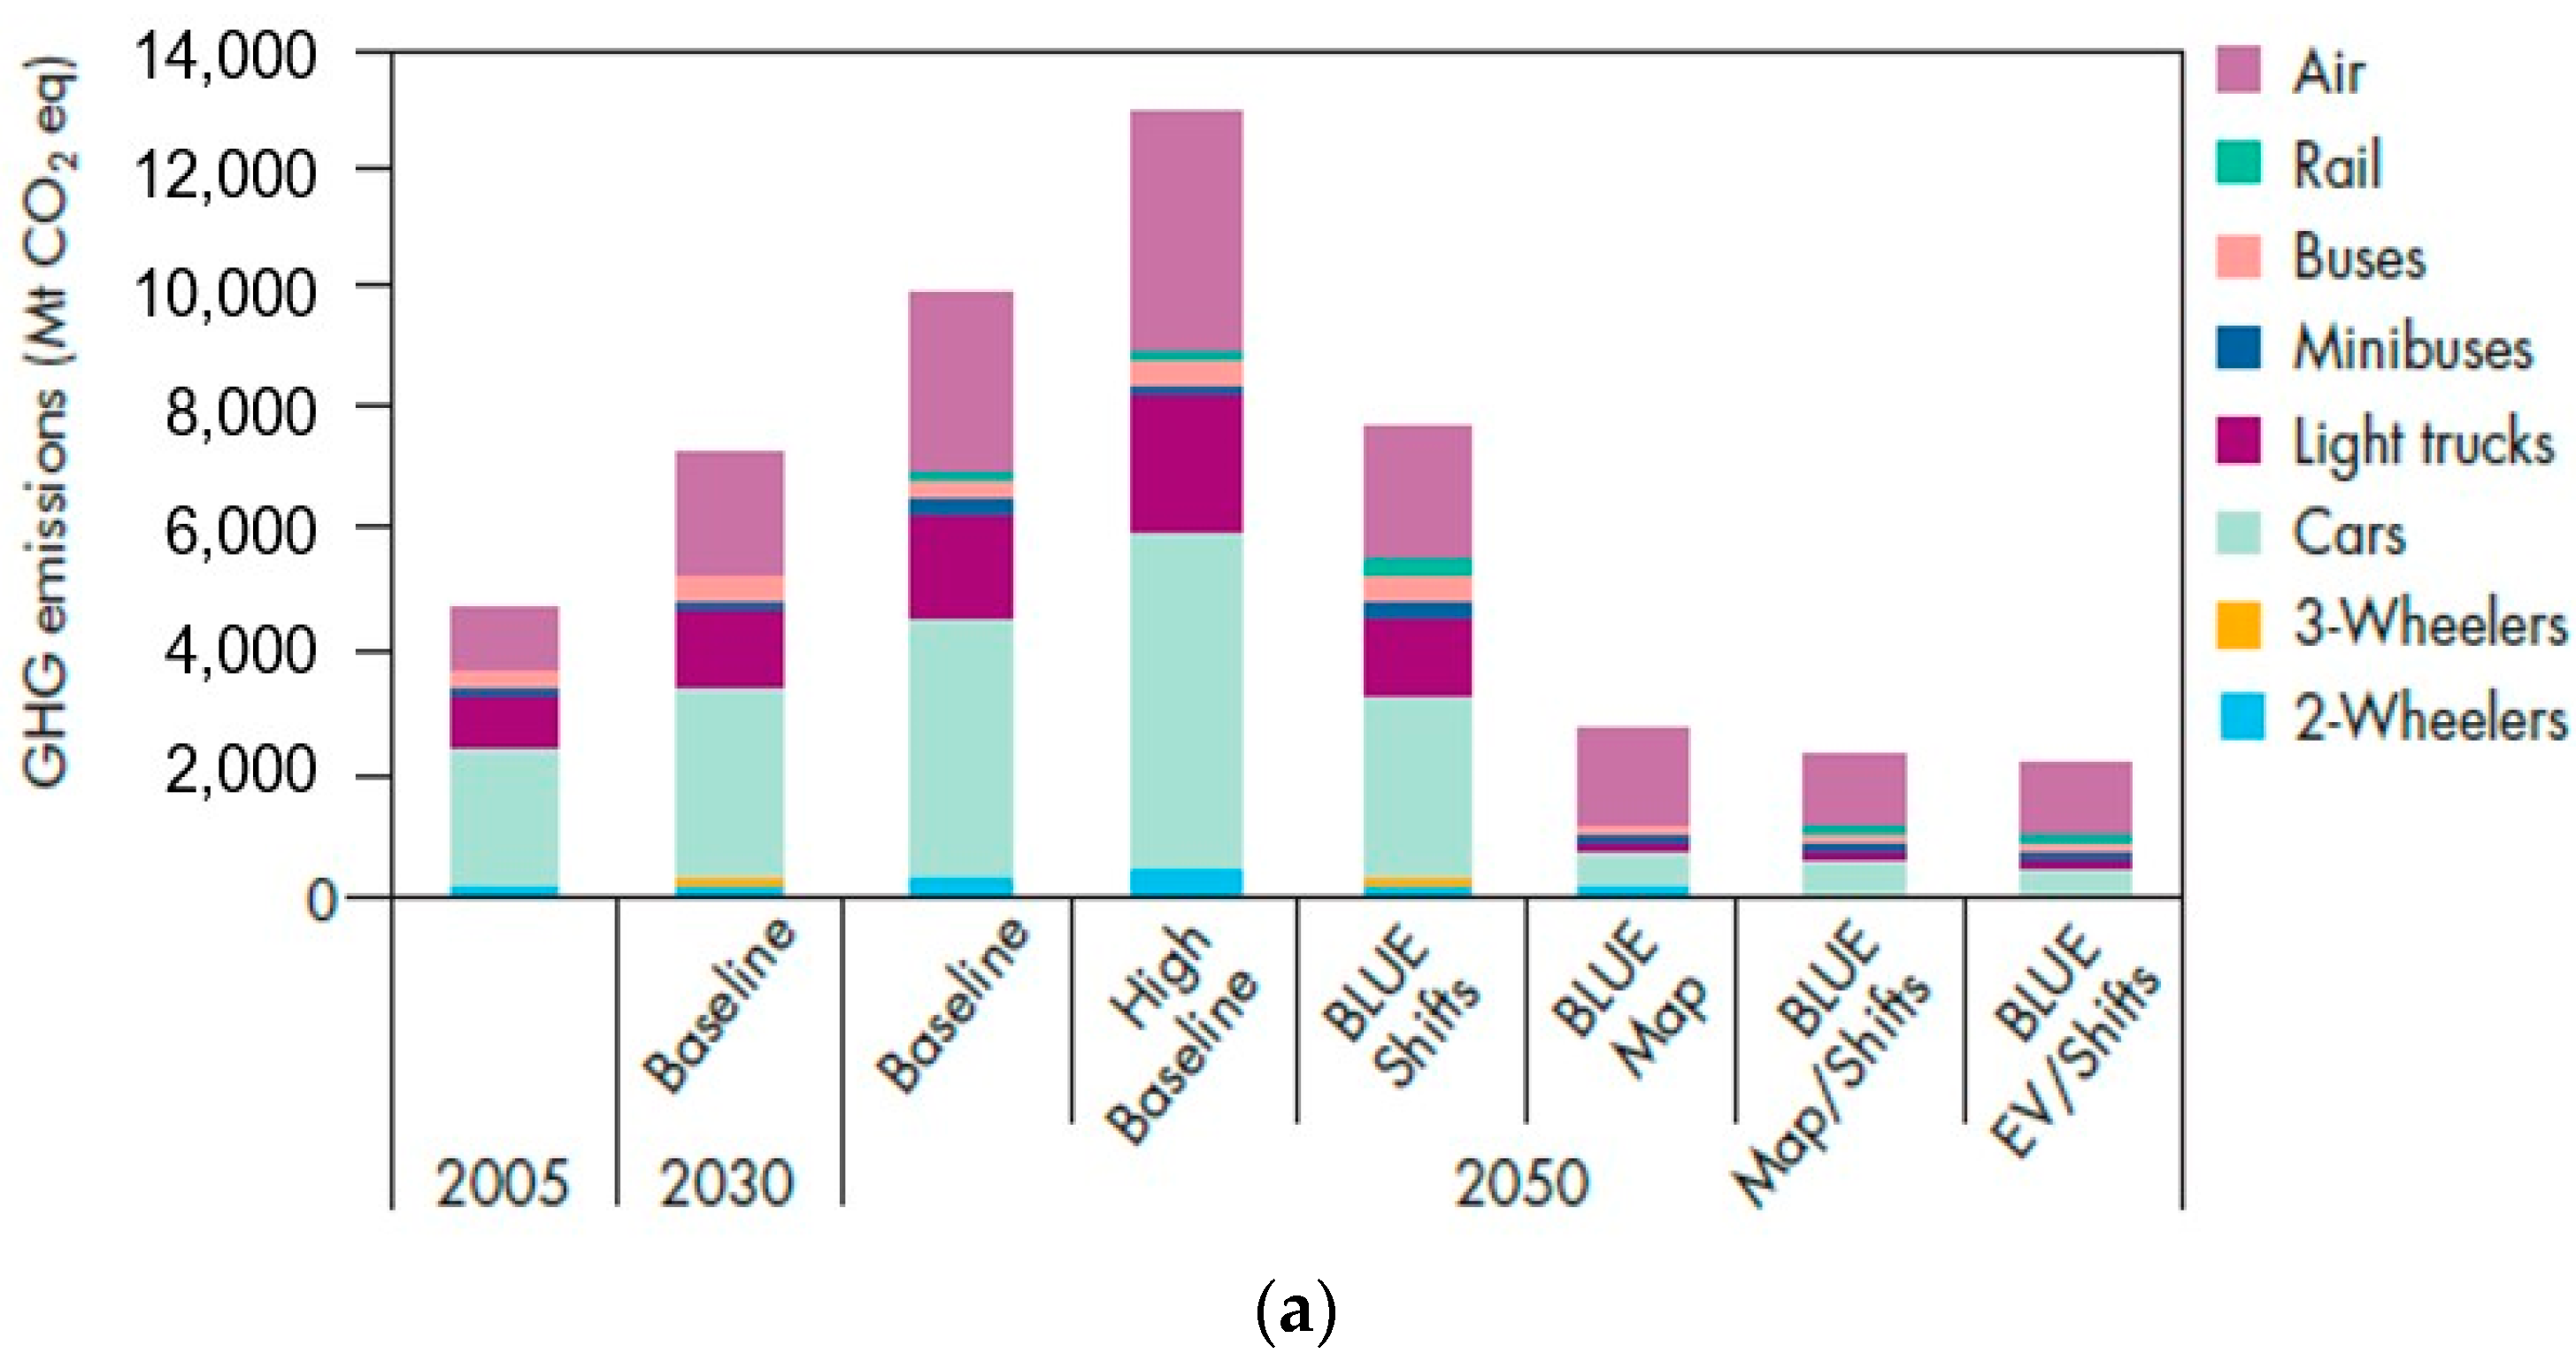
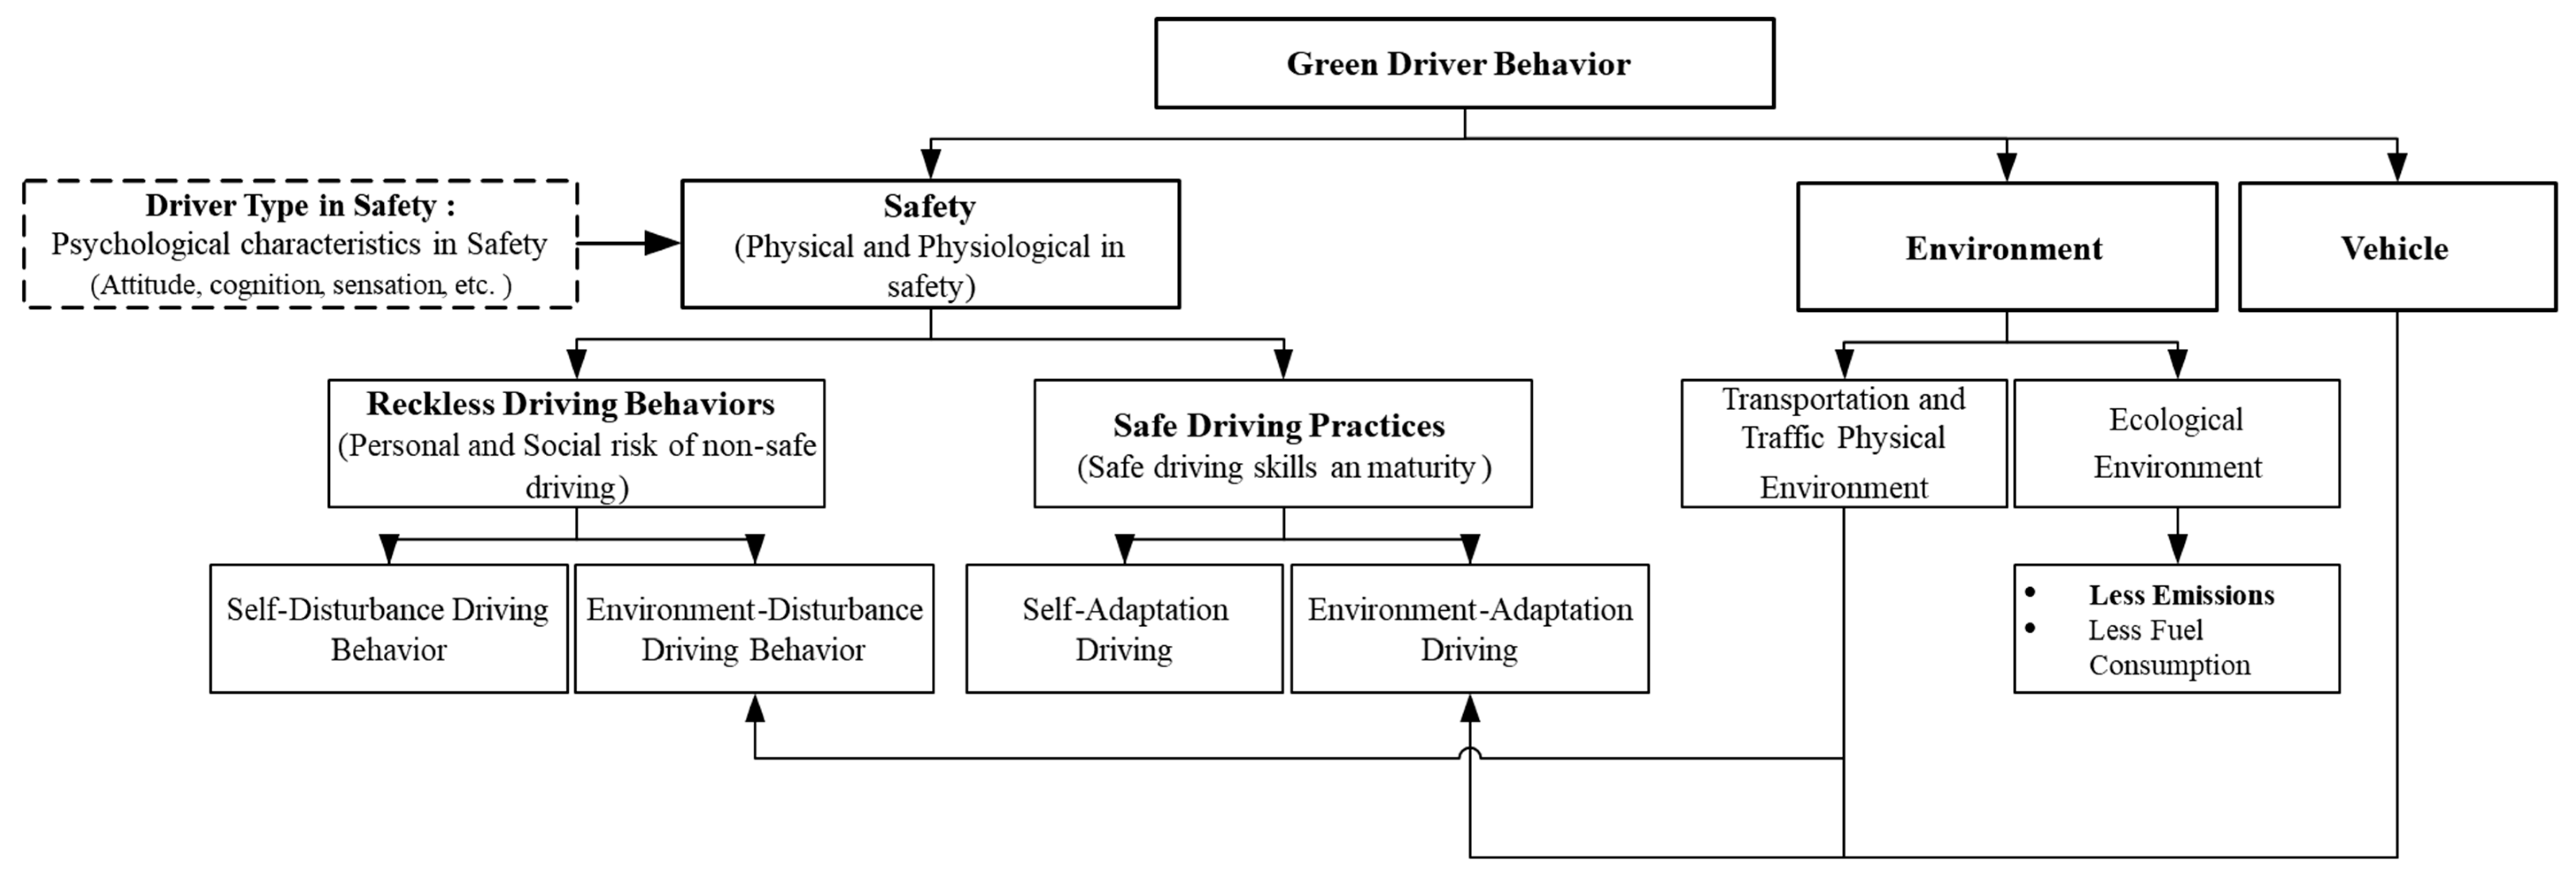
Table 1.
Content analysis of driving behaviors influencing vehicle fuel consumption and tailpipe emission.
Table 1.
Content analysis of driving behaviors influencing vehicle fuel consumption and tailpipe emission.
| Citations | FEf1. Driving Style | FEf2. Driving Behavior Associated with Vehicle Transmission | FEf3. Driving Behavior Associated with Road Design and Traffic Rules | FEf4. Driving Behavior Associated with Vehicle Operational Characteristics | |||||||||||||||||
|---|---|---|---|---|---|---|---|---|---|---|---|---|---|---|---|---|---|---|---|---|---|
| FEf1.1. Avoiding Aggressive Driving | FEf1.2. Following Eco-Driving Rules | FEf2.1. Avoiding Fast Acceleration/Deceleration of Vehicle | FEf2.2. Avoiding Excessive/Inappropriate Vehicle Speed | FEf2.3. Caring of Inefficient Braking | FE f2.4. Caring of Inefficient Change of Gear | FEf2.5. Avoiding Idling of Engine | FEf3.1. Managing the Traveling Time and Traveling Distance | FEf3.2. Paying Full Attention and Obeying Traffic Signs and Signal | FEf3.3. Paying Full Attention Traffic Calming Devices | FEf3.4. Caring of Traffic Flow at Roadway/Street Intersections/Junctions | FEf3.5. Monitoring and Adjusting to Traffic Volume | FEf3.6. Minding Pedestrian Crossings | FEf4.1. Selecting the Most Suitable Fuel Type | FEf4.2. Aware and Monitoring the Capacity of Engine | FEf4.3. Aware and Monitoring Vehicles Horsepower | FEf4.4. Optimize Gear Shift and Transmission System Usage | FEf4.5. Aware and Manage the Vehicle’s Dead Weight | FEf4.6. Regular Service and Check Tires Rolling Resistance | FEf4.7. Regular Service and Check Vehicle’s Routing System | FEf4.8. Monitoring and Caring of Vehicle’s Maintenance | |
| Robertson et al. [77] | / | / | / | ||||||||||||||||||
| Descornet [78] | / | / | / | ||||||||||||||||||
| Fischer [79] | / | ||||||||||||||||||||
| Kelly & Groblicki [80] | / | / | / | / | / | / | / | ||||||||||||||
| De Vlieger [50] | / | / | / | ||||||||||||||||||
| Cicero-Fernández et al. [81] | / | / | / | / | / | ||||||||||||||||
| Holmén & Niemeier [82] | / | / | / | / | / | / | / | ||||||||||||||
| Wipke et al. [83] | / | / | / | ||||||||||||||||||
| Höglund & Niittymäki [84] | / | / | / | / | / | / | |||||||||||||||
| Ntziachristos & Samaras [85] | / | / | / | ||||||||||||||||||
| Ericsson [86] | / | / | / | / | / | / | / | / | |||||||||||||
| Hydén & Várhelyi [87] | / | / | / | / | / | / | / | / | / | ||||||||||||
| van der Voort [88] | / | / | / | / | / | / | / | / | / | ||||||||||||
| Boulter [89] | / | / | / | / | / | / | / | / | / | / | / | ||||||||||
| Ericsson [90] | / | / | / | / | / | / | / | / | |||||||||||||
| Rouphail et al. [91] | / | ||||||||||||||||||||
| Ahn et al. [92] | / | / | |||||||||||||||||||
| Várhelyi [69] | / | / | / | / | / | ||||||||||||||||
| Cappiello et al. [93] | / | / | / | / | / | / | / | / | |||||||||||||
| Mandavilli et al. [94] | / | / | / | / | / | / | |||||||||||||||
| Aerde et al. [95] | / | / | / | / | / | / | / | ||||||||||||||
| Van Mierlo et al. [66] | / | / | / | / | / | / | / | / | / | / | / | / | / | / | |||||||
| Brundell-Freij & Ericsson [96] | / | / | / | / | / | / | / | / | / | / | |||||||||||
| Weilenmann et al. [97] | / | / | / | / | / | ||||||||||||||||
| Daham et al. [98] | / | / | / | / | / | / | / | ||||||||||||||
| El-Shawarby et al. [99] | / | / | / | / | / | / | / | / | / | / | / | ||||||||||
| Ericsson et al. [100] | / | / | / | / | / | / | / | / | |||||||||||||
| Alessandrini et al. [75] | / | / | / | / | / | / | |||||||||||||||
| Vermeulen [101] | / | / | / | / | / | / | / | / | / | / | / | ||||||||||
| Greenwood et al. [102] | / | / | / | ||||||||||||||||||
| Song et al. [76] | / | / | / | / | / | / | / | / | |||||||||||||
| Strömberg et al. [103] | / | / | / | / | / | / | / | / | / | / | |||||||||||
| Mulandi et al. [104] | / | / | / | / | / | ||||||||||||||||
| Peng & Wang [105] | / | / | / | ||||||||||||||||||
| Li & Wang [106] | / | / | / | / | / | ||||||||||||||||
| Zlatkovic et al. [107] | / | / | / | / | / | ||||||||||||||||
| Alessandrini et al. [108] | / | / | / | / | / | / | / | / | / | ||||||||||||
| Shukla & Alam [109] | / | / | / | / | / | / | / | / | |||||||||||||
| Boriboonsomsin et al. [110] | / | / | / | / | / | / | / | / | / | / | / | / | / | / | |||||||
| Kuo [111] | / | / | / | / | |||||||||||||||||
| Fonseca González et al. [112] | / | / | / | / | / | / | / | / | / | / | |||||||||||
| Sivak & Schoettle [65] | / | / | / | / | / | / | / | / | / | / | / | ||||||||||
| Barth et al. [113] | / | / | / | / | / | / | / | / | / | ||||||||||||
| Wang et al. [114] | / | / | |||||||||||||||||||
| Prasad et al. [115] | / | / | |||||||||||||||||||
| Adriano et al. [116] | / | / | / | / | / | / | / | / | / | / | / | / | |||||||||
| Laclair [117] | / | / | / | / | / | / | / | / | / | ||||||||||||
| Iddo Riemersma [118] | / | / | / | / | / | / | / | ||||||||||||||
| Hari et al. [119] | / | / | / | / | / | / | / | / | |||||||||||||
| Tulusan et al. [59] | / | / | / | / | / | / | |||||||||||||||
| Vagg et al. [120] | / | / | / | / | / | / | |||||||||||||||
| Lee et al. [67] | / | / | / | / | / | / | / | ||||||||||||||
| Shafie-Pour & Tavakoli [121] | / | / | / | / | / | / | / | / | / | ||||||||||||
| Barić et al. [51] | / | / | / | / | / | / | / | / | / | / | / | / | |||||||||
| Carrese et al. [122] | / | / | / | / | / | / | / | / | / | ||||||||||||
| Li & Sun [123] | / | / | / | / | / | / | / | / | / | / | |||||||||||
| Matsumoto and Tsurudome [124] | / | / | / | / | / | ||||||||||||||||
| Puan et al. [125] | / | / | / | / | |||||||||||||||||
| Mensing et al. [126] | / | / | / | / | / | / | / | / | / | / | / | / | |||||||||
| Li et al. [127] | / | / | / | / | / | / | / | / | / | / | |||||||||||
| Al-Ghandour [70] | / | / | / | / | / | / | / | / | / | / | |||||||||||
| Matsumoto & Peng [128] | / | / | / | / | / | / | / | ||||||||||||||
| Zhang et al. [129] | / | / | / | / | |||||||||||||||||
| Tang et al. [71] | / | / | / | / | |||||||||||||||||
| Pampel et al. [130] | / | / | / | / | / | / | / | ||||||||||||||
| Zhao et al. [131] | / | / | / | / | / | ||||||||||||||||
| Srivatsa Srinivas and Gajanand [132] | / | / | / | / | / | ||||||||||||||||
| Depth of citation | 12 | 13 | 45 | 56 | 13 | 17 | 20 | 32 | 23 | 14 | 45 | 17 | 3 | 6 | 43 | 38 | 12 | 32 | 8 | 9 | 7 |
| Cluster | Driving style | Driving behavior associated with vehicle transmission | Driving behavior associated with road design and traffic rules | Driving behavior associated with Vehicle operational characteristics | |||||||||||||||||
| Depth of citation by cluster | 25 | 151 | 134 | 155 | |||||||||||||||||
| Percentage (%) Depth of citation by cluster (Total depth of citation = 465) | % 5.4 | % 32.5 | % 28.8 | % 33.3 | |||||||||||||||||
Table 2.
Summary of GGDM data collection and analysis on variables influence vehicle fuel consumption and tailpipe emission in association with driving behavior from academic experts.
Table 2.
Summary of GGDM data collection and analysis on variables influence vehicle fuel consumption and tailpipe emission in association with driving behavior from academic experts.
| Cluster. | Fuel Consumption & Tailpipe Emission Variables | Validation Session 1 | Validation Session 2 | Validation Session 3 | Cons. (%) | GGDM Consensus | ||||||||||||||||||||||||
|---|---|---|---|---|---|---|---|---|---|---|---|---|---|---|---|---|---|---|---|---|---|---|---|---|---|---|---|---|---|---|
| Participant 1 | Participant 2 | Participant 3 | Participant 4 | SV | Participant 5 | Participant 6 | SV | Participant 7 | Participant 8 | SV | ||||||||||||||||||||
| WP | WPr = c-WP5 | c-WP | WP | r-WP | c-WP | WP | WPr = WP1* | c-WP | WP | WPr = WP6 | c-WP | WP | WPr | c-WP | WP | WPr | c-WP | WP | WPr = WP8 | c-WP | WP | WPr | c-WP | |||||||
| FEf1. Driving style | FEf1.1. Avoiding aggressive driving | 5 | 5 | 5 | 5 | - | 5 | 5 | - | 5 | - | 5 | 5 | 2 | 5 | - | 5 | 5 | - | 5 | 3 | 5 | 4 | 4 | 4 | - | 4 | 1 | 98 | Apprv |
| FEf1.2. Following eco-driving rules | 5 | 3 | 3 | 4 | - | 4 | 4 | - | 4 | - | 5 | 5 | 2 | 3 | - | 3 | 5 | - | 5 | 3 | 4 | 4 | 4 | 3 | - | 3 | 1 | 79 | Apprv | |
| FEf2. Driving behavior associated with vehicle transmission | FEf2.1. Avoiding fast Acceleration/Deceleration of vehicle | 5 | 4 | 4 | 5 | - | 5 | 4 | - | 4 | - | 4 | 4 | 2 | 4 | - | 4 | 4 | - | 4 | 3 | 4 | 4 | 4 | 4 | - | 4 | 1 | 83 | Apprv |
| FEf2.2. Avoiding Excessive/Inappropriate speed of vehicle | 5 | 5 | 5 | 5 | - | 5 | 4 | - | 4 | - | 4 | 4 | 2 | 5 | - | 5 | 4 | - | 4 | 3 | 4 | 4 | 4 | 4 | - | 4 | 1 | 89 | Apprv | |
| FEf2.3. Caring of inefficient braking | 4 | 3 | 3 | 3 | - | 3 | 4 | - | 4 | - | 4 | 4 | 2 | 3 | - | 3 | 4 | - | 4 | 3 | 5 | 4 | 4 | 4 | - | 4 | 1 | 71 | Apprv | |
| FEf2.4. Caring of inefficient change of gear | 4 | 3 | 3 | 4 | - | 4 | 3 | - | 3 | - | 4 | 4 | 2 | 3 | - | 3 | 4 | - | 4 | 3 | 4 | 4 | 4 | 3 | - | 3 | 1 | 70 | Apprv | |
| FEf2.5. Avoiding idling of engine | 4 | 5 | 4 | 3 | - | 3 | 3 | - | 3 | - | 4 | 4 | 2 | 5 | - | 5 | 4 | - | 4 | 3 | 5 | 4 | 4 | 4 | - | 4 | 1 | 79 | Apprv | |
| FEf3. Driving behavior associated with road design and traffic rules | FEf3.1. Managing the travelling time and travelling distance | 5 | 5 | 5 | 3 | - | 3 | 1 | - | 1 | - | 4 | 4 | 2 | 5 | - | 5 | 4 | - | 4 | 3 | 4 | 4 | 4 | 4 | - | 4 | 1 | 76 | Apprv |
| FEf3.2. Paying full attention and obeying traffic signs and signals | 2 | 3 | 2 | 4 | - | 4 | 3 | - | 3 | - | 4 | 4 | 2 | 3 | - | 3 | 4 | - | 4 | 3 | 5 | 3 | 3 | 3 | - | 3 | 1 | 66 | Dis. Apprv | |
| FEf3.3. Paying full attention to traffic calming devices | 4 | 3 | 3 | 4 | - | 4 | 5 | - | 5 | - | 4 | 4 | 2 | 3 | - | 3 | 4 | - | 4 | 3 | 5 | 5 | 5 | 4 | - | 4 | 1 | 78 | Apprv | |
| FEf3.4. Caring of traffic flow at roadway/street intersections/junctions | 5 | 3 | 3 | 5 | - | 5 | 3 | - | 3 | - | 4 | 4 | 2 | 3 | - | 3 | 4 | - | 4 | 3 | 4 | 3 | 3 | 4 | - | 4 | 1 | 73 | Apprv | |
| FEf3.5. Monitoring and Adjusting to traffic volume | 5 | 4 | 4 | 5 | - | 5 | 5 | - | 5 | - | 5 | 5 | 2 | 4 | - | 4 | 5 | - | 5 | 3 | 5 | 3 | 3 | 5 | - | 5 | 1 | 91 | Apprv | |
| FEf3.6. Minding pedestrian crossings | 4 | 2 | 2 | 2 | - | 2 | 4 | - | 4 | - | 4 | 4 | 2 | 2 | - | 2 | 4 | - | 4 | 3 | 3 | 3 | 3 | 3 | - | 3 | 1 | 60 | Dis. Apprv | |
| FEf4. Driving behavior associated with Vehicle operational characteristics | FEf4.1. Selecting the most suitable type of fuel | 5 | 4 | 4 | 5 | - | 5 | 1 | - | 1 | - | 4 | 4 | 2 | 4 | - | 4 | 4 | - | 4 | 3 | 4 | 4 | 4 | 3 | - | 3 | 1 | 74 | Apprv |
| FEf4.2. Aware and monitoring the capacity of engine | 5 | 3 | 3 | 5 | - | 5 | 5 | - | 5 | - | 5 | 5 | 2 | 3 | - | 3 | 5 | - | 5 | 3 | 4 | 4 | 4 | 3 | - | 3 | 1 | 84 | Apprv | |
| FEf4.3. Aware of and monitoring vehicle’s horsepower | 5 | 3 | 3 | 5 | - | 5 | 5 | - | 5 | - | 4 | 4 | 2 | 3 | - | 3 | 4 | - | 4 | 3 | 4 | 4 | 4 | 5 | - | 5 | 1 | 80 | Apprv | |
| FEf4.4. Optimize gear shift and transmission system usage | 4 | 3 | 3 | 4 | - | 4 | 5 | - | 5 | - | 4 | 4 | 2 | 3 | - | 3 | 4 | - | 4 | 3 | 5 | 4 | 4 | 5 | - | 5 | 1 | 78 | Apprv | |
| FEf4.5. Aware of and managing the vehicle’s weight | 4 | 3 | 3 | 5 | - | 5 | 5 | - | 5 | - | 5 | 5 | 2 | 3 | - | 3 | 5 | - | 5 | 3 | 4 | 4 | 4 | 4 | - | 4 | 1 | 85 | Apprv | |
| FEf4.6. Regular service and check tires rolling resistance | 3 | 2 | 2 | 3 | - | 3 | 5 | - | 5 | - | 4 | 4 | 2 | 2 | - | 2 | 4 | - | 4 | 3 | 4 | 4 | 4 | 3 | - | 3 | 1 | 66 | Dis. Apprv | |
| FEf4.7. Regular service and check vehicle’s routing system | 4 | 2 | 2 | 3 | - | 3 | 4 | - | 4 | - | 4 | 4 | 2 | 2 | - | 2 | 4 | - | 4 | 3 | 4 | 4 | 4 | 4 | - | 4 | 1 | 65 | Dis. Apprv | |
| FEf4.8. Monitoring and caring of vehicle’s maintenance | 5 | 4 | 4 | 4 | - | 4 | 5 | - | 5 | - | 5 | 5 | 2 | 4 | - | 4 | 5 | - | 5 | 3 | 3 | 4 | 3 | 3 | - | 3 | 1 | 86 | Apprv | |
Note. WP: Participant’s Rate to the validation aspect, c-WP: conclusion of Participant’s Rate to the validation aspect considered as the minimum of {WPj, WPrj}, WPr: Participant introduced resource Rate to the validation aspect, -: Participant did not provide value, SV: Close group discussion session Value considered by the GGDM researcher, Apprv: the validation aspect is approved based on GGDM Consensus rate of more than 70% agreement, Dis-Apprv: the validation aspect is not approved based on GGDM Consensus rate of not more than 70% agreement; WP1*: refers to the participant 1 in the non-academic expert Table 3 below.
Table 3.
Summary of GGDM data collection and analysis on variables influence vehicle fuel consumption and tailpipe emission in association with driving behavior from practitioner experts.
Table 3.
Summary of GGDM data collection and analysis on variables influence vehicle fuel consumption and tailpipe emission in association with driving behavior from practitioner experts.
| Cluster | Fuel Consumption & Tailpipe Emission Variables | Validation Session 1 | Cons. (%) | GGDM Consensus | ||||||||||||||||||
|---|---|---|---|---|---|---|---|---|---|---|---|---|---|---|---|---|---|---|---|---|---|---|
| Participant 1 | Participant 2 | Participant 3 | Participant 4 | Participant 5 | Participant 6 | SV | ||||||||||||||||
| WP | WPr = c-WP2 | c-WP | WP | r-WP | c-WP | WP | WPr | c-WP | WP | WPr | c-WP | WP | WPr = c-WP6 | c-WP | WP | WPr= WP8* | c-WP | |||||
| FEf1. Driving style | FEf1.1. Avoiding aggressive driving | 4 | 4 | 4 | 4 | - | 4 | 4 | - | 4 | 3 | - | 3 | 4 | 5 | 4 | 5 | - | 5 | 2 | 80 | Apprv |
| FEf1.2. Following eco-driving rules | 5 | 5 | 5 | 5 | - | 5 | 4 | - | 4 | 3 | - | 3 | 4 | 5 | 4 | 5 | - | 5 | 2 | 87 | Apprv | |
| FEf2. Driving behavior associated with vehicle transmission | FEf2.1. Avoiding fast Acceleration/Deceleration of vehicle | 5 | 5 | 5 | 5 | - | 5 | 4 | - | 4 | 3 | - | 3 | 4 | 5 | 4 | 5 | - | 5 | 2 | 87 | Apprv |
| FEf2.2. Avoiding Excessive/ Inappropriate speed of vehicle | 5 | 5 | 5 | 5 | - | 5 | 5 | - | 5 | 4 | - | 4 | 4 | 5 | 4 | 5 | - | 5 | 2 | 93 | Apprv | |
| FEf2.3. Caring of inefficient braking | 4 | 4 | 4 | 4 | - | 4 | 3 | - | 3 | 4 | - | 4 | 4 | 5 | 4 | 5 | - | 5 | 2 | 80 | Apprv | |
| FEf2.4. Caring of inefficient change of gear | 4 | 4 | 4 | 4 | - | 4 | 3 | - | 3 | 3 | - | 3 | 4 | 5 | 4 | 5 | - | 5 | 2 | 77 | Apprv | |
| FEf2.5. Avoiding idling of engine | 4 | 4 | 4 | 4 | - | 4 | 4 | - | 4 | 3 | - | 3 | 4 | 5 | 4 | 5 | - | 5 | 2 | 80 | Apprv | |
| FEf3. Driving behaviour associated with road design and and traffic rules | FEf3.1. Managing the travelling time and travelling distance | 3 | 3 | 3 | 3 | - | 3 | 4 | - | 4 | 3 | - | 3 | 4 | 4 | 4 | 4 | - | 4 | 2 | 70 | Apprv |
| FEf3.2. Paying full attention and obeying traffic signs and signals | 3 | 3 | 3 | 3 | - | 3 | 3 | - | 3 | 4 | - | 4 | 3 | 4 | 3 | 4 | - | 4 | 2 | 67 | ||
| FEf3.3. Paying full attention to traffic calming devices | 3 | 3 | 3 | 3 | - | 3 | 3 | - | 3 | 3 | - | 3 | 5 | 5 | 5 | 5 | - | 5 | 2 | 73 | Apprv | |
| FEf3.4. Caring of traffic flow at roadway/street intersections/junctions | 3 | 3 | 3 | 3 | - | 3 | 3 | - | 3 | 3 | - | 3 | 3 | 5 | 3 | 5 | - | 5 | 2 | 67 | Dis. Apprv | |
| FEf3.5. Monitoring and Adjusting to traffic volume | 4 | 4 | 4 | 4 | - | 4 | 4 | - | 4 | 4 | - | 4 | 3 | 5 | 3 | 5 | - | 5 | 2 | 80 | Apprv | |
| FEf3.6. Minding pedestrian crossing | 2 | 2 | 2 | 2 | - | 2 | 3 | - | 3 | 4 | - | 4 | 3 | 4 | 3 | 4 | - | 4 | 2 | 60 | Dis. Apprv | |
| FEf4. Driving behaviour associated with Vehicle operational characteristics | FEf4.1. Selecting the most suitable type of fuel | 4 | 4 | 4 | 4 | - | 4 | 2 | - | 2 | 3 | - | 3 | 4 | 5 | 4 | 5 | - | 5 | 2 | 73 | Apprv |
| FEf4.2. Aware and monitoring the capacity of engine | 4 | 4 | 4 | 4 | - | 4 | 3 | - | 3 | 3 | - | 3 | 4 | 5 | 4 | 5 | - | 5 | 2 | 77 | Apprv | |
| FEf4.3. Aware of and monitoring vehicle’s horsepower | 4 | 4 | 4 | 4 | - | 4 | 3 | - | 3 | 3 | - | 3 | 4 | 5 | 4 | 5 | - | 5 | 2 | 77 | Apprv | |
| FEf4.4. Optimize gear shift and transmission system usage | 4 | 4 | 4 | 4 | - | 4 | 3 | - | 3 | 3 | - | 3 | 4 | 5 | 4 | 5 | - | 5 | 2 | 77 | Apprv | |
| FEf4.5. Aware of and managing the vehicle’s weight | 4 | 4 | 4 | 4 | - | 4 | 3 | - | 3 | 3 | - | 3 | 4 | 5 | 4 | 5 | - | 5 | 2 | 77 | Apprv | |
| FEf4.6. Regular service and check tires rolling resistance | 3 | 3 | 3 | 3 | - | 3 | 3 | - | 3 | 3 | - | 3 | 4 | 4 | 4 | 4 | - | 4 | 2 | 67 | Dis. Apprv | |
| FEf4.7. Regular service and check the vehicle’s routing system | 4 | 4 | 4 | 4 | - | 4 | 3 | - | 3 | 3 | - | 3 | 4 | 4 | 4 | 4 | - | 4 | 2 | 73 | Apprv | |
| FEf4.8. Monitoring and caring of vehicle’s maintenance | 4 | 4 | 4 | 4 | - | 4 | 3 | - | 3 | 3 | - | 3 | 4 | 5 | 4 | 5 | - | 5 | 2 | 77 | Apprv | |
Note: Note: WP: Participant’s Rate to the validation aspect, c-WP: conclusion of Participant’s Rate to the validation aspect considered as the minimum of {WPj, WPrj}, WPr: Participant introduced resource Rate to the validation aspect, -: Participant did not provide value, SV: Close group discussion session Value considered by the GGDM researcher, Apprv: the validation aspect is approved based on GGDM Consensus rate of more than 70% agreement, Dis-Apprv: the validation aspect is not approved based on GGDM Consensus rate of not more than 70% agreement; WP8*: refers to the participant 8 in the academic expert Table 2 above.
Table 4.
Data extracted from Table 1, Table 2 and Table 3 for the criterion ‘Avoiding aggressive driving’.
| Content Analysis (Table 1) | Expert Inputs (Table 2 and Table 3) |
|---|---|
| Depth of citation = 12 | GGDM consensus rate (academician) = 0.98 |
| Total cited articles = 67 | GGDM consensus rate (practitioners) = 0.80 |
| Percentage depth of citation = 12/67 = 0.18 | Average GGDM consensus rate = (0.98 + 0.8)/2 = 0.89 |
Table 5.
Green Value (GV) analysis of green travel behavior variables influencing less fuel consumption and tailpipe emission.
Table 5.
Green Value (GV) analysis of green travel behavior variables influencing less fuel consumption and tailpipe emission.
| Cluster. | Variables | Depth of Citation | GGDM Result | Green Value (GV) | |||
|---|---|---|---|---|---|---|---|
| Frequency | Percentage (%) | Academic | Practitioners | Average | |||
| FEf1. Driving style | FEf1.1. Avoiding aggressive driving | 12 | 0.18 | 0.98 | 0.80 | 0.89 | 0.16 |
| FEf1.2. Following eco-driving rules | 13 | 0.19 | 0.79 | 0.87 | 0.83 | 0.16 | |
| FEf2. Driving behavior associated with vehicle transmission | FEf2.1. Avoiding fast Acceleration/ Deceleration of vehicle | 45 | 0.67 | 0.83 | 0.87 | 0.85 | 0.57 |
| FEf2.2. Avoiding Excessive/ Inappropriate speed of vehicle | 56 | 0.84 | 0.89 | 0.93 | 0.91 | 0.76 | |
| FEf2.3. Caring of inefficient braking | 13 | 0.19 | 0.71 | 0.80 | 0.76 | 0.15 | |
| FEf2.4. Caring of inefficient change of gear | 17 | 0.25 | 0.70 | 0.77 | 0.74 | 0.19 | |
| FEf2.5. Avoiding idling of engine | 20 | 0.30 | 0.79 | 0.80 | 0.79 | 0.24 | |
| FEf3. Driving behavior associated with road design and traffic rules | FEf3.1. Managing the travelling time and travelling distance | 32 | 0.48 | 0.76 | 0.70 | 0.73 | 0.35 |
| FEf3.2. Paying full attention and obeying traffic signs and signals | 23 | 0.34 | 0.66 | 0.67 | 0.67 | * Not applicable | |
| FEf3.3. Paying full attention to traffic calming devices | 14 | 0.21 | 0.78 | 0.73 | 0.75 | 0.16 | |
| FEf3.4. Caring of roadway and street design | 45 | 0.67 | 0.73 | 0.67 | 0.70 | 0.47 | |
| FEf3.5. Monitoring and Adjusting to traffic volume | 17 | 0.25 | 0.91 | 0.80 | 0.86 | 0.22 | |
| FEf3.6. Managing towards pedestrian crossings | 3 | 0.04 | 0.60 | 0.60 | 0.60 | * Not applicable | |
| FEf4. Driving behavior associated with Vehicle operational characteristics | FEf4.1. Selecting the most suitable type of fuel | 6 | 0.09 | 0.74 | 0.73 | 0.73 | 0.07 |
| FEf4.2. Aware and monitoring the capacity of engine | 43 | 0.64 | 0.84 | 0.77 | 0.80 | 0.51 | |
| FEf4.3. Aware of and monitoring vehicle’s horsepower | 38 | 0.57 | 0.80 | 0.77 | 0.79 | 0.45 | |
| FEf4.4. Managing and monitoring the vehicle’s transmission | 12 | 0.18 | 0.78 | 0.77 | 0.77 | 0.14 | |
| FEf4.5. Aware of and managing the vehicle’s weight | 32 | 0.48 | 0.85 | 0.77 | 0.81 | 0.39 | |
| FEf4.6. Aware of and managing the vehicle’s tire rolling resistance | 8 | 0.12 | 0.66 | 0.67 | 0.67 | * Not applicable | |
| FEf4.7. Managing and controlling the vehicle’s routing system | 9 | 0.13 | 0.65 | 0.73 | 0.69 | * Not applicable | |
| FEf4.8. Monitoring and caring of vehicle’s maintenance | 7 | 0.10 | 0.86 | 0.77 | 0.82 | 0.09 | |
Note: * Not applicable: The variable was non-approved in GGDM process and cannot be involved in GV analysis.
© 2018 by the authors. Licensee MDPI, Basel, Switzerland. This article is an open access article distributed under the terms and conditions of the Creative Commons Attribution (CC BY) license (http://creativecommons.org/licenses/by/4.0/).
Share and Cite
MDPI and ACS Style
Muslim, N.H.; Keyvanfar, A.; Shafaghat, A.; Abdullahi, M.M.; Khorami, M. Green Driver: Travel Behaviors Revisited on Fuel Saving and Less Emission. Sustainability 2018, 10, 325. https://doi.org/10.3390/su10020325
AMA Style
Muslim NH, Keyvanfar A, Shafaghat A, Abdullahi MM, Khorami M. Green Driver: Travel Behaviors Revisited on Fuel Saving and Less Emission. Sustainability. 2018; 10(2):325. https://doi.org/10.3390/su10020325
Chicago/Turabian StyleMuslim, Nurul Hidayah, Ali Keyvanfar, Arezou Shafaghat, Mu’azu Mohammed Abdullahi, and Majid Khorami. 2018. "Green Driver: Travel Behaviors Revisited on Fuel Saving and Less Emission" Sustainability 10, no. 2: 325. https://doi.org/10.3390/su10020325
Note that from the first issue of 2016, this journal uses article numbers instead of page numbers. See further details here.