Study on Livelihood Assets-Based Spatial Differentiation of the Income of Natural Tourism Communities
by
 , ,
, ,
Jinhai Ma
1,2 ,
,
Jie Zhang
1,*,
Li Li
1,*,
Zhanjing Zeng
1,
Jingrong Sun
3,
Qilou (Bill) Zhou
4 and
Yuling Zhang
5 1
Department of Land Resources and Tourism Sciences, Nanjing University, 163 Xianlin Ave., Nanjing 210023, China
2
Tourism College, Qinghai Nationalities University, 3 Bayi Road, Chengdong District, Xining 81007, China
3
Tourism and Social Management School, Nanjing Xiaozhuang University, 3601 Hongjing Ave., Nanjing 211171, China
4
School of Urban, Resources and Environment, Jiangsu Second Normal University, 77 Beijing Xilu, Gulou District, Nanjing 210013, China
5
Guangzhou Institute of Geography, Guangzhou 510070, China
*
Authors to whom correspondence should be addressed.
Sustainability 2018, 10(2), 353; https://doi.org/10.3390/su10020353
Submission received: 17 January 2018
/
Revised: 26 January 2018
/
Accepted: 26 January 2018
/
Published: 30 January 2018
(This article belongs to the Special Issue Employment and Income Growth from Sustainable Tourism)
Abstract
:Livelihood assets have a significant impact on the livelihood options and income of tourism communities. The level of tourism development and the type of natural tourism communities often exhibit spatial differences. By using the method of sustainable livelihood and examining the main factors that affect community income from the perspective of spatial heterogeneity, it is possible to identify the livelihood assets that play the most critical role in the development of sustainable livelihoods and income generation in the community, which helps provide more reasonable advice on tourism destination management. In this article, we conducted a case study on 16 communities in and around Jiuzhaigou Nature Reserve in Sichuan Province, China, and divided the communities into three types, i.e., core attraction areas, service support areas, and secondary service support areas, according to the geographical and spatial characteristics, tourism development level, and livelihood type. The participatory assessment method was adopted to obtain in-depth interviews and questionnaire data from 256 rural households, which was utilized to construct four multivariate regression models to investigate the effect of livelihood assets on community income and the spatial difference of the factors that affect community income. The results showed that (1) livelihood assets exert a significant impact on community income in tourist areas, with a remarkable spatial difference; (2) the types of livelihoods and the effective utilization of livelihood assets have a significant impact on farmers’ incomes; (3) the type and amount of livelihood assets have a certain impact on the choice of livelihood; and (4) a farmer’s livelihood type determines the utilization method and the effective utilization of livelihood assets.
1. Introduction
Because tourism increases community employment opportunities [1,2,3], community income [1,2,3,4,5,6,7], and community livelihood assets [4] and reduces poverty [8,9,10], governments and non -governmental organizations such as China [11,12], Bhutan [13,14], and the UK Department for International Development [15,16,17,18] actively encourage communities to participate in tourism through policy support and project support. These organizations also help villages diversify livelihoods and create sustainable livelihood opportunities for local residents while community residents also strongly support the community to develop tourism because of its economic benefits [4,12,19].
However, “tourism is not a panacea” [20]. Consequently, various issues have emerged during the development of tourism in the community: (1) the imbalance of income among the residents [7,21,22]; (2) even if tourism has increased incomes, it has failed to actually improve community livelihoods [23]; and (3) the income increase is only temporary, without long-term sustainability [24]. These problems have led some residents to participate in the tourism industry only half-heartedly [25], and in some cases, the development of tourism has caused social conflicts [22,26]. As an important indicator of sustainable livelihood output, income reflects the level of community livelihood and sustainability [27]. Therefore, determining which factors affect community income is key to solving the above problems and achieving sustainable community livelihood development.
Previous studies about sustainable community livelihood development have mainly focused on economic aspects. The approach of sustainable livelihood has changed the research trend and shifted to a more comprehensive perspective to investigate agricultural and rural issues, which have been accepted and promoted by many scholars [27,28,29,30]. Sustainable livelihood also switches the research on tourism from the traditional perspective that only addresses the economic, trade, and environmental impacts to a broader perspective that comprehensively assesses the effect of tourism on community [15,26,31,32,33,34]. In recent years, some scholars have noted that in the framework of sustainable livelihood, evaluation with the combination of income and livelihood assets in studying community livelihoods is more comprehensive than that with only livelihood assets or income [35]. Investigations on community livelihoods using the sustainable livelihood method with the combination of income and livelihood assets have been extensively conducted in rural economics and management and other fields [36,37,38,39,40,41]; however, livelihood assets have been used as a factor affecting income in few tourism studies. For example, from the perspective of livelihood assets, Truong et al. found that the lack of livelihood capital is an important reason for limited tourism income in residents using the sustainable livelihood approach [42].
In this study, from the perspective of livelihood assets, we adopted the sustainable livelihood method and combined livelihood assets and income to examine the factors that affect the income of community residents in tourist areas in terms of spatial heterogeneity.
2. Literature Review
2.1. Effect of Livelihood Assets on Community Livelihoods Choice
Livelihood assets are the basis of community livelihoods [43] and are prerequisite for sustainable community livelihood development [44]; diversified livelihood assets also diversify the livelihoods of rural households [45]. Moreover, the increase of certain livelihood assets diversifies community livelihoods. Groenewald et al. [46] and Goulden et al. [47] believe that higher community social assets are able to diversify livelihoods. Mitra even argued that “without ‘social capital’ access to any source of livelihood is almost inconceivable” [48]. In traditional rural communities, natural assets and human assets are the main livelihood assets; consequently, agriculture is the most important livelihood of traditional communities. Generally, the higher the natural and human assets, the more likely the farmers would choose agriculture as their livelihood [38], although they might work as temporary migrant workers in other areas [49]. With the development of society, increases in farmers’ physical assets, financial assets, and social assets prompt them to choose non-agricultural livelihoods and thus achieve diversified livelihoods or livelihood transformation [35,38,50,51]; the higher the accumulated livelihood assets, the more likely the farmers will choose a livelihood with a higher income [35]. The type and accumulation of farmers’ livelihood assets also exert an influence on the farmers’ choice of different agricultural livelihood activities. For example, Bakkegaard et al. found that families with high human assets and livelihoods assets would choose hunting in the jungle, whereas households with senior and female family members as the head of the family and rich in knowledge on the local surroundings would choose gathering [52]. Baiyegunhi et al. found that education, household size, and distance to a worm collecting station had a significant negative effect on the local farmers’ choice of worm collection as a livelihood [53]. Social assets affect not only community livelihoods but also community livelihood policies and systems [54], which is conducive to the optimization of spatial allocation of other resources [55]. In the development of community tourism, the lack of tourism knowledge and skills [56,57,58,59], the lack of information about tourism development [57], poor infrastructure [60], and the lack of power [22,25] are major factors that limit community residents’ participation in tourism. Therefore, livelihood assets also have a strong influence on community residents’ livelihood choice.
2.2. Effect of Livelihood Assets on Community Income
Income is one of the key livelihood outcomes in the framework of sustainable livelihood [27]; income level directly reflects the level of community livelihoods, whereas livelihood assets have a significant impact on community income [45,48,52,61,62,63,64,65]. Social assets in particular are the most crucial factor affecting residents’ income increase [65]. Moreover, the lack of livelihood capital, e.g., social assets, information, etc., is the root cause of community residents having a low income and being mired in poverty [42]. However, Myroniuk argues that social assets do not necessarily influence income [65].
Perz investigated rural households along the Amazon River and found that natural community and human assets contributed to the increased income from agricultural livelihoods whereas financial and social assets contributed to income from non-farming livelihoods [45]. Moreover, natural, social, and physical assets also contributed significantly to the income of Bangladeshi fishermen [61,62]. Good natural and financial assets have increased the income of community residents in the Northwest plains of India and reduced the poverty rate in the region [63,64]. In a study on communities in Luki Biosphere Reserve, Bas-Congo Province, the Democratic Republic of Congo, Bakkegaard found that the respondents’ age, family size, and the distance to resources had a significant effect on income [52]. Although the stock of livelihood assets affected the income of community residents, the effective utilization of livelihood assets caused an income disparity [66]. Truong argues that the lack of livelihood capital is an important reason for residents’ limited income from tourism [42]; additionally, the experience and years in tourism [67], the gender of the household head [6], and the dependence on tourism directly exert a significant positive impact on community income [6]. Social assets increase business opportunities and financial assets in tourism residents, leading to a better income [68].
3. Study Area and Data Source
3.1. Overview of the Study Area
In this study, the Jiuzhaigou Nature Reserve in Sichuan Province, China, was used as a case study (Figure 1). The Jiuzhaigou Nature Reserve, which was named after nine Tibetan villages (Heye, Pannaya, Jianpan, Shuzheng, Zezhawa, Pengbu, Heijiao, Guwa, and Panxing), has a total area of approximately 720 km2. Jiuzhaigou tourism was initiated in 1981 and began its formal development in 1986. Since then, the number of visitors has increased sharply, from 27,000 in 1984 to 80,000 in 2000. In 1998, thanks to the significantly improved condition of the road from Chengdu to Jiuzhaigou that shortens the travel time from Chengdu to Jiuzhaigou from two days to 12 h, the number of visitors has kept sharply increasing. With the increase of tourists, the tourism income has also started to increase, and community residents have gradually chosen tourism as their livelihood. Before the 1980s, Jiuzhaigou residents mainly engaged in agriculture and hunting; the hunting severely reduced the number of wild animals, whereas farming on steep slopes caused serious soil erosion. The local residents were very poor, with a per capita income of only 195 yuan in 1978. Since 1981, when tourism began to develop in the area, the income of residents has increased sharply. Relative to 1978, the per capita income of the local residents increased to 1988 yuan in 1981, corresponding to a 188% increase (not adjusted for inflation), and increased by 477% in 1999 (not adjusted for inflation). The tourism development in Jiuzhaigou has not only changed the livelihood of residents in the Jiuzhaigou Nature Reserve area and increased their income, but it has also greatly affected the livelihood method and the income of villagers from Zhangzha Township, which is next to the Jiuzhaigou Nature Reserve (Figure 2).
3.2. Data Source
To study the effect of tourism development on the livelihoods of Jiuzhaigou residents, the research group conducted field research during May and June of 2014 on the basis of research performed in August 2011. The fieldwork was conducted in three stages. Stage 1—In-depth interviews were conducted with the management staff of the Jiuzhaigou Nature Reserve and personnel of Zhangzha Township to collect information on the involvement of the 13 communities under the jurisdiction of the township in the tourism industry and ensure that residents from all the communities that are directly or indirectly involved in the tourism industry were included. Based on the information, three communities within the Jiuzhaigou Nature Reserve and 13 communities of Zhangzha Township were determined as the case study subjects. Stage 2—In-depth interviews were conducted with the head of each of the communities to collect information on the residents’ involvement in the tourism industry and the communities’ tourism development. Stage 3—In-depth interviews and questionnaire surveys were conducted with rural households using the farmer-participatory approach, in which the rural participatory assessment method with convenience sampling [37,38,40] was adopted to perform the in-depth interviews and the questionnaire survey. We selected 5–29 households in each community to conduct in-depth interviews (about 25% of the total number of households in each community) and the target family members are over 18 years of age.In total, 265 copies of questionnaires were distributed, from which 256 valid questionnaires were recovered, with an effective recovery rate of 96.6%. The main content of the questionnaire includes eight aspects: the characteristics of household members, farmers’ livelihoods and corresponding income, the characteristics of farmer households’ livelihood assets, farmers’ expectation for the development of livelihood assets, farmers’ understanding of the problems existing in the development of family tourism, farmers’ expectation of the Government’s policies to support tourism, and the willingness of farmers on development of future tourism.
4. Methodology
4.1. Community Type Classification
In past livelihood-related studies, communities and rural households were all categorized into different types; for example, rural households were categorized into three types, i.e., market-oriented quantized value, part-time quantized value, and non-farming household according to the livelihoods of the rural households [40]; project household and non-project household according to the types of the project [62]; and semi-mountain settlement, river valley settlement, high-mountain settlement, and resettlement area according to the geographical locations [38]; farm households and off-farm households according to the types of the livelihoods [41]. There are three main methods used to classify tourism communities: (1) the communities are categorized into inner scenic attraction regions and peripheral or adjacent regions according to geospatial features [31,69,70,71]; (2) the communities are categorized according to administrative divisions [72,73]; and (3) the communities are categorized according to livelihoods [74]. In this study, we categorized the communities according to the geospatial features, the level of tourism development, and the type of livelihood, in which the livelihood that contributes the most to the household income was deemed the dominant livelihood, and the level of tourism development of the community was determined by the proportion of rural households in the community with tourism as their dominant livelihood.
P is the proportion of households with tourism as their main livelihood, P = 0–100%; Ht is the number of households that fully rely on tourism as livelihoods; Ha is the total number of households.
4.2. Non-Dimensionalization of Income
In this analysis, the real and effective farmers’ income does contribute to achieving scientific and true research results, but in actual livelihood-related studies, community residents are often unwilling to disclose their real income, which is not conducive to achieving the expected research goal. In this study, after friendly negotiation and communication, we promised strict confidentiality of the residents’ real incomes and necessary technical treatment, and ultimately the residents agreed to disclose their real incomes. To protect the privacy of the respondents, in this study, the income was normalized, in which the income of each of the samples was divided by the maximum income to become non-dimensional, so that it does not affect the final results in subsequent analyses.
4.3. Measurement of Livelihood Assets
The present study constructed a secondary index system for livelihood capital based on the characteristics of Jiuzhaigou communities and tourism and past studies. The results are shown in Appendix Table A1.
According to the above two index systems, we further measured livelihood assets using the entropy method. Entropy is an important concept in thermodynamics that measures the state of chaos or disorder within the physical system, which has been applied to a variety of fields, e.g., information theory [75], biological sciences [76], economics [77], and management [77], which are far beyond the field of thermodynamics and statistical physics [76]. In 1948, Shannon introduced the concept of entropy into information theory to measure the degree of chaos or disorder of information [75], i.e., the intensity of uncertainty of information emitted by an information source. Information entropy is also known as Shannon entropy and provides the average internal information by measuring the relative intensity of individual characteristics [78], in which the information entropy is inversely proportional to the probability of random events. The valuations on the indicators of livelihood assets were subjective to some extent and may lead to incomplete or wrong information [77]. Therefore, to effectively avoid the influence of subjective factors caused by the arbitrary valuation, reduce the uncertainty of livelihood assets indicator information, and improve the information of valuable indicators [76,77,79], the weights of seven livelihood asset indicators were determined using the entropy method.
Because the quantized values obtained from the survey had different dimensions, magnitudes, and ranges, to facilitate the comparative analysis on livelihood assets of different categories, in Step 1, we adopted the extremum method to normalize the quantized values of the measurement indicators (see Formula (1)):
In Step 2, the weight of the jth indicator of the ith rural household was calculated using the following formula:
Xij and X’ij are, respectively, the quantized value and the standardized value of the jth indicator of the ith rural household, max{Xj} is the maximum quantized value of the jth indicator among all rural households, m is the total number of rural households, and n is the number of indicators. Shannon’s information entropy function is as follows [75]:
where Hn is information entropy, which is the function of a random even (i) to have a probability of p, pi and −k is Boltzmann constant. The higher the pi, the higher the probability is of the occurrence of the event and the lower the uncertainty is of the event Hn, i.e., , is the measurement of the uncertainty of the event, and the higher the value is of , the higher the uncertainty of the event.
According to Shannon’s information entropy function, the information uncertainty measurement model was constructed using the weight Yij of the value of the jth indicator of the ith rural household [77]:
where is the measurement of the jth indicator of a certain livelihood asset, i.e., the information entropy of the jth indicator, and −k is the Boltzmann constant; let , then 0 ≤ ej ≤ 1.
In Step 4, the information entropy redundancy was calculated. Redundancy is the measurement of the information’s certainty, orderliness, and predictability, which is inversely proportional to information entropy. To obtain effective information, i.e., to reduce uncertain information, Tjoe [77] recommended using the following formula to calculate the information entropy redundancy:
where dj is the information entropy redundancy (0 ≤ dj ≤ 1). The higher the value of dj, the more valuable the source of information. In this study, the higher the dj, the more valuable the jth indicator of certain livelihood assets.
In Step 5, the weights of the indicators were calculated. The weight of each indicator was calculated using the following formula [77]:
4.4. Effect of Livelihood Assets on Income
To examine the effect of livelihood assets on income, we adopted the following multivariate regression model:
where Y = total household income; NA = household value of natural assets; HU = household value of human assets; PH = household value of physical assets; SC = household value of social assets; FA = household value of financial assets; PY = household value of psychological assets; PO = household value of policy assets; Error = residual value; and α and β1–β7 are parameter estimates.
5. Analysis of Results
5.1. Type of Communities
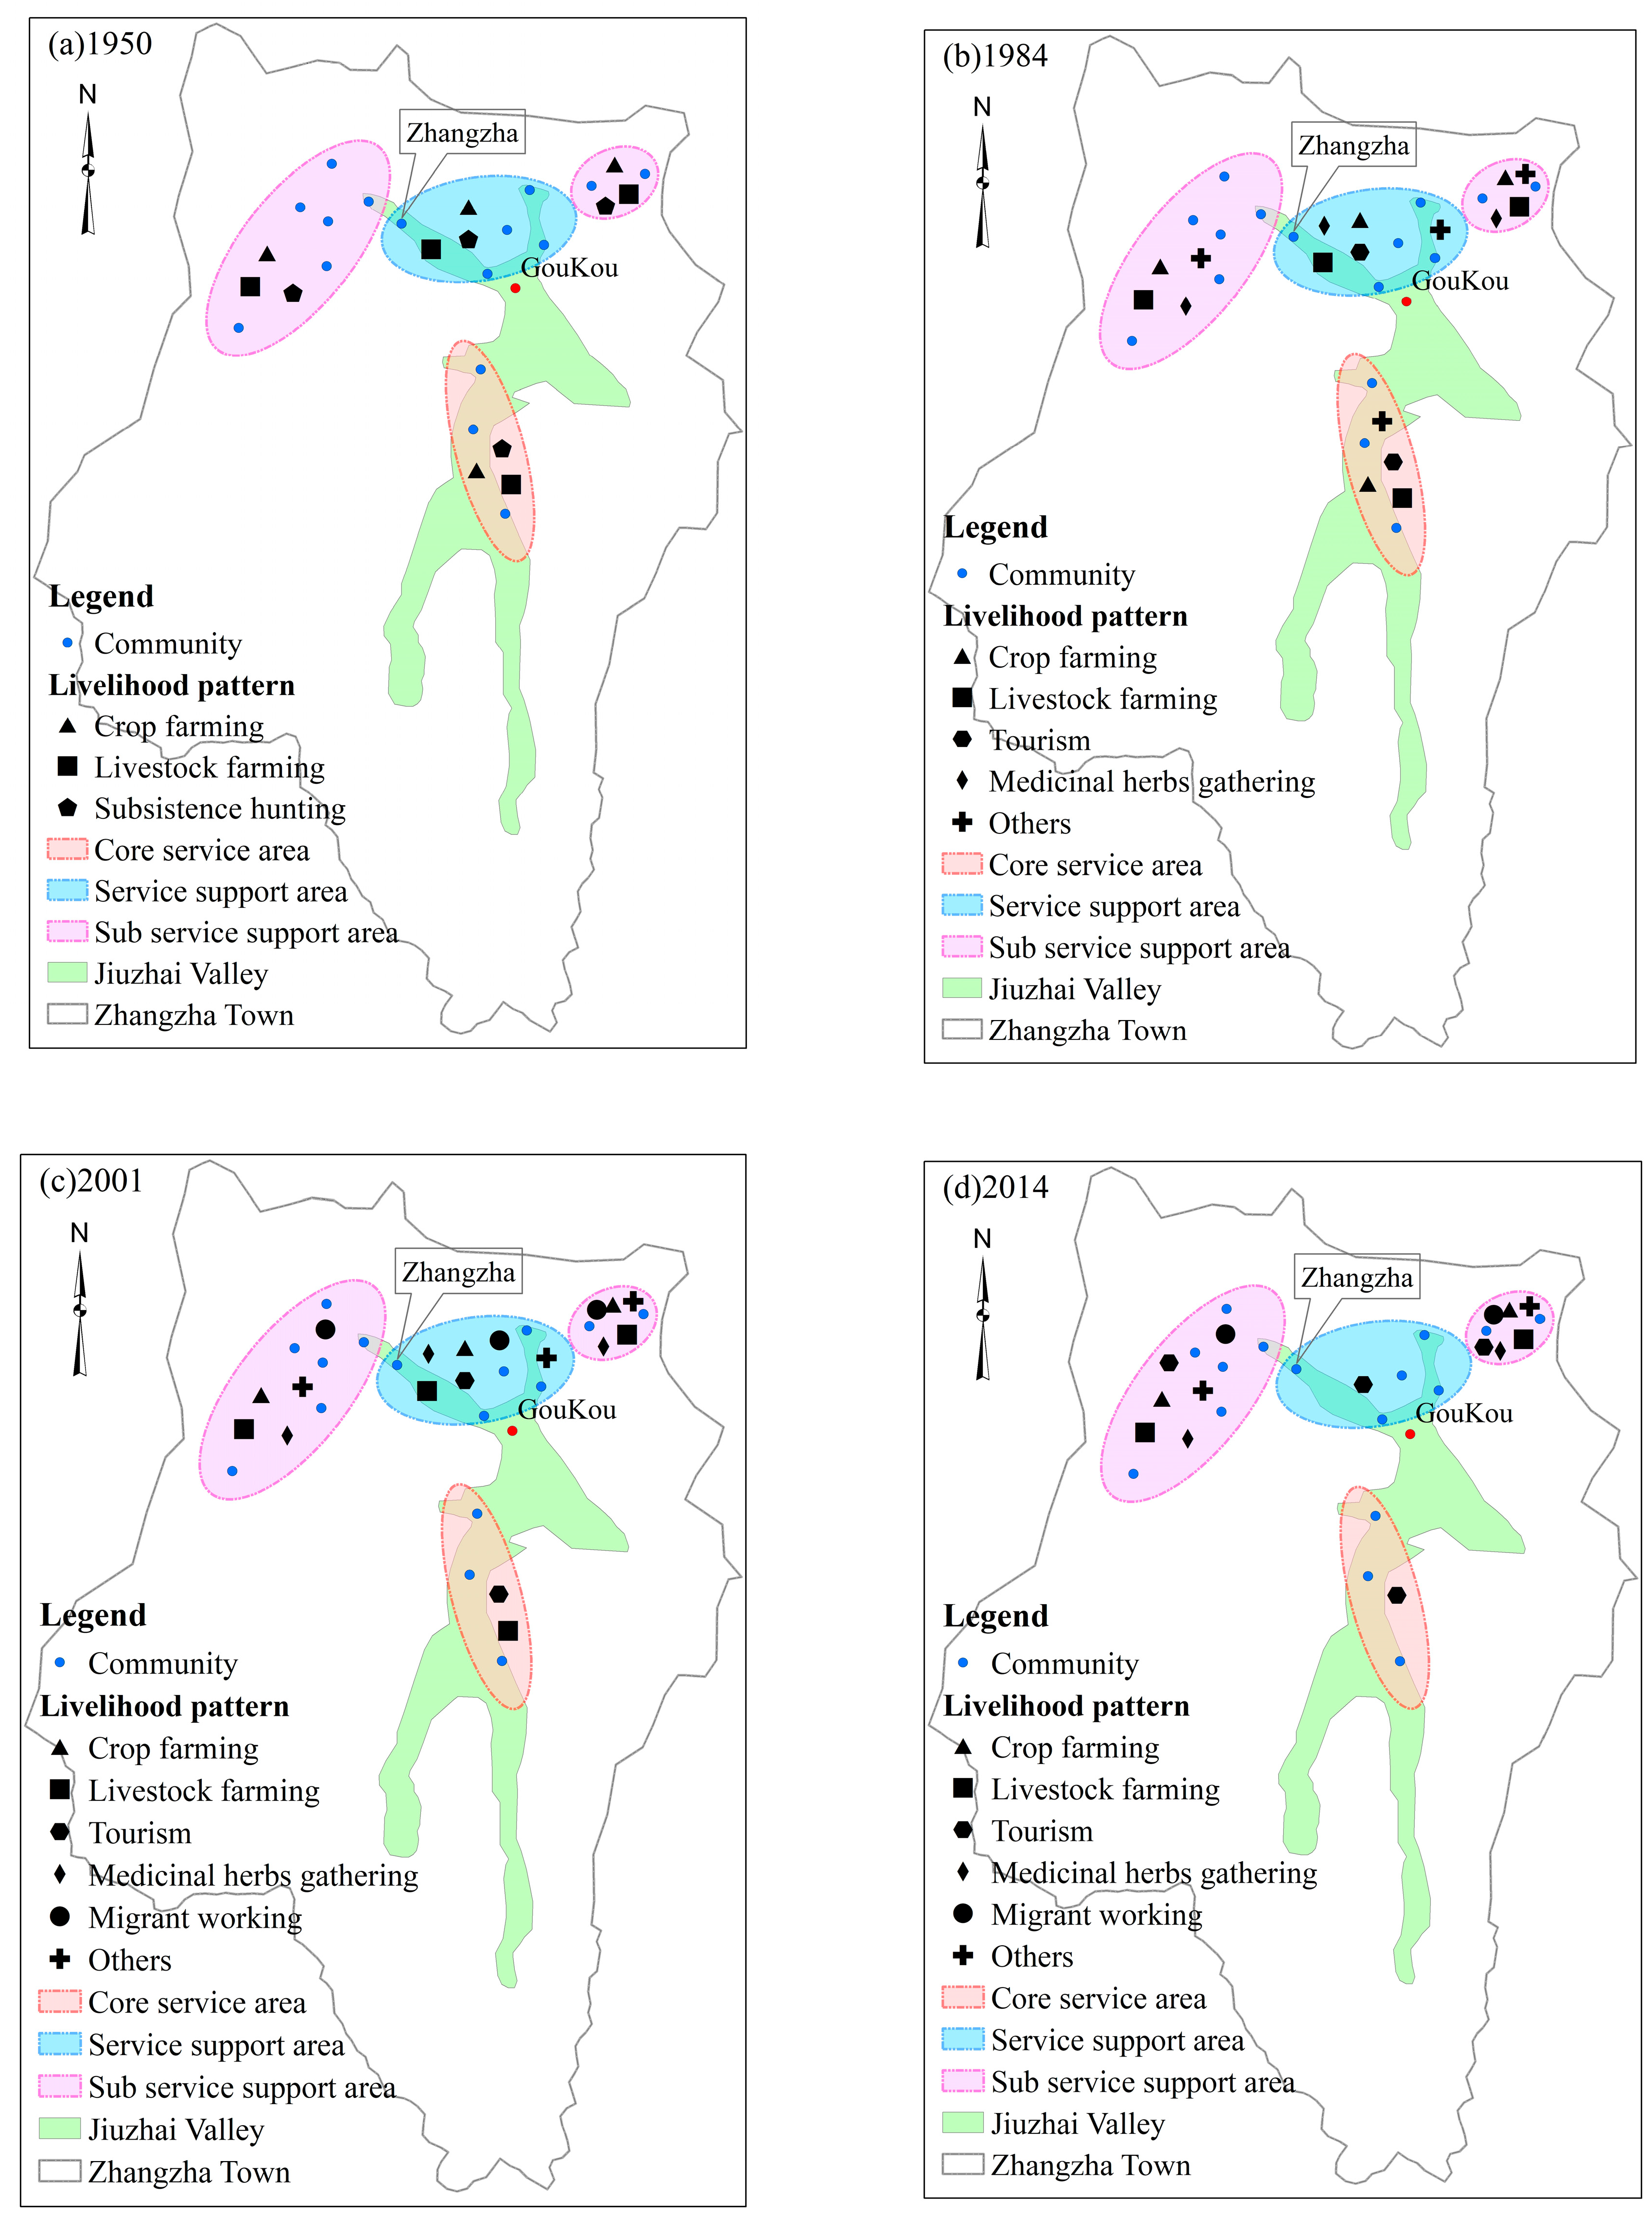
As shown in Table 1. In eight communities, i.e., Shuzheng, Heye, Zezhawa, Zhangzha, Pengfeng, Longkang, Congya, and Yazha, 100% of the rural households had a dominant livelihood of tourism, whereas in other communities, e.g., Ganhaizi, Shangsizhai, Langzhai, Zhongcha, Yatun, Yongzhu, Shaba, and Erdaoqiao, 44.83–90% of the rural households had a dominant livelihood of tourism. The livelihoods of three communities (Shuzheng, Heye, and Zechawa, Address: Jiuzhai Valley National Park, Zhangzha Town, Jiuzhaigou County, Aba state, Sichuan, China) were primarily renting costumes and taking photos for tourists, working in administration offices, secondary distribution, and selling souvenirs. Those of the neighboring communities (Zhangzha, Pengfeng, Longkang, Congya and Yazha, Address: Zhangzha Town, Jiuzhaigou County, Aba state, Sichuan, China) were primarily running tourism enterprises and hotels, whereas those of Ganhaizi, Shangsizhai, Zhongcha, Langzhai, Yatun, Yongzhu, Shaba, and Erdaoqiao (Address: Zhangzha Town, Jiuzhaigou County, Aba state, Sichuan, China) were rather diverse, but temporary tourism employment was a major livelihood common to all. Based on the above analyses and Figure 2, the 16 communities were divided into three areas: (1) core attraction areas, of which the samples included 65 rural households from Shuzheng, Zezhawa, and Heye communities in Jiuzhaigou; (2) service support areas, of which the samples included 75 rural households from Pengfeng, Longkang, Zhangzha, Congya, and Yazha of Zhangzha Township; and (3) secondary service support areas, of which the samples included 116 rural households from Ganhaizi, Shangsizhai, Zhongcha, Langzhai, Yatun, Yongzhu, Shaba and Erdaoqiao of Zhangzha Township; the entire area included 256 sample rural households. Overall, the community tourism development level and livelihood type in Jiuzhaigou exhibited noticeable spatial differences and a high degree of spatial aggregation.
Shen et al. argued that tourism livelihoods should include tourism-related livelihoods and non-tourism-related livelihoods [80]. Accordingly, the tourism livelihoods in this study included all the livelihood activities of community residents in the region.
5.2. Households Income
Table 2 shows that the income difference of Jiuzhaigou community residents was rather remarkable, and the average incomes of the core attraction area, the service support area, and the secondary service support area were 0.1213, 0.3255, and 0.0592, respectively. Therefore, the income of the service support area was 2.7 times that of the core attraction area and 5.5 times that of the secondary service support area, indicating that the service support area was a high-income area, the core attraction area was a mid-income area, and the secondary service support area was a low-income area.
5.3. Households Assets
The results showed that the total values of livelihood assets in the entire region, the core attraction area, the service support area, and the secondary service support area were 1.5607, 2.1481, 1.4959, and 1.2735 (Table 2), respectively. In terms of the distribution of each type of livelihood asset, the means of the human assets, policy assets, and community assets of the core attraction area were the highest, but the means of the natural assets and physical assets were the lowest. The means of the physical assets, social assets, financial assets, and psychological assets of the service support area were the highest; in particular, the value of physical assets was significantly higher than that of the core area or the secondary service support area. The mean of natural assets in the secondary service support area was the highest, but the means of human assets, social assets, financial assets, psychological assets, policy assets, and community assets were the lowest. The above comparisons indicate that the average values of livelihood assets of the core attraction area and service support area with an earlier tourism development had their own advantages, whereas the average value of livelihood assets in the secondary service support area with fledging tourism development showed no advantages, indicating that tourism development helped increase livelihood assets.
5.4. Results of the Regression Analysis
To avoid the phenomenon of multicollinearity among the indicators, we adopted the stepwise regression method in which the significance level was set at 0.05%. Table 3 shows that the R values of the four models were 0.681, 0.597, 0.656, and 0.812 and the R2 values were 0.464, 0.456, 0.430, and 0.660, respectively, indicating that the models could explain 46.4%, 45.6%, 43.0%, and 43.0% of the variation, respectively; the F values of the models were 30.708, 11.274, 17.880, and 39.724, respectively, all passing the significance test, indicating that the models fitted well.
As shown in Table 4, in terms of the specific impact of livelihood assets on income, the model of the entire region used all 256 samples as research subjects, and seven variables, i.e., natural assets, human assets, physical assets, social assets, financial assets, psychological assets, and policy assets, were retained in the model; their impacting coefficients on income were −0.2434, 0.5398, 0.7790, 0.2150, 0.1056, 0.2926, and −0.0527, respectively. The results showed that human assets, physical assets, social assets, financial assets, and psychological assets had a significant positive impact on the income of rural households in the region, whereas natural assets and policy assets had a significant negative impact.
The core attraction area model used 65 samples as the subjects, and three variables, i.e., physical assets, human assets, and psychological assets, remained in the model; their impacting coefficients on income were 2.02440, 0.1302, and 0.1299, respectively, exerting a significant positive impact on the income of rural households in the core attraction area.
The service support area model used 75 samples as the subjects, and three variables, i.e., human assets, psychological assets, and social assets, remained in the model; their impacting coefficients on income were 0.6982, 0.7421, and 0.4998, respectively, exerting a significant positive impact on the income of rural households in the service support area.
The secondary service support area model used 116 samples as the subjects, and three variables, i.e., human assets, physical assets, and psychological assets, remained in the model; their impacting coefficients on income were 0.5306, 0.1413, and 0.0792, respectively, exerting a significant positive impact on the income of rural households in the secondary service support area.
6. Discussion
In this study, we divided the communities in Jiuzhaigou into three sub-areas, i.e., core attraction areas, service support areas, and secondary service support areas, based on the spatial and geographic characteristics, income levels, and livelihood types of the communities. We constructed four regression models with seven variables, i.e., seven types of livelihood assets, to examine their effects on the rural household income of the samples from the entire area or each of the sub-areas. The results showed that livelihood assets had a significant impact on the community income in tourist areas, which is consistent with the findings in previous non-tourism livelihood asset-related studies [45,48,52,61,62,63,64,65] and also confirms Truong’s view that “the lack of livelihood capital is an important reason for limited resident income from tourism” [42].
Human assets had a significant impact on the incomes of rural households in the entire area, the core attraction area, the service support area, and the secondary service support area, affirming that human resources are at the core of sustainable livelihoods [6,28,45,81]. The core attraction area and service support area displayed an earlier tourism development, the community residents have received a good education and training in professional skills, and the quality of human assets is the key factor affecting income. The secondary service support area was relatively late in tourism development, with a lower education level, and the number of laborers was a key factor affecting rural household income.
Physical assets remained in the models of the entire area, the core attraction area, and the secondary service area support, and showed a significant positive impact on rural household income [61,62]. In Jiuzhaigou communities with tourism as their main livelihoods, physical assets were the basis for rural households to engage in tourism because many livelihood activities require corresponding physical assets. For example, to operate family hotels or tibetan peasant-household tourism and to earn an income from renting houses, a certain housing area is required; likewise, tourism transport requires buses and cars. Because of the policy restrictions on farmers in the core attraction area, the farmers are not allowed to expand their physical assets, so those with a large area of residential housing at a good location can reap a high income. The secondary service support area was relatively late in tourism development and also low in physical assets; however, the rural households that were among the first in tourism development had higher livelihood assets and thus a higher income. Physical assets were absent from the service support area model, not because they did not contribute to the rural household income but because farmers had completed the construction of tourism infrastructure and the housing-based physical assets fully met the needs of tourism development while the difference in physical assets among the rural households was small. Therefore, the increase in physical assets was unable to effectively increase income.
Social assets remained in the models of the entire area and the service support area, exerting a significant impact on farmer income in both cases, which is consistent with the results of most previous studies [45,61,62,65,68,81,82,83]. However, social assets had no significant impact on the income of residents in the core attraction area and secondary service support area, which is in line with the view of Myroniuk that “social assets do not necessarily affect income” [65]. Social assets remained in the service support area model because the rural households that engaged in the tourism industry earlier had extensive connections in the industry, and the household value of social assets was higher. However, those who entered the tourism industry later possessed less connections in the industry, and the household value of social assets was lower, as a respondent said in an interview: “We used to be herding and moved from the deep mountain not long ago. We built the house but did not know how to do business, while having no connections to travel agencies. Other people have been working in the tourism industry for quite a long time and have stable social constructions. They have long-term cooperation with travel agencies, and when they run a family hotel, stable booking of customers is guaranteed”. Social assets determine how farmers use their physical assets: households with high social assets run their own tourism businesses and earn a higher income, whereas those with low social assets only rent their houses out and receive a lower income. The core attraction area had high social assets, and the social assets primarily played a role in employment in Jiuzhaigou administration bureau and tourism enterprises, with only a low livelihood income. In other livelihoods such as selling souvenirs, garment renting and photo taking, social assets did not play an effective role. The administrative authority prohibits farmers from operating some tourism enterprises such as family lodging services within the core attraction area, so similarly, social capital could not play a role. In the secondary service support area, livelihoods were largely labor-based, and rural households entered the tourism industry rather late and thus had few and evenly distributed social assets. Consequently, their social assets were unable to effectively play a role in helping the rural households increase their income in labor-based livelihoods.
Financial assets only remained in the model of the entire area, in which they exerted a significant impact on the incomes of rural households, i.e., rural households can increase their income by increasing financial assets [45,68,84,85]. Financial assets had an insignificant impact on the household income of the farmers in the sub-areas. The major revenue of the core attraction area is from the secondary distribution and the employment in Jiuzhaigou administration bureau, the investment of financial assets would not necessarily be involved in the early stages, selling souvenirs, garment renting and photo taking required the input of financial assets. As the operation scale stabilized, a greater input of financial assets became unnecessary because even with the input of more financial assets, income would not increase. In the early stages of tourism development, the input of financial assets in the service support area increased communities’ physical assets, but the existing physical assets already met the needs of tourism development, and investments in financial assets were no longer necessary; thus, the effect of financial assets on increasing the rural household income diminished. The secondary service support area was still in the initial stage of tourism development, and in relation to the core attraction area and service support area, it had lower financial assets. However, the Jiuzhaigou county government provided special loans for rural households to encourage them to be involved in tourism development, although the labor-based livelihoods in this area had a low demand for financial assets.
Psychological assets were retained in all four models. They had a significant positive impact on the income of all rural households, which is consistent with the conclusion of a previous study [40] and indicates that in tourism communities, psychological assets are important livelihood assets, and households with high psychological assets will have a greater income. In this regard, a respondent told us in an interview: “We graduated from the ‘yak university’ and are poorly educated. We are afraid that we will lose money by doing business, so we dare not run a family hotel by ourselves and have to rent the house to others. Although it does generate some income, it is much less than that earned by operating the hotel by ourselves”. Therefore, the locals who had just abandoned animal husbandry and switched to tourism development were having difficulties with new livelihoods. They were both ambitious and worrisome, lacked confidence, and feared business failure; moreover, some farmers did not dare start a business and resorted to livelihoods such as temporary employment in the tourism industry, with a low income. Consequently, psychological assets exerted a significant impact on rural households’ livelihood choice and physical asset utilization, thus affecting the income of rural households.
Policy assets were retained only in the model of the entire area and exerted a significant negative impact on income. There are two reasons for this finding: first, policy has restricted the choice of livelihood in the core attraction area, and the higher the policy assets are, the lower the rural households’ income. Second, in the service support area and secondary service support area, the Jiuzhaigou County government has provided plenty of support policies to encourage low-income households to be involved in tourism development, but in the early stages of tourism development, the effect of policy assets has not yet been realized, and the incomes of rural households remain low. Given the above two reasons, in the model of the entire area, policy assets exhibited a significant negative impact on the incomes of rural households, which was not present in the other sub-area models.
In summary, in the sub-area samples, only human assets and psychological assets, two types of livelihood assets reflecting the characteristics of the rural households themselves, exerted a significant positive impact on the income of rural households of all types, which confirms that human resources are the core of sustainable livelihoods [28]. By increasing human assets, rural household incomes can be effectively increased. Physical assets had a significant positive impact on the income of mid- and low-income rural households but an insignificant impact on that of high-income rural households, whereas social assets had a significant positive impact on that of high-income rural households but an insignificant impact on the income of mid- and low-income rural households. Policy assets and financial assets did not remain in the models; thus, they exerted no significant impact on the incomes of rural households. Furthermore, in terms of spatial distribution, in the peripheral areas, the rural households choose labor-based livelihoods with low risk such as temporary employment in tourism development when they lack human assets and psychological assets. Once they accumulate certain financial assets and policy assets, they add physical assets, but as physical assets increase to a certain amount, the utilities of financial assets and policy assets diminish while social assets, human assets, and psychological assets play an important role and help the rural households choose various types of livelihoods, causing income variation among rural households.
7. Conclusion and Research Forecast
7.1. Conclusions
Tourism development increases the livelihood assets of tourism destinations, and livelihood assets can play both promoting and restricting roles: a certain type of livelihood asset may limit a farmer in choosing a livelihood and the effective use of other types of livelihood assets. In the core attraction area, policy assets restricted farmers to run tourism businesses and rental houses; consequently, social assets and financial assets were unable to be utilized. In the service support area, the deficiencies in the rural households’ human assets, psychological assets, and social assets caused the ineffective use of physical assets, so the rural households chose low-risk livelihoods such as rental houses. In the secondary service support area, rural households’ inadequacies in human assets, psychological assets, and physical assets made them choose labor-based livelihoods, in which case even with the loans provided by the government, they could not make good use of the financial assets and would not choose livelihoods with a higher income such as running a tourism business.
7.2. Deficiencies in the Study
7.2.1. Variables Are Sum of the Various Livelihood Assets, It Is Not Clear Enough to Conclude the Factors That Influence Income
This study takes the sum of various living assets as variables based on previous studies, or the specific indicators in each livelihood asset as variables into calculation, in order to avoid multiple collinearity Variables are taken from the sum of various living assets. Although meaningful research results are obtained, it is more advantageous to put forward reasonable practical suggestions by using specific indexes as variables to find out more accurate factors that affect income.
7.2.2. Lack of Cultural Assets in Variables
In the study of Stone and Nancy, cultural assets are variables that influence the livelihood choice of the community tourism, but the livelihood asset is not regarded as a variable in this study, which fails to reflect the influence of cultural assets, especially the influence of ethnic cultural assets to the income of community residents in Jiuzhaigou ethnic areas.
7.3. Research Forecast
7.3.1. Study on the Interaction Mechanism between Living Assets
This study found that some kinds of livelihood assets will affect the use of other livelihood assets and effective utilization. At present, there is not much research on this issue the study of the mutual impact of livelihood assets in the future research would be a meaningful field, such as farmers labor assets and how psychological assets and social assets affect the use of material assets and effective utilization.
7.3.2. The Influence of Dynamic Studies of Various Livelihood Assets on the Different Livelihood Choices
At present, there are abundant literatures on studies on the influence of livelihood choices upon livelihood assets, but all are based on static research. This study found that the different livelihood assets and their quantity have different contribution to farmers’ livelihood choices in different stages of tourism development in the Jiuzhaigou community. Therefore, future research could apply the data from long time duration to study the dynamic change of farmers’ livelihood and the role of livelihood selection; it is of great practical significance for helping communities to achieve sustainable livelihood development.
8. Managerial Implications
In the community management of tourist destinations or nature reserves, there are many studies which indicate that increased community social assets [86] raise community income [87,88] and improve community human assets [87] are powerful measures to realize the collaborative development of community livelihood, sports tourism [87] and ecological protection [86,88]. Based on the above findings, in future community management of tourist destinations, we recommend strengthening training of the farmers in the core attraction area and the secondary service support area regarding professional skills of tourism so that they can improve tourism quality and perform jobs that generate a higher income. Tourism business operation training for farmers in the service support area should also be strengthened so that the farmers can improve their self-confidence and utilize physical assets more effectively to maximize the utilities of those physical assets. The physical assets in the core attraction area and the secondary service support area can also be further increased; for example, by negotiation, the government of Jiuzhaigou County and the Jiuzhaigou Administration Bureau can adopt more flexible measures to attract farmers to build houses outside the Jiuzhaigou scenic area through fund-raising to increase the farmers’ physical assets so that the farmers can have a livelihood with a higher income such as operating tourism enterprises through shareholding. By seizing the opportunities in the new rural construction and whole-area tourism development, the government of Jiuzhaigou County should increase investment in projects in the secondary service support area to assist farmers in this area to build new houses on their original homestead land to increase physical assets. Therefore, the government should increase efforts in issuing loans to farmers to add financial assets to the secondary service support area.
Acknowledgments
The authors thank the financial supports of the National Natural Science Foundation of China: 41171121, National Natural Science Foundation of China: 41571136, Humanity and Social Science Youth foundation of Ministry of Education: 13YJC790193. JiuZhaiGou Administration Bureau made enormous contributions to our investigation and survey work, which is greatly appreciated. Thanks are due to Honglei Zhang, Associate Professor of Department of Land Resources and Tourism Sciences, Nanjing University, for his constant support and encouragement, and technical advices in the process of writing this paper. Yi Zhou, Associate Professor of School of Geography, Shanxi Normal University, is also appreciated for his five accurately-and-elaborately-made maps. Last but not least, the authors express tremendous thanks to the constructive suggestions and comments on the manuscript from the reviewers and editors.
Author Contributions
Jinhai Ma and Jie Zhang conceived and designed this study, Jinhai Ma, Li Li, Zhanjing Zeng, Jingrong Sun, Qilou (Bill) Zhou, Yuling Zhang participated in the field survey; Jinhai Ma and Li Li analyzed the data and wrote the manuscript, Jie Zhang revised the manuscript. All authors read and approved the manuscript.
Conflicts of Interest
The authors declare no conflict of interest.
Appendix A. Explanatory Variable Definition

Table A1.
Livelihood capital indicators and their valuation methods.
| Primary Indicator | Secondary Indicator | Valuation | Variable Nature |
|---|---|---|---|
| Natural assets (NA) | Cultivated land area (mu) | Actual household farming area (mu) | Continuous |
| Human assets (HU) | Number of persons who contribute to household income | Number of persons in the household who have an income through participating in labor or other means | Continuous |
| Overall household labor capability | Non-laborer (children aged 0–6; seniors aged over 64; students): 0; House making: 0.5; Laborer aged over 64: 0.5; Adult laborer: 1. | Virtual | |
| Laborer education | Average years of education of laborer (years) | Continuous | |
| Laborer health level | Healthy = 1; Acceptable = 0.5; Having a major illness = 0 | Virtual | |
| Laborer language skills | Whether the laborer speaks the following languages: Tibetan: yes = 1, no = 0; Mandarin: yes = 1, no = 0; Sichuan dialect: yes = 1, no = 0; English: yes = 1, no = 0. | Virtual | |
| Whether the laborer has studied a tourism-related major | Yes = 1, no = 0 | Virtual | |
| How long the household has been working in the tourism industry | Duration of the household engaging in the tourism industry | Continuous | |
| Training opportunities in tourism profession | Yes = 1, no = 0 | Virtual | |
| Number of employees hired | Number of non-family members employed by the household | Continuous | |
| Physical assets (PH) | Housing area | Residential area of the household | Continuous |
| Rental housing area | Housing area to rental operators by the household | Continuous | |
| Self-employed housing area | Household home-run tourism rental area | Continuous | |
| Durable goods quantity | Quantity of durable goods in the household | Continuous | |
| Transportation | Type and number of home-owned vehicles Pick-up truck = 1, bus = 1, sedan = 0.75, tractor = 0.5, motorcycle = 0.25 | Virtual | |
| Internet | Yes = 1, no = 0 | Virtual | |
| Cable TV | Yes = 1, no = 0 | Virtual | |
| Cattle | Number of household-owned large livestock | Continuous | |
| Horse | Number of household-owned horses | Continuous | |
| Social capital (SC) | Number of relatives and friends engaged in tourism | Continuous | |
| Number of relatives and friends who work in the Jiuzhaigou Administration Bureau | Continuous | ||
| Number of relatives and friends who work in government agencies | Continuous | ||
| Opportunities in receiving help from relatives and friends | Many = 5, moderate = 4, acceptable = 3, limited = 2, rarely = 1 | Virtual | |
| Participation in community activities | Often = 5, moderate = 4, acceptable = 3, rarely = 2, never = 0 | Virtual | |
| Financial assets (FA) | Opportunities to obtain loans | Yes = 1, no = 0 | Virtual |
| Opportunities to borrow money from relatives and friends | Yes = 1, no = 0 | Virtual | |
| Opportunities to obtain government funding | Yes = 1, no = 0 | Virtual | |
| Whether there is external funding | Yes = 1, no = 0 | Virtual | |
| Whether there are family savings | Yes = 1, no = 0 | Virtual | |
| Psychological assets (PY) | Life improvement expectations index | Very low = 1; low = 2; acceptable = 3; high = 4; very high = 5 | Virtual |
| Self-confidence index | Very low = 1; low = 2; acceptable = 3; high = 4; very high = 5 | Virtual | |
| Tenacity index | Very low = 1; low = 2; acceptable = 3; high = 4; very high = 5 | Virtual | |
| Well-being index | Very low = 1; low = 2; acceptable = 3; high = 4; very high = 5 | Virtual | |
| Self-initiative index | Very low = 1; low = 2; acceptable = 3; high = 4; very high = 5 | Virtual | |
| Policy assets (PO) | Tourism development support policies | Yes = 1, no = 0 | Virtual |
References
- Towner, N.; Orams, M. Perceptions of surfing tourism operators regarding sustainable tourism development in the Mentawai Islands, Indonesia. Asia Pac. J. Tour. Res. 2016, 21, 1258–1273. [Google Scholar] [CrossRef]
- Cassar, S.; Creaco, S. Towards Tourism Sustainability: General Aspects and Empirical Evidence of the Italian Experience at Decentralized Level, with Specific Reference to Sicily. Balt. J. Eur. Stud. 2016, 6, 95–138. [Google Scholar] [CrossRef]
- Mbaiwa, J.E.; Stronza, A.L. The effects of tourism development on rural livelihoods in the Okavango Delta, Botswana. J. Sustain. Tour. 2010, 18, 635–656. [Google Scholar] [CrossRef]
- Ven, S. Residents’ Participation, Perceived Impacts, and Support for Community-based Ecotourism in Cambodia: A Latent Profile Analysis. Asia Pac. J. Tour. Res. 2016, 21, 836–861. [Google Scholar] [CrossRef]
- D’Hauteserre, A.M. Ecotourism an option in small island destinations? Tour. Hosp. Res. 2016, 16, 72–87. [Google Scholar] [CrossRef]
- Duffy, L.N.; Stone, G.; Chancellor, H.C.; Kline, C.S. Tourism development in the Dominican Republic: An examination of the economic impact to coastal households. Tour. Hosp. Res. 2016, 16, 35–49. [Google Scholar] [CrossRef]
- Keyim, P. Tourism and rural development in western China: A case from Turpan. Commun. Dev. J. 2016, 51, 534–551. [Google Scholar] [CrossRef]
- Job, H.; Paesler, F. Links between nature-based tourism, protected areas, poverty alleviation and crises—The example of Wasini Island (Kenya). J. Outdoor Recreat. Tour. 2013, 1, 18–28. [Google Scholar] [CrossRef]
- Lapeyre, R. The Grootberg lodge partnership in Namibia: Towards poverty alleviation and empowerment for long-term sustainability? Cur. Issues Tour. 2011, 14, 221–234. [Google Scholar] [CrossRef]
- Manwa, H.; Manwa, F. Poverty Alleviation through Pro-Poor Tourism: The Role of Botswana Forest Reserves. Sustainability 2014, 6, 5697–5713. [Google Scholar] [CrossRef]
- Li, W. Community decision making participation in development. Ann. Tour. Res. 2006, 33, 132–143. [Google Scholar] [CrossRef]
- Su, M.M.; Wall, G.; Xu, K.J. Heritage tourism and livelihood sustainability of a resettled rural community: Mount Sanqingshan World Heritage Site, China. J. Sustain. Tour. 2016, 24, 735–757. [Google Scholar] [CrossRef]
- Nyaupane, G.P.; Poudel, S. Linkages among Biodiversity, Livelihood, and Tourism. Ann. Tour. Res. 2011, 38, 1344–1366. [Google Scholar] [CrossRef]
- Sebele, L.S. Community-based tourism ventures, benefits and challenges: Khama Rhino Sanctuary Trust, Central District, Botswana. Tour. Manag. 2010, 31, 136–146. [Google Scholar] [CrossRef]
- Caroline, A. Applying Livelihood Approaches to Natural Resource Management Initiatives: Experiences in Namibia and Kenya; ODI Working Paper 134; Overseas Development Institute: London, UK, 2000. [Google Scholar]
- Cathryn, T. Sustainable Livelihoods and Project Design in India; ODI Working Paper 127; Overseas Development Institute: London, UK, 2000. [Google Scholar]
- Kishore, S.; Vasanti, G. Tourism, the Poor and Other Stakeholders: Experience in Asia; Overseas Development Institute—Fair Trade in Tourism Paper; Overseas Development Institute: London, UK, 2000. [Google Scholar]
- Warner, M. Conflict Management in Community-Based Natural Resource Projects: Experiences from Fiji and Papua New Guinea; ODI Working Paper 135; Overseas Development Institute: London, UK, 2000. [Google Scholar]
- Ming, M.; Wall, G.; Jin, M. Island livelihoods: Tourism and fishing at Long Islands, Shandong Province, China. Ocean Coast. Manag. 2016, 122, 20–29. [Google Scholar]
- Bennetta, N.; Lemelinb, R.H.; Kosterb, R.; Budkec, I. A capital assets framework for appraising and building capacity for tourism development in aboriginal protected area gateway communities. Tour. Manag. 2012, 33, 752–766. [Google Scholar] [CrossRef]
- Gascon, J. Pro-Poor Tourism as a Strategy to Fight Rural Poverty: A Critique. J. Agrar. Chang. 2015, 15, 499–518. [Google Scholar] [CrossRef]
- Taylor, S.R. Issues in measuring success in community-based Indigenous tourism: Elites, kin groups, social capital, gender dynamics and income flows. J. Sustain. Tour. 2017, 25, 433–449. [Google Scholar] [CrossRef]
- D’Hauteserre, A.M. Government Policies and Indigenous Tourism in New Caledonia. Asia Pac. J. Tour. Res. 2010, 15, 285–303. [Google Scholar] [CrossRef]
- Mazibuko, S.G. Development and Pro-Poor Tourism: The Livelihood Strategies of Amazizi in Northern Drakensberg, Kwazulu-Natal. Ph.D. Thesis, Centre for Development Support, University of the Free State, Bloemfontein, South Africa, 2010. [Google Scholar]
- Li, Y.J.; Turner, S.; Cui, H.Y. Confrontations and concessions: An everyday politics of tourism in three ethnic minority villages, Guizhou Province, China. J. Tour. Cult. Chang. 2016, 14, 45–61. [Google Scholar] [CrossRef]
- Su, M.M.; Wall, G.; Xu, K.J. Tourism-Induced Livelihood Changes at Mount Sanqingshan World Heritage Site, China. Environ. Manag. 2016, 57, 1024–1040. [Google Scholar] [CrossRef] [PubMed]
- Scoones, I. Sustainable Rural Livelihoods a Framework for Analysis; IDS Working Paper 72; Overseas Development Institute: London, UK, 1998. [Google Scholar]
- Chambers, R.; Conway, G. Sustainable Rural Livelihoods Practical Concepts for the 21st Century; IDS Discussion Paper 296; Overseas Development Institute: London, UK, 1991. [Google Scholar]
- Caroline, A. Tourism, communities and national policy: Namibia’s Experience. Dev. Policy Rev. 1998, 16, 323–352. [Google Scholar]
- Ellis, F. Household strategies and rural livelihood diversification. J. Dev. Stud. 1998, 35, 1–38. [Google Scholar] [CrossRef]
- Simpson, M.C. An integrated approach to assess the impacts of tourism on community development and sustainable livelihoods. Commun. Dev. J. 2007, 44, 186–208. [Google Scholar] [CrossRef]
- Novelli, M.; Gebhardt, K. Community Based Tourism in Namibia: ‘Reality Show’ or ‘Window Dressing’? Curr. Issues Tour. 2007, 10, 443–479. [Google Scholar] [CrossRef]
- Li, Y.J.; Yu, H.; Chen, T.; Hu, J.; Cui, H.Y. Livelihood changes and evolution of upland ethnic communities driven by tourism: A case study in Guizhou Province, southwest China. J. Mt. Sci. 2016, 13, 1313–1332. [Google Scholar] [CrossRef]
- Wu, M.Y.; Pearce, P.L. Host tourism aspirations as a point of departure for the sustainable livelihoods approach. J. Sustain. Tour. 2014, 22, 440–460. [Google Scholar] [CrossRef]
- Walelign, S.Z.; Pouliot, M.; Larsen, H.O.; Smith-Hall, C. Combining Household Income and Asset Data to Identify Livelihood Strategies and Their Dynamics. J. Dev. Stud. 2017, 53, 769–787. [Google Scholar] [CrossRef]
- Fang, Y.P.; Qin, D.H.; Ding, Y.J.; Yang, J.P.; Xu, K.Y. The impacts of permafrost change on NPP and implications: A case of the source regions of Yangtze and Yellow Rivers. J. Mt. Sci. 2011, 8, 437–447. [Google Scholar] [CrossRef]
- Fang, Y.P. The effects of natural capital protection on pastoralist’s livelihood and management implication in the source region of the Yellow River, China. J. Mt. Sci. 2013, 10, 885–897. [Google Scholar] [CrossRef]
- Fang, Y.P.; Fan, J.; Shen, M.Y.; Song, M.Q. Sensitivity of livelihood strategy to livelihood capital in mountain areas: Empirical analysis based on different settlements in the upper reaches of the Minjiang River, China. Ecol. Indic. 2014, 38, 225–235. [Google Scholar] [CrossRef]
- Han, G.; Fang, W.T.; Huang, Y.W. Classification and Influential Factors in the Perceived Tourism Impacts of Community Residents on Nature-based Destinations: China’s Tiantangzhai Scenic Area. Procedia Environ. Sci. 2011, 10, 2010–2015. [Google Scholar] [CrossRef]
- Li, G.; Fang, C.; Qiu, D.; Wang, L. Impact of farmer households’ livelihood assets on their options of economic compensation patterns for cultivated land protection. J. Geogr. Sci. 2014, 24, 331–348. [Google Scholar] [CrossRef]
- Peng, W.J.; Zheng, H.; Robinson, B.E.; Li, C.; Wang, F.C. Household Livelihood Strategy Choices, Impact Factors, and Environmental Consequences in Miyun Reservoir Watershed, China. Sustainability 2017, 9, 175. [Google Scholar] [CrossRef]
- Truong, V.D.; Hall, C.M.; Garry, T. Tourism and poverty alleviation: Perceptions and experiences of poor people in Sapa, Vietnam. J. Sustain. Tour. 2014, 22, 1071–1089. [Google Scholar] [CrossRef]
- Anthony, B. Capitals and Capabilities: A Framework for Analyzing Peasant Viability, Rural Livelihoods and Poverty. World Dev. 1999, 27, 2021–2044. [Google Scholar]
- Daskon, C.; McGregor, A. Cultural Capital and Sustainable Livelihoods in Sri Lanka’s Rural Villages: Towards Culturally Aware Development. J. Dev. Stud. 2012, 48, 549–563. [Google Scholar] [CrossRef]
- Perz, S.G.L. The importance of household asset diversity for livelihood diversity and welfare among small farm colonists in the Amazon. J. Dev. Stud. 2005, 41, 1193–1220. [Google Scholar] [CrossRef]
- Groenewald, S.F.; Bulte, E. Trust and livelihood adaptation: Evidence from rural Mexico. Agric. Hum. Values 2012, 30, 41–55. [Google Scholar] [CrossRef]
- Goulden, M.C.; Adger, W.N.; Allison, E.H.; Conway, D. Limits to Resilience from Livelihood Diversification and Social Capital in Lake Social-Ecological Systems. Ann. Assoc. Am. Geogr. 2013, 103, 906–924. [Google Scholar] [CrossRef]
- Mitra, A. Social capital, livelihood and upward mobility. Habitat Int. 2008, 32, 261–269. [Google Scholar] [CrossRef]
- Hunter, L.M.; Nawrotzki, R.; Leyk, S.; Maclaurin, G.J.; Twine, W.; Collinson, M.; Erasmus, B. Rural Outmigration, Natural Capital, and Livelihoods in South Africa. Popul. Space Place 2014, 20, 402–420. [Google Scholar] [CrossRef] [PubMed]
- Hua, X.; Yan, J.; Zhang, Y. Evaluating the role of livelihood assets in suitable livelihood strategies: Protocol for anti-poverty policy in the Eastern Tibetan Plateau, China. Ecol. Indic. 2017, 78, 62–74. [Google Scholar] [CrossRef]
- Wang, F.; Yang, D.G.; Wang, C.J.; Zhang, X.H. The Effect of Payments for Ecosystem Services Programs on the Relationship of Livelihood Capital and Livelihood Strategy among Rural Communities in Northwestern China. Sustainability 2015, 7, 9628–9648. [Google Scholar] [CrossRef]
- Bakkegaard, R.K.; Nielsen, M.R.; Thorsen, B.J. Household determinants of bushmeat and eru (Gnetum africanum) harvesting for cash in the Democratic Republic of Congo. Environ. Dev. Sustain. 2017, 19, 1425–1443. [Google Scholar] [CrossRef]
- Baiyegunhi, L.J.S.; Oppong, B.B.; Senyolo, M.G. Socio-economic factors influencing mopane worm (Imbrasia belina) harvesting in Limpopo Province, South Africa. J. For. Res. 2016, 27, 443–452. [Google Scholar] [CrossRef]
- Vervisch, T.G.A.; Vlassenroot, K.; Braeckman, J. Livelihoods, power, and food insecurity: Adaptation of social capital portfolios in protracted crises-case study Burundi. Disasters 2013, 37, 267–292. [Google Scholar] [CrossRef] [PubMed]
- Steel, G. Local encounters with globetrotters Tourism’s potential for street vendors in Cusco, Peru. Ann. Tour. Res. 2012, 39, 601–619. [Google Scholar] [CrossRef]
- Razzaq, A.R.A.; Mohamad, N.H.; Kader, S.S.S.A.; Mustafad, M.Z.; Hadi, M.Y.; Hamzah, A.Z.; Khalifah, Z. Developing Human Capital for Rural Community Tourism: Using Experiential Learning Approach. Procedia Soc. Behav. Sci. 2013, 93, 1835–1839. [Google Scholar] [CrossRef]
- Chiutsi, S.; Saarinen, J. Local participation in transfrontier tourism: Case of Sengwe community in Great Limpopo Transfrontier Conservation Area, Zimbabwe. Dev. S. Afr. 2017, 34, 260–275. [Google Scholar] [CrossRef]
- Ezeuduji, I.O. Change management for sub-Saharan Africa’s rural tourism development. Curr. Issues Tour. 2017, 20, 946–959. [Google Scholar] [CrossRef]
- Peprah, P.; Kyiyaga, E.M.; Afful, H.; Abalo, E.M.; Agyemang-Duah, W. Does the Ghanaian livelihood empowerment against poverty programme lead to an increase in household productive livelihood assets? Analysing the Ashanti scenario. Cogent Soc. Sci. 2017. [Google Scholar] [CrossRef]
- Owuor, G.; Knerr, B.; Ochieng, J.; Wambua, T.; Magero, C. Community tourism and its role among agropastoralists in Laikipia County, Kenya. Tour. Econ. 2017, 23, 229–236. [Google Scholar] [CrossRef]
- Islam, G.M.N.; Yew, T.S.; Abdullah, N.M.R.; Viswanathan, K.K. Social capital, community based management, and fishers’ livelihood in Bangladesh. Ocean Coast. Manag. 2011, 54, 173–180. [Google Scholar] [CrossRef]
- Islam, G.M.N.; Yew, T.S.; Viswanathan, K.K. Poverty and livelihood impacts of community based fisheries management in Bangladesh. Ocean Coast. Manag. 2014, 96, 123–129. [Google Scholar] [CrossRef]
- Erenstein, O.; Hellin, J.; Chandna, P. Poverty mapping based on livelihood assets: A meso-level application in the Indo-Gangetic Plains, India. Appl. Geogr. 2010, 30, 112–125. [Google Scholar] [CrossRef]
- Erenstein, O. Livelihood Assets as a Multidimensional Inverse Proxy for Poverty: A District-level Analysis of the Indian Indo-Gangetic Plains. J. Hum. Dev. Capab. 2011, 12, 283–302. [Google Scholar] [CrossRef]
- Myroniuk, T.W.; Vearey, J. Social Capital and Livelihoods in Johannesburg: Differential Advantages and Unexpected Outcomes among Foreign-Born Migrants, Internal Migrants, and Long-Term South African Residents. Int. Migr. Rev. 2014, 48, 243–273. [Google Scholar] [CrossRef]
- Carter, M.R. Poverty, Livelihood and Class in Rural South Africa. World Dev. 1999, 27, 1–20. [Google Scholar] [CrossRef]
- Thrane, C. Earnings differentiation in the tourism industry: Gender, human capital and socio-demographic effects. Tour. Manag. 2008, 29, 514–524. [Google Scholar] [CrossRef]
- Saxena, G. Beyond Mistrust and Competition—The Role of Social and Personal Bonding Processes in Sustaining Livelihoods of Rural Tourism Businesses: A Case of the Peak District National Park. Int. J. Tour. Res. 2006, 8, 263–277. [Google Scholar] [CrossRef]
- Nepal, S.K. Sustainable tourism, protected areas and livelihood needs of local communities in developing countries. Int. J. Sustain. Dev. World Ecol. 1997, 4, 123–135. [Google Scholar] [CrossRef]
- Goodwin, H.; Roe, D. Tourism, livelihood and protected Areas: Opportunities for Fair-trade Tourism in and Around National Parks. Int. J. Tour. Res. 2001, 3, 377–391. [Google Scholar] [CrossRef]
- Sinha, B.C.; Qureshi, Q.; Uniyal, V.K.; Sen, S. Economics of wildlife tourism—Contribution to livelihoods of communities around Kanha tiger reserve, India. J. Ecotour. 2012, 11, 207–218. [Google Scholar] [CrossRef]
- Snyder, K.A.; Sulle, E.B. Tourism in Maasai communities: A chance to improve livelihoods? J. Sustain. Tour. 2011, 19, 935–951. [Google Scholar] [CrossRef]
- Shoo, R.A.; Songorwa, A.N. Contribution of eco-tourism to nature conservation and improvement of livelihoods around Amani nature reserve, Tanzania. J. Ecotour. 2013, 12, 75–89. [Google Scholar] [CrossRef]
- Kim, S.; Jamal, T. The co-evolution of rural tourism and sustainable rural development in Hongdong, Korea: Complexity, conflict and local response. J. Sustain. Tour. 2015, 23, 1363–1385. [Google Scholar] [CrossRef]
- Shannon, C.E. A Mathematical Theroy of Communication. Bell Syst. Tech. J. 1948, 27, 379–423. [Google Scholar] [CrossRef]
- Sun, C.Z.; Zhang, K.L.; Zou, W.; Li, B.; Qin, X.H. Assessment and Evolution of the Sustainable Development Ability of Human-Ocean Systems in Coastal Regions of China. Sustainability 2015, 7, 10399–10427. [Google Scholar] [CrossRef]
- Tjoe, Y. Measuring the livelihood vulnerability index of a dry region in Indonesia A case study of three subsistence communities in West Timor. World J. Sci. Technol. Sustain. Dev. 2016, 13, 250–274. [Google Scholar] [CrossRef]
- Wang, T.C.; Lee, H.D. Developing a fuzzy TOPSIS approach based on subjective weights and objective weights. Expert Syst. Appl. 2010, 37, 1085. [Google Scholar] [CrossRef]
- Xue, M.; Tang, X.A.; Feng, N.P. An Extended VIKOR Method for Multiple Attribute Decision Analysis with Bidimensional Dual Hesitant Fuzzy Information. Math. Probl. Eng. 2016. [Google Scholar] [CrossRef]
- Shen, F.; Hughey, K.F.D.; Simmons, D.G. Connecting the Sustainable Livelihoods Approach and Tourism: A Review of the Literature. J. Hosp. Tour. Manag. 2008, 15, 19–31. [Google Scholar] [CrossRef]
- Xu, D.D.; Zhang, J.F.; Rasul, G.; Liu, S.Q.; Xie, F.T.; Cao, M.T.; Liu, E.L. Household Livelihood Strategies and Dependence on Agriculture in the Mountainous Settlements in the Three Gorges Reservoir Area, China. Sustainability 2015, 7, 4850–4869. [Google Scholar] [CrossRef]
- Mendez-Lemus, Y.; Vieyra, A. How social capital enables or restricts the livelihoods of poor peri-urban farmers in Mexico. Dev. Pract. 2017, 27, 301–315. [Google Scholar] [CrossRef]
- Nguyen, H.T.; Pham, T.H.; de Bruyn, L.L. Impact of Hydroelectric Dam Development and Resettlement on the Natural and Social Capital of Rural Livelihoods in Bo Hon Village in Central Vietnam. Sustainability 2017, 9, 1422. [Google Scholar] [CrossRef]
- Du, B.Z.; Zhen, L.; Yan, H.M.; de Groot, R. Effects of Government Grassland Conservation Policy on Household Livelihoods and Dependence on Local Grasslands: Evidence from Inner Mongolia, China. Sustainability 2016, 8, 1314. [Google Scholar] [CrossRef]
- N’Danikou, S.; Vodouhe, R.S.; Bellon, M.R.; Sidibe, A.; Coulibaly, H. Foraging Is Determinant to Improve Smallholders’ Food Security in Rural Areas in Mali, West Africa. Sustainability 2017, 9, 2074. [Google Scholar] [CrossRef]
- Williams, K.W.; Tai, H.S. A Multi-Tier Social-Ecological System Analysis of Protected Areas Co-Management in Belize. Sustainability 2016, 8, 104. [Google Scholar] [CrossRef]
- Peric, M.; Durkin, J.; Wise, N. Leveraging Small-Scale Sport Events: Challenges of Organising, Delivering and Managing Sustainable Outcomes in Rural Communities, the Case of Gorski kotar, Croatia. Sustainability 2016, 8, 1337. [Google Scholar] [CrossRef]
- Yu, C.Q.; Zhang, X.Z.; Zhang, J.; Li, S.W.; Song, C.Q.; Fang, Y.Z.; Wurst, S.; Wu, J.S. Grazing Exclusion to Recover Degraded Alpine Pastures Needs Scientific Assessments across the Northern Tibetan Plateau. Sustainability 2016, 8, 1162. [Google Scholar] [CrossRef]
Figure 1.
Geographical location of the study area.
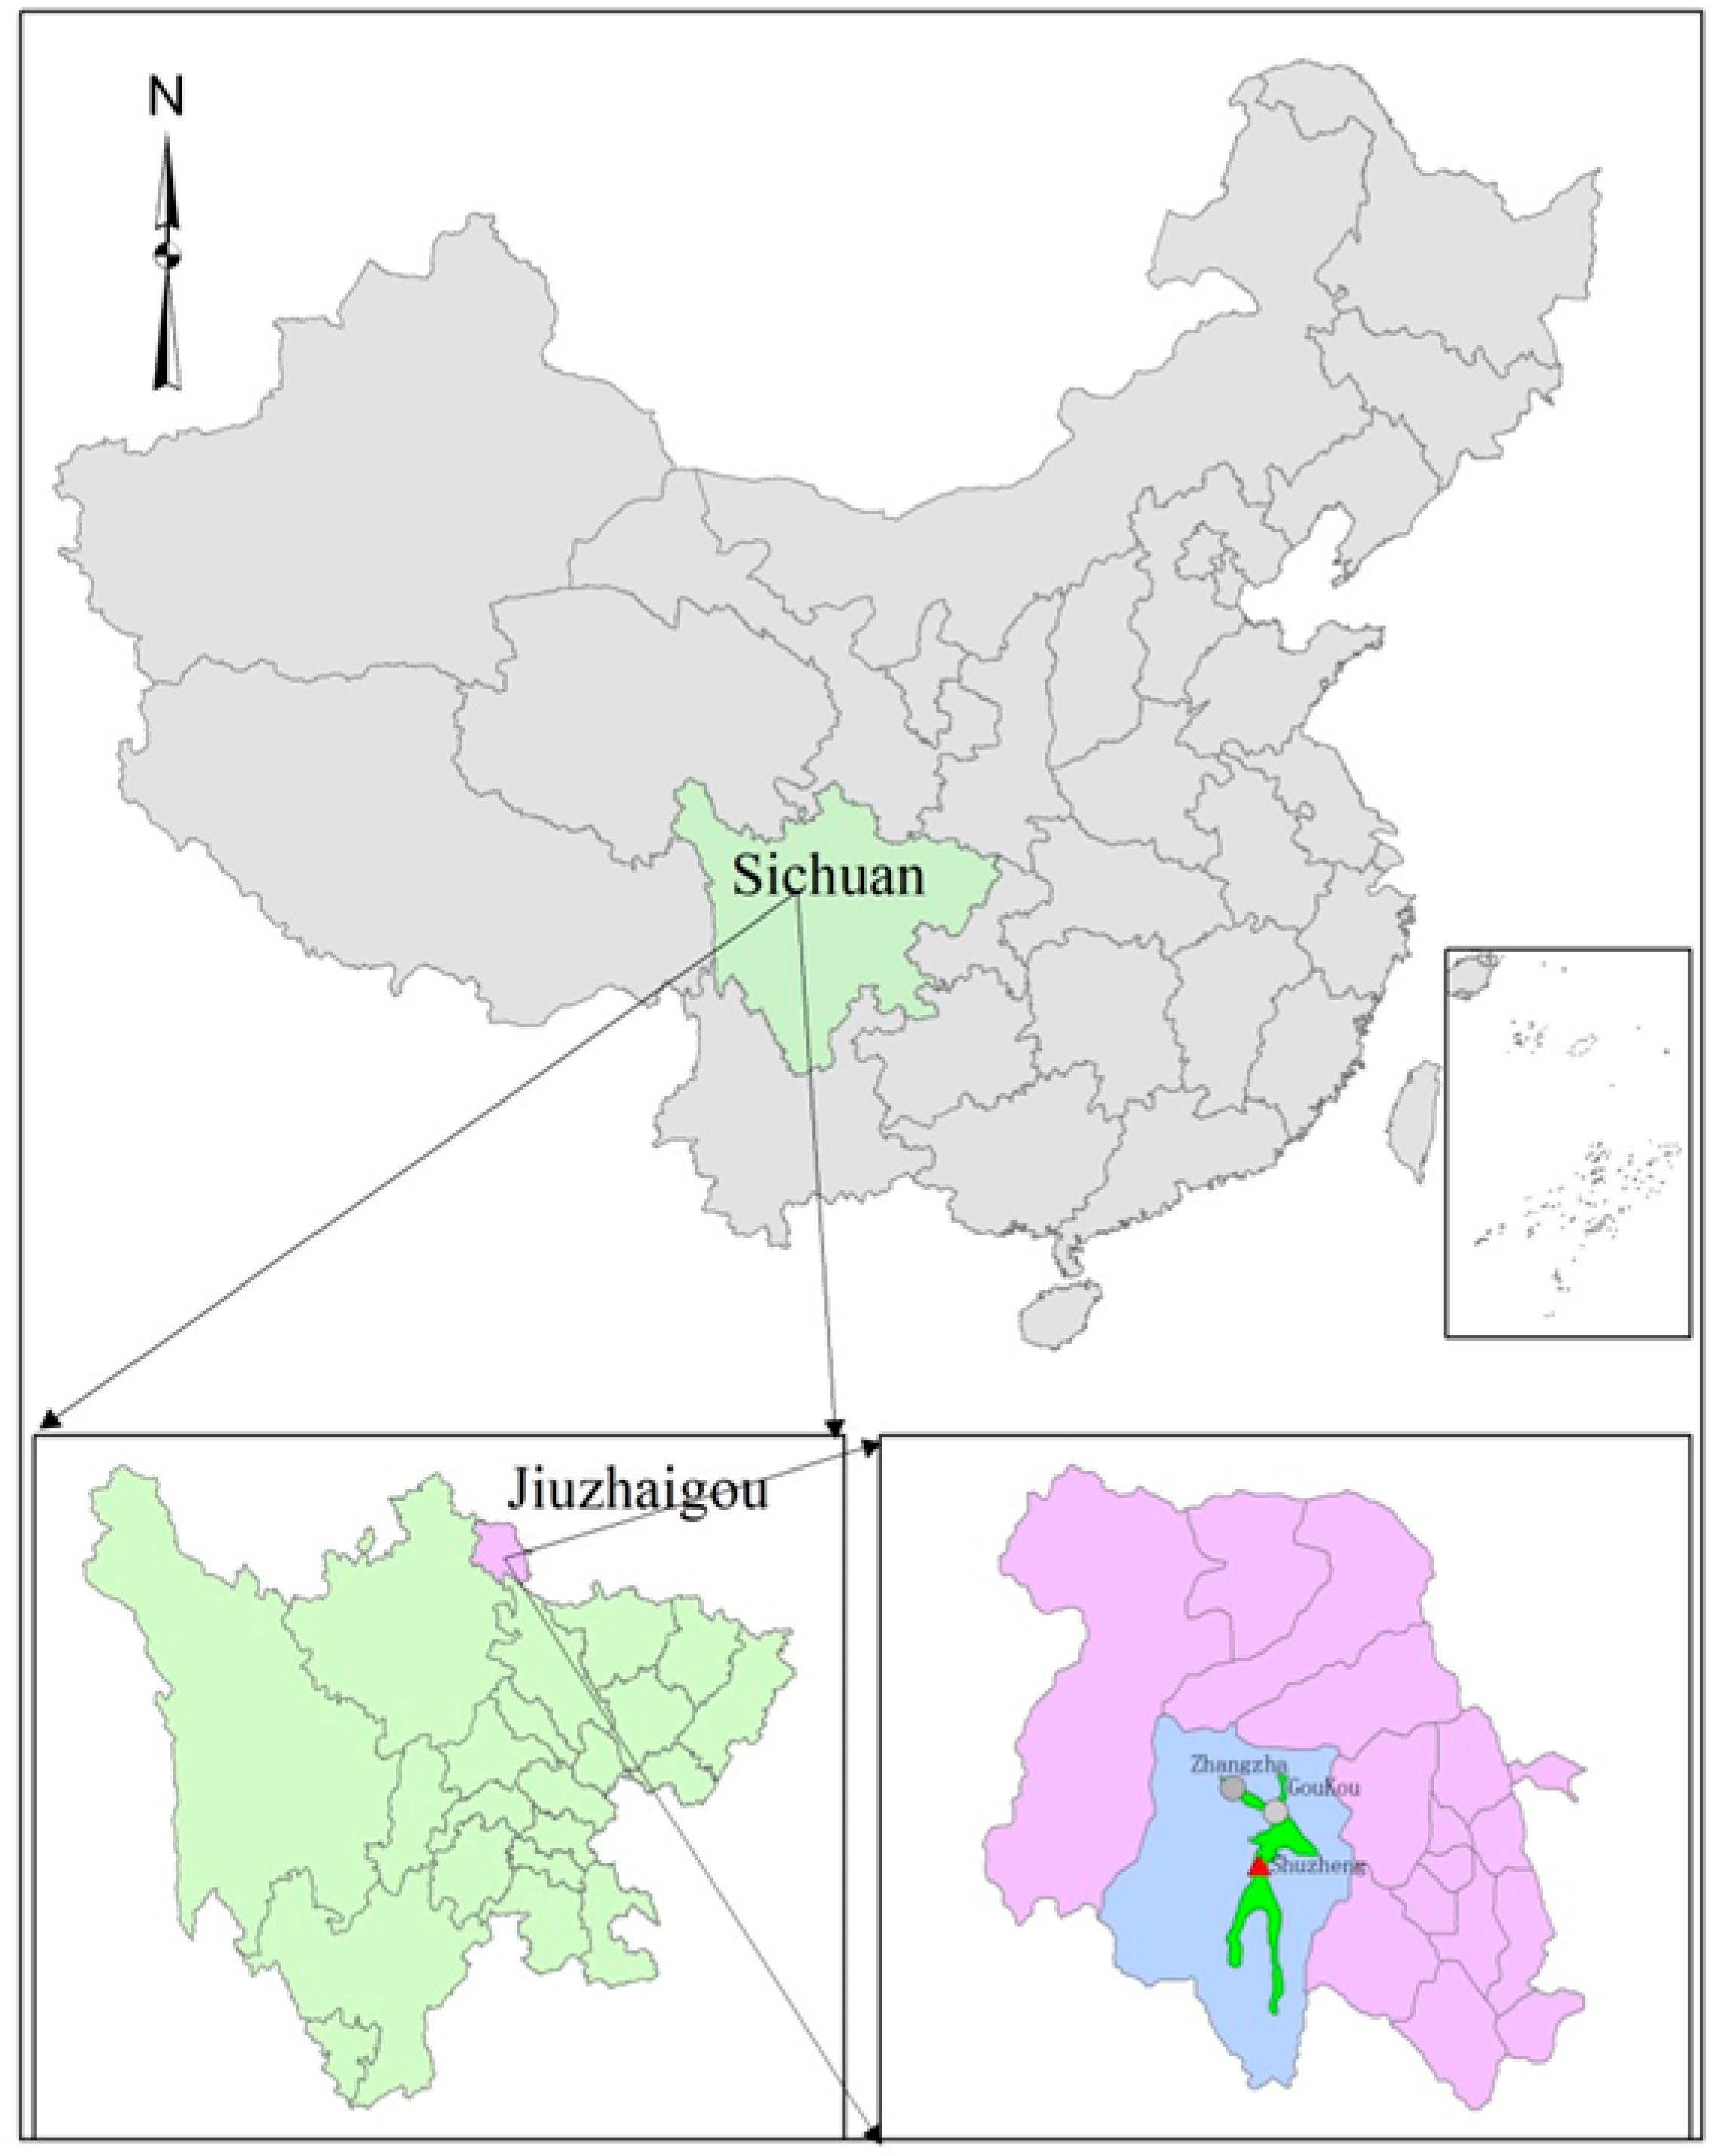
Figure 2.
Livelihood change in Jiuzhaigou communities.

Table 1.
Tourism proportions and main livelihoods of communities in Jiuzhaigou.
| Community | Proportion | Major Livelihood | Community | Proportion | Major Livelihood |
|---|---|---|---|---|---|
| Shuzheng | 100% | 6, 8, 12, 16 | Ganhaizi | 70% | 2, 4, 9 |
| Heye | 100% | 6, 8, 12, 16 | Shangsizhai | 44.83% | 2, 3, 17 |
| Zezhawa | 100% | 6, 8, 12, 16 | Langzhai | 90% | 11, 17, 18 |
| Zhangzha | 100% | 4, 5 | Zhongcha | 50% | 1, 9, 17 |
| Pengfeng | 100% | 4, 5 | Yatun | 80% | 1, 17 |
| Longkang | 100% | 4, 5 | Yongzhu | 76.5% | 2, 5, 17 |
| Congya | 100% | 4, 5, 17 | Shaba | 57.1% | 2, 17 |
| Yazha | 100 | 4, 5, 17 | Erdaoqiao | 66.7% | 2, 5, 17 |
Note: 1. Agriculture; 2. Non-agriculture and non-tourism; 3. Migrant working; 4. Running tourism businesses; 5. House renting; 6. Garment renting and photo taking; 7. Running a horse-riding business; 8. Employment in Jiuzhaigou Administration Bureau; 9. Long-term employment in tourism enterprises; 10. Coach bus business; 11. Taxi service; 12. Secondary distribution; 13. Shares joint operation; 14. Dividends; 15. Running Tibetan peasant-household tourism; 16. Selling souvenirs; 17. Temporary tourism employment; 18. Engaging in other tourism businesses.
Table 2.
Characteristics and income of livelihood assets in Jiuzhaigou communities.
| Livelihood | Entire Area | Core Attraction Area | Service Support Area | Secondary Service Support Area | ||||
|---|---|---|---|---|---|---|---|---|
| Assets | Mean | Std. Deviation | Mean | Std. Deviation | Mean | Std. Deviation | Mean | Std. Deviation |
| Natural | 0.0437 | 0.1288 | 0.0000 | —— | 0.0026 | 0.0188 | 0.0948 | 0.1781 |
| Human | 0.0741 | 0.0969 | 0.1067 | 0.1243 | 0.0864 | 0.1196 | 0.0480 | 0.0403 |
| Physical | 0.0853 | 0.0762 | 0.0321 | 0.0082 | 0.1461 | 0.0584 | 0.0757 | 0.0810 |
| Social | 0.1659 | 0.1089 | 0.1784 | 0.1172 | 0.1798 | 0.1082 | 0.1499 | 0.1033 |
| Financial | 0.2211 | 0.2006 | 0.1877 | 0.1339 | 0.3205 | 0.2487 | 0.1755 | 0.1741 |
| Psychological | 0.6438 | 0.1096 | 0.6432 | 0.1108 | 0.6775 | 0.0963 | 0.6223 | 0.1132 |
| Policy | 0.3268 | 0.4177 | 1.0000 | 0.000 | 0.0830 | 0.1543 | 0.1073 | 0.1674 |
| Total Income | 1.5607 0.1530 | —— 0.0280 | 2.1481 0.1213 | —— 0.0534 | 1.4959 0.3255 | —— 0.2190 | 1.2735 0.0592 | —— 0.0416 |
Table 3.
Model fitting information.
| Area | R | R2 | Adjusted R2 | F | Sig |
|---|---|---|---|---|---|
| Entire area | 0.681 | 0.464 | 0.449 | 30.708 | 0.0000 |
| Core attraction area | 0.597 | 0.456 | 0.324 | 11.247 | 0.0000 |
| Service support area | 0.656 | 0.430 | 0.406 | 17.880 | 0.0000 |
| Secondary service support area | 0.656 | 0.430 | 0.415 | 8.519 | 0.0000 |
Table 4.
Model estimation and testing.
| Area | Model | Unstandardized Coefficients | Standardized Coefficients Beta | t | Sig | Collinearity Statistics | ||
|---|---|---|---|---|---|---|---|---|
| B | Std. Error | Tolerance | VIF | |||||
| Entire area Model 1 | (Constant) | −0.1730 | 0.0506 | −3.4188 | 0.0007 | |||
| Physical | 0.7790 | 0.1173 | 0.3523 | 6.6387 | 0.0000 | 0.7671 | 1.3036 | |
| Human | 0.5398 | 0.0868 | 0.3102 | 6.2165 | 0.0000 | 0.8673 | 1.1531 | |
| Psychological | 0.2926 | 0.0773 | 0.1909 | 3.7878 | 0.0002 | 0.8507 | 1.1754 | |
| Natural | −0.2434 | 0.0651 | −0.1860 | −3.7404 | 0.0002 | 0.8738 | 1.1444 | |
| Social | 0.2150 | 0.0732 | 0.1389 | 2.9357 | 0.0036 | 0.9643 | 1.0370 | |
| Policy | −0.0527 | 0.0215 | −0.1306 | −2.4544 | 0.0148 | 0.7624 | 1.3116 | |
| Financial | 0.1056 | 0.0438 | 0.1257 | 2.4106 | 0.0167 | 0.7946 | 1.2584 | |
| Core attraction area Model 2 | (Constant) | −0.0412 | 0.0374 | −1.1024 | 0.2746 | |||
| Physical | 2.0244 | 0.7239 | 0.3102 | 2.7964 | 0.0069 | 0.8579 | 1.1656 | |
| Human | 0.1302 | 0.0475 | 0.3030 | 2.7429 | 0.0080 | 0.8652 | 1.1558 | |
| Psychological | 0.1299 | 0.0499 | 0.2692 | 2.6047 | 0.0115 | 0.9883 | 1.0118 | |
| Service support area Model 3 | (Constant) | −0.3275 | 0.1462 | −2.2403 | 0.0280 | |||
| Human | 0.6982 | 0.1756 | 0.3813 | 3.9763 | 0.0001 | 0.8725 | 1.1461 | |
| Psychological | 0.7421 | 0.2126 | 0.3261 | 3.4907 | 0.0001 | 0.9191 | 1.0880 | |
| Social | 0.4998 | 0.1862 | 0.2471 | 2.6843 | 0.0090 | 0.9472 | 1.0557 | |
| Secondary service support area Model 4 | (Constant) | −0.0262 | 0.0171 | −1.5300 | 0.0003 | |||
| Human | 0.5306 | 0.0760 | 0.0514 | 6.9862 | 0.0000 | 0.9414 | 1.0623 | |
| Physical | 0.1413 | 0.0368 | 0.2749 | 3.8392 | 0.0000 | 0.9922 | 1.0079 | |
| Psychological | 0.0792 | 0.0271 | 0.2153 | 2.9188 | 0.0425 | 0.9347 | 1.0700 |
© 2018 by the authors. Licensee MDPI, Basel, Switzerland. This article is an open access article distributed under the terms and conditions of the Creative Commons Attribution (CC BY) license (http://creativecommons.org/licenses/by/4.0/).
Share and Cite
MDPI and ACS Style
Ma, J.; Zhang, J.; Li, L.; Zeng, Z.; Sun, J.; Zhou, Q.; Zhang, Y. Study on Livelihood Assets-Based Spatial Differentiation of the Income of Natural Tourism Communities. Sustainability 2018, 10, 353. https://doi.org/10.3390/su10020353
AMA Style
Ma J, Zhang J, Li L, Zeng Z, Sun J, Zhou Q, Zhang Y. Study on Livelihood Assets-Based Spatial Differentiation of the Income of Natural Tourism Communities. Sustainability. 2018; 10(2):353. https://doi.org/10.3390/su10020353
Chicago/Turabian StyleMa, Jinhai, Jie Zhang, Li Li, Zhanjing Zeng, Jingrong Sun, Qilou (Bill) Zhou, and Yuling Zhang. 2018. "Study on Livelihood Assets-Based Spatial Differentiation of the Income of Natural Tourism Communities" Sustainability 10, no. 2: 353. https://doi.org/10.3390/su10020353
Note that from the first issue of 2016, this journal uses article numbers instead of page numbers. See further details here.