Sustainable RC Beam-Column Connections with Headed Bars: A Formula for Shear Strength Evaluation
by
 , ,
, ,
Minh-Tung Tran
1,
Quoc-Bao Bui
1,*, 
Bastian Sentosa
2,
Nhat-Tien Nguyen
1,
Trung-Hieu Duong
1 and
Olivier Plé
2 1
Faculty of Civil Engineering, Ton Duc Thang University, Ho Chi Minh City, Vietnam
2
Univ. Grenoble Alpes, Univ. Savoie Mont Blanc, CNRS, LOCIE, 73000 Chambery, France
*
Author to whom correspondence should be addressed.
Sustainability 2018, 10(2), 401; https://doi.org/10.3390/su10020401
Submission received: 28 December 2017
/
Revised: 29 January 2018
/
Accepted: 29 January 2018
/
Published: 4 February 2018
(This article belongs to the Special Issue Sustainability in Civil Engineering: from Sustainable Materials to Sustainable Cities)
Abstract
:Beam-column joints are critical regions for reinforced concrete (RC) frames subjected to earthquakes. The steel reinforcement is, in general, highly concentrated in these zones. This is why in many cases, headed bars are used. A headed bar is a longitudinal steel reinforcement whose end has a special button added to reduce the bonding length of the steel rebar. This paper establishes a formula predicting the shear strength of exterior RC beam-column connections where the beam longitudinal reinforcements use headed bars. A database was collected, which contained 30 experimental data about the exterior beam-column joints using headed bars and subjected to quasi-static cyclic loading. First, from the collected database, a statistical study was carried out to identify the most influencing parameters on the shear strength of the beam-column joints tested. The three most important parameters were identified and an empirical modified formula was developed based on the formula existing in the standards. The study showed that the results obtained from the modified formula proposed in the present study were closer to the experimental results than that obtained from the formula existing in the standards. Finally, a numerical study was performed on two T-form RC structures and the numerical results were compared with the prediction calculated from the modified formula proposed. For two investigated cases, the proposed formula provided the results in the safety side and the differences with the numerical results were less than 20%. Thus, the proposed formula can be used for a rapid assessment of the shear strength of RC joints using headed bars.
1. Introduction
Beam-column joints are commonly considered as critical regions of RC frame structures, especially when an RC structure undergoes seismic loading. The failures of beam-column joints can lead to severe damages of the whole structure. To improve the safety of the whole structures under seismic loading, the shear strength and the ductility of beam-column connections must be carefully examined. To avoid brittle joint shear failure, it is required that plastic hinges should appear in beams before appearing in joints. This design strategy is called the “strong column–weak beam” philosophy. In practice, the prediction of the beam bending moment capacity is relatively relevant, while the prediction of the joint shear strength is still to be investigated [1,2,3,4,5]. This is why numerous studies have been performed to investigate the behavior of beam-column joints.
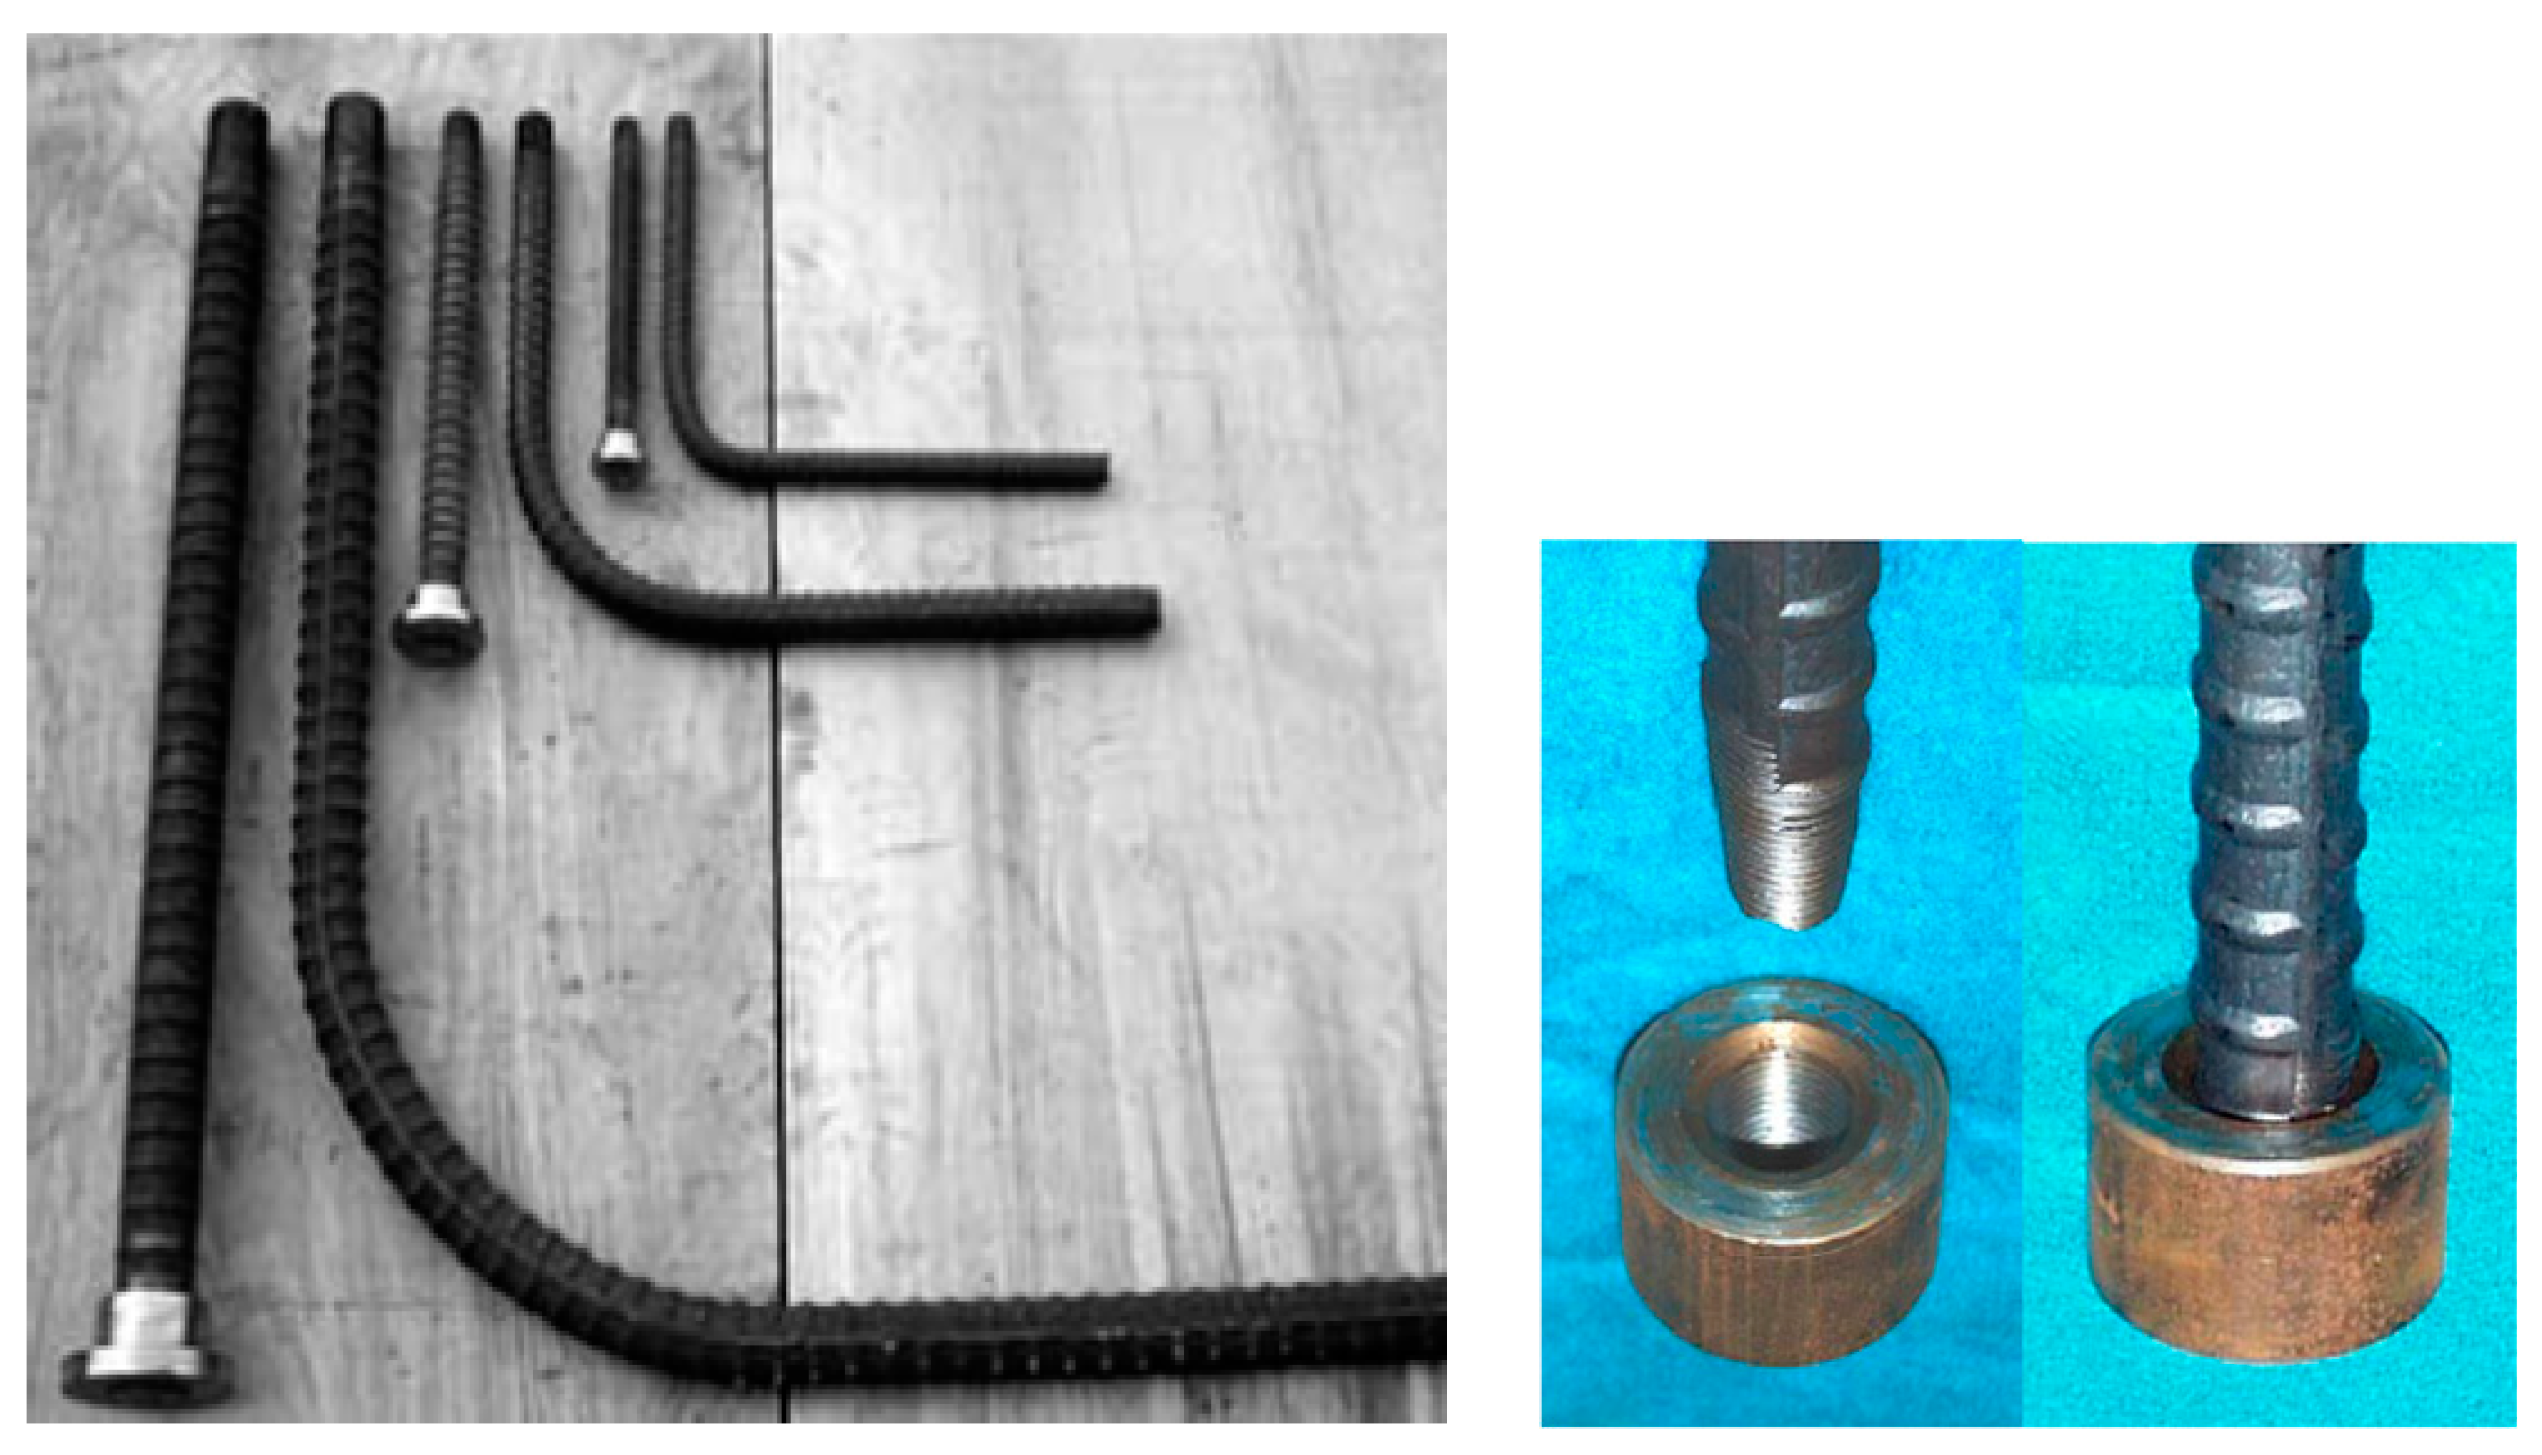
In order to meet the ductility requirements, the details of reinforcement at the beam-column connections are carefully required by the standards, for example ACI [6], AIJ [7], Eurocode [8]. The two most important requirements are the anchored length of the beam reinforcement bars into the joint and the amount of the horizontal stirrups at the joint. To meet these two requirements, the beam bars are currently bent in a 90° hook into the joint and a relatively high number of horizontal stirrups are placed within a small volume of the joint core. The placement of these reinforcements with long bonding lengths is a challenge because it hinders the casting and the compaction of concrete during the construction, whereas the concrete compressive strength is also crucial for the joint shear strength. To overcome this difficulty, several attempts have been made to minimize the reinforcement congestion at exterior beam-column joints. Headed bars (Figure 1) are one interesting solution for this problem [9,10,11]. By using headed bars, the development lengths of longitudinal reinforcements are reduced, so the consumption of raw materials is reduced, which makes this technique more sustainable than the classical method.
However, the studies about the joint shear strength of the exterior beam-column connections, in general, and of the exterior beam-column connections with headed bars, in particular, are still incomplete. Recent studies showed that the shear strength of exterior RC beam-column joints is influenced by the concrete strength, the joint panel geometry, the confinement of reinforcement rebars, the column axial load, and the reinforcement details at the joint location [4,12,13,14]. Lim et al. [15] used numerical methods to analyze the influences of reinforcement details on the performance of beam–column connections under the blast loads; the authors showed that the amount of the diagonal reinforcement at the joint core was a crucial factor. The influencing factor of the joint shear strength of beam-column joints with beam reinforcement bars anchored by the conventional 90° hooks have been analyzed by Tran et al. [4], while similar investigations for the exterior beam-column joints with headed bars have not yet been analyzed. Kang and Mitra [16] used binomial logistic regression methodology to establish a statistical model which could assess the importance of different parameters on the performance of beam-column connections with headed bars, but the joint shear strength and the prediction of joint shear strength were not investigated. The behavior of RC beam-column connections have not yet been completely understood because of the large variations in both the geometry and the distribution of efforts in a relatively small volume at the joint region [17]. This point of view is shown in the inconsistencies between different existing standards [7,8,18,19] for the prediction of the shear strength of RC beam-column connections, especially for the case of beam-column joints with headed bars.
To bridge this gap, this paper aims to propose an empirical formula for the rapid prediction of the shear strength of exterior RC beam-column joints with headed bars. A database was collected which contains 30 tested specimens which had shear failures at the joint. Using this database, key factors of the shear strength of joints with headed bars were examined. Then, a formula for the prediction of the joint shear strength of beam–column joints with headed bars was proposed. Finally, two numerical models were performed by using Abaqus software. The relevancy of the formula proposed was verified by comparing the results obtained by the empirical formula and that from the numerical models.
2. Database Collected
From the published literature [10,20,21,22,23,24,25,26], a total of 30 experimental RC beam-column connections with headed bars was collected. All of the specimens were subjected to quasi-static cyclic lateral loading and were at least one-third scale. The final failure modes of the collected specimens were either joint shear (J) or joint shear with yielding of beam reinforcement (BJ). All of the specimens had no out-of-plane members (slabs and/or transverse beams) and no eccentricity between beams and columns. Specimens that failed in terms of weak column–strong beam and weak beam–strong joint were excluded from the collected data because, in these cases, the column or beam flexural capacity was relatively low; thus, the failure of the column or beam caused by the flexural moment could occur before the shear strength of the connection was reached. Only specimens with beam reinforcement bars anchored into the joint by a headed nut were included in the database. In the collected results, the experimental shear forces Vtest were either collected from the reported values or calculated using the maximum applied load measured from the tests. In this calculation, the effective height of the beam cross-section was assumed to be 85% of the total beam height hb. This value is acceptable for the configurations where a high quantity of steel reinforcement is present, which is usually the case when headed bars are employed.
As summarized in Table 1, the collected database covers a broad range of various parameters including: the width and the height of the beam section (bb and hb); the width and the height of the column section (bc and hc); the specific concrete compressive strength fc′; the specific yield stress of headed bars fyb; the diameter of the beam bar db; the provided development length of the beam bars lp; and the ratio of the net bearing area of head nut (Abrg) to the sectional area of the beam bar (Ab). Among 30 specimens studied, 17 specimens had failure in the J mode, while 13 other specimens had failure in the BJ mode. Due to the large number of parameters, the imposed axial load has not yet been considered in the present paper.
The definitions and the ranges of some main parameters in the collected database are summarized in Table 2 where the most important parameters which have been observed in the literature were examined (see Kang & Mitra 2012, for example, for excellent analyses).
In Table 2, the normalized horizontal joint shear reinforcement (, where Asjh, fjhy are the total sectional area and the yield stress of the stirrups placed within the joint core, respectively) ranges from 0 to 0.24. The normalized vertical joint shear reinforcement (, where Asjv, fjvy are the area and yield strength of the vertical reinforcement passing through the joint, respectively) ranges from 0 to 1.47. These values, especially the normalized horizontal joint shear reinforcement (χjh) are relatively low, compared to the amount of reinforcement required by ACI [6]. Indeed, the normalized joint shear reinforcement ratios (χjh, χjv and χj) represent the capacity of shear reinforcement bars (Asjh. fjhy, and Asjv. fjvy) which are divided to bj hc (fc′)1/2—the famous dominant parameter presented in the standards, for example ACI—in order to facilitate the integration of this parameter in the analytical formula proposed by the present study (detailed in the next section). The joint shear reinforcement (χj) is assumed as the sum of χjv and χj, similar to the case of the well-known parameter effective joint width bj, where bj = (bc + bb)/2 following ACI.
The index of the beam bars’ details λb is a new parameter which is a function of the provided development length (lp), the bar diameter (db), the clear bar spacing between the longitudinal reinforcement bars (cs), and the clear cover thickness of beam longitudinal reinforcement bars (ccb). In fact, the ratios lb/db and ccb/db have already been investigated in a previous study [16], because in the case of headed bars, when a longitudinal bar is pulled, the concrete breakout zones (form of cone) appears around the headed nut (see [11] for more details), thus, the parameters related to these concrete breakout zones should be considered. In the present study, these parameters were grouped in one parameter (λb) and the clear bar spacing cs was also integrated because it had influences on the concrete breakout zones. The grouping in a unique parameter can facilitate the identification of the coefficients in an empirical formula, which is the aim of this paper. Thus, the beam bars’ details λb reflects both the bonding conditions of the beam longitudinal bars (by lb which is usually expressed by lb/db) and the performance of the headed nuts at the joint core (by ccb and cs), which are considered as the dominant factors for the beam-column joint shear strength. It is worth noting that, in conventional RC beam-column joints, the anchorage of the beam longitudinal bars are insured by the bonding along the development length and the arc of 90° hooks, whereas for the beam-column joints with headed bars, the anchorage is mainly provided by the headed nuts, a relatively small portion is provided from the bonding along the development length. That is, the reason that the development length of the beam longitudinal bars in the beam-column with headed bars is significantly shorter than that in the conventional RC joints. This difference in the mechanism leads to the difference in behavior of beam-column joints with and without headed bars. Thus, the consideration of λb for the beam-column joints with headed bars is necessary.
It can be seen in Table 2 that the concrete compressive strength fc′ ranges from 28.3 to 138.6 MPa, while the specific yield stress of headed bars ranges from 524 to 1034 MPa. These data show that, in most of the collected specimens, high-strength concrete and high-strength steel were used, which were popular in the practical application of headed bars.
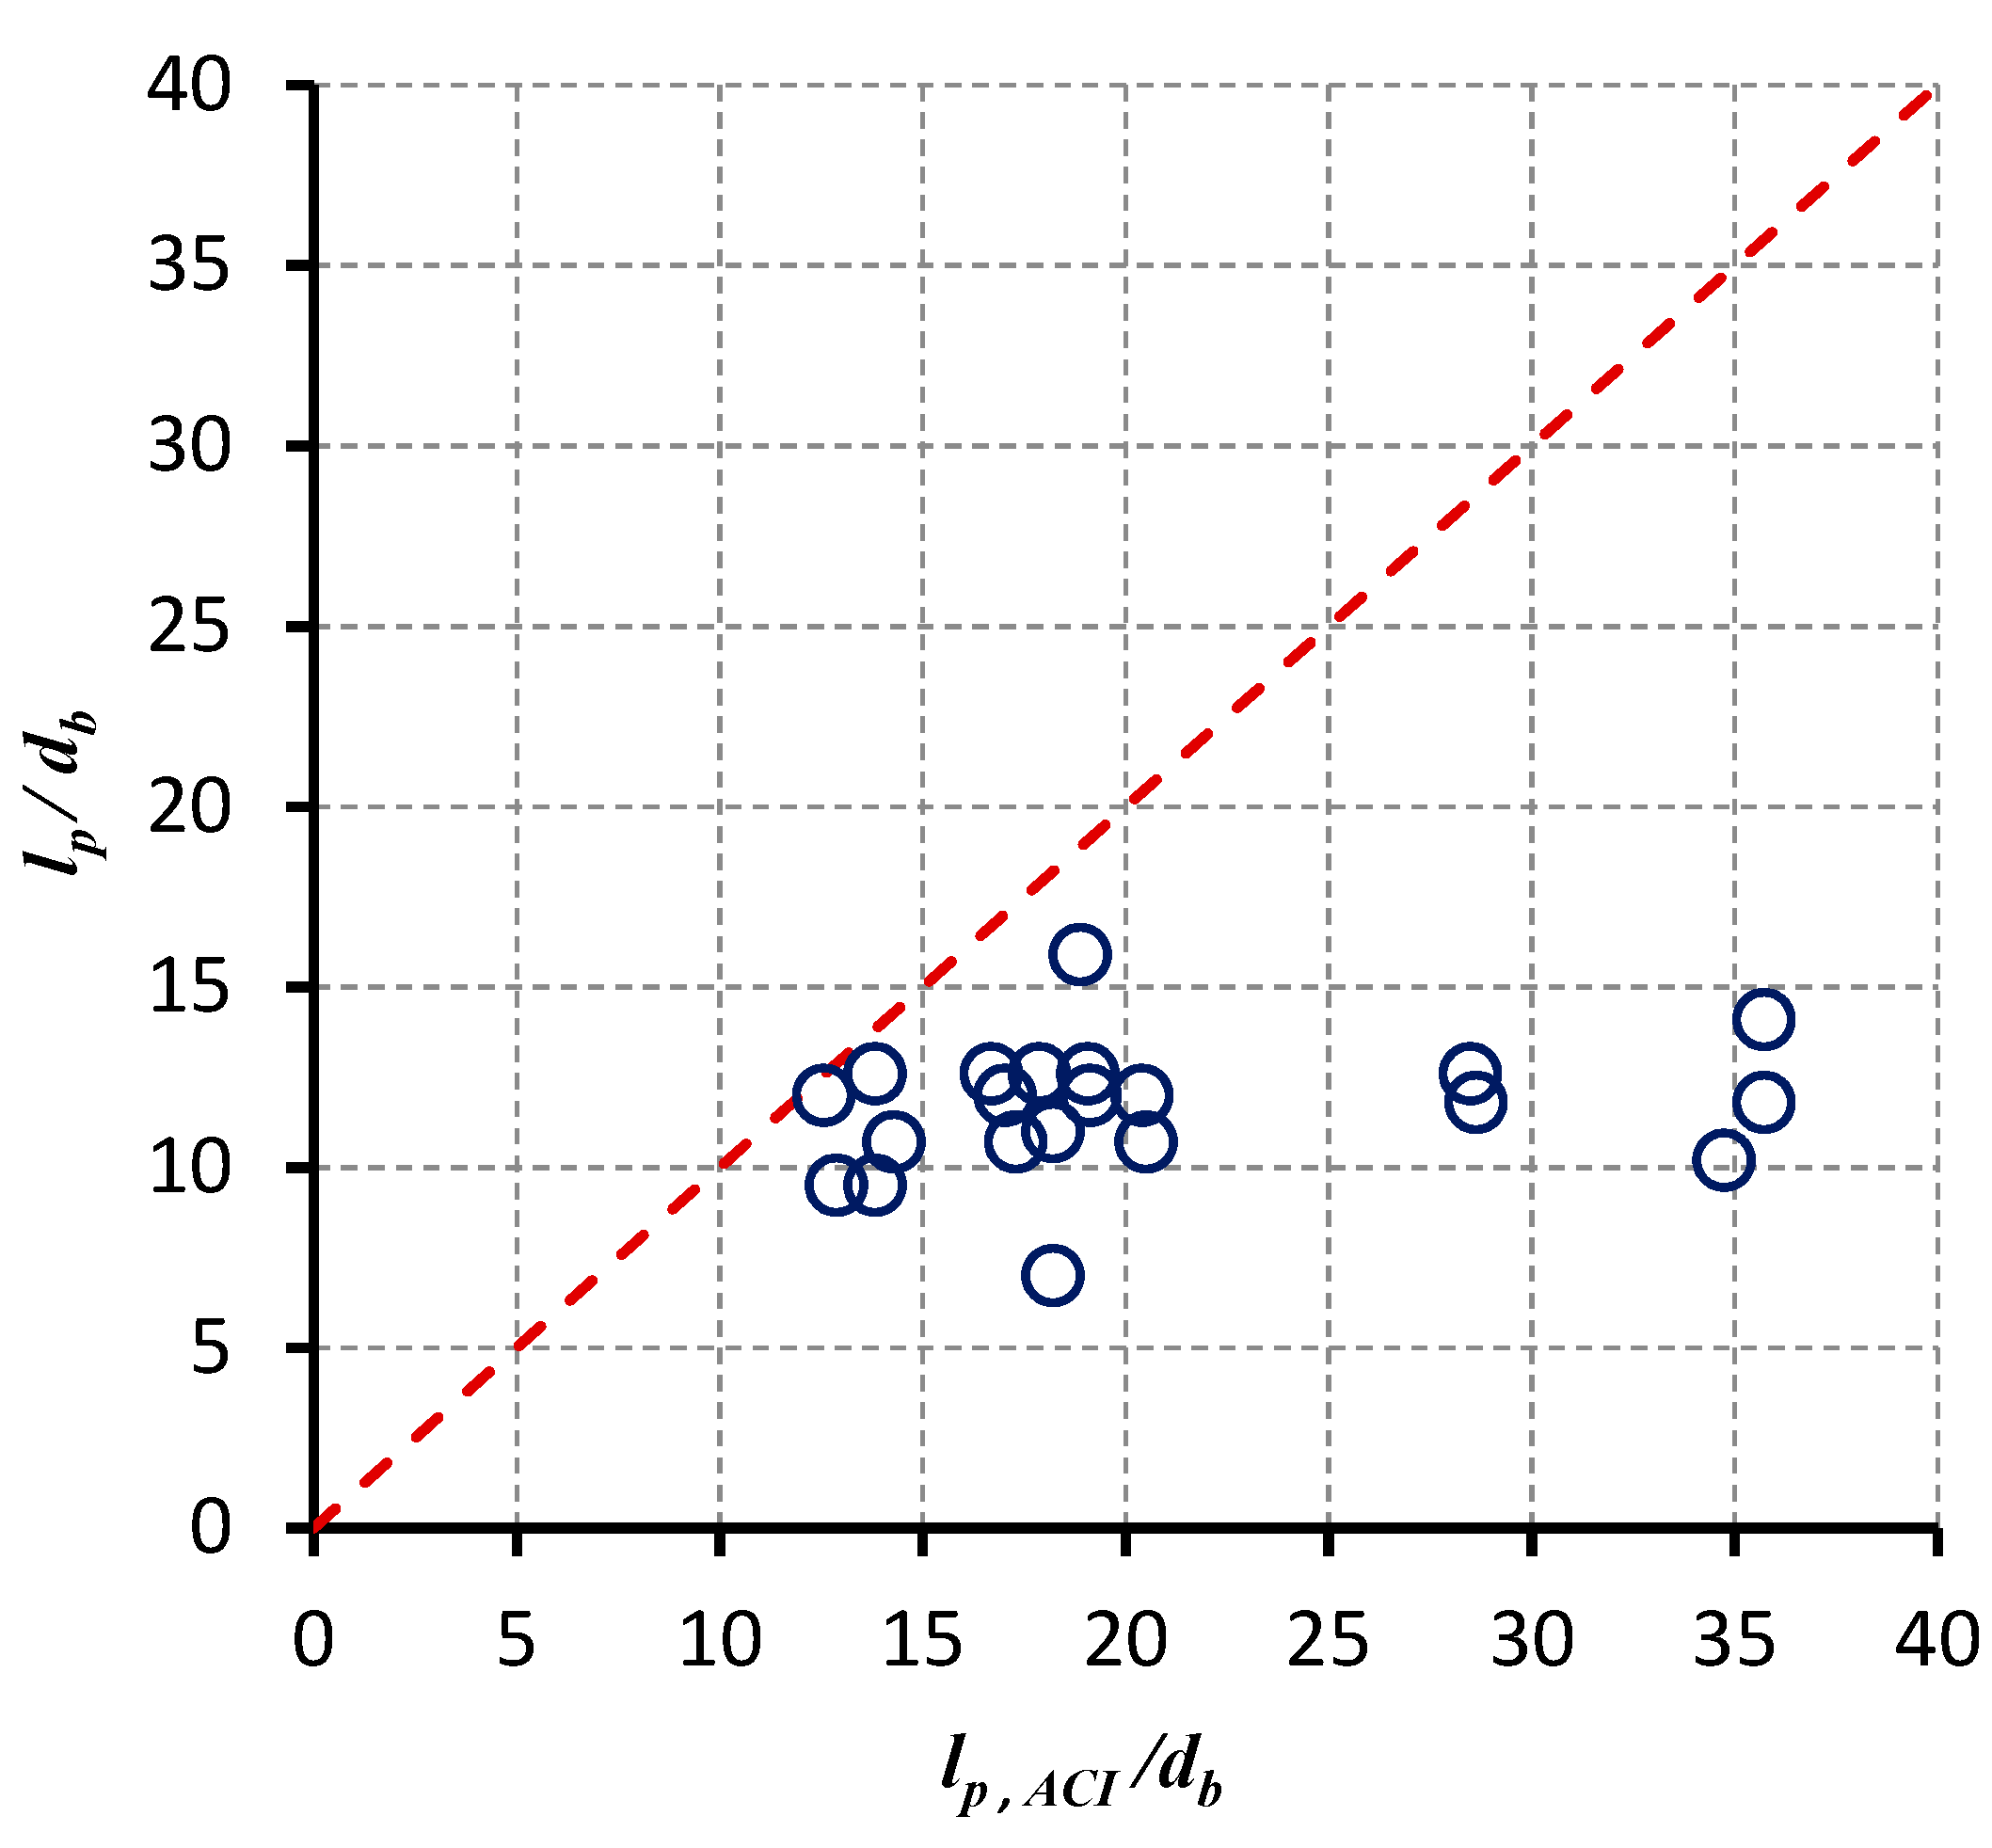
Table 2 shows that the development length (lp) of the beam bars ranges from 7 to 24.3 db, which is also short compared to the requirement in ACI 318-08 (2008). A comparison between the provided development lengths of the beam bars of all the collected samples (lp) and the development lengths required in ACI 318-08 (lp,ACI) is shown in Figure 2, where the development length required by ACI lp,ACI is determined by:
lp,ACI = 0.19 fy db/(fc′)0.5, with fy and fc′ are in MPa
From Figure 2, it can be seen that all specimens did not meet the required development length of the beam bars, following ACI 318-08 [18].
Following the above observations about the intervals of variation of the key parameters, most of the specimens in the database did not meet the requirements imposed by the standard. This may be the reason that all specimens had failures in either J or BJ modes, and their joint shear strength needs to be evaluated.
3. Influencing Parameters of Beam-Column Joint Using Headed Bars
The main influencing parameters for the joint shear behavior of the conventional beam-column connections have been examined by [27,28]. From their study, the concrete compressive strength fc′, in-plane geometry (interior, exterior, or knee connections), dimensions of the beams and columns (hb, bb, hc, bc), joint transversal reinforcement, and beam reinforcement are among the influencing parameters for the shear strength of the conventional beam-column joint. Furthermore, the bonding condition which is strongly influenced by the development length and the details of the beam reinforcement bars, are also known as the influencing parameters for the shear strength of the conventional joint [4]. In the following part, the influencing parameters for the joint shear strength of connections with headed bars are evaluated by using the collected database.
To evaluate the importance of the keys parameters on the joint shear strength, the dependence of the joint shear stress (νtest) on the examined parameters are studied in the collected database. The dependence level of these relationships is quantified by the correlation coefficient (CC). The CC of two quantities X and Y is calculated using following equation:
where xi, yi, i = 1, …, n are the available data of parameters X and Y, respectively; and are the average values of the parameters X and Y, respectively. The CC of two parameters can vary from −1.0 to +1.0. A CC near ±1.0 indicates a strong positive or negative relationship between the two examined quantities, respectively, while a near 0.0 coefficient indicates a weak relationship.
For the collected database, the three most important parameters were identified which included the concrete compressive strength (fc′) with CC = 0.71, the index of the beam bars details (λb) with CC = 0.58 and the normalized joint shear reinforcement (χj) with CC = 0.52. The relationship between the maximum tested joint shear stress and these three parameters are shown in Figure 3, Figure 4 and Figure 5. From these figures, besides the concrete compressive strength and the joint shear reinforcement, which are usually considered as the important factors of the joint performance, the index of the beam bars details λb as an important parameter, which is newly discovered. The important level of this parameter is even higher than the joint shear reinforcement. This is why it is necessary to take into account the index of the beam bars’ details (λb) and the normalized joint shear reinforcement (χj) in the shear strength evaluation of exterior RC beam-column joints, with beam longitudinal reinforcements anchored into the joint by headed bars.
4. Models for Shear Strength of Beam—Column Connections
4.1. Previous Models
To resist a joint shear force, both strut and truss mechanisms are developed, thus the joint shear strength Vj is usually composed of two components as follows:
where Vch, Vsh are the shear strengths coming from the concrete strut and truss mechanisms, respectively. The first component depends mostly on the concrete strength and the second term mainly depends on the horizontal and vertical joint shear reinforcements. However, in the American standard ACI 352R-02 [6], the second term is ignored and the joint shear connection is expressed by a function of the concrete compressive strength as following:
where ν is the joint shear stress and γACI is the joint shear factor given by the code.
In the Japanese standard AJI [7] the contribution of the joint shear reinforcement is also ignored and the joint shear strength is defined as a function of the concrete compressive strength as follows:
where k and φ are the joint shear strength factors defined by the code.
The above equations proves that the concrete compressive strength is the crucial parameter, but the reinforcement rebars have not yet been taken into account.
4.2. A Modified Formula Proposed by the Present Study
The existing models mentioned above focused only on the concrete compressive strength (fc′) while effects of the index of the beam bars details (λb) and the normalized joint shear reinforcement (χj) have not been considered. However, significant correlations between the joint shear strength and those two parameters have been observed. In the proposed model, a more general form of the joint shear strength is proposed which takes into account these influencing parameters, as illustrated in following equation:
where xi represents the input influencing parameters (λb and χj); n is the number of influencing parameters; ai are coefficients and c is the intercept. The ai and c can be identified by basing on a regression analysis from the experimental data.
In fact, the form of the Equation (5) was chosen following the reasoning: first, it was mentioned above that bj, hc, and fc′ were the most important parameters, so they were grouped in the first part; then all other factors were placed in the second part. The relationship of the second part was chosen as linear because this was the simplest way that could facilitate the identification of the coefficients and also facilitate the application of the formula in practice. By using a regression analysis (in Microsoft Excel) with experimental data collected, the coefficients ai and c were identified and a new empirical formula can be suggested as follows:
This is worth noting that a parametric study was performed by modifying the number of the experimental data used (with 30 available data, with 25 different data, 20 different data) to search the best coefficients ai and c. The relevancy of this formula will be verified in the next section.
4.3. Assessing the Robustness of the Proposed Model
The experimental results from the database were used to verify the proposed model. A comparison between the tested joint shear strength (Vtest) and the predicted joint shear strength (Vmodel) calculated from Equation (6) is shown in Figure 6a. The figure shows that the predicted joint shear strengths are close to that of the tested values. The proposed model predicts the joint shear strengths of 30 collected specimens with an average test to model shear strength ratio (AVG) of 1.00, a coefficient of variation (COV) of 15.2% and an average error (AVE) of 12.2%. The similar comparisons between the experimental results and that of the existing formulas mentioned in ACI regulations (Equation (3)) and AJI (Equation (4)) are illustrated in Figure 6b,c, respectively. The model from ACI predicted the joint shear strengths of the collected specimens with an AVG of 0.82, a COV of 21.9%, and an AVE of 29.7%. These values for the prediction of the AJI model were AVG = 0.77, COV = 26.9 and AVE = 41.7%. These figures show that for the database of 30 specimens studied in this paper, the formula proposed in ACI and AIJ standards overestimate the shear strengths of the specimens in the most of cases, while the results predicted by the model proposed in the present study (Vmodel) provided closer results to the experiments than the two standards mentioned.
5. Numerical Assessment of the Proposed Formula
In order to verify the relevancy of the proposed formula, a numerical model was constructed by using Abaqus software. The models simulated two beam-column RC structures with T-form (Figure 7). The first one was loaded by a vertical concentrated force at the free end of the beam; the second structure was loaded by a vertical concentrated force at the free end of the beam.
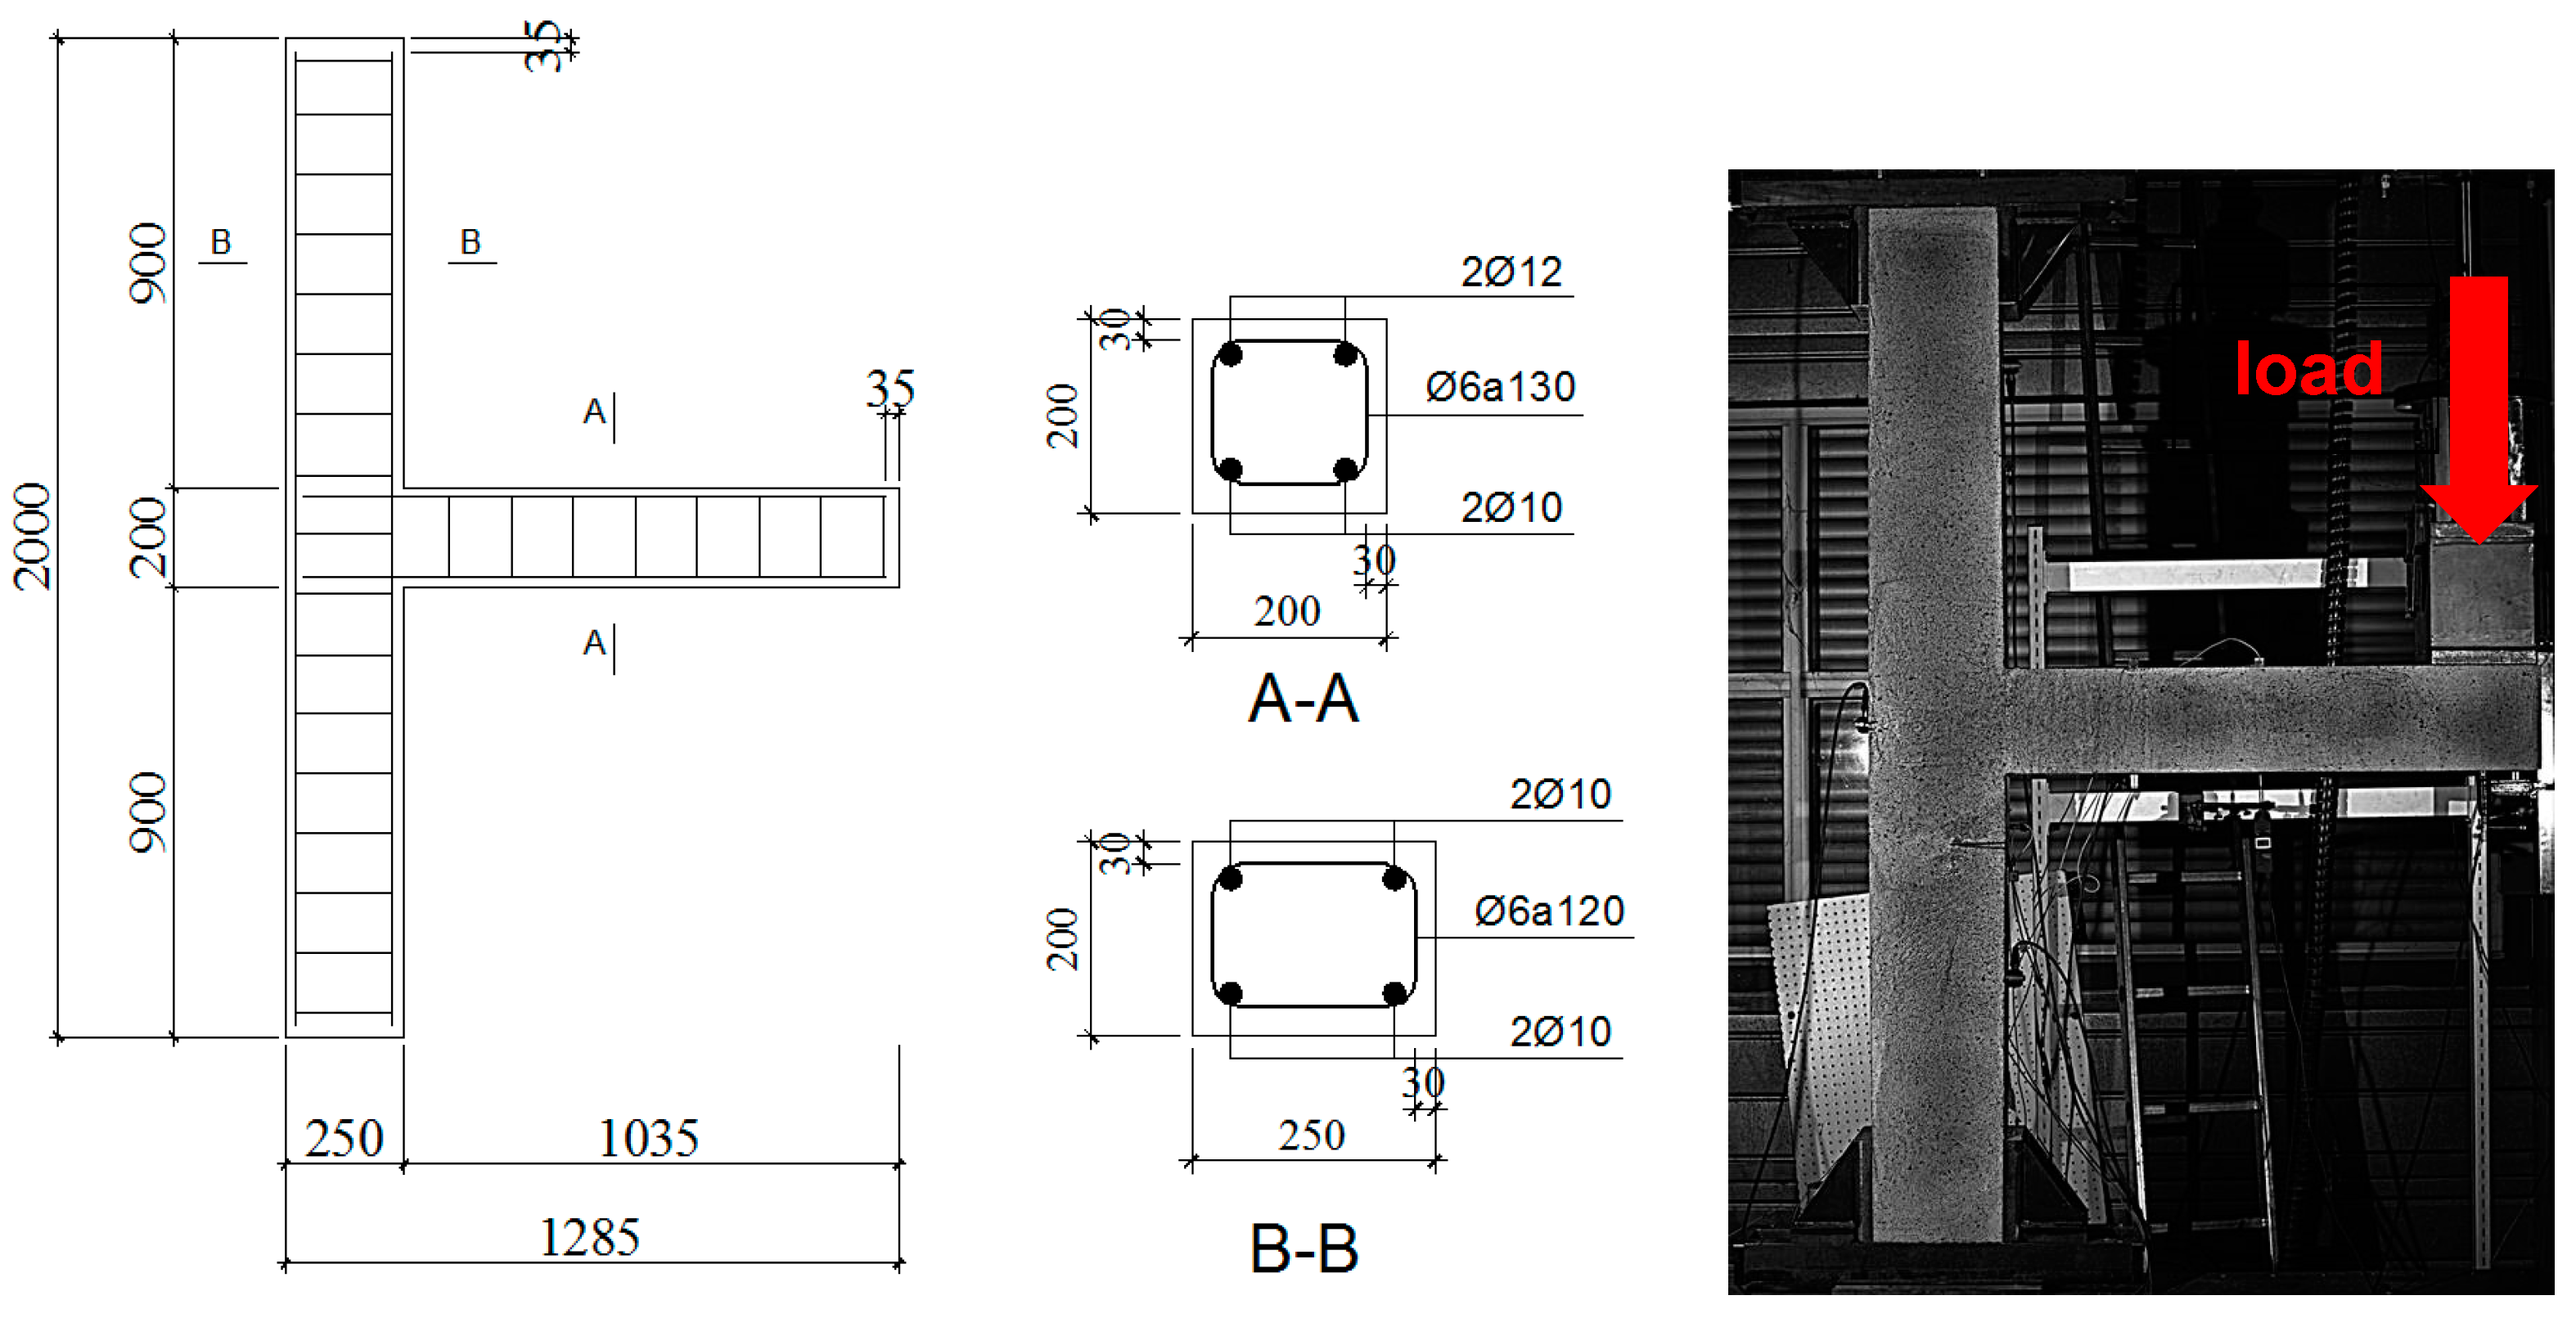
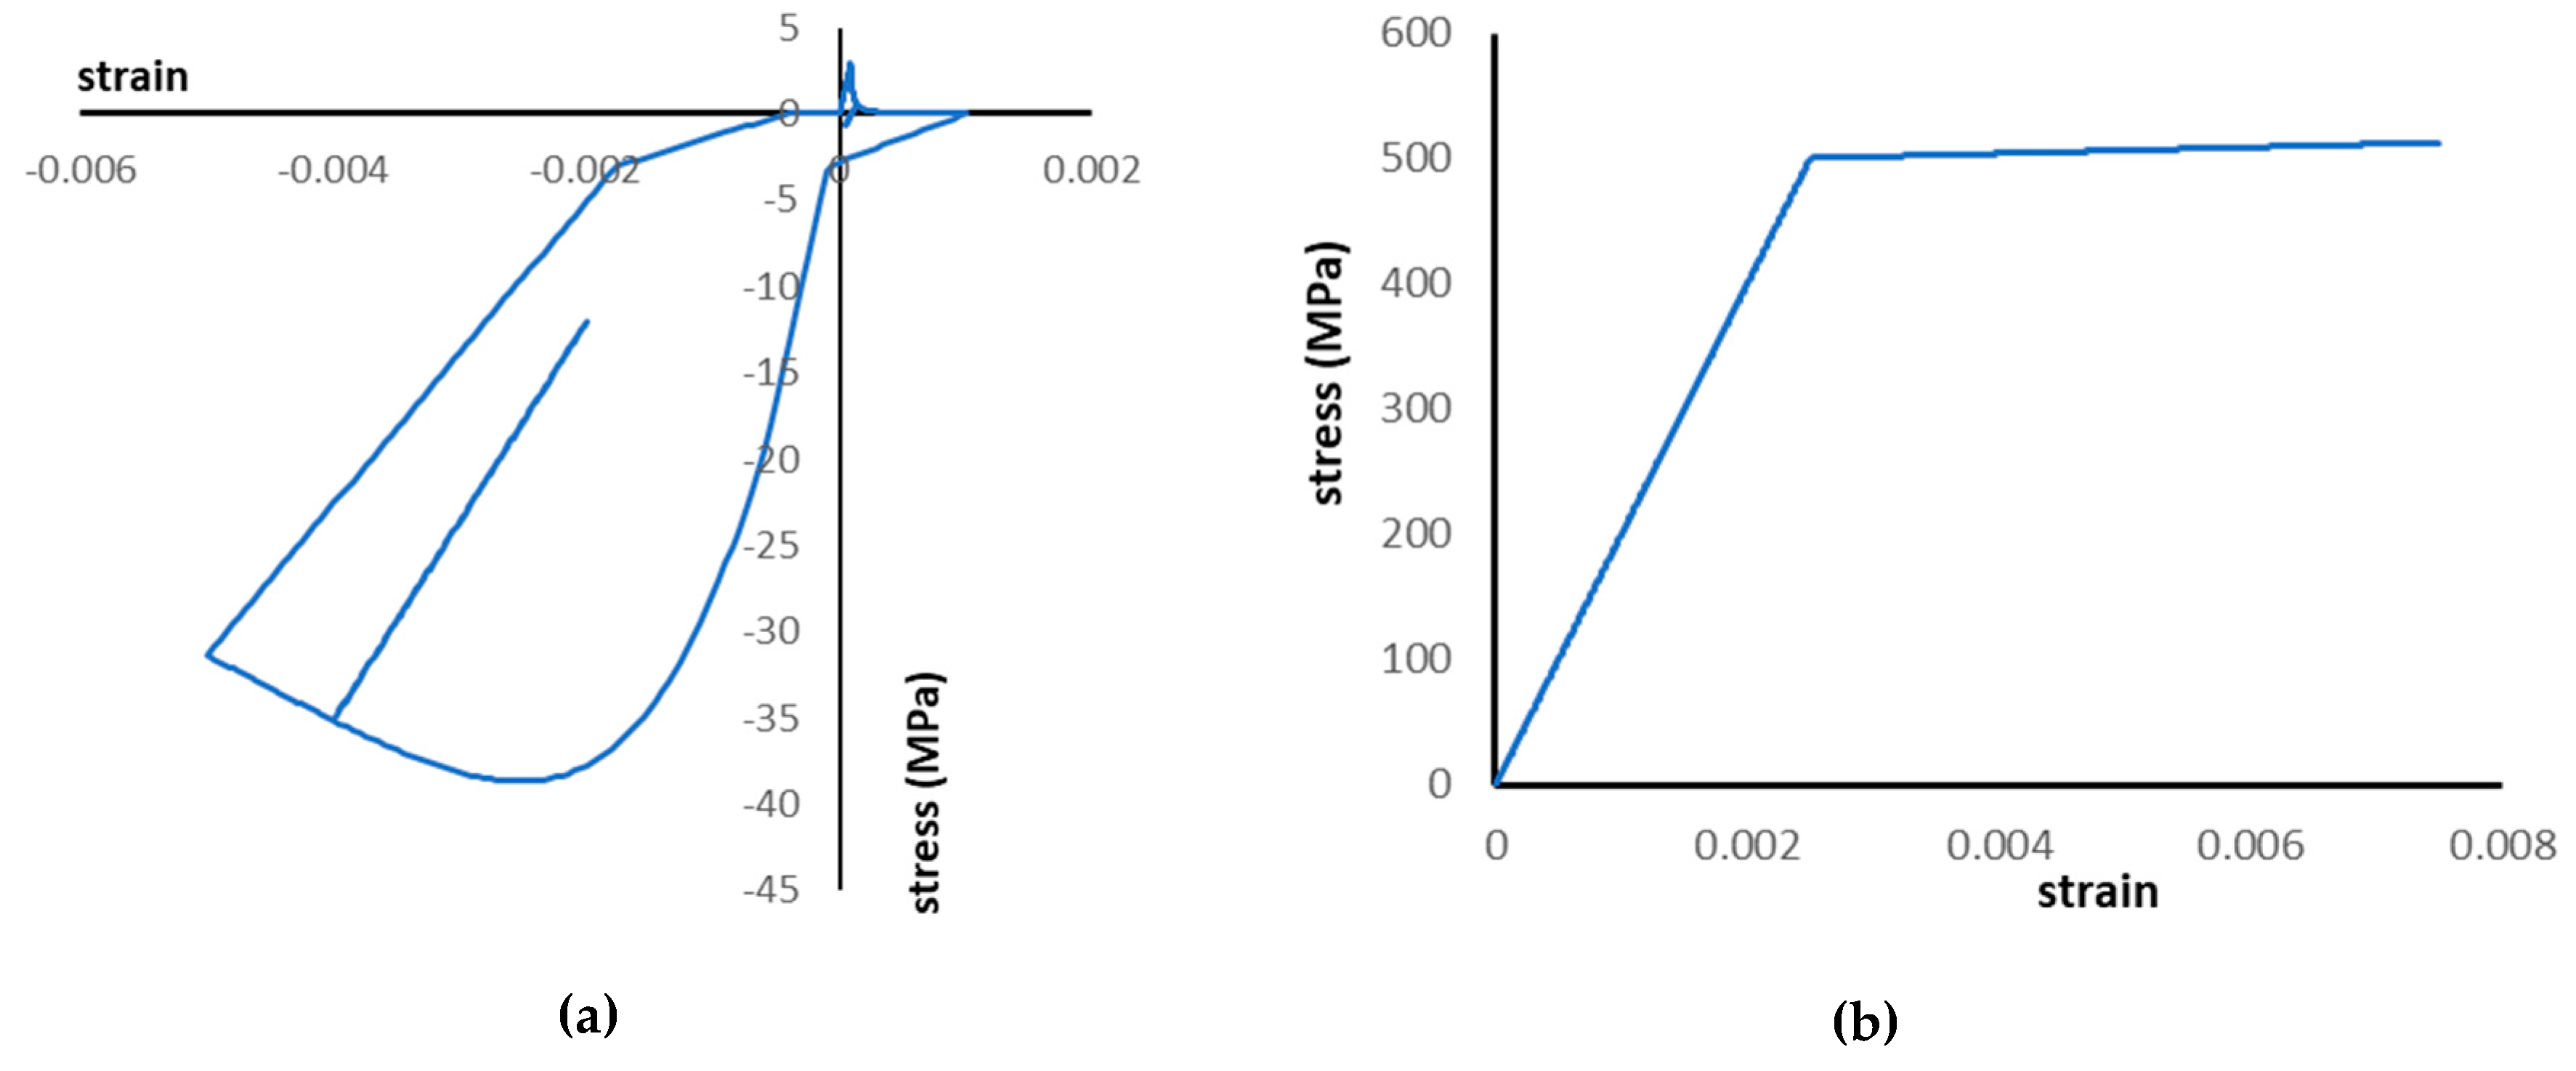
First, the relevancy of the numerical model was checked by using an experimental result in the case of conventional longitudinal steels (without headed bars). Figure 7, on the right, illustrates this experiment where the T-form conventional RC structure, with the dimensions presented on the left of Figure 7, was loaded by a vertical force at the end of the beam. This conventional RC structure was fixed at the bottom and at the top of the column by the steel jacks, to simulate the embedment of the RC structure to the steel loading frame [29]. The displacement field was recorded by using the DIC (digital image correlation). The strain-stress curve of the used concrete was obtained from uniaxial compression tests on cylindrical specimens 16 cm in diameter and 32 cm in height; a result is illustrated in Figure 8a. In the numerical model, the concrete was modelled with the CDP model (concrete damage plasticity). The steel was modelled with an elastic-plastic model where the stress-strain relationship was taken following the manufacturer data (Figure 8b). A sensitivity study on the mesh dimension was carried out and a mesh of 50 mm on the concrete was chosen, which provided stability in the obtained results.
The comparison between the numerical and experimental results is presented in Figure 9. This figure shows that the numerical model could reproduce the overall behavior of the experiment: the initial stiffness, the stiffness decrease and the most important parameter: the maximum force. After the initial phase, the numerical results is more rigid the experimental results: at a same force level, the numerical curve has less displacement than that of the experimental one. One possible reason for this difference is that when the load increased, the jacks and the steel loading frame were not rigid enough to be considered as embedment; thus, the boundary condition used for the numerical model became less pertinent. However, in the present study, the main objective of the numerical model is to provide the maximum force, in order to compare with the proposed formula, so this numerical model can completely satisfy this objective. For this purpose, the headed bars were added at the ends of the beam’s longitudinal reinforcement bars (Figure 10).
Two separate models were run for two different loading cases: vertical loading at the end of the cantilever beam (the same as the case presented above) and horizontal loading at the end of the beam. The deformation and stress development in the structures are illustrated in Figure 11, where the stress unit is kN/mm2. The maximum forces obtained by these numerical models are reported in Table 3.
In parallel, the maximum shear load of these two structures were also easily obtained by using Equation (6) proposed by the present study. By using classical relationships in the theory of the strength of materials, the maximum forces applied at the end of the beams could also be calculated. The results are reported in Table 3.
From Table 3, the differences between the analytical results and those of the numerical results are, respectively, 17.6% and 6.4%. For the case of horizontal loading, the agreement is fair while for the vertical loading, the relative error is non-negligible. However, this relative error remains within the range of the COV of the proposed formula, while in the cases of ACI and AJI, this COV value is much higher (Figure 6). For the case of horizontal loading, the RC joint is directly sheared by a horizontal force, while for the case of vertical loading, the joint suffered a moment which is decomposed into shear forces in the joint. Despite these differences, the obtained results show that the simple formula proposed can be used for a rapid assessment of the shear strength of exterior RC joints using headed bars.
6. Conclusions
The present study seeks a new formula to predict the shear strength of exterior RC beam-column joints where the beam longitudinal reinforcements are anchored into the joint by headed bars. The model was developed based on a regression analysis which used the database collected from 30 experiments. Influences of the most important parameters were analyzed. It was shown that, in addition to the well-known concrete compressive strength, the index of the beam bars’ details, and the normalized joint shear reinforcement also had a vital role in the joint shear strength. This was why these three parameters were selected to generate the modified formula, in which the index of the beam bars’ details were a new parameter compared to the formulas in the existing standards. Regression analysis was used to identify the coefficients of the new model. The results showed that the proposed formula had higher accuracy in the prediction of the joint shear strength, for 30 experimental results investigated, compared to the formulas mentioned in the regulations (American standard ACI and Japanese standard AJI).
The new formula provided satisfying results in the case of experimental results collected from the literature, and also for two numerical cases performed in the present study. Further investigations with a larger number of specimens will be interesting to verify the relevancy of the proposed model.
Acknowledgments
Anonymous reviewers are warmly thanked for their pertinent comments which enable to improve the quality of this article.
Author Contributions
Minh-Tung Tran proposed the first ideas about the modified model. Nhat-Tien Nguyen worked on the statistical analyses, under the supervision of Minh-Tung Tran. Trung-Hieu Duong worked on the numerical studies of the T-form structures, under the supervision of Quoc-Bao Bui. Bastian Sentosa worked on the experimental studies of a T-form structure, under the supervision of Bui and Olivier Plé. The paper was wrote by Minh-Tung Tran and Quoc-Bao Bui.
Conflicts of Interest
The authors declare no conflict of interest.
References
- Bui, Q.B.; Mommessin, M.; Perrotin, P.; Plassiard, J.P.; Plé, O. Assessing local-scale damage in reinforced concrete frame structures using dynamic measurements. Eng. Struct. 2014, 79, 22–31. [Google Scholar] [CrossRef]
- Chalioris, C.E.; Bantilas, K.E. Shear strength of reinforced concrete beam-column joints with crossed inclined bars. Eng. Struct. 2017, 140, 241–255. [Google Scholar] [CrossRef]
- Hwang, S.-J.; Lee, H.J. Analytical Model for Predicting Shear Strengths of Exterior Reinforced Concrete Beam-Column Joints for Seismic Resistance. ACI Struct. J. 1999, 97, 846–858. [Google Scholar]
- Tran, T.M.; Hadi, M.N.S.; Pham, T.M. A new empirical model for shear strength of reinforced concrete beam-column connections. Mag. Concr. Res. 2014, 66, 514–530. [Google Scholar] [CrossRef]
- Tsonos, A.G. Cyclic load behaviour of reinforced concrete beam-column subassemblages of modern structures. ACI Struct. J. 2007, 194, 468–478. [Google Scholar]
- ACI-ASCE Joint Committee 352 (Ed.) Recommendations for Design of Beam-Column Joints in Monolithic Reinforced Concrete Structures; ACI 352R-02; American Concrete Institute: Farmington Hills, MI, USA, 2002. [Google Scholar]
- Architectural Institute of Japan (AIJ). Design Guideline for Earthquake Resistance Reinforced Concrete Buildings Based on Inelastic Displacement Concept; Architectural Institute of Japan: Tokyo, Japan, 1997. (In Japanese) [Google Scholar]
- Eurocode 8: Design of Structures for Earthquake Resistance. Part 1: General Rules, Seismic Actions and Rules for Buildings; British Standards Institution (BSI): London, UK, 2004.
- Chun, S.; Bae, M.S. Model for Side-Face Blowout Strength of Large-Diameter Headed Bars in Beam-Column Joint. In Proceedings of the The 2016 Structures Congress, Jeju Island, Korea, 28 August–1 September 2016; p. 6. [Google Scholar]
- Dhake, P.D.; Patil, H.S.; Patil, Y.D. Anchorage behaviour and development length of headed bars in exterior beam-column joints. Mag. Concr. Res. 2015, 67, 53–62. [Google Scholar] [CrossRef]
- Lee, H.J.; Yu, S.Y. Cyclic Response of Exterior Beam-Column Joints with Different Anchorage Methods. ACI Struct. J. 2009, 106, 329–339. [Google Scholar]
- Hadi, M.N.S.; Tran, T.M. Retrofitting Nonseismically Detailed Exterior Beam-Column Joints Using Concrete Covers Together with CFRP Jacket. Constr. Build. Mater. 2014, 63, 161–173. [Google Scholar] [CrossRef]
- Lima, C.; Martinelli, E.; Faella, C. Capacity models for shear strength of exterior joints in RC frames: State-of-the-art and synoptic examination. Bull. Earthq. Eng. 2012, 10, 967–983. [Google Scholar] [CrossRef]
- Park, S.; Mosalam, K.M. Parameters for shear strength prediction of exterior beam–column joints without transverse reinforcement. Eng. Struct. 2012, 36, 198–209. [Google Scholar]
- Lim, K.-M.; Shin, H.-O.; Kim, D.-J.; Yoon, Y.-S.; Lee, J.-H. Numerical Assessment of Reinforcing Details in Beam-Column Joints on Blast Resistance. Int. J. Concr. Struct. Mat. 2016, 10, 87–96. [Google Scholar] [CrossRef]
- Kang, T.H.K.; Mitra, N. Prediction of performance of exterior beam-column connections with headed bars subject to load reversal. Eng. Struct. 2012, 41, 209–217. [Google Scholar] [CrossRef]
- Pantazopoulou, S.; Bonacci, J. Consideration of Questions about Beam-Column Joints. ACI Struct. J. 1992, 89, 27–36. [Google Scholar]
- Building Code Requirements for Structural Concrete and Commentary; ACI 318-08; American Concrete Institute: Farmington Hills, MI, USA, 2008.
- NZS-3101: Concrete Structures Standard. Part 1: The Design of Concrete Structures; Standards Association of New Zealand: Wellington, New Zealand, 1995.
- Adachi, M.; Masuo, K. The Effect of Orthogonal Beams on Ultimate Strength of R/C Exterior Beam-Column Joint using Mechanical Anchorages. Proc. Archit. Inst. Jpn. 2007, 633–634. (In Japanese) [Google Scholar]
- Kiyohara, T.; Tasai, A.; Watanabe, K.; Hasegawa, Y.; Fujimoto, T. Seismic Capacity of High Strength RC Exterior Beam Column Joint with Beam Main Bars Anchored Mechanically. Proc. Archit. Inst. Jpn. 2004, 27–34. (In Japanese) [Google Scholar]
- Kiyohara, T.; Hasegawa, Y.; Fujimoto, T.; Akane, J.; Amemiya, M.; Tasai, A. Seismic Performance of High Strength RC Exterior Beam Column Joint with Beam Main Bars Anchored. Proc. Archit. Inst. Jpn. 2005, 33–42. (In Japanese) [Google Scholar]
- Masuo, K.; Adachi, M.; Imanishi, T. Ultimate Strength of R/C Exterior Beam-Column Joint Using Mechanical Anchorage for Beam Reinforcement USD590. Proc. Archit. Inst. Jpn. 2006, 25–28. (In Japanese) [Google Scholar]
- Murakami, M.; Fuji, T.; Kubota, T. Failure Behavior of Beam-Column Joints with Mechanical Anchorage in Subassemblage Frames. Concr. Res. Technol. 1998, 8, 1–9. (In Japanese) [Google Scholar]
- Takeuchi, H.; Kishimoto, T.; Hattori, S.; Nakamura, K.; Hosoya, H.; Ichikawa, M. Development of Mechanical Anchorage Used Circular Anchor Plate. Proc. Archit. Inst. Jpn. 2001, 111–114. (In Japanese) [Google Scholar]
- Tasai, A.; Kawakatsu, K.; Kiyohara, T.; Murakami, M. Shear Performance of Exterior Beam Column Joint with Beam Main Bars Anchored Mechanically. Proc. Archit. Inst. Jpn. 2000, 857–860. (In Japanese) [Google Scholar]
- Kim, J.; LaFave, J.M. Key influence parameters for the joint shear behaviour of reinforced concrete (RC) beam-column connections. Eng. Struct. 2007, 29, 2523–2539. [Google Scholar] [CrossRef]
- LaFave, J.M.; Kim, J. Joint Shear Behavior Prediction for RC Beam-Column Connections. Int. J. Concr. Struct. Mat. 2011, 5, 57–64. [Google Scholar] [CrossRef]
- Sentosa, B. Assessing the Structural Elements of Reinforced Concrete Building Using Dynamic Measurements. Ph.D. Thesis, University Savoie Mont Blanc, Chambéry, France, 2018. [Google Scholar]
Figure 1.
Example of headed bars.

Figure 2.
Comparison between the provided and the required beam bar development length.

Figure 3.
The relationship between the tested joint shear stress and the concrete compressive strength.
Figure 3.
The relationship between the tested joint shear stress and the concrete compressive strength.
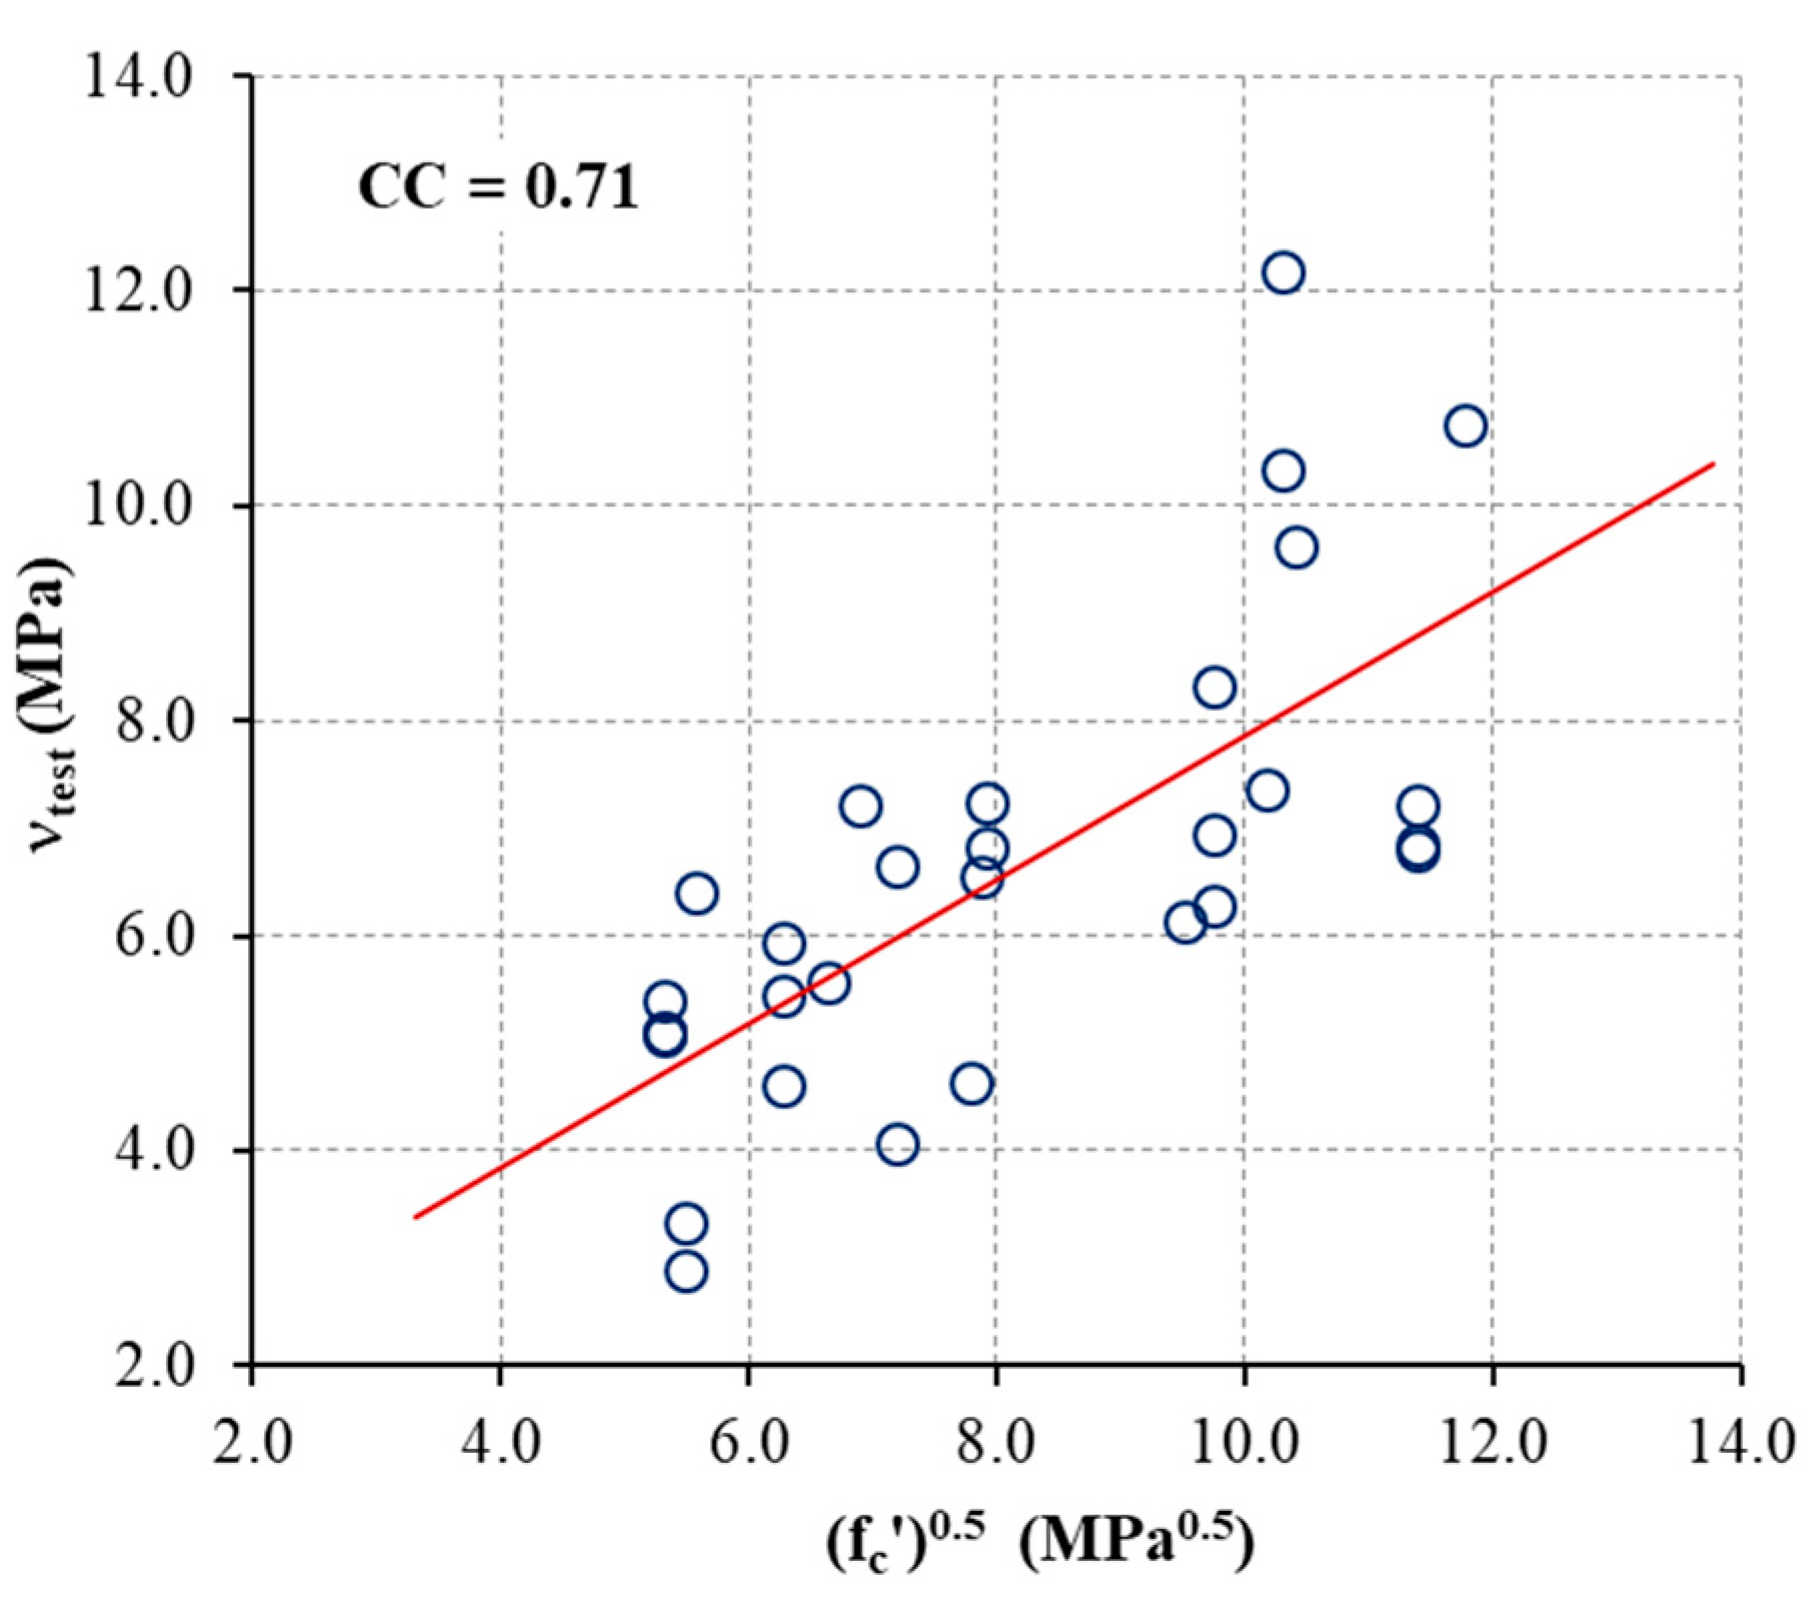
Figure 4.
The relationship between the tested joint shear stress and the index of the beam bars details.
Figure 4.
The relationship between the tested joint shear stress and the index of the beam bars details.
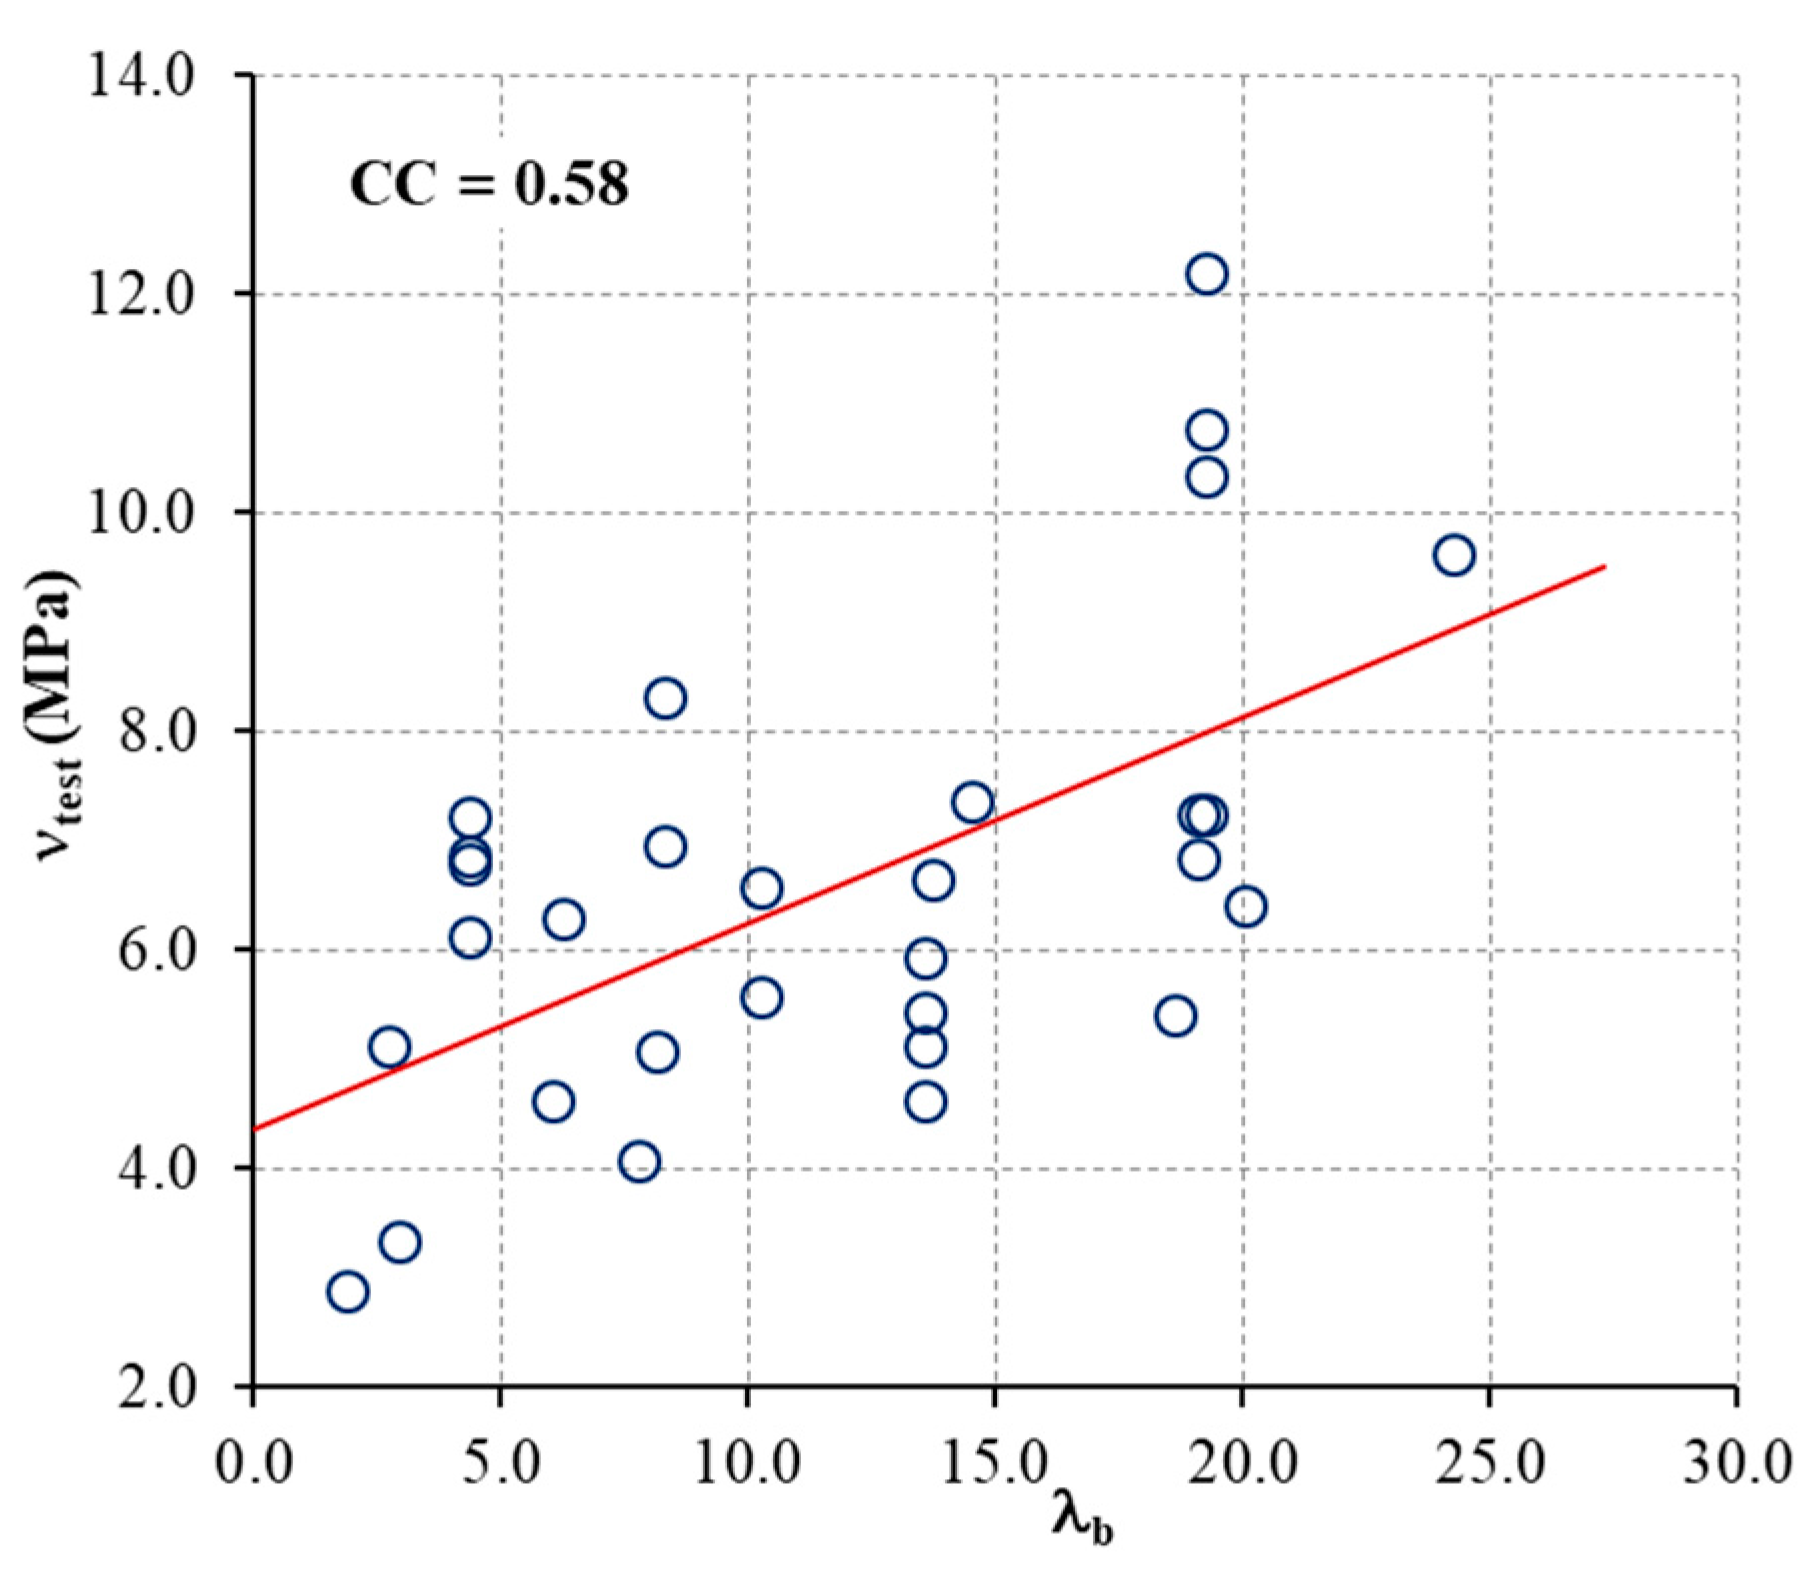
Figure 5.
The relationship between the tested joint shear stress and the normalized joint shear reinforcement.
Figure 5.
The relationship between the tested joint shear stress and the normalized joint shear reinforcement.

Figure 6.
Comparison of the experimental results (Vtest) with that obtained by ACI (VACI), AIJ (VAIJ) and the proposed model (Vmodel).
Figure 6.
Comparison of the experimental results (Vtest) with that obtained by ACI (VACI), AIJ (VAIJ) and the proposed model (Vmodel).

Figure 7.
T-form beam-column RC structure studied, dimensions in mm.

Figure 8.
Strain-stress curves of concrete (a) and steel (b).

Figure 9.
Numerical and experimental results of a T-form conventional RC structure, vertically loaded.
Figure 9.
Numerical and experimental results of a T-form conventional RC structure, vertically loaded.

Figure 10.
Modelling of a T-form RC structure in Abaqus, with concrete, steel reinforcement (a) and headed bars (b).
Figure 10.
Modelling of a T-form RC structure in Abaqus, with concrete, steel reinforcement (a) and headed bars (b).

Figure 11.
Deformation and stresses of the structures loaded vertically (a) and horizontally (b).


Table 1.
The collected database of exterior RC beam-column with headed bars.
| Authors | I.D | bb (mm) | hb (mm) | bc (mm) | hc (mm) | fc′ (MPa) | fyb (MPa) | db (mm) | lp (mm) | Vtest (kN) | Failure Mode | |
|---|---|---|---|---|---|---|---|---|---|---|---|---|
| Kiyohara et al. [22] | No. 1 | 450 | 600 | 500 | 550 | 95.1 | 710 | 29 | 365 | 5.7 | 1913.6 | BJ |
| No. 2 | 450 | 600 | 500 | 550 | 95.1 | 710 | 29 | 365 | 5.7 | 2285.9 | BJ | |
| No. 5 | 450 | 600 | 500 | 550 | 95.1 | 710 | 29 | 276 | 5.7 | 1727.2 | BJ | |
| Kiyohara et al. [21] | No. 6 | 450 | 600 | 500 | 550 | 106.2 | 1034 | 29 | 365 | 5.7 | 2842.8 | J |
| No. 7 | 450 | 600 | 500 | 550 | 138.6 | 1034 | 29 | 365 | 5.7 | 2957.6 | J | |
| No. 8 | 450 | 600 | 500 | 550 | 47.6 | 1034 | 29 | 365 | 5.7 | 1988.3 | J | |
| No. 9 | 450 | 600 | 500 | 550 | 106.2 | 1034 | 29 | 365 | 5.7 | 3352.2 | J | |
| No. 10 | 450 | 600 | 500 | 550 | 108.2 | 1034 | 29 | 461 | 5.7 | 2645.3 | J | |
| No. 11 | 450 | 600 | 500 | 550 | 103.4 | 689 | 29 | 276 | 5.7 | 2022.2 | BJ | |
| Adachi and Masuo [20] | J30-12-0 | 350 | 450 | 400 | 450 | 31.0 | 524 | 25 | 315 | 5.4 | 1151.2 | BJ |
| J60-12-0 | 350 | 450 | 400 | 450 | 62.7 | 524 | 25 | 300 | 5.4 | 1229.5 | BJ | |
| J60-12-P1 | 350 | 450 | 400 | 450 | 62.7 | 524 | 25 | 300 | 5.4 | 1304.2 | BJ | |
| Masuo et al. [23] | AH12-2-45 | 300 | 450 | 325 | 450 | 129.6 | 1020 | 25 | 300 | 5.8 | 1002.6 | BJ |
| AH12-2-40 | 300 | 450 | 325 | 400 | 129.6 | 1020 | 25 | 300 | 5.8 | 938.1 | BJ | |
| AH12-2-45A | 300 | 450 | 325 | 450 | 129.6 | 1020 | 25 | 300 | 5.8 | 994.2 | BJ | |
| AH8-2-45 | 300 | 450 | 325 | 450 | 90.3 | 1020 | 25 | 300 | 5.8 | 895.9 | BJ | |
| Tasai et al. [26] | No. 6 | 350 | 450 | 375 | 400 | 51.7 | 724 | 25 | 300 | 8 | 997.3 | J |
| No. 7 | 350 | 450 | 375 | 400 | 51.7 | 724 | 25 | 300 | 8 | 609.8 | BJ | |
| Takeuchi et al. [25] | 0–2 | 350 | 450 | 375 | 400 | 60.7 | 586 | 25 | 268 | 5.8 | 694.8 | BJ |
| 0–6 | 350 | 450 | 375 | 400 | 44.1 | 717 | 25 | 268 | 5.8 | 835.4 | J | |
| 0–7 | 350 | 450 | 375 | 400 | 62.1 | 717 | 25 | 268 | 5.8 | 984.8 | J | |
| Murakami et al. [24] | No. 102 | 300 | 300 | 300 | 300 | 39.3 | 945 | 19 | 224 | 2.1 | 534.2 | J |
| No. 103 | 300 | 300 | 300 | 300 | 39.3 | 945 | 19 | 224 | 5.8 | 415.9 | J | |
| No. 104 | 300 | 300 | 300 | 300 | 39.3 | 945 | 19 | 224 | 13.4 | 489.3 | J | |
| M8D16 | 300 | 300 | 300 | 300 | 28.3 | 1000 | 16 | 226 | 6 | 486.6 | J | |
| M4D19 | 300 | 300 | 300 | 300 | 28.3 | 1000 | 19 | 224 | 6 | 460.4 | J | |
| M3D19 | 300 | 300 | 300 | 300 | 28.3 | 1000 | 19 | 224 | 6 | 457.3 | J | |
| M2D22 | 300 | 300 | 300 | 300 | 28.3 | 972 | 22 | 224 | 6 | 459.9 | J | |
| Dhake et al. [10] | J4 | 150 | 180 | 150 | 200 | 30.0 | 525 | 12 | 132 | 4 | 99.8 | J |
| J5 | 150 | 180 | 150 | 200 | 30.0 | 525 | 12 | 84 | 4 | 86.6 | J |
Table 2.
Definitions and ranges of parameters in the collected database.
| Parameters | Symbol (Unit) | Range of the Parameters | |||
|---|---|---|---|---|---|
| Min. | Average | Max. | Variance | ||
| Concrete compressive strength | fc′ (MPa) | 28.3 | 69.7 | 138.6 | 13.6 |
| Specified yield stress of headed bars | fy (MPa) | 524 | 832 | 1034 | 391 |
| Normalized horizontal joint shear reinforcement | 0.0 | 0.13 | 0.24 | 0.003 | |
| Normalized vertical joint shear reinforcement | 0.0 | 0.63 | 1.47 | 0.09 | |
| Normalized joint shear reinforcement | 0.0 | 0.76 | 1.65 | 0.10 | |
| Column depth to beam height ratio | hc/hb | 0.89 | 0.96 | 1.11 | 0.004 |
| Column depth to beam bar diameter ratio | hc/db | 13.6 | 17.3 | 19.0 | 2.27 |
| Development length of the beam bars | lp/db | 7.0 | 11.8 | 15.9 | 2.24 |
| The index of the beam bars’ details | 1.9 | 11.7 | 24.3 | 4.1 | |
Table 3.
Comparison between the results obtained by the proposed formula and FEM.
| Maximum Load | Proposed Formula | FEM | Difference (%) |
|---|---|---|---|
| T 1 (vertical loading) | 20.60 kN | 17.52 kN | +17.6% |
| T 2 (horizontal loading) | 69.78 kN | 74.56 kN | −6.4% |
© 2018 by the authors. Licensee MDPI, Basel, Switzerland. This article is an open access article distributed under the terms and conditions of the Creative Commons Attribution (CC BY) license (http://creativecommons.org/licenses/by/4.0/).
Share and Cite
MDPI and ACS Style
Tran, M.-T.; Bui, Q.-B.; Sentosa, B.; Nguyen, N.-T.; Duong, T.-H.; Plé, O. Sustainable RC Beam-Column Connections with Headed Bars: A Formula for Shear Strength Evaluation. Sustainability 2018, 10, 401. https://doi.org/10.3390/su10020401
AMA Style
Tran M-T, Bui Q-B, Sentosa B, Nguyen N-T, Duong T-H, Plé O. Sustainable RC Beam-Column Connections with Headed Bars: A Formula for Shear Strength Evaluation. Sustainability. 2018; 10(2):401. https://doi.org/10.3390/su10020401
Chicago/Turabian StyleTran, Minh-Tung, Quoc-Bao Bui, Bastian Sentosa, Nhat-Tien Nguyen, Trung-Hieu Duong, and Olivier Plé. 2018. "Sustainable RC Beam-Column Connections with Headed Bars: A Formula for Shear Strength Evaluation" Sustainability 10, no. 2: 401. https://doi.org/10.3390/su10020401
Note that from the first issue of 2016, this journal uses article numbers instead of page numbers. See further details here.