Abstract
Understanding the urban expansion process along inter-city rail transit corridors is critical to regional integration of city groups. Though numerous studies have considered the influences of rail transit on land use and urban form, most have focused on local station areas or intra-city urban structures. Few studies have examined the effects and dynamic process along inter-city rail transit corridors at a regional scale. In this study, multi-remote sensing images, landscape metrics and gradient analysis were combined to investigate the spatial and temporal dynamics of urban expansion and regional structural changes along the GuangFo inter-city Metro in the Pearl River Delta, south China. We introduced Thiessen Polygon into quadrat zoning for landscape gradient analysis, and clearly revealed the spatial variations of landscape changes along the metro transect. The regional expansion stage and inter-city structural changes were further detected based on the theoretical framework of diffusion-coalescence growth. This study revealed that during its construction the GuangFo Metro significantly impacted urban expansion at the urban fringes. Before construction the urban patches became irregular and fragmented as the gradient moved from city centers to city fringes. Influenced by the GuangFo Metro, the urban patches expanded and consequently coalesced into a homogenous urbanized area, which indicated that coalescence was the dominant expansion stage and the regional structure become more aggregated. This suggested that the inter-city rail transit has played an important role in promoting the integration of the GuangFo metropolitan region.
1. Introduction
With the acceleration of the urbanization process, China’s urban population has experienced several decades of rapid growth [1,2]. The concentration of population in urban regions creates increasing pressures on urban and regional traffic systems [3]. As a rapid and efficient form of transportation, rail transit (i.e., metro rail and light rail) played a significant role in alleviating traffic congestion and promoting sustainable development of urban traffic system [4,5,6,7]. Many large cities in China were expanding their rail transit systems over the past two decades. Development of rail transit is particularly fast in economically advanced regions, such as the three megalopolitan regions of Beijing–Tianjin–Tangshan, the Yangtze River Delta and the Pearl River Delta (PRD). A number of inter-city rail transit systems have been preliminary built or in operation to strengthen the transportation connections between central and peripheral cities. For instance, two inter-city rail systems are planned in the PRD, including the GuangFo Inter-City Metro and GuangZhu Inter-City Light Rail [8].
Rail transit systems have essential impacts on land value, land use and urban form [9]. Numerous studies have empirically investigated the effects of urban rail transit (URT) stations on residential and commercial land values [7,10,11,12,13]. Recently, there has been a surge of interest in the influences of URT on land use and urban form in cities worldwide [14,15,16]. For example, Tan et al., (2017) indicated that low density residential land would be converted to high density residential land and commercial land with the influences of urban rail transit in Guangzhou [15]. Many studies confirmed the value of rail transit and the accompanying transit-oriented development (TOD) in promoting higher-density development and smart growth [17,18,19,20]. For instance, Ratner & Goetz (2013) analyzed TOD data of rail transit station areas in Denver and revealed that TOD contributes to increased density of urbanized area [18]. A study by Mu and Jong (2012) showed that effective TOD polices can provided promising prospects for shifting rapidly urbanizing Chinese Cities onto more sustainable urban development. This study also identified the conditions for effective TOD in Dalian the lessons of which can be transferred to other Chinese Cities [20]. Most of these studies focused on the impacts of URT on local station areas or the intra-city urban structure.
Recently, studies have also examined the spatial effects of high speed rail (HSR) upon land prices or urbanization at the local city level [21]. For example, Andersson et al. (2010) used empirical data to estimate the impacts of HSR accessibility on residential property prices around stations. The results showed that HSR accessibility has at most a minor effect on house prices [22]. Yao and Liu (2014) shed light upon the Beijing–Shanghai HSR with a particular focus on associated spatial effects on urban internal space [23]. Moreover, scholars discussed the regional impacts of HSR on economic integration and the rebalancing of metropolitan regions [24,25]. Unlike HSR, which links different metropolitan regions across long distances, inter-city rail transit commonly connects closely neighboring cities within a metropolitan region. It is important to characterize the expansion process across connecting cities with the influences of inter-city rail, because this is important for the integration and performance of metropolitan regions. However, little attention has been paid to the impact of inter-city rail transit systems on urban expansion process along transit corridors and regional spatial structure.
From local sprawl to regional expansion, the urban growth process is an important social and economic phenomenon in a fast-growing region and produces an effect on natural as well as human systems [26,27,28]. Landscape metrics are often used to quantify the structure and dynamic pattern of landscape [27,29,30]. Recently there has been new interest in using landscape metrics to evaluate the spatio-temporal process of urban evolution by using remote sensing data [31,32,33,34,35]. Particularly, the combination of landscape metrics with gradient paradigm has been prominent, so to systematically investigate the spatial properties of urban expansion along a specific transect [31,36]. Most of these studies focused on the urban growth process of individual cities at local scale. Yet urban expansion process across cities has rarely been examined, as well as the landscape gradient changes from city centers to city fringes at the regional level. Taubenböck et al. (2014) analyzed the spatial evolution in the mega-region of Hong Kong–Shenzhen–Guangzhou at regional scale. The findings proofed the coalescent process in the mega-region and revealed that the entire mega-region is developing toward spatial compactness [37]. But this research did not pay attention to the effects of inter-city transportation.
Inter-city rail transit is an important connection corridor that influences urban expansion and regional pattern changes. It is important to investigate the regional expansion process influenced by inter-city rail transit systems in metropolitan regions, especially in rapidly urbanizing countries such as China. This study observes and evaluates the regional impacts of inter-city rail in one of the fastest urbanizing regions within the PRD of south China, namely the Guangzhou–Foshan metropolitan region. Multi-temporal remote sensing data were used to analyze and compare both the spatial and temporal dynamics of urban expansion along the GuangFo metro corridor. By combining landscape metrics and gradient analysis, this study examines the spatial difference in landscape change from city centers to city fringes of the two cities, and further investigates the regional expansion mode and structural changes.
This study aims to address the following questions: (1) What is the effect of the GuangFo Inter-City Metro on urban expansion of the two cities? How did the spatial and temporal pattern of urban built-up areas evolve along the GuangFo metro corridor at the regional level? (2) How did the landscape metrics change along the GuangFo metro transect, from the city centers to the city fringes? Could we use landscape gradient analysis to detect the urban expansion process along the GuangFo railway corridor? (3) How did the landscape metrics of the GuangFo metro corridor change over time? Can these changes reveal the regional expansion phase in the context of urban growth theory? To figure out these questions, this paper is organized as follows. Section 2 introduces the study area. It is followed by Section 3, which describes the data and methodology. Section 4 presents the examination of the spatial and temporal dynamics of the urban expansion along GuangFo metro corridor. Finally, we discuss the findings and conclusions in Section 5.
2. Study Area
Located in the PRD, the Guangzhou–Foshan metropolitan region is the most developed area in China. This metropolitan region is identified as the core area for the economic growth of the PRD [38]. Within this metropolitan region, Guangzhou is situated in the northeast and Foshan is located in the southwest (Figure 1). As the third largest city of China, Guangzhou has a total area of 7434 km2 and a population of 12.70 million [39]. Along with Guangzhou’s rapid economic growth, its urban rail network has been progressively constructed since 1993. By the end of 2013, the mileage of the Guangzhou Metro reached 250.11 km, serving most of the city’s urban areas [4,40]. Foshan, located close to Guangzhou, is connected to its neighbor via highways and railways. Foshan has a total area of 3797 km2 and a population of 7.19 million [41].
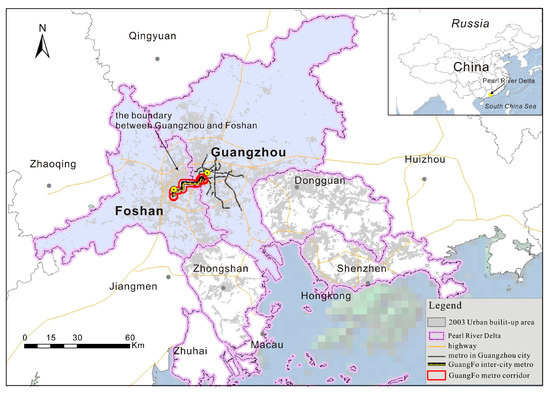
Figure 1.
The Study area.
Historically, Guangzhou and Foshan have long been in an integrated region, so that residents of both sides have worked and commuted between the two. However, after 1949 the administrative division of the two cities brought about the segregation or berries to further exchanges of the two sides. In response to these problems, in 2002 the two local governments proposed an integrated plan for the Guangzhou–Foshan metropolitan region to promote economic development, resource management and urban governance [38]. Under the direction of this plan, Guangzhou and Foshan governments strengthened their cooperation, among which the key is to construct GuangFo Metro, an inter-city railway to improve regional transportation. Hence, GuangFo Metro was developed in 2010 and became as China’s first inter-city rail transit system [42].
The GuangFo Metro (the first project) has a total length of 26.5 km, along which there are 18 stations. During the construction of the GuangFo Metro, 2003, 2007, and 2010 were the start years of planning, construction, and operation, respectively. Thus 2003–2007, 2007–2010 and 2010–2012 are considered as the corresponding periods of planning, construction, and operation in this study.
3. Data and Methodology
3.1. Data
To examine the temporal dynamics of urban expansion underlying the impacts of the GuangFo Metro, we will shed light upon three significant time points to address the issues of its planning, construction and operation. We will use multi-temporal Landsat TM5 images acquired in 2003, 2007, 2010 and 2012 to identify urban built-up areas. In details, we georeferenced these images to the Universal Transverse Mercator (UTM) projection with a registration error of less than 0.5 pixels, via ERDAS IMAGINE software (Hexagon Geospatial, Madison, AL, USA) With the use of the object-based classification methods, six types of land use classes (built-up area, farm land, forest, water, fishpond and bare soil) were identified from the image [43]. Furtherly, the output images were converted into binary urban/non-urban grids using ARCGIS software (ESRI, Redlands, CA, USA) to facilitate quantitative analysis of urban expansion [44].
3.2. Methods
• Urbanization rate (UR) and urban expansion rate (UER)
Various indices are used to measure urban expansion [45]. To examine the spatial distribution and rate of urban expansion we adopted two indicators: urbanization rate (UR) and urban expansion rate (UER) [33,46]. UR can be used to depict the percentage of urban area within certain buffer zones of rail stations. UER can be adopted to indicate the changes in urban area per unit time over different periods of railway construction. These indicators are key indices for the evaluation of the spatial and temporal changes of urban expansion along a metro corridor. UR and UER are defined as follows [33,46]:
where is the urbanization rate at time , and is the urban expansion rate from time to . and indicate the urban area of the target unit at time and , respectively. is the total land area of the target unit at time , and is the interval of the study period (measured in years).
• Landscape metrics
We use spatial metrics to examine the resultant landscape changes together with the urban expansion along the GuangFo Metro. As urban built-up area is the thematic class of interest, we use class-level metrics for built-up area to identify the characteristics of urban spatial pattern and landscape. We use the public software FRAGSTATS version 3.3 to calculate the landscape metrics for urban built-up class [47]. Based on previous studies [26,30,34,37,48,49], six landscape metrics were carefully selected to quantify the pattern of urban process in Section 4.2, including Largest Path Index (LPI), Landscape Shape Index (LSI), Area weighted Mean Patch Fractal Dimension (FRAC_AM), Aggregation Index (AI), Patch Density (PD) and Patch Cohesion Index (COHESION). Additionally, three landscape metrics are used to identify the urban expansion phase in Section 4.3, including Patch Density (PD), Edge Density (ED) and Area weighted Mean Euclidian Nearest Neighbor Distance (ENN_AM).
• Thiessen Polygon and landscape gradient analysis
Previous studies zoned a transect into many quadrats based on equal distance when conducting landscape gradient analysis [31,49]. Because distances between rail stations vary, it is difficult to zone quadrats using the equal-distance method. In this study, the Thiessen Polygon method was introduced to zone quadrats from the rail transit transect for landscape gradient analysis. Thiessen Polygon, also called Voronoi Polygon, was presented by climatologist A. H. Thiessen for calculating mean precipitation depending on dispersedly located meteorological stations [50]. The procedures for Thiessen Polygon creation are as follows (Figure 2): (1) All adjacent meteorological stations are connected to form triangles; (2) The perpendicular bisector of each side of these triangles is drawn. The perpendicular bisectors around each meteorological station can then generate a polygon. The precipitation intensity of a polygon is estimated by the only meteorological station that it contains; this polygon is called the Thiessen polygon [50]. This method has been widely applied to spatial interpolation, and some researchers have recently employed it for zoning. For instance, Wang et al. (2014) applied Thiessen Polygon to transit traffic analysis and revealed that Thiessen Polygon could reflect transit travel characteristics [51]. We apply Thiessen Polygon here, taking the locations of railway stations as a reference for quadrant zoning. Based on the rules of Thiessen Polygon, each polygon (quadrat) contains only one rail transit station, and each point in a quadrat has the closest distance to the corresponding rail station. The landscape metrics are calculated for each quadrat, the polygon centroid of which is the corresponding rail station. Landscape gradient analysis from city centers to city fringes can be conducted along the GuangFo metro transect.
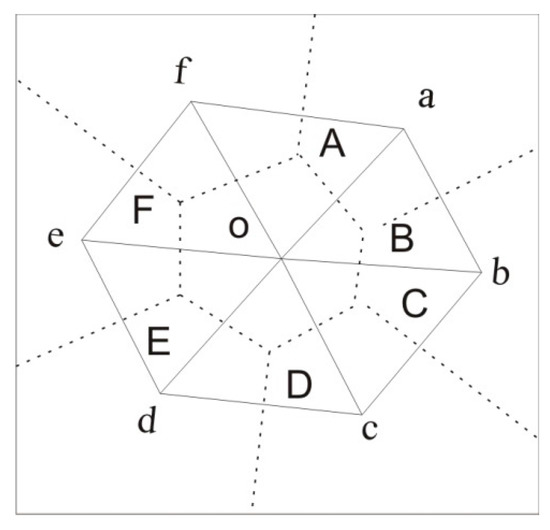
Figure 2.
Procedures for constructing Thiessen polygons [51].
According to the analysis results in Section 4.1, the significant influence extent of GuangFo Metro on urban expansion is 2 km. Hence, for gradient analysis we compute landscape metrics along a transect with dimensions of 26.5 km (length of the GuangFo Metro line) by 4 km (a 2-km buffer zone on either side of the metro line) (Figure 3). This transect was zoned into 18 quadrats via Thiessen Polygon analysis using the ArcGIS 10.3 software. Accordingly, we compute six selected landscape metrics for 18 quadrats, and the gradient change of landscape can be analyzed according to the distance from each quadrat centroid (station) to the boundary between the two cities.
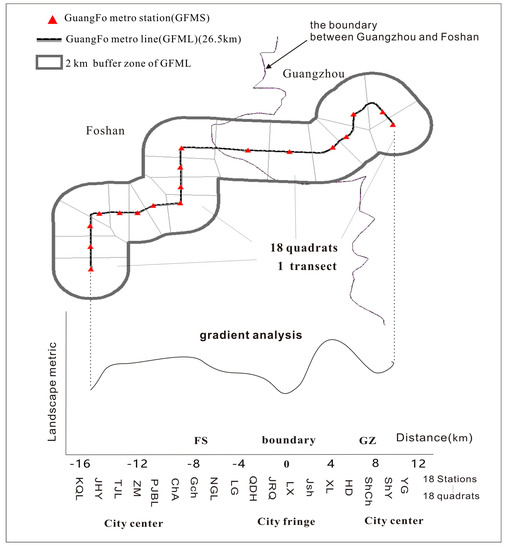
Figure 3.
Transect and quadrat zoning for landscape gradient analysis.
4. Results
4.1. The Spatio-Temporal Dynamics of Urban Expansion Along GuangFo Metro Corridor
To examine the spatial effects of GuangFo rail transit on urban expansion, we use different methods to make buffer zoning of GuangFo metro line. First, we divided the buffer zones at the regular intervals of 0.5 km and 1.0 km respectively. Then, the UER within various buffer zones were calculated for different periods using Equation (2). As presented in Figure 4A, the three curves rise rapidly in the first four buffer zones, and then followed by a downward trend. As 0.5 km is a relatively finer spatial resolution, the curves show a significant fluctuation. Figure 4B showed that the three curves all reach their peak value in the 1–2 km buffer zone when take 1.0 km as the buffer interval. After reaching the peak value, the UER decreases with increasing distance from the GuangFo metro line. The influence of the metro line on urban expansion is significant within the first two buffer zones. Further, we use a fuzzier method (0–0.5 km, 0.5 km–1.5 km, 1.5 km–2.5 km, 2.5 km–3.5 km, 3.5 km–4.5 km, 4.5 km–5.0 km) for buffer zoning. The results presented in Figure 4C showed that the UER index reach the peak value in the buffer zone of 1.5–2.5 km. However, the UER index in the 2.0–2.5 km buffer is significantly lower than that of 1.5–2.0 km. Hence, we can draw a conclusion that when the distance to the metro line exceeded 2 km, the effect was significantly decreased. Within various different buffer zones, the UER was highest during the construction period (2007–2010). This indicates that the effect of the GuangFo Metro on urban expansion was strongest during its construction period. Moreover, the effects were stronger during the planning period than the operational period.
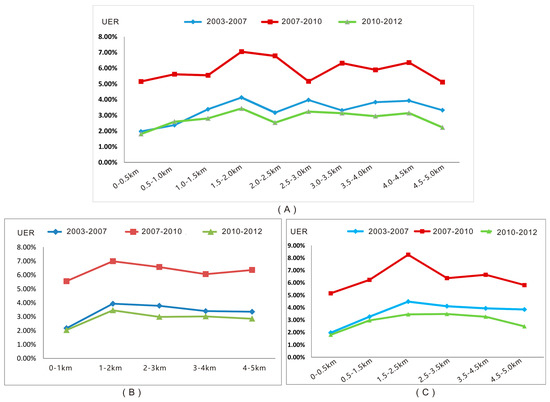
Figure 4.
Urban expansion rate (UER) within various buffer zones of the GuangFo Metro line over different periods.
Figure 5 shows the spatial expansion process within different buffer zones. From 2003 to 2012, significant changes in land use occurred along the GuangFo metro line. However, remarkable differences exist in the features of spatial expansions within different buffer zones. For example, in Figure 5A,B the urban expansion process can be observed distinctly at the fringes of the two cities within the 0–1 km and 1–2 km buffer zones of the metro line. In the 0–1 km buffer zone, the new urban built-up area was concentrated around the boundary between the two cities, particularly at such stations as JRQ, LX, and Jsh. Within the 1–2 km buffer zone, new urban built-up areas were also mainly distributed in the city fringes, but relatively decentralized. Moreover, the urban expansion process was almost irrelevant with the administrative boundaries in the 2–3 km, 3–4 km and 4–5 km buffer zone of the GuangFo metro line, as presented in Figure 5C–E. Within these buffer zones, the distribution of new urban areas was by no means systematic, and such areas appeared not only in the suburbs, but also in city centers. This suggests that the urban expansion area significantly influenced by the GuangFo Metro was located within 2 km of the metro line. When the distance to metro line was above 2 km, its effects turn to be smaller and irregular.
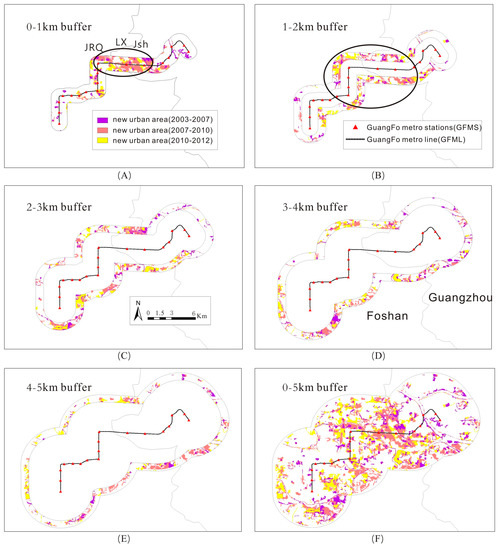
Figure 5.
Spatial expansion process along the GuangFo metro corridor within different buffer zone. ((A) 0–1 km buffer zone; (B) 1–2 km buffer zone; (C) 2–3 km buffer zone; (D) 3–4 km buffer zone; (E) 4–5 km buffer zone; (F) 0–5 km buffer zone).
The UR within the 0–2 km buffer zone of each station in 2003 was computed using Equation (1). The UER within the same buffer zone of each station was also calculated for the planning (2003–2007), construction (2007–2010), and operation (2010–2012) periods using Equation (2). As shown in Figure 6A, the UR within the 0–2 km buffer zone of most stations located in the city centers exceeded 70% in 2003, when the metro had not yet been planned. The metro stations were planned to be located in high-density areas of urban cores. High concentrations of population and economic activities, which bring travel demand, existed prior to the planning of the stations. Figure 6B shows that the UER of the stations in the city centers is extremely low during the three periods because these areas had reached a high urbanization level even before the planning of the metro. This suggested that high traffic demand remarkably affects the planning and construction of these stations.
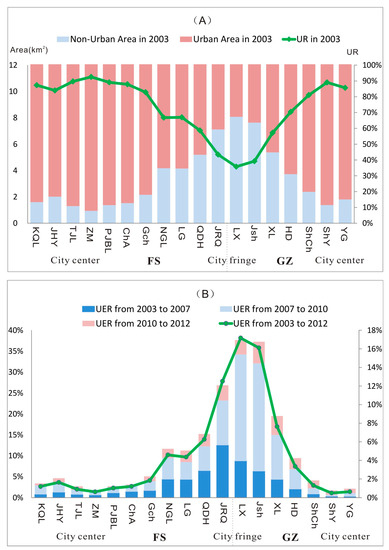
Figure 6.
Urbanization rate (UR) and UER within the 0–2 km buffer zone of each station.
Comparatively, the UR within the 0–2 km buffer zone of stations in the city fringes of Guangzhou and Foshan was smaller in 2003, as shown in Figure 6A. These stations were located in low-density areas with limited travel demands. As shown in Figure 6B, the UER of these stations was considerably higher than those of other stations. Additionally, these stations exhibited significant influences on urban expansion during the construction period (2007–2010). The planning and construction process of these metro stations considerably improved the accessibility of surrounding areas, increasing land values and causing a further accumulation of residents and commercial establishments. This suggested that metro planning guided urban expansion and traffic demand at the boundary of the two cities. Along with the development of the GuangFo Metro, the areas around the border of the two cities soon became new development corridors. Metro planning and construction significantly affected the integration of the Guangzhou-Foshan metropolitan area.
4.2. Landscape Gradient Analysis Along GuangFo Metro Transect
Six landscape metrics were selected to characterize the pattern of the urban process along the GuangFo metro corridor. These metrics of 18 quadrats were calculated at the urban built-up class level for four years (2003, 2007, 2010, and 2012). Figure 7 illustrates the variations in landscape metrics for the 18 quadrats located at different distances from the boundary between Guangzhou and Foshan. The curves of three metrics (LSI, PD, and FRAC_AM) formed an evident “inverted U” shape in 2003, 2007 and 2010, as shown in Figure 7A,C,D. Meanwhile, the curves of another three metrics formed a “U” shape in 2003, 2007, and 2010, as shown in Figure 7B,E,F. In 2012, after the metro line began its operation for two years, the variations in all the landscape metrics decreased along this transect.
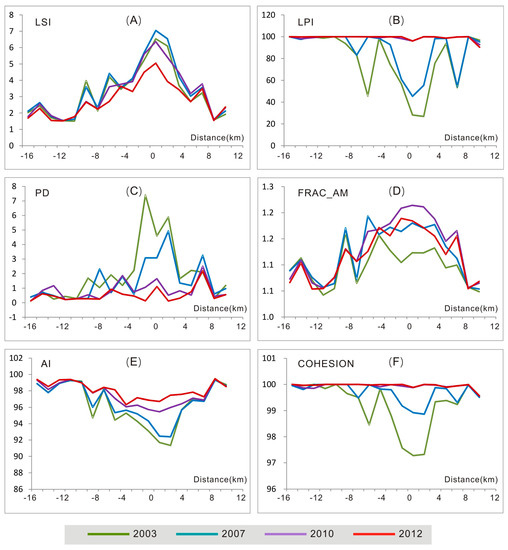
Figure 7.
Variations in landscape metrics for the 18 quadrats along the GuangFo metro transect.
The LSI metric is the measure of shape complexity. LSI increases with shape irregularities or landscape edges [47]. The variation in LSI illustrates the low complexity of the shape of the built-up area in the urban centers of these two cities. This variation also indicates the high shape irregularity at the urban fringes, as shown in Figure 7A. The peak values of LSI appeared at the fringe of Guangzhou City in 2003 and 2007, and at the boundary in 2010 and 2012. The LSI index for each quadrat gradually decreased from 2003 to 2012. This implies that urban area patches become increasingly regular with urban expansion, particularly at the city fringes along the metro corridor.
The LPI metric provides the proportion of the total area occupied by the largest patch with respect to the entire area of the urban built-up class [36]. When the entire landscape is composed of a single patch, the LPI will equal 100 [47]. As shown in Figure 7B, the LPI values of 2003, 2007, and 2010 are higher for the city centers and lower for the city fringes. The LPI value is 100 for most quadrats in 2012. This suggests that with urbanization the urban built-up area becomes more aggregated in the largest patch. Remarkable change thus has occurred at the city fringes of both Guangzhou and Foshan.
PD is expected to increase during the rapid development of urban nuclei, but may decrease if urban areas merge into a continuous urban fabric [36,47,49]. High PD values were observed at the city fringes in 2003 and 2007, before the construction of the GuangFo Metro, as shown in Figure 7C. This metric decreases significantly during the construction of the metro line. The PD values approach 0 in most quadrats in 2012, which describe the aggregated pattern along the transect.
Low values of FRAC_AM illustrate that a patch has a compact form, whereas high values indicate a complex and fragmented form [26]. Figure 7D shows that FRAC_AM increases from both ends of a transect toward the middle area. The patches are more complex and fragmented at the urban fringes than the urban centers. The landscape of the built-up area became more compact in 2012.
The AI metric only considers similar adjacencies that involve the focal class, but not adjacencies with other patch types. The maximum AI is achieved when the patch type consists of a single, compact patch [47]. The variation in AI along the GuangFo metro transect reveals the decline of aggregation from urban centers toward urban fringes, as shown in Figure 7E. AI increases rapidly after the construction of the metro line, showing that urban built-up areas become increasingly aggregated along the inter-city metro corridor with urban expansion.
Given that COHESION is a measure of physical connectedness, Figure 7F indicates that the physical connection between urban patches is low around the boundary of Guangzhou and Foshan. The COHESION index is lowest at the city fringe of Guangzhou. The COHESION index increases over time, which suggests that urban patches become more physically connected with construction of the metro. The index approaches 100 in most quadrats in 2010 and 2012, which indicates the aggregated characteristics along the metro transect after the running of the metro line.
4.3. Regional Expansion Stage with Influences of GuangFo Metro
The theoretical hypothesis of spatial and temporal urban evolution in regard to alternating processes of diffusion and coalescence was developed by Dietzel et al. (2005) [26]. This framework is on the base of the theory that urban growth exhibits wave-like properties [52] and urban phase theory [53,54]. Conceptually, urban growth can be characterized by a two-step process that consists of diffusion and coalescence, as shown in Figure 8A. The procedure begins with the expansion of the initial urban core area. With the growth of seeds, it disperses growth to new urban centers. The urban diffusion process is accompanied by an outward expansion of the existing urban areas and the infilling of gaps within these areas. As the procedure progresses, the urban diffusion reaches a turning point where those areas start to coalesce into a saturated urban region [26].
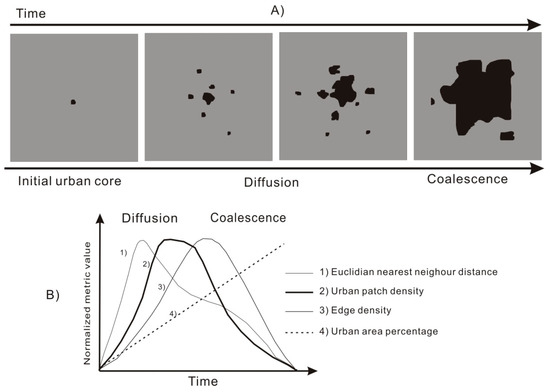
Figure 8.
Hypothetical framework of the diffusion-coalescence urban process [26].
Many studies have tested this hypothesized process of urban expansion by using landscape metrics [26,31,34,55,56] because such metrics can provide supporting evidence for the oscillating phases of diffusion and coalescence. Previous studies have indicated that the oscillation of urban expansion phases can be reflected by landscape metrics, such as the Euclidian nearest neighbor distance (ENN), urban patch density (PD), edge density (ED), and urban area percentage (UA) [26,34,57], as shown in Figure 8B. When the dominant phase of urban expansion is diffusion, ENN distances between individual urban patches may increase. The decline in the ENN metric may reflect the dominance of coalescence phases [34]. Additionally, a high urban PD reflects the predominance of the diffusion process and decreases when coalescence occurs [26]. The ED reaches a peak when the coalescence process results in large and heterogeneous urban areas, and then decreases as the procedure moves toward landscape urbanization. During the entire procedure, UA increases continuously with urban expansion.
As discussed in Section 4.1, urban areas grow consistently with urban expansion, which increases UA. Figure 9A,C,E illustrates the changes in the other three landscape metrics for urban areas within five interval buffer zones from 2003 to 2012. For the ENN_AM, PD, and ED metrics, the curve shape of the 0–1 km buffer zone resembles that of the 1–2 km buffer zone (all depicted with solid lines), which is different from the other three buffer zones (2–3, 3–4, and 4–5 km; depicted with dotted lines). Variation changes in landscape pattern over time were analogous within the first two buffer zones of the GuangFo metro line. This confirms once again that the GuangFo Metro had a significant effect on the area within a 2-km distance of the line.
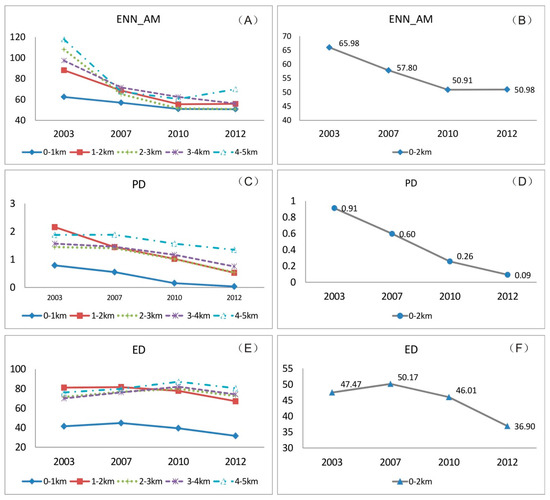
Figure 9.
Changes in landscape metrics for different buffer zones of GuangFo Metro over time.
The three landscape metrics were also calculated for the 0–2 km buffer zone of the metro. Figure 9B shows that the ENN_AM metric decreases from 2003 to 2010. The decline rate is considerably faster during the planning and construction periods than during the operational period. Urban patches along the metro transect became spatially aggregated during these periods. During the planning and construction phases of the GuangFo Metro, urban expansion accelerated and urban areas along this transect merged into a continuous urban fabric. This phenomenon can be characterized by the significant decline of the PD metric from 2003 to 2010, as shown in Figure 9D. An increase in ED was observed during the metro planning period, which was followed by a rapid decline during the construction and operation periods, as shown in Figure 9F. The agglomeration of urban patches around the metro stations became denser and more spatially regular during the last two periods.
The changing characteristics of the three landscape metrics observed over time (Figure 9B,D,F) indicated that coalescence was the main feature of urban expansion in the GuangFo metro corridor from 2003 to 2012 (Figure 10). Urban built-up patches around the city cores of Guangzhou and Foshan continuously expanded under the influence of metro planning and construction. Urban patches consequently coalesced into an increasingly homogenous landscape, accompanied by the infilling of gaps within the two urban centers. Consequently, the GuangFo Metro played an important role in promoting the integration of the Guangzhou-Foshan metropolitan region.
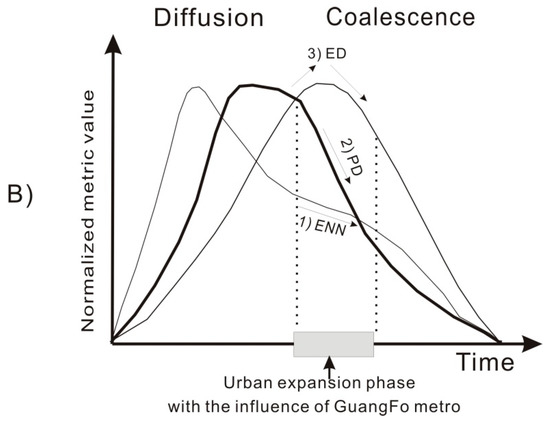
Figure 10.
Urban expansion phase along GuangFo metro corridor.
5. Conclusions and Discussion
Rail transit system has played important roles in reducing automobile usage and alleviating traffic congestion. The planning and construction of rail transit would cause land use development and change at station and corridor level. Studies have showed that rail transit and effective TOD can promote sustainable urban development. Despite the impacts of urban rail transit has long been studied on local station areas or the intra-city urban structure, little is known about the effects of inter-city rail transit on urban expansion along the transit corridor across cities or regional spatial structure. In this study, we investigated the spatial and temporal dynamics of urban expansion at the regional level, looking at landscape changes along the GuangFo inter-city metro corridor.
Landscape metrics combined with gradient analysis are often used to investigate the spatial characteristics of urban expansion along a specific transect. Previous studies zoned a transect based on equal distance when conducting landscape gradient analysis. This equal-distance method cannot be applied to the research in this paper as distances between rail stations vary. Hence, we introduced Thiessen Polygon to quadrat zoning for landscape gradient analysis and clearly revealed the different spatial effects of the GuangFo Metro on landscape change from city centers to city fringes. The combination of landscape metrics and Thiessen Polygon based gradient analysis can characterize the complex spatial dynamics of urban expansion along an inter-city rail corridor well. Based on the theoretical framework of diffusion-coalescence growth, we also detected landscape changes over time and revealed the dominant regional expansion phase with the influences of the inter-city metro. The results further confirm the important role of the GuangFo Metro for regional integration. This study provides an effective way to quantify and understand the spatial and temporal dynamics of urban expansion along inter-city rail transit at the regional level, and link these dynamics to the landscape changes and regional expansion phase.
By using two indices (UR and UER), regularities in the spatial urban expansion process along the GuangFo Metro corridor were detected and characterized over different periods, including planning (2003–2007), construction (2007–2010), and operation (2010–2012). The GuangFo metro line exhibited the greatest effect on urban expansion during the construction period. It is of great significance to compare the influences among different periods in order to examine the temporal effect of rail transit. In addition, the inter-city metro significantly affected the area within 2 km of the metro line. Furthermore, significant changes in the urban areas along the GuangFo metro corridor could be observed at the city fringes than the city centers. The results also show that traffic demand affects metro planning for stations around city centers, while metro planning guides urban expansion at the city fringes. This reveals the spatial differentiation of interactions between the inter-city metro and urban expansion along the corridor. These findings have answered the first research question addressed in the introduction. To answer the second addressed research question, six landscape metrics were selected for gradient analysis at the urban-class level to characterize the spatial urban expansion process along the metro corridor. Thiessen Polygon was applied to zone the quadrats along the GuangFo metro transect to ensure each quadrat contains only one station. The variations in landscape metrics of the zoning quadrats were investigated at different distances from the boundary of Guangzhou and Foshan. The curves of the LSI, FRAC_AM, and PD metrics formed an “inverted U” shape in 2003 and 2007 when the metro had not yet opened. The peak values of these indices mainly appeared around the boundary of these two cities. In contrast, LPI, COHESION, and AI formed a “U” shape, with the peak values typically appearing around the two city centers. Urban patches became more complex, irregular, and fragmented as the gradient moved from urban centers to urban fringes before the construction of the metro. The results also reveal that urban areas became increasingly compact and aggregated at the city fringes with the processes of metro construction.
Further, to answer the third research question in the introduction, three landscape metrics were further employed to identify the urban expansion phase in the context of the hypothesized urban growth process. Changes in the ENN, PD, and ED metrics reflected the dominance of the coalescence phase along the GuangFo metro corridor from 2003 to 2012. With the influence of the metro, urban built-up patches around the two city cores continued to expand, and consequently coalesced into a homogenous urbanized landscape. In Taubenböck’s et al., 2014 study, changes in landscape metric have proofed the coalescent process in the Guangzhou–Foshan metropolitan region and revealed that it is becoming compact with the regional expansion process [37]. Our research findings are consistent with that of Taubenböck’s. But Taubenböck’s did not evaluate the effects of inter-city transportation. The results of this paper demonstrate that the GuangFo Inter-city Metro acts a pivotal part in accelerating the integration of Guangzhou and Foshan. The findings will be useful for inter-city rail transit planning and regional integration of metropolitan regions in rapidly urbanizing countries such as China.
In fact, this paper mainly evaluated the spatial and temporal evolution of urban landscape pattern along GuangFo inter-city rail transit corridor. The observed results indicated that urban expansion was mainly driven by patch infilling with influences of this rail transit and coalescence was the dominant expansion stage. Coalescence Process may result in more compact structures of urban land and less shape irregularities [33]. Also patch infilling represents minimal energy consumption and resource savings with urban growth [58]. Nevertheless, increasing urbanization and the corresponding land use changes may induce serious environmental issues which threaten urban sustainable development [31,34,59]. Thus, the environmental consequences of this form of regional expansion are worthy of further research. Future efforts are required to examine how different types of land use evolve and the ecological effects. This can help policy makers to balance the advantages and disadvantages of inter-city rail transit planning comprehensively. Moreover, the construction of rail transit provides an effective way to decrease car usage and benefit from low energy consumption and air pollution [60]. On the other hand, this kind of transportation infrastructures put pressure on local urban communities in terms of environmental stressors (e.g., noise, vibration) [61]. The environmental stressors influence the nearby residents’ health, well-being and quality of life more or less [62,63]. Understanding the environmental impacts of rail transit from different perspectives can provide important implication for transportation planning and urban design. Therefore, our future research also will incorporate more state-of-the-art modeling techniques, such as simulation models [64,65], to facilitate the evaluation of transportation and land use designs.
Acknowledgments
This study was supported by the National Natural Science Foundation of China (Grant No. 41401432, 41601404); the Project of International as well as Hongkong, Macao and Taiwan Science and Technology Cooperation Innovation Platform in Universities in Guangdong Province (Grant No. 2014KGJHZ009). We have received funds for covering the costs to publish in open access.
Author Contributions
Shaoying Li and Xiaoping Liu conceived and designed the experiments; Shaoying Li made substantial contributions to design, data processing and analysis; Zhigang Li revised the paper critically; Zijun Yan contributed to data processing and analysis; Yimin Chen contributed original Landsat TM images and land-use classification data. Feng Gao made minor revision for the paper; Shaoying Li wrote the paper; Zhifeng Wu gave valuable suggestions for the revision of the paper; All authors had read and approved the final manuscript.
Conflicts of Interest
The authors declare no conflict of interest.
References
- Chen, M.X.; Liu, W.D.; Tao, X.L. Evolution and assessment on China’s urbanization 1960–2010: Under-urbanization or over-urbanization? Habitat Int. 2013, 38, 25–33. [Google Scholar] [CrossRef]
- Ji, W.; Wang, Y.; Zhuang, D.F.; Song, D.P.; Shen, X.; Wang, W.; Li, G. Spatial and temporal distribution of expressway and its relationships to land cover and population: A case study of Beijing, China. Transp. Res. Part D Transp. Environ. 2014, 32, 86–96. [Google Scholar] [CrossRef]
- Li, H.; Peng, J.; Liu, W.R.; Huang, Z.W. Stationary Charging Station Design for Sustainable Urban Rail Systems: A Case Study at Zhuzhou Electric Locomotive Co., China. Sustainability 2015, 7, 465–481. [Google Scholar] [CrossRef]
- Jiao, L.D.; Shen, L.Y.; Shuai, C.Y.; Tan, Y.T.; He, B. Measuring Crowdedness between Adjacent Stations in an Urban Metro System: A Chinese Case Study. Sustainability 2017, 9, 2325. [Google Scholar] [CrossRef]
- Loo, B.P.Y.; Chen, C.; Chan, E.T.H. Rail-based transit-oriented development: Lessons from New York City and Hong Kong. Landsc. Urban Plan. 2010, 97, 202–212. [Google Scholar] [CrossRef]
- Cao, X.Y.; Schoner, J. The influence of light rail transit on transit use: An exploration of station area residents along the Hiawatha line in Minneapolis. Transp. Res. Part A Policy Pract. 2014, 59, 134–143. [Google Scholar] [CrossRef]
- Zhang, X.; Liu, X.X.; Hang, J.Q.; Yao, D.B.; Shi, G.P. Do Urban Rail Transit Facilities Affect Housing Prices? Evidence from China. Sustainability 2016, 8, 380. [Google Scholar] [CrossRef]
- Hou, Q.; Li, S.M. Transport infrastructure development and changing spatial accessibility in the Greater Pearl River Delta, China, 1990–2020. J. Transp. Geogr. 2011, 19, 1350–1360. [Google Scholar] [CrossRef]
- Dziauddin, M.F.; Powe, N.; Alvanides, S. Estimating the Effects of Light Rail Transit (LRT) System on Residential Property Values Using Geographically Weighted Regression (GWR). Appl. Spat. Anal. Policy 2015, 8, 1–25. [Google Scholar] [CrossRef]
- Bowes, D.R.; Ihlanfeldt, K.R. Identifying the impacts of rail transit stations on residential property values. J. Urban Econ. 2001, 50, 1–25. [Google Scholar] [CrossRef]
- Du, H.B.; Mully, C. The short-term land value impacts of urban rail transit quantitative evidence from Sunderland, UK. Land Use Policy 2007, 24, 223–233. [Google Scholar] [CrossRef]
- Debrezion, G.; Pels, E.; Rietveld, P. The impact of rail transport on real estate prices on empirical analysis of the dutch housing market. Urban Stud. 2011, 48, 997–1015. [Google Scholar] [CrossRef]
- Pagliara, F.; Papa, E. Urban rail systems investments: An analysis of the impacts on property values and residents’ location. J. Transp. Geogr. 2011, 19, 200–211. [Google Scholar] [CrossRef]
- Hurst, N.B.; West, S.E. Public transit and urban redevelopment: The effect of light rail transit on land use in Minneapolis, Minnesota. Reg. Sci. Urban Econ. 2014, 46, 57–72. [Google Scholar] [CrossRef]
- Tan, Z.Z.; Li, S.Y.; Li, X.; Liu, X.P.; Chen, Y.M.; Li, W.X. Spatio-temporal effects of urban rail transit on complex land-use change. Acta Geogr. Sin. 2017, 72, 850–862. [Google Scholar]
- Liu, S.Q.; Guo, J.; Li, R.X.; Li, Q. Analysis of Land Use around Typical Rail Transport Stations in Beijing. J. Chin. Urban Dev. Stud. 2014, 21, 66–71. [Google Scholar]
- Knowles, R.D. Transit Oriented Development in Copenhagen, Denmark: From the Finger Plan to Orestad. J. Transp. Geogr. 2012, 22, 251–261. [Google Scholar] [CrossRef]
- Ratner, K.A.; Goetz, A.R. The reshaping of land use and urban form in Denver through transit-oriented development. Cities 2013, 30, 31–46. [Google Scholar] [CrossRef]
- Sung, H.; Oh, J.T. Transit-oriented development in a high-density city: Identifying its association with transit ridership in Seoul, Korea. Cities 2011, 28, 70–82. [Google Scholar] [CrossRef]
- Mu, R.; Jong, M.D. Establishing the conditions for effective transit-oriented development in China: The case of Dalian. J. Transp. Geogr. 2012, 24, 234–249. [Google Scholar] [CrossRef]
- Monzon, A.; Ortega, E.; Lopez, E. Efficiency and spatial equity impacts of high-speed rail extensions in urban areas. Cities 2013, 30, 18–30. [Google Scholar] [CrossRef]
- Andersson, D.E.; Shyr, O.F.; Fu, J. Does high-speed rail accessibility influence residential property prices? Hodonic estimates from southern Taiwan. J. Transp. Geogr. 2010, 18, 166–174. [Google Scholar] [CrossRef]
- Yao, H.; Liu, Z. The Spatial Effects of High Speed Rail on Intermediate Cities in China—A Case Study of Beijing-Shanghai Express Railway. In Proceedings of the 2nd International Symposium on Rail Transit Comprehensive Development (ISRTCD), Beijing, China, 11 January 2013; pp. 295–315. [Google Scholar]
- Zhang, X.L.; Nie, Q.K. High-speed Rail Construction and the Regional Economic Integration in China. J. Chin. Mod. Urban Res. 2010, 6, 7–10. [Google Scholar]
- Chen, C.L. Reshaping Chinese space-economy through high-speed trains: Opportunities and challenges. J. Transp. Geogr. 2012, 22, 312–316. [Google Scholar] [CrossRef]
- Dietzel, C.; Herold, M.; Hemphill, J.J.; Clark, K.C. Spatio-temporal dynamics in California’s Central Valley: Empirical links to urban theory. Int. J. Geogr. Inf. Sci. 2005, 19, 175–195. [Google Scholar] [CrossRef]
- Herold, M.; Couclelis, H.; Clarke, K.C. The role of spatial metrics in the analysis and modeling of urban land use change. Comput. Environ. Urban Syst. 2005, 29, 369–399. [Google Scholar] [CrossRef]
- Liu, Y.L.; Hu, Y.M.; Long, S.Q.; Liu, L.; Liu, X.P. Analysis of the Effectiveness of Urban Land-Use-Change Models Based on the Measurement of Spatio-Temporal, Dynamic Urban Growth: A Cellular Automata Case Study. Sustainability 2017, 9, 796. [Google Scholar] [CrossRef]
- O’Neill, R.V.; Krummel, J.R.; Gardner, R.H. Indices of landscape pattern. Landsc. Ecol. 1998, 1, 153–162. [Google Scholar] [CrossRef]
- Araya, Y.H.; Cabral, P. Analysis and modeling of urban land cover change in Setúbal and Sesimbra, Portugal. Remote Sens. 2010, 2, 1549–1563. [Google Scholar] [CrossRef]
- Yu, X.J.; Ng, C.N. Spatial and temporal dynamics of urban sprawl along two urban-rural transects: A case study of Guangzhou, China. Landsc. Urban Plan. 2007, 79, 96–109. [Google Scholar] [CrossRef]
- Wang, J.; Fang, C. Growth of urban construction land: Progress and prospect. Prog. Geogr. 2011, 30, 1440–1448. [Google Scholar]
- Xu, X.L.; Min, X.B. Quantifying spatiotemporal patterns of urban expansion in China using remote sensing data. Cities 2013, 25, 104–113. [Google Scholar] [CrossRef]
- Nassar, A.K.; Blackburn, G.A.; Whyatt, D. Developing the desert: The pace and process of urban growth in Dubai. Comput. Environ. Urban Syst. 2014, 45, 50–62. [Google Scholar] [CrossRef]
- Taubenböck, H.; Wegmann, M.; Roth, A.; Mehl, H.; Dech, S. Urbanization in India-spatiotemporal analysis using remote sensing data. Comput. Environ. Urban Syst. 2009, 33, 179–188. [Google Scholar] [CrossRef]
- Fan, F.L.; Wang, Y.P.; Qiu, M.H.; Wang, Z.S. Evaluating the temporal and spatial urban expansion patterns of Guangzhou from 1979 to 2003 by Remote Sensing and GIS Methods. Int. J. Geogr. Inf. Sci. 2009, 23, 1371–1388. [Google Scholar] [CrossRef]
- Taubenböck, H.; Wiesner, M.; Felbier, A.; Marconcini, M.; Esch, T.; Dech, S. New dimensions of urban landscapes: The spatio-temporal evolution from a poly nuclei area to a mega-region based on remote sensing data. Appl. Geogr. 2014, 47, 137–153. [Google Scholar] [CrossRef]
- Ye, L. State-led metropolitan governance in China: Making integrated city regions. Cities 2014, 41, 200–208. [Google Scholar] [CrossRef]
- Statistics Bureau of Guangzhou. Guangzhou Statistical Yearbook 2011; Statistics Bureau of Guangzhou: Guangzhou, China, 2011. [Google Scholar]
- Chen, S.C.; Claramunt, C.; Ray, C. A spatio-temporal modelling approach for the study of the connectivity and accessibility of the Guangzhou metropolitan network. J. Transp. Geogr. 2014, 36, 12–23. [Google Scholar] [CrossRef]
- Statistics Bureau of Foshan. Foshan Statistical Yearbook 2011; Statistics Bureau of Foshan: Foshan, China, 2011. [Google Scholar]
- Li, X.P.; Tao, Y.; Shi, Q. Applicative suburban line pattern of urban rail transit in China. Proc. Soc. Behav. Sci. 2013, 96, 2260–2266. [Google Scholar] [CrossRef][Green Version]
- Chen, Y.M.; Li, X.; Liu, X.P.; Ai, B. Modeling urban land-use dynamics in a fast developing city using the modified logistic cellular automaton with a patch-based simulation strategy. Int. J. Geogr. Inf. Sci. 2014, 28, 234–255. [Google Scholar] [CrossRef]
- Aljoufie, M.; Zuidgeest, M.; Brussel, M. Spatial-temporal analysis of urban growth and transportation in Jeddah City, Saudi Arabia. Cities 2013, 31, 57–68. [Google Scholar] [CrossRef]
- Jat, M.K.; Garg, P.K.; Khare, D. Monitoring and modelling of urban sprawl using remote sensing and GIS techniques. Int. J. Appl. Earth Obs. Geoinf. 2008, 10, 26–43. [Google Scholar] [CrossRef]
- Ma, Y.; Xu, R. Remote sensing monitoring and driving force analysis of urban expansion in Guangzhou City, China. Habitat Int. 2010, 34, 228–235. [Google Scholar] [CrossRef]
- McGarigal, K.; Cushman, S.A.; Neel, M.C.; ENE, E. FRAGSTATS: Spatial Pattern Analysis Program for Categorical Maps 2002. Available online: www.umass.edu/landeco/research/ (accessed on 6 July 2015).
- Luck, M.; Wu, J. A gradient analysis of urban landscape pattern: A case study from the Phoenix metropolitan region, Arizona, USA. Landsc. Ecol. 2002, 17, 327–339. [Google Scholar] [CrossRef]
- Zhu, M.; Xu, J.G.; Jiang, N.; Li, J.L.; Fan, Y. Impacts of road corridors on urban landscape pattern: A gradient analysis with changing grain size in Shanghai, China. Landsc. Ecol. 2006, 21, 723–734. [Google Scholar] [CrossRef]
- Thiessen, A.H. Precipitation averages for large areas. Mon. Weather Rev. 1911, 39, 1082–1084. [Google Scholar] [CrossRef]
- Wang, S.W.; Sun, L.S.; Rong, J.; Yang, Z.F. Transit Traffic Analysis Zone Delineating Method Based on Thiessen Polygon. Sustainability 2014, 6, 1821–1832. [Google Scholar] [CrossRef]
- Blumenfeld, H. The tidal wave of metropolitan expansion. J. Am. Inst. Plan. 1954, 20, 3–14. [Google Scholar] [CrossRef]
- Duncan, B.; Sabagh, G.; Van Arsdol, M.D. Patterns of city growth. J. Am. Soc. 1962, 67, 418–429. [Google Scholar] [CrossRef]
- Winsborough, H.H. City growth and city structure. J. Reg. Sci. 1962, 4, 35–50. [Google Scholar] [CrossRef]
- Liu, X.P.; Li, X.; Chen, Y.M.; Tan, Z.Z.; Li, S.Y.; Ai, B. A new landscape index for quantifying urban expansion using multi-temporal remotely sensed data. Landsc. Ecol. 2010, 25, 671–682. [Google Scholar] [CrossRef]
- Sun, C.; Wu, Z.F.; Lv, Z.Q.; Yao, N.; Wei, J.B. Quantifying different types of urban growth and the change dynamic in Guangzhou using multi-temporal remote sensing data. Int. J. Appl. Earth Obs. Geoinf. 2013, 21, 409–417. [Google Scholar] [CrossRef]
- Tian, G.J.; Jiang, J.; Yang, Z.F.; Zhang, Y.Q. The urban growth, size distribution and spatio-temporal dynamic pattern of the Yangtze River Delta megalopolitan region, China. Ecol. Model. 2011, 222, 865–878. [Google Scholar] [CrossRef]
- Leorey, O.M.; Nariida, C.S. A framework for linking urban form and air quality. Environ. Model. Soft. 1999, 14, 541–548. [Google Scholar]
- Deng, J.S.; Wang, K.; Hong, Y.; Qi, J.G. Spatio-temporal dynamics and evolution of land use change and landscape pattern in response to rapid urbanization. Landsc. Urban Plan. 2009, 92, 187–198. [Google Scholar] [CrossRef]
- Tabatabaiee, S.A.; Rahman, A. The Effect of Urban Rail Transit on Decreasing Energy Consumption and Air Pollution in Ahvaz City. Adv. Mater. Res. 2011, 2802–2805. [Google Scholar] [CrossRef]
- Pedersen, E. City dweller responses to multiple stressors intruding into their homes: noise, light, odour, and vibration. Int. J. Environ. Res. Public Health 2015, 12, 3246–3263. [Google Scholar] [CrossRef] [PubMed]
- Cassidy, T. Environmental Psychology: Behaviour and Experience in Context; Psychology Press: London, UK, 1997. [Google Scholar]
- Xue, F.; Gou, Z. Healing Space in High-Density Urban Contexts: Case Studies and Design Strategies. In Handbook of Research on Perception-Driven Approaches to Urban Assessment and Design; Aletta, F., Xiao, J., Eds.; IGI Global: Hershey, PA, USA, 2018; pp. 489–507. [Google Scholar]
- Liu, X.; Liang, X.; Li, X.; Xu, X.; Ou, J.; Chen, Y.; Li, S.; Wang, S.; Pei, F. A future land use simulation model (FLUS) for simulating multiple land use scenarios by coupling human and natural effects. Landsc. Urban Plan. 2017, 168, 94–116. [Google Scholar] [CrossRef]
- Li, X.; Chen, G.; Liu, X.; Liang, X.; Wang, S.; Chen, Y.; Pei, F.; Xu, X. A new global land-use and land-cover change product at a 1-km resolution for 2010 to 2100 based on human–environment interactions. Ann. Assoc. Am. Geogr. 2017, 107, 1040–1059. [Google Scholar] [CrossRef]
© 2018 by the authors. Licensee MDPI, Basel, Switzerland. This article is an open access article distributed under the terms and conditions of the Creative Commons Attribution (CC BY) license (http://creativecommons.org/licenses/by/4.0/).