Considering Water Quality of Urban Rivers from the Perspectives of Unpleasant Odor

1
Institute for the Advanced Study of Sustainability, United Nations University, 5-53-70 Jingumae, Shibuya-ku, Tokyo 150-8925, Japan
2
Integrated Research System for Sustainability Science, The University of Tokyo, 7-3-1 Hongo, Bunkyo-ku, Tokyo 113-8654, Japan
*
Author to whom correspondence should be addressed.
Sustainability 2018, 10(3), 650; https://doi.org/10.3390/su10030650
Submission received: 29 January 2018
/
Revised: 23 February 2018
/
Accepted: 24 February 2018
/
Published: 28 February 2018
Abstract
:Surface water degradation in urban areas is a common problem in many countries, and degradation hampers ecosystem services provided by rivers, having negative impacts on aquatic organisms and human beings. Unpleasant odor arising from impaired rivers causes annoyance to people, and the study quantitatively analyzed unpleasantness of odor in Tokyo through the application of hedonic tones of odor. Unpleasantness remained or worsened while overall dissolved oxygen (DO) concentration increased downstream. The phenomenon is considered to be caused by multiple external factors, such as combined sewer outflow, hypoxia at Tokyo Bay, and effluent from water reclamation centers (WRC). Converting descriptive odor types into numeric values helped to see changes over time and enabled to depict the relation between DO concentration and the type of odor. In Tokyo, the ratio of effluent from WRC to stream flow increased over time, and it partially contributed to odor becoming more unpleasant. Malodor is no longer a major issue since the situation improved by developing an advanced treatment facility; however, human olfactory sense detects the existence of unpleasant odor in urban rivers. The study presented the complexity of analyzing odor problems in tidal urban areas because these are caused by external factors.
1. Introduction
Rivers have sustained our livelihood by providing freshwater for consumption, serving as a mode of transportation, and being a venue for ritual and cultural gatherings. Prosperous cities developed at estuaries and low-lying areas along rivers, and urban agglomeration continued there. The growing population in one area changed the natural landscape into built-up areas to accommodate people and economic activities. As a result, the natural environment in urban areas became scarce, and water environment has become an immediate natural environment for people living in coastal and riverside places. Ecosystem services by rivers were utilized by people for a long time [1], but economic development and urbanization burdened rivers and altered the utilization of services [2]. Anthropogenic activities degraded water quality, changing water unsuitable for direct consumption. Moreover, the development of other transportation routes as roads and railroads led to the decline of inland navigation, and technological development in water management changed flood and erosion control functions of natural rivers. In the meantime, human well-being and sustainability have become more important in parallel with economic development, and studies in the past found that natural environment plays a role for maintaining human well-being in urban areas [3,4]. Hence, cultural services of river became as important as other services in our livelihood; however, degradation disturbs residents for using the services. Improving water quality is necessary to restore ecosystem services in urban areas.
The quality of water is measured by physical, chemical and biological properties. Each property influences others, but chemical and biological properties are vital factors for direct consumption of water considering human health. Guidelines for drinking water and surface water quality regulations are developed based on these properties [5,6]. On the other hand, many people recognize water degradation directly from physical properties [7] and assess amenity and disamenity values through sensory perception. Therefore, the use of cultural services of surface water resources is influenced by appearance and odor [8]. Odor indeed triggered the development of controlling sewage disposal in London in the middle of the 19th century when the Thames River was severely polluted and odor affected daily living [9].
Surface water quality is studied in many places, but sensory perception is rarely included in water quality studies. Moreover, odor is also widely studied as a main subject since it is annoyance to people with complicated mechanisms. Olfactory perception differs from person to person [10], and individual tolerance to odor depends on the duration of exposure, the intensity, and the type of odor [11,12,13]. Emission mechanisms, identification methods and technologies to reduce malodorous substances are intensively studied [14,15,16,17,18], and findings are applied to prevent impacts on our lives [13]. Malodor prevention generally targets point sources such as landfills, livestock farms, and wastewater treatment plants. Odor from natural resources such as rivers and lakes is discussed as a secondary subject, but the main subject is chemical property in water quality studies [19,20]. If cultural services become more important in urban living from a perspective of human well-being, odor is an important subject to understand. Adding sensory perception to water quality studies could complement the mainstream discussion. Odor annoyance is not life-threatening, but it affects people psychologically [21]. Keeping well-being of residents is an intriguing subject for decision makers, and understanding urban odor problem helps to improve living condition in urban areas.
This study aims to explore changes in odor characteristics along with water quality changes over time and to identify problems remained in urban areas. The study analyzed changes in unpleasantness of odor from rivers in an urban area, as well as changes in dissolved oxygen (DO) and biochemical oxygen demand (BOD) concentrations. Categorical odor types were converted into numeric values in order to illustrate changes in odor over time. The study first developed the odor score from hedonic tones of odor estimated by Dravnieks et al. [11], and converted odor data into numeric values by assigning the score. Then, graphic analyses were applied for exploring trends and the current status of odor. Urban water quality is studied by many scholars, but odor is paid little attention except in studies on drinking water. Aesthetic indices would become more important for considering amenity of urban rivers; hence, the study developed the odor score to enable quantitative analysis of odor.
2. Materials and Methods
2.1. Study Site
This study selected Tokyo for analyzing urban odor problems due to the geographic location and the urban development, which is typical for cities in Asia. Since existing urban land is finite, the influx of people creates densely populated urban agglomerations [22]. As a result, domestic effluent degrades water resources if wastewater is not managed. In Tokyo, water pollution triggered odor problems during the rapid economic growth period in the early 1960s. Major events like the Olympic Games became a symbol of modernity and a catalyst for urban development because large-scale urban transformations happened [23,24]. The city of Tokyo hosted the Olympic Games in 1964, and substantial investments were made for infrastructure development [23]. However, major investment was in economic development such as the bullet train and expressways, and little investment in municipal sewers and parks [25]. Consequently, rivers were impaired, releasing odor and caused annoyance to people. It took decades to mitigate the problem through developing a sewage management system.
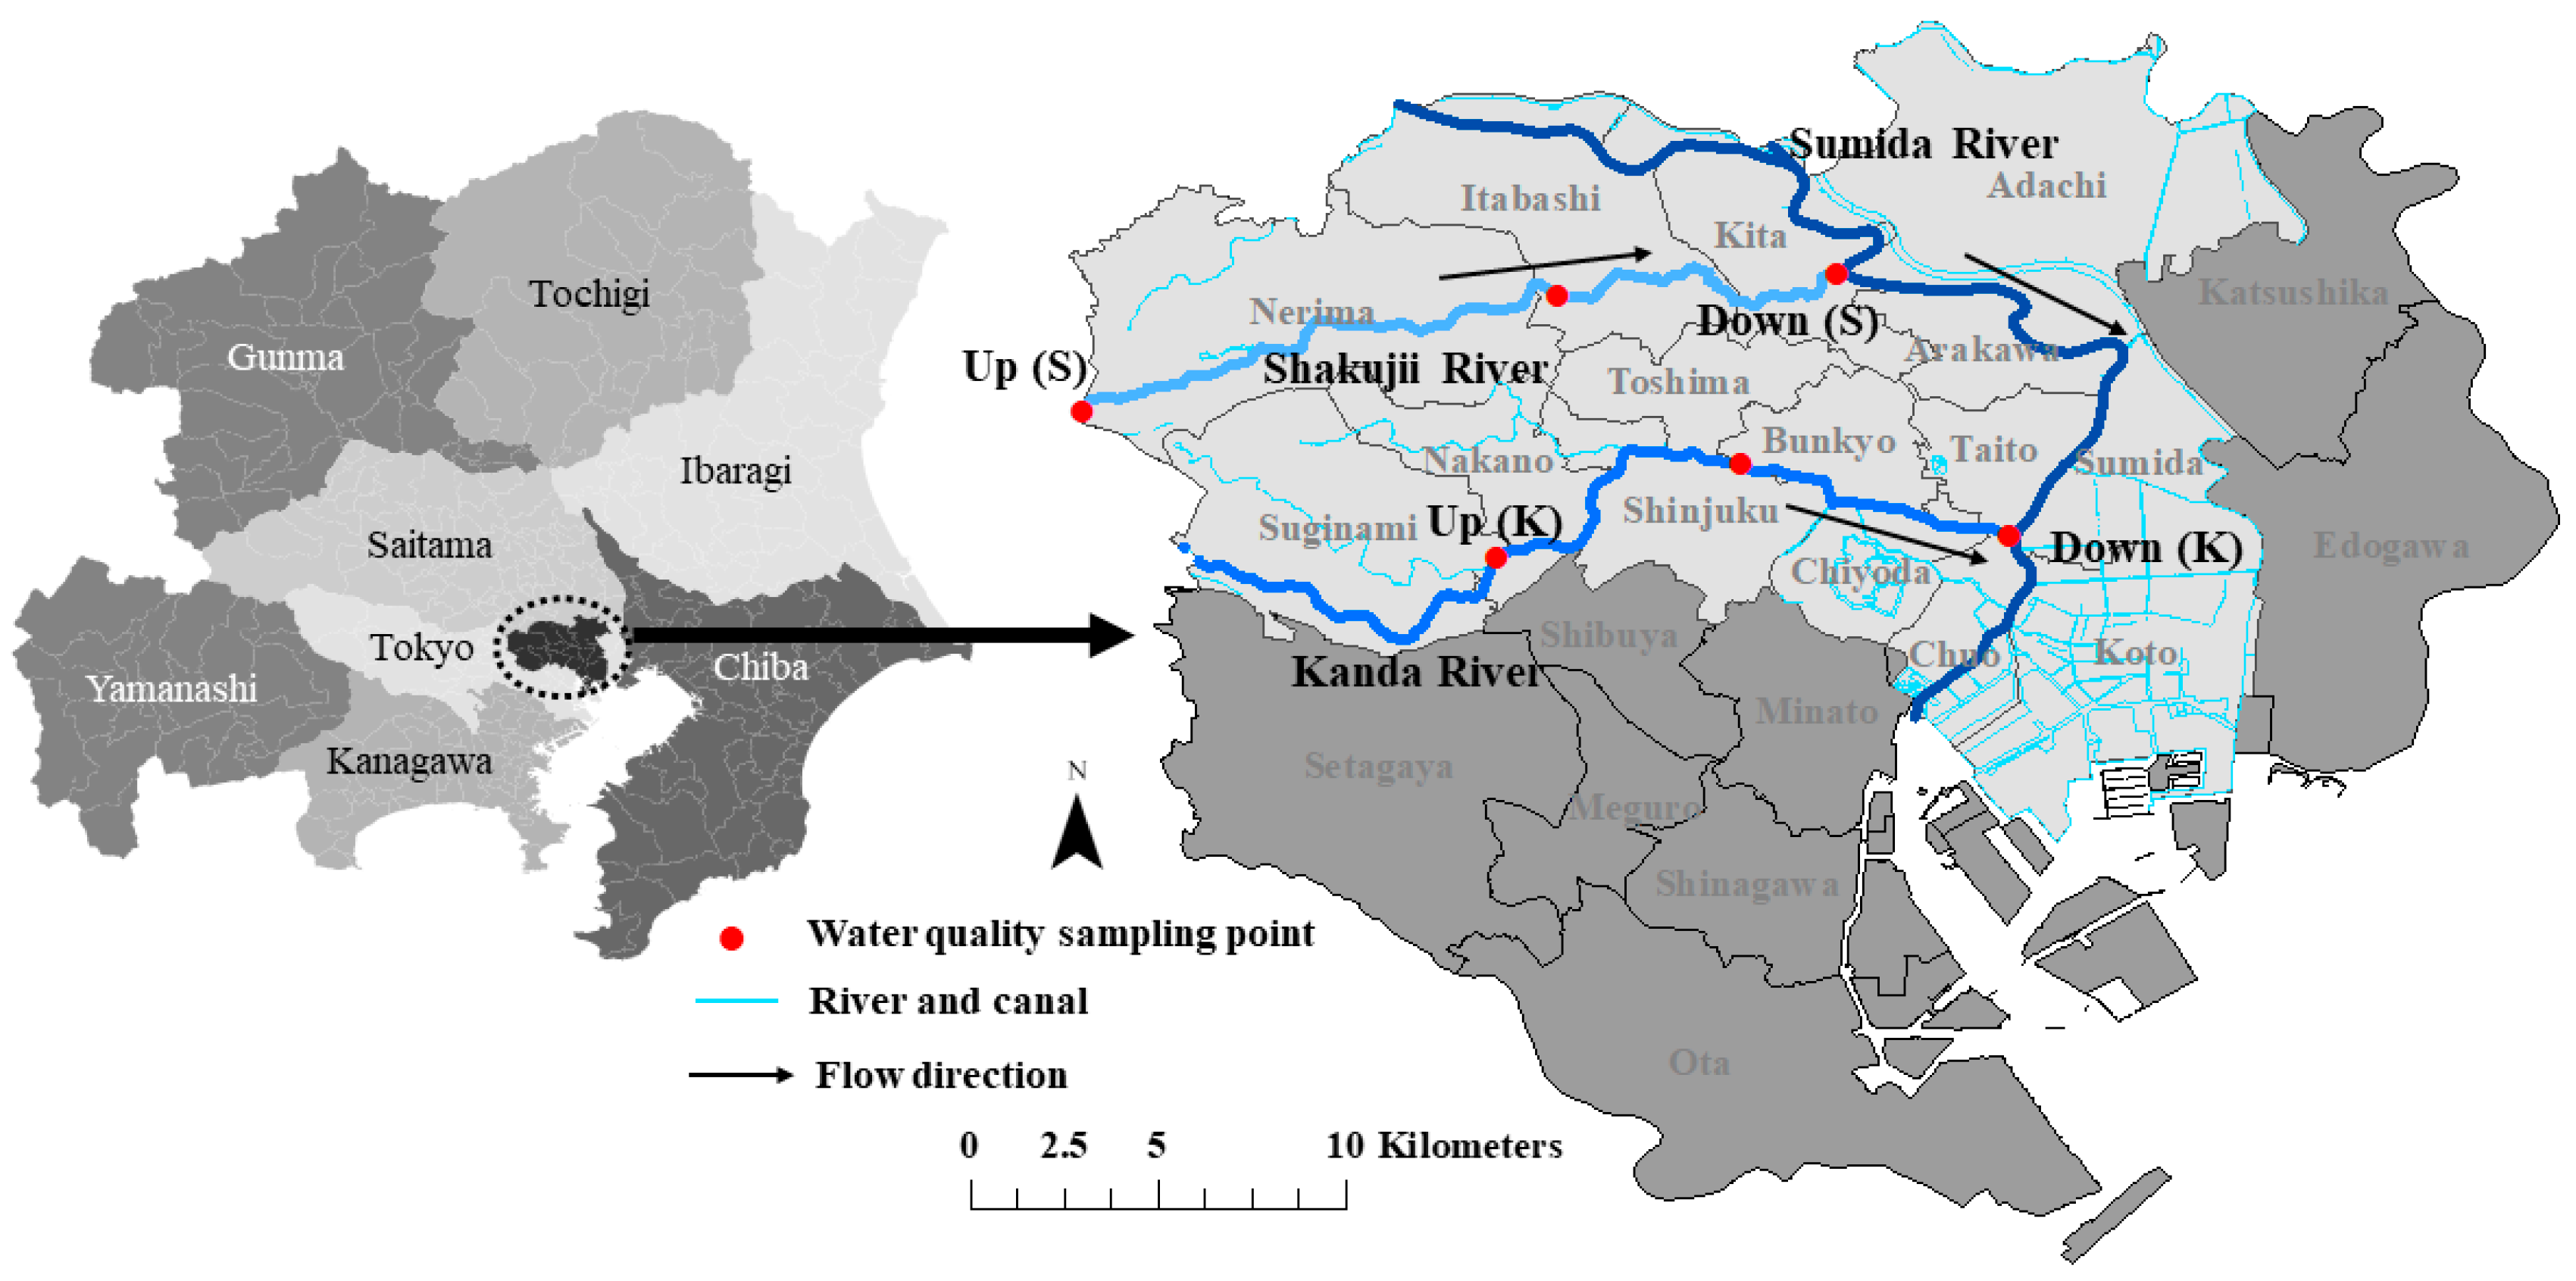
Tokyo Metropolitan area consists of Tokyo and seven surrounding prefectures (Figure 1), and the 2015 Census reported that the area is home to over 40 million people. In downtown Tokyo, the Sumida River and canals had once played important roles for economic and cultural development, but degradation interrupted the use of cultural services provided by the river. Two rivers, the Kanda River and the Shakujii River, are the main tributaries of the Sumida River, and both rivers were also impaired by domestic effluents before the sewerage system was developed because the Kanda and the Shakujii rivers run through densely populated areas. Water quality of these rivers affects water quality of the Sumida, and odor arising from the rivers directly affects business and people in the area. To explore the transition of odor problem in the past, the water quality data from upstream and downstream of the Kanda and the Shakujii rivers were analyzed. Sampling points upstream and downstream of the Shakujii River (Up (S) and Down (S), respectively) as well as upstream and downstream of the Kanda River (Up (K) and Down (K), respectively) are shown in Figure 1. In addition to the data from Tokyo Metropolitan Government (TMG), hour-long interviews were conducted with the boat operators on the Sumida River in 2016 to understand the conditions of the Kanda River.
2.2. Data Source
In Japan, rivers are monitored by the central government or the prefectural government, depending on the area of watershed. Water quality of the Kanda and the Shakujii rivers are monitored by the Bureau of Environment of TMG. The monthly water quality data from 1998 are available on the TMG website, and the data between 1960 and 1997 are available at the headquarter of TMG. However, color and odor were not monitored before 1966, and water quality was not measured monthly before 1970. Sampling points were also different in the early 1970s. Therefore, the study analyzed monthly data from the Shakujii River between April 1973 and December 2010 and the data from the Kanda River between July 1971 and December 2010. The water quality data from TMG include physical, chemical and biological properties. The physical properties are temperature, color, odor, and turbidity. Forty-one different types of odor codes are used by TMG, but during the period of the analysis, only 16 types were recorded. Sixteen types were consolidated into seven groups to simplify the analyses (Table 1).
The odor problem was triggered by a rapid economic growth in 1950s, and rivers were impaired and began to emit malodor in 1960s. Malodorous compounds such as mercaptans, sulfides, indoles, and other nitrogen or sulfur organics are emitted from anaerobic decomposition [15], and ammonia and earthy-musty odor such as 2,4,6-trichloroanisole, geosmin, and 2-methylisoborneol are expected from aerobic conditions [26,27]. More parameters are added in water quality monitoring today; however, parameters were limited in the past. During the period when rivers emitted offensive odor, only pH, DO, BOD, chemical oxygen demand (COD), and suspended solids (SS) were constantly measured. For ensuring consistency over the study period, and considering the fact that the emission of odor is influenced by decomposition of organic matter, the study analyzed DO and BOD concentrations in parallel with investigating odor. Table 2 shows aggregated DO and BOD concentrations from the Shakujii and the Kanda rivers.
2.3. Hedonic Tones of Odor and the Derivation of Odor Score
The study applied the hedonic tones of odor studied by Dravnieks et al. [11] to develop the odor score. The tones were estimated for 146 types of odor, and the numeric values tell what types of odor are annoyance to people in general. Panelists from large food companies and universities rated the odor using the 1–9 scale, and the mean values were calculated for each odor type. Then, the scale was converted to the −4–4 scale, where −4 is the most unpleasant odor and 4 is the least unpleasant odor. The odor types were selected from specific fruits and foods to descriptive odor such as cadaverous and sickening. For the analyses in this study, the scale was converted to the 0–1 scale, where 0 is less unpleasant and 1 is unpleasant. Since odor types in the TMG data were consolidated into seven types including odorless, the study categorized 125 types of odor in Dravnieks et al. [11] into six groups shown in Table 1. Several types of odor such as burnt smells, tobacco, animal, and leather were excluded from the estimation because they do not fall into any groups.
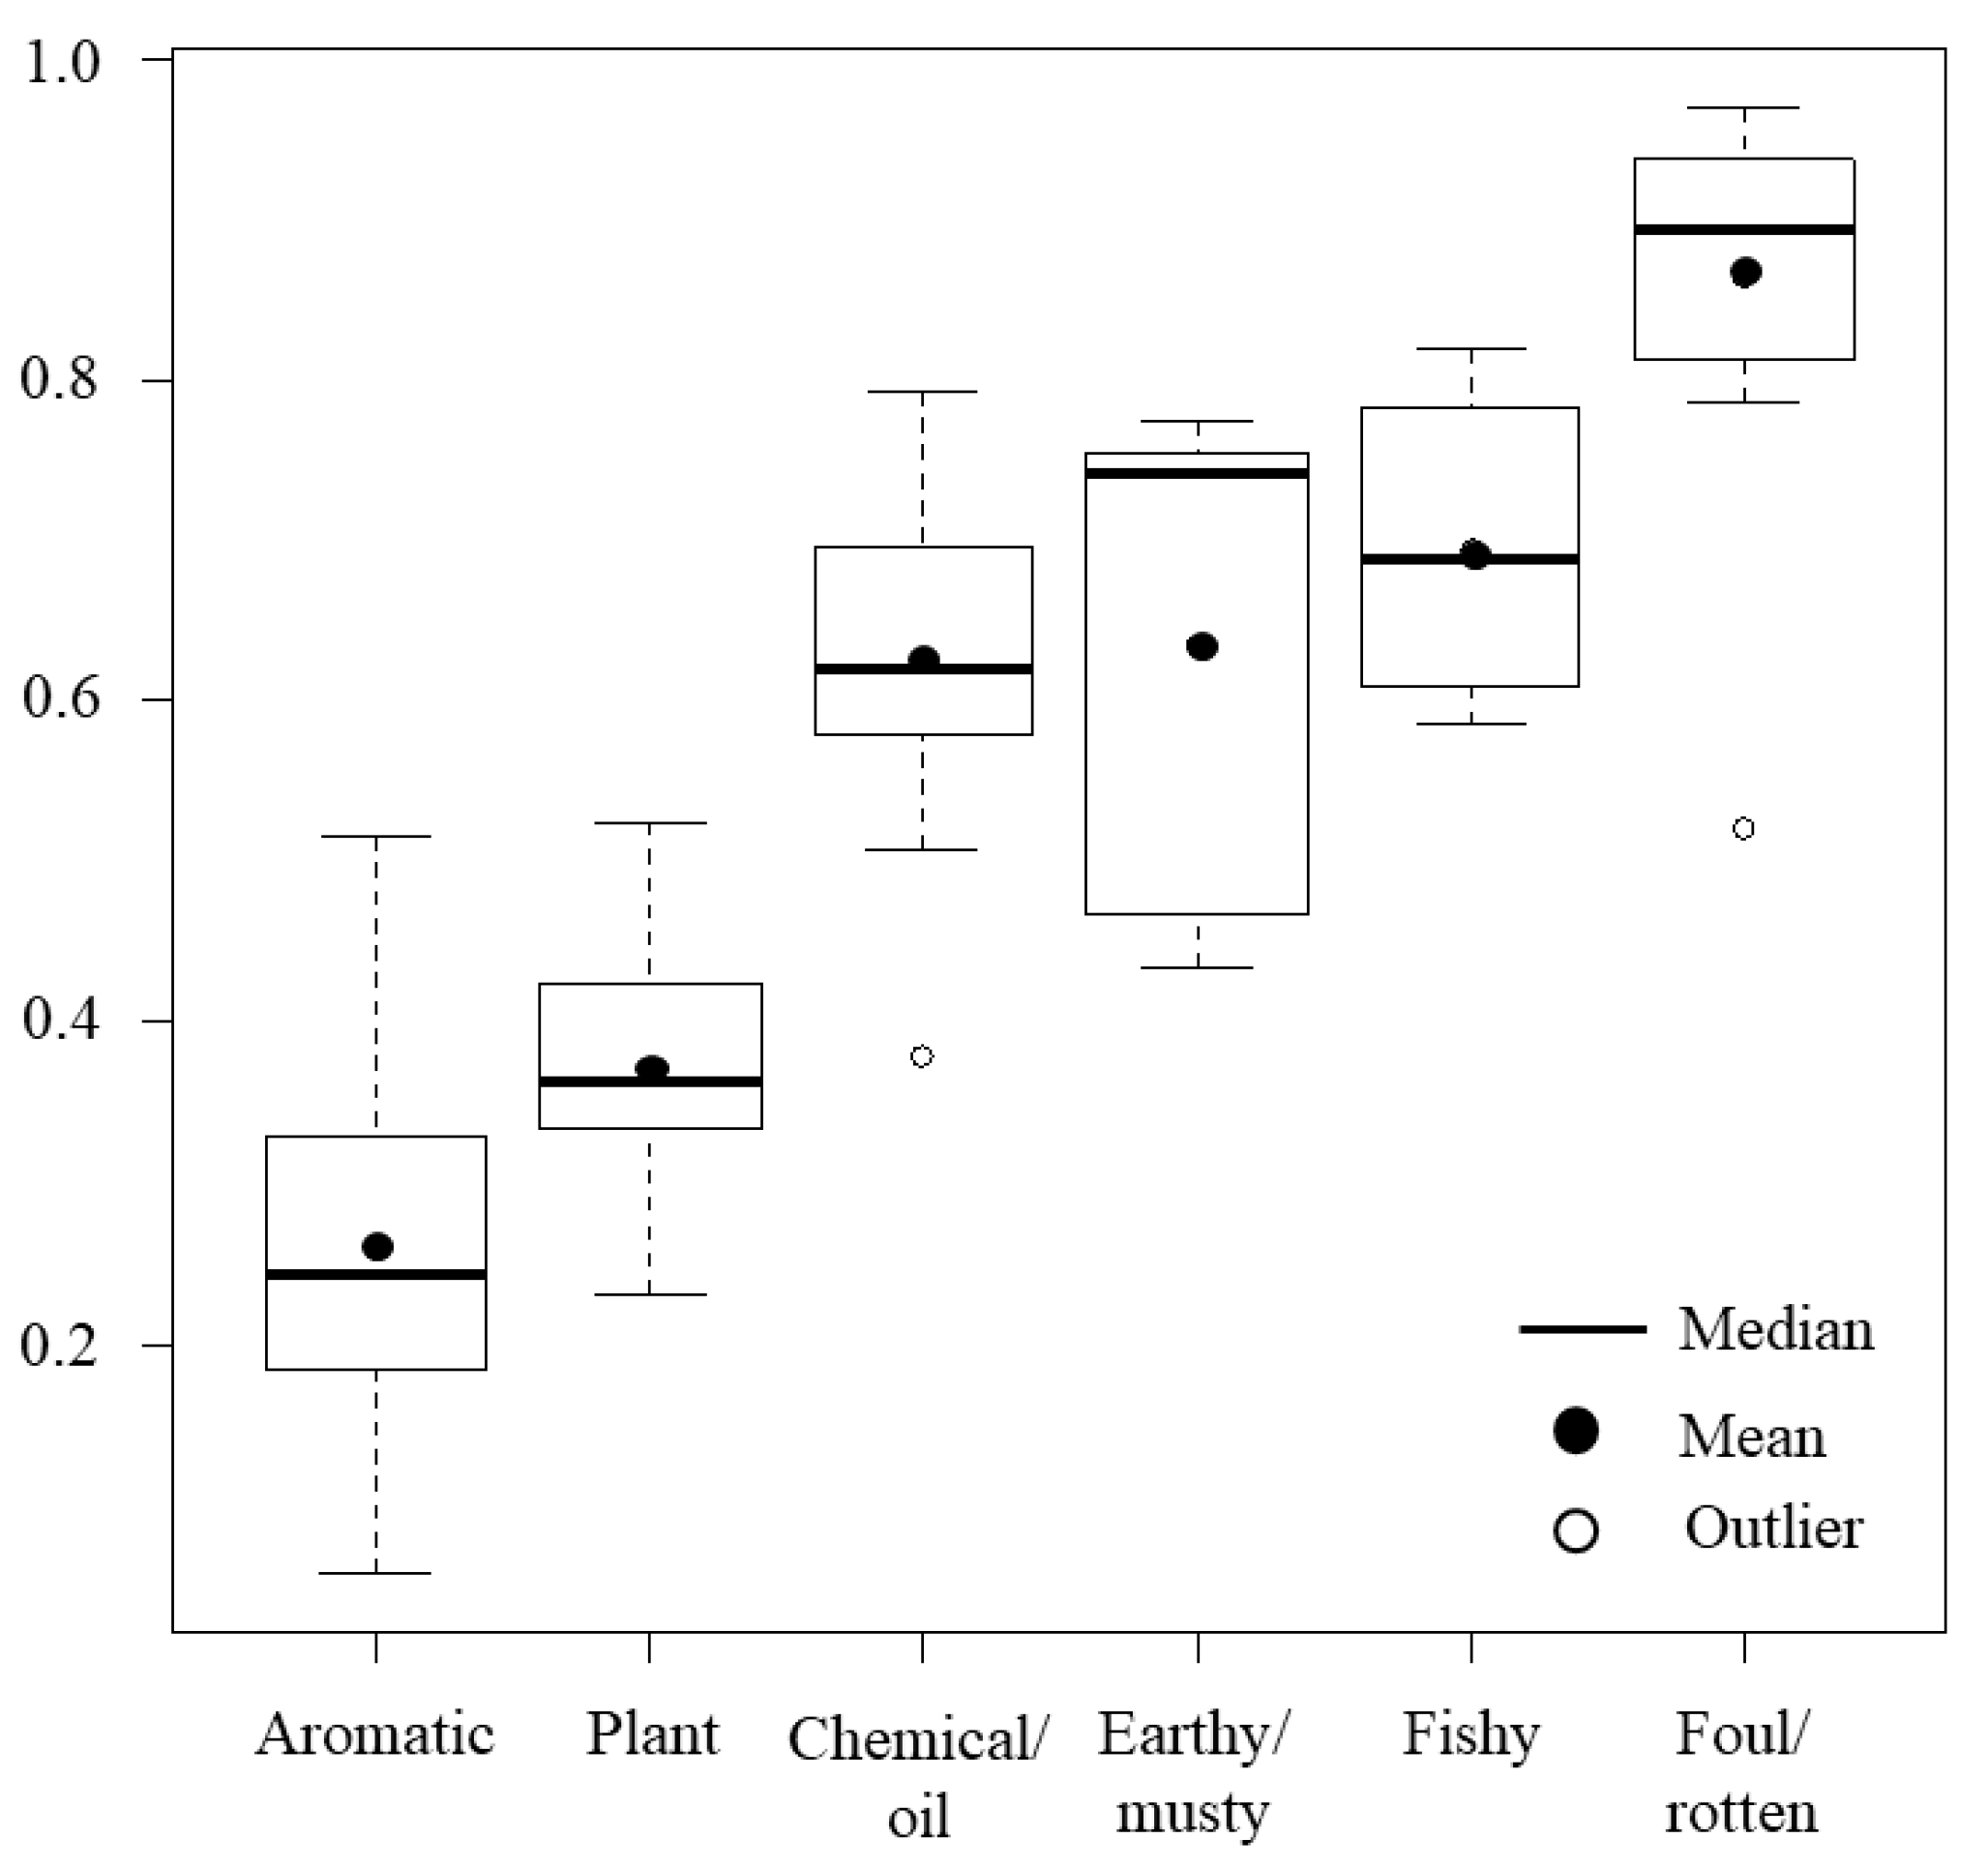
The least unpleasant hedonic tone estimated in Dravnieks et al. [11] is “Bakery (fresh bread),” in which the hedonic tone is 0.006 (3.53 in the −4–4 scale), and the most unpleasant tone is “Cadaverous (dead animal),” in which the tone is 0.97 (−3.75 in the −4–4 scale). Figure 2 summarizes the odor score for the odor groups (Table 1). Odorless is 0, and 1 is the most unpleasant odor score. Aggregating hedonic tones for each group, the odor score was estimated. Aromatic odor is less unpleasant, and foul/rotten odor is the most unpleasant. The mean value is used as the odor score for each group, and the categorical data were converted into numeric values. Figure 2 shows a wide range of scores within the groups, but the trend of each group is depicted. Aroma and plant types are less unpleasant, chemical/oil, earthy/musty, and fishy types are moderately unpleasant, and foul/rotten is more unpleasant.
The TMG data include the odor intensity such as “strong” and “weak”, but the most records are considered to be “moderate” intensity because the intensity is not indicated. A correlation between threshold odor number (TON) and BOD concentration for the Shakujii and the Kanda rivers was found in the past study [28]; thus the odor score could be weighted depending on the strength of odor. However, it is not sure that the relation between TON and BOD is the same at sampling locations upstream and downstream. Although frequency, intensity, duration, and location affect individual tolerance level and sense of unpleasantness, the intensity is not included for estimating the odor score. The study focuses on the characteristics of odor.
3. Results
3.1. Transition of Unpleasant Odor at the Shakujii and the Kanda Rivers
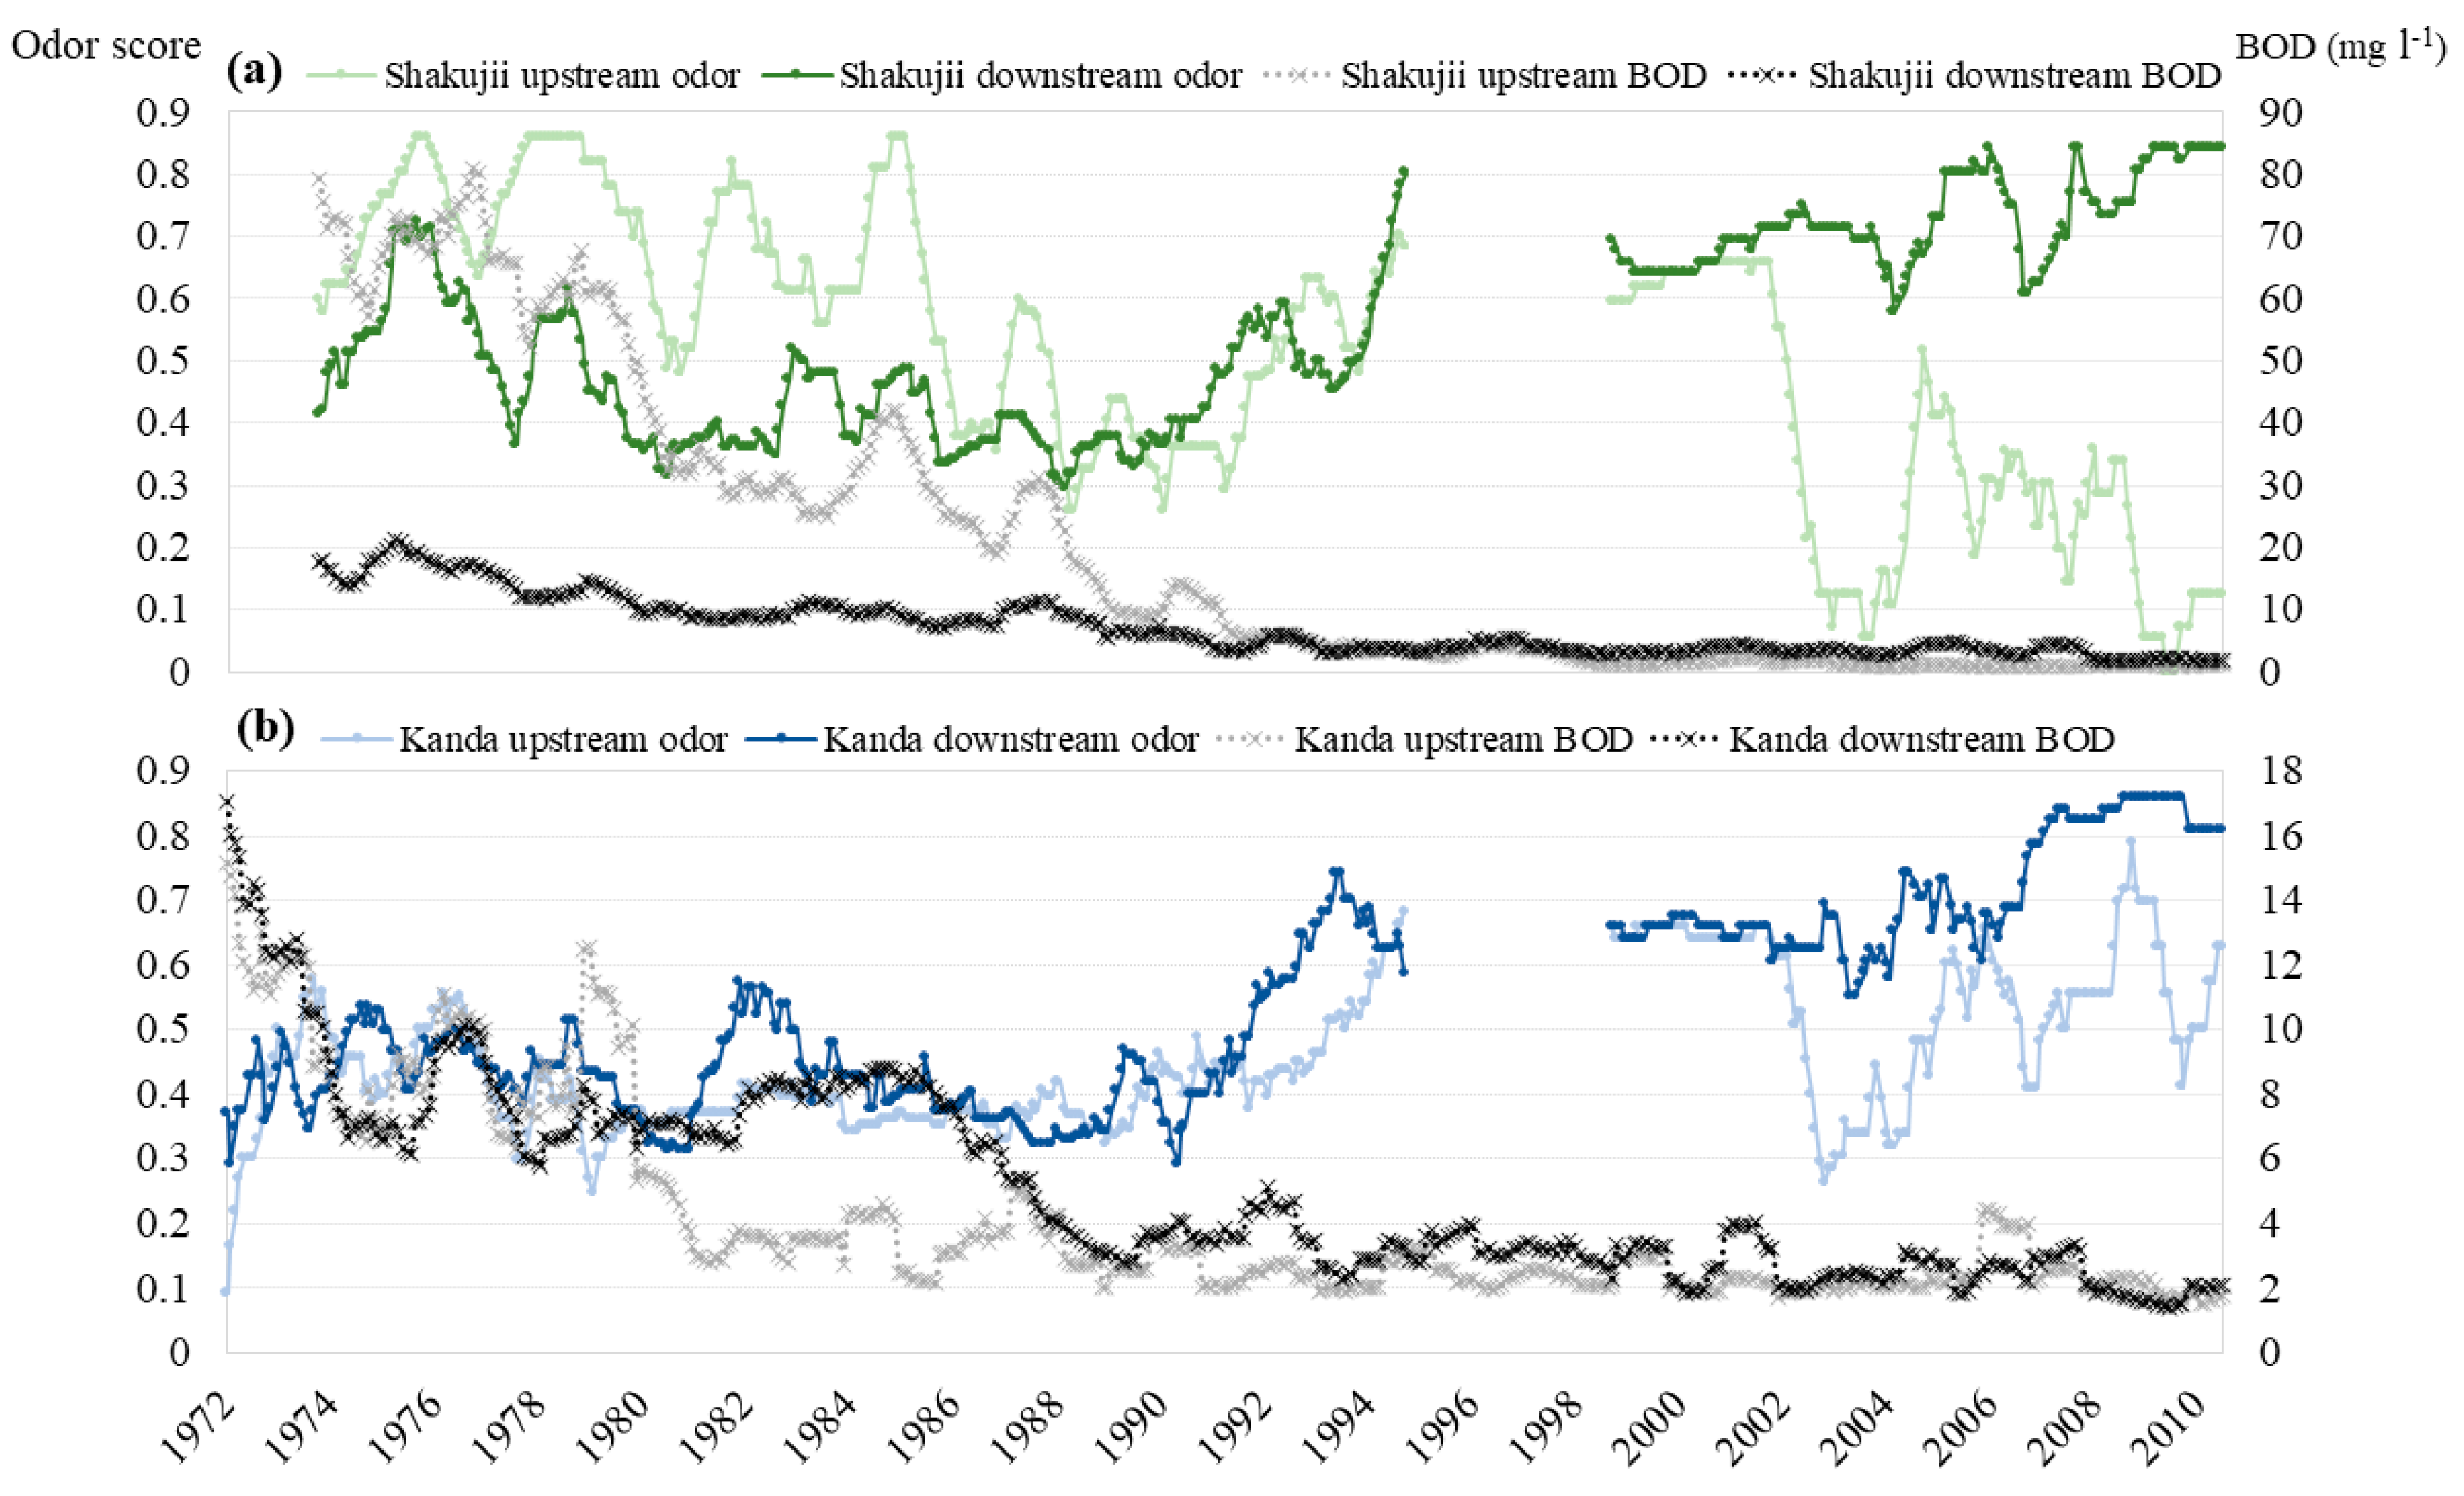
Monthly descriptive odor data was converted into numeric values, and the unpleasantness of odor was measured by a value named odor score. In order to see the transition of odor characteristics, 12-month moving average (MA12) was calculated and plotted with the MA12 of BOD concentration (Figure 3). The MA12 of odor was not calculated between 1995 and 1999 because odor data from April 1995 to March 1998 were missing. Weak sewage odor might be less noticeable than moderate plant odor, but the nature of odor, unpleasant or pleasant, is not affected by the intensity. Figure 3 indicates types of odor without considering the strength.
Odor at the upstream sampling of the Shakujii River had been unpleasant from the early 1970s to the late 1980s, but the unpleasantness gradually abated, and it became the least unpleasant in 2000s. On the other hand, odor at the upstream sampling point of the Kanda River was not unpleasant before 1990 as the score had been between 0.3 and 0.5 and, moreover, it had been less offensive than Shakujii upstream. However, in 1990s, odor became more unpleasant, and the graph shows volatility but increasing unpleasantness after 2001. Odor became more unpleasant than before at the upstream sampling point of the Kanda River, but it was moderate and not as unpleasant as foul/rotten type. Odor at the downstream sampling points of the Shakujii and the Kanda rivers was moderate before 1990 but gradually became more unpleasant. Unlike upstream sites, downstream odor remained at more unpleasant level since then.
The odor score is plotted against DO concentration in Figure 4. Although the study does not intend to include the intensity in analyses, Figure 4 indicates the weak odor to see any patterns. The concentration of DO is the highest at the upstream sampling point of the Kanda River, as many points are between 4 mg L−1 and 15 mg L−1. Some exceptions are seen, but the recorded odor upstream of the Shakujii River is weak if DO concentration is higher. Since malodorous compounds are emitted during anaerobic decomposition, it was expected to have scatter points from the upper left to the lower right diagonally, showing a negative relation between DO concentration and the odor score. The plot of Shakujii upstream shows such relation, but the plots of other sites do not show any specific patterns. Unpleasant odor was detected when DO concentration increased. Although the intensity seems to have been weakened as DO concentration increased, the odor type was not changed to less unpleasant type. The odor at the upstream sampling point of the Kanda River was moderate as many points are below 0.7, and the intensity was weak even if the score was at 0.86. It would be due to relatively higher DO concentration throughout the period upstream. Odor downstream was more unpleasant than upstream regardless of DO concentration.
3.2 The Concentrations of DO and BOD
Among water quality indicators, DO concentration is one of the most important indicators for aquatic biota and odor emission. BOD is a measurement for the amount of oxygen demanded by microorganisms and has a negative correlation with DO concentration [29]. A high concentration of BOD lowers DO concentration and could lead to anaerobic decomposition. BOD is one of indicators to monitor the health of rivers in Japan. In order to investigate factors behind increasing unpleasantness of odor while increasing DO concentration at downstream sites, the concentrations of DO and BOD are graphically analyzed (Figure 5).
The reduction of BOD concentration is noticeable upstream of the Shakujii River, and the value went down from 134 mg L−1 in July 1976 to below 1 mg L−1 in recent years. DO concentration also increased appreciably. On the other hand, BOD concentration at the downstream sampling point of the Shakujii River was not as high as upstream, and it was 34.7 mg L−1 in February 1976 and went down to below 3 mg L−1 in recent years. The change is not as significant as upstream, but the improvement is apparent. DO concentration also improved downstream but it is not as much as upstream. Changes in DO and BOD concentrations are also observed at the upstream and downstream sampling points of the Kanda River, but they are not apparent as seen upstream of the Shakujii River. The concentration of BOD improved as the mean changed from 9.8 mg L−1 in 1970s to 2.3 mg L−1 in 2000s upstream of the Kanda River, and it went down from 9.3 mg L−1 to 2.4 mg L−1 downstream. DO concentration at the upstream sampling point of the Kanda River had been constantly high during the study period. Supersaturated states of DO were seen before 1990 because the records show that the concentration occasionally went above 15 mg L−1. It indicates the presence of aquatic plant there [30]. The concentration of DO downstream of the Kanda River shows high volatility and slight improvement but had been lower than other sites.
The past studies revealed that the deeper water of coastal areas becomes hypoxic and anoxic during the warm season, affecting tidal rivers [31,32], hence the seasonal differences of DO concentration at the downstream sampling point of the Kanda River are additionally analyzed by applying a generalized linear model, and the result is presented in Table 3. A seasonal group variable was created by dividing one year into three parts: January–March, April–September, and October–December. In the analysis, the dependent variable is MA12 of DO concentration, and the independent variable is the seasonal group. January–March is a reference variable in the model. The results show significant seasonal differences; DO concentration in January–March was the lowest, followed by October–December. The odds ratio (OR) tells that the mean of DO concentration from April to September is the lowest of the year, and DO concentration downstream of the Kanda River seems to be affected by ocean water in the warm season.
The relations between odor, DO and BOD concentrations are statistically analyzed by applying regression analysis, and the results are presented in Table 4. The dependent variable is odor score, and independent variables are downstream and DO and BOD concentrations. Downstream is a dummy variable, assigning 0 for upstream and 1 for downstream. DO and BOD variables are MA12. Since odor score is a value between 0 and 1, beta regression is applied [33,34]. Log-link function was applied for estimation, and OR is calculated from the coefficients. The parameters were estimated separately for DO and BOD models and also for the Shakujii and the Kanda rivers. Odor is unpleasant if the score is close to 1, and it becomes less unpleasant toward 0. The relation between odor score and DO concentration is expected to be negative because malodorous compounds are emitted during anaerobic decomposition. Since the high levels of BOD concentration lowers DO concentration, high concentration of BOD is associated with higher odor score if DO concentration reaches to hypoxia level. Moreover, the low level of BOD concentration indicates high DO concentration, thus odor score is expected to be low. Thus, the relation between odor score and BOD concentration is positive.
The results from the analysis of the Shakujii River are as expected. The odds of odor score being higher decreases by the factor 0.87 if DO concentration increases 1 mg L−1, and the odds increases by the factor of 1.02 if BOD concentration increases 1 mg L−1. For both DO and BOD models of the Shakujii River, the odds of odor score being higher increase at the downstream sampling site by the factor 1.31 for DO model and 1.73 for BOD model. On the other hand, the results from the Kanda River are different from the expectation, and show the opposite result, except downstream variable. Increasing DO concentration contributes to increase unpleasantness of odor, and increasing BOD concentration contributes to decrease unpleasantness of odor. The odds of odor score being higher increases at the downstream sampling point by the factor 3.69 for DO model and 1.53 for BOD model.
4. Discussion
The historical water quality data show the improvement of water quality of the Shakujii and the Kanda rivers. Odor and water quality upstream of the Kanda River had been stable at high DO concentration and moderate odor throughout the period while changes in odor and water quality in other sites were apparent. Improving water quality contributed to alter odor upstream of the Shakujii River, and unpleasant odor became less unpleasant. However, at the downstream sampling points of both rivers, unpleasant odor remained while water quality improved. The odor problem is mitigated in terms of the intensity because it has weakened, but the odor type changed to more unpleasant one. Existence of unpleasant odor is highly associated with hypoxia and anaerobic decomposition of organic substances, but the graphic analyses and regression results compete the general theory at the downstream sampling points. The plot of DO concentration against odor score presented the existence of malodor regardless of DO concentration downstream, particularly at the Kanda River. It is be explained if malodorous compounds presented in aerobic conditions, or if malodor emission was caused by external factors.
If DO concentration is high, nitrogen compounds are degraded into ammonia and then nitrate during aerobic decomposition [35,36]. If DO concentration below 2 mg L−1 is considered as hypoxic condition [19,20,32], upstream did not face hypoxia after 2000, and downstream periodically faced hypoxic condition after 2000 at both rivers. However, rivers continuously flow, and DO concentration changes frequently. It indicates that changes from aerobic to anaerobic conditions simultaneously and emitting malodor are unlikely expected. DO concentration was low between April and September, which may have been caused by external factors such as hypoxia in ocean water [31,32] and not within the river water itself.
The basins are covered by combined sewage systems (CSS), and if a heavy storm hits the area, wastewater is discharged into rivers after the primary treatment because the influent exceeds the treatment capacity. If this happens, debris is excluded through the primary treatment, but the effluent contains high concentrations of organic matters because it is virtually the same as sewage water. CSS is in use in many urban cities, and surface water impairment caused by combined sewer outflow (CSO) at estuary areas has received attention, and CSO problems have been studied [37,38,39]. Odor problem is also one of the CSO problems recognized, and CSO is one reason of the existence of unpleasant odor downstream of the Kanda River. The measures to solve CSO are implemented in developed countries, but the problem is not mitigated immediately because solving the CSO problem requires to upgrade infrastructure as domestic effluents and rainwater must be separated [40,41].
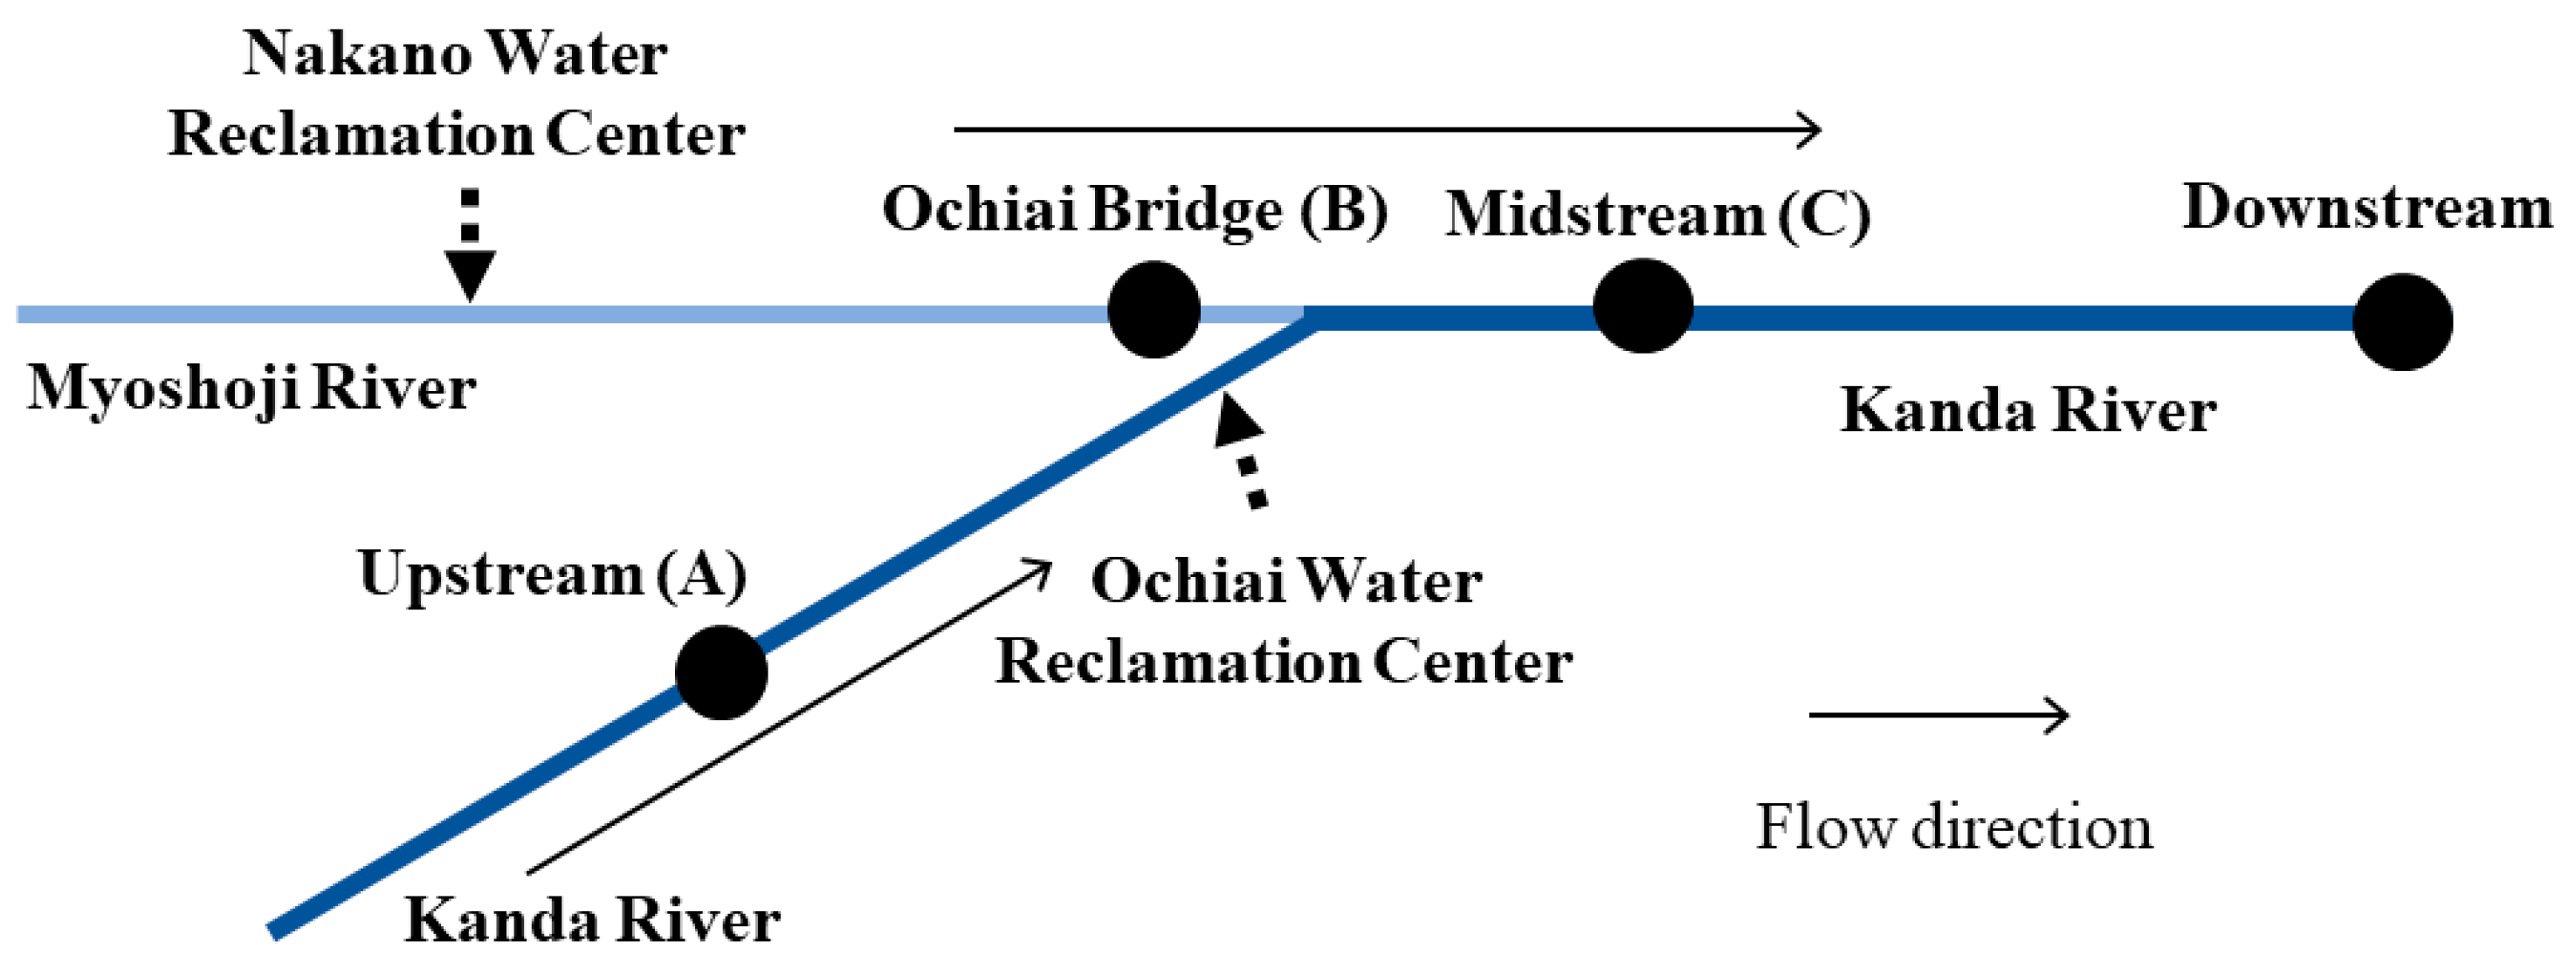
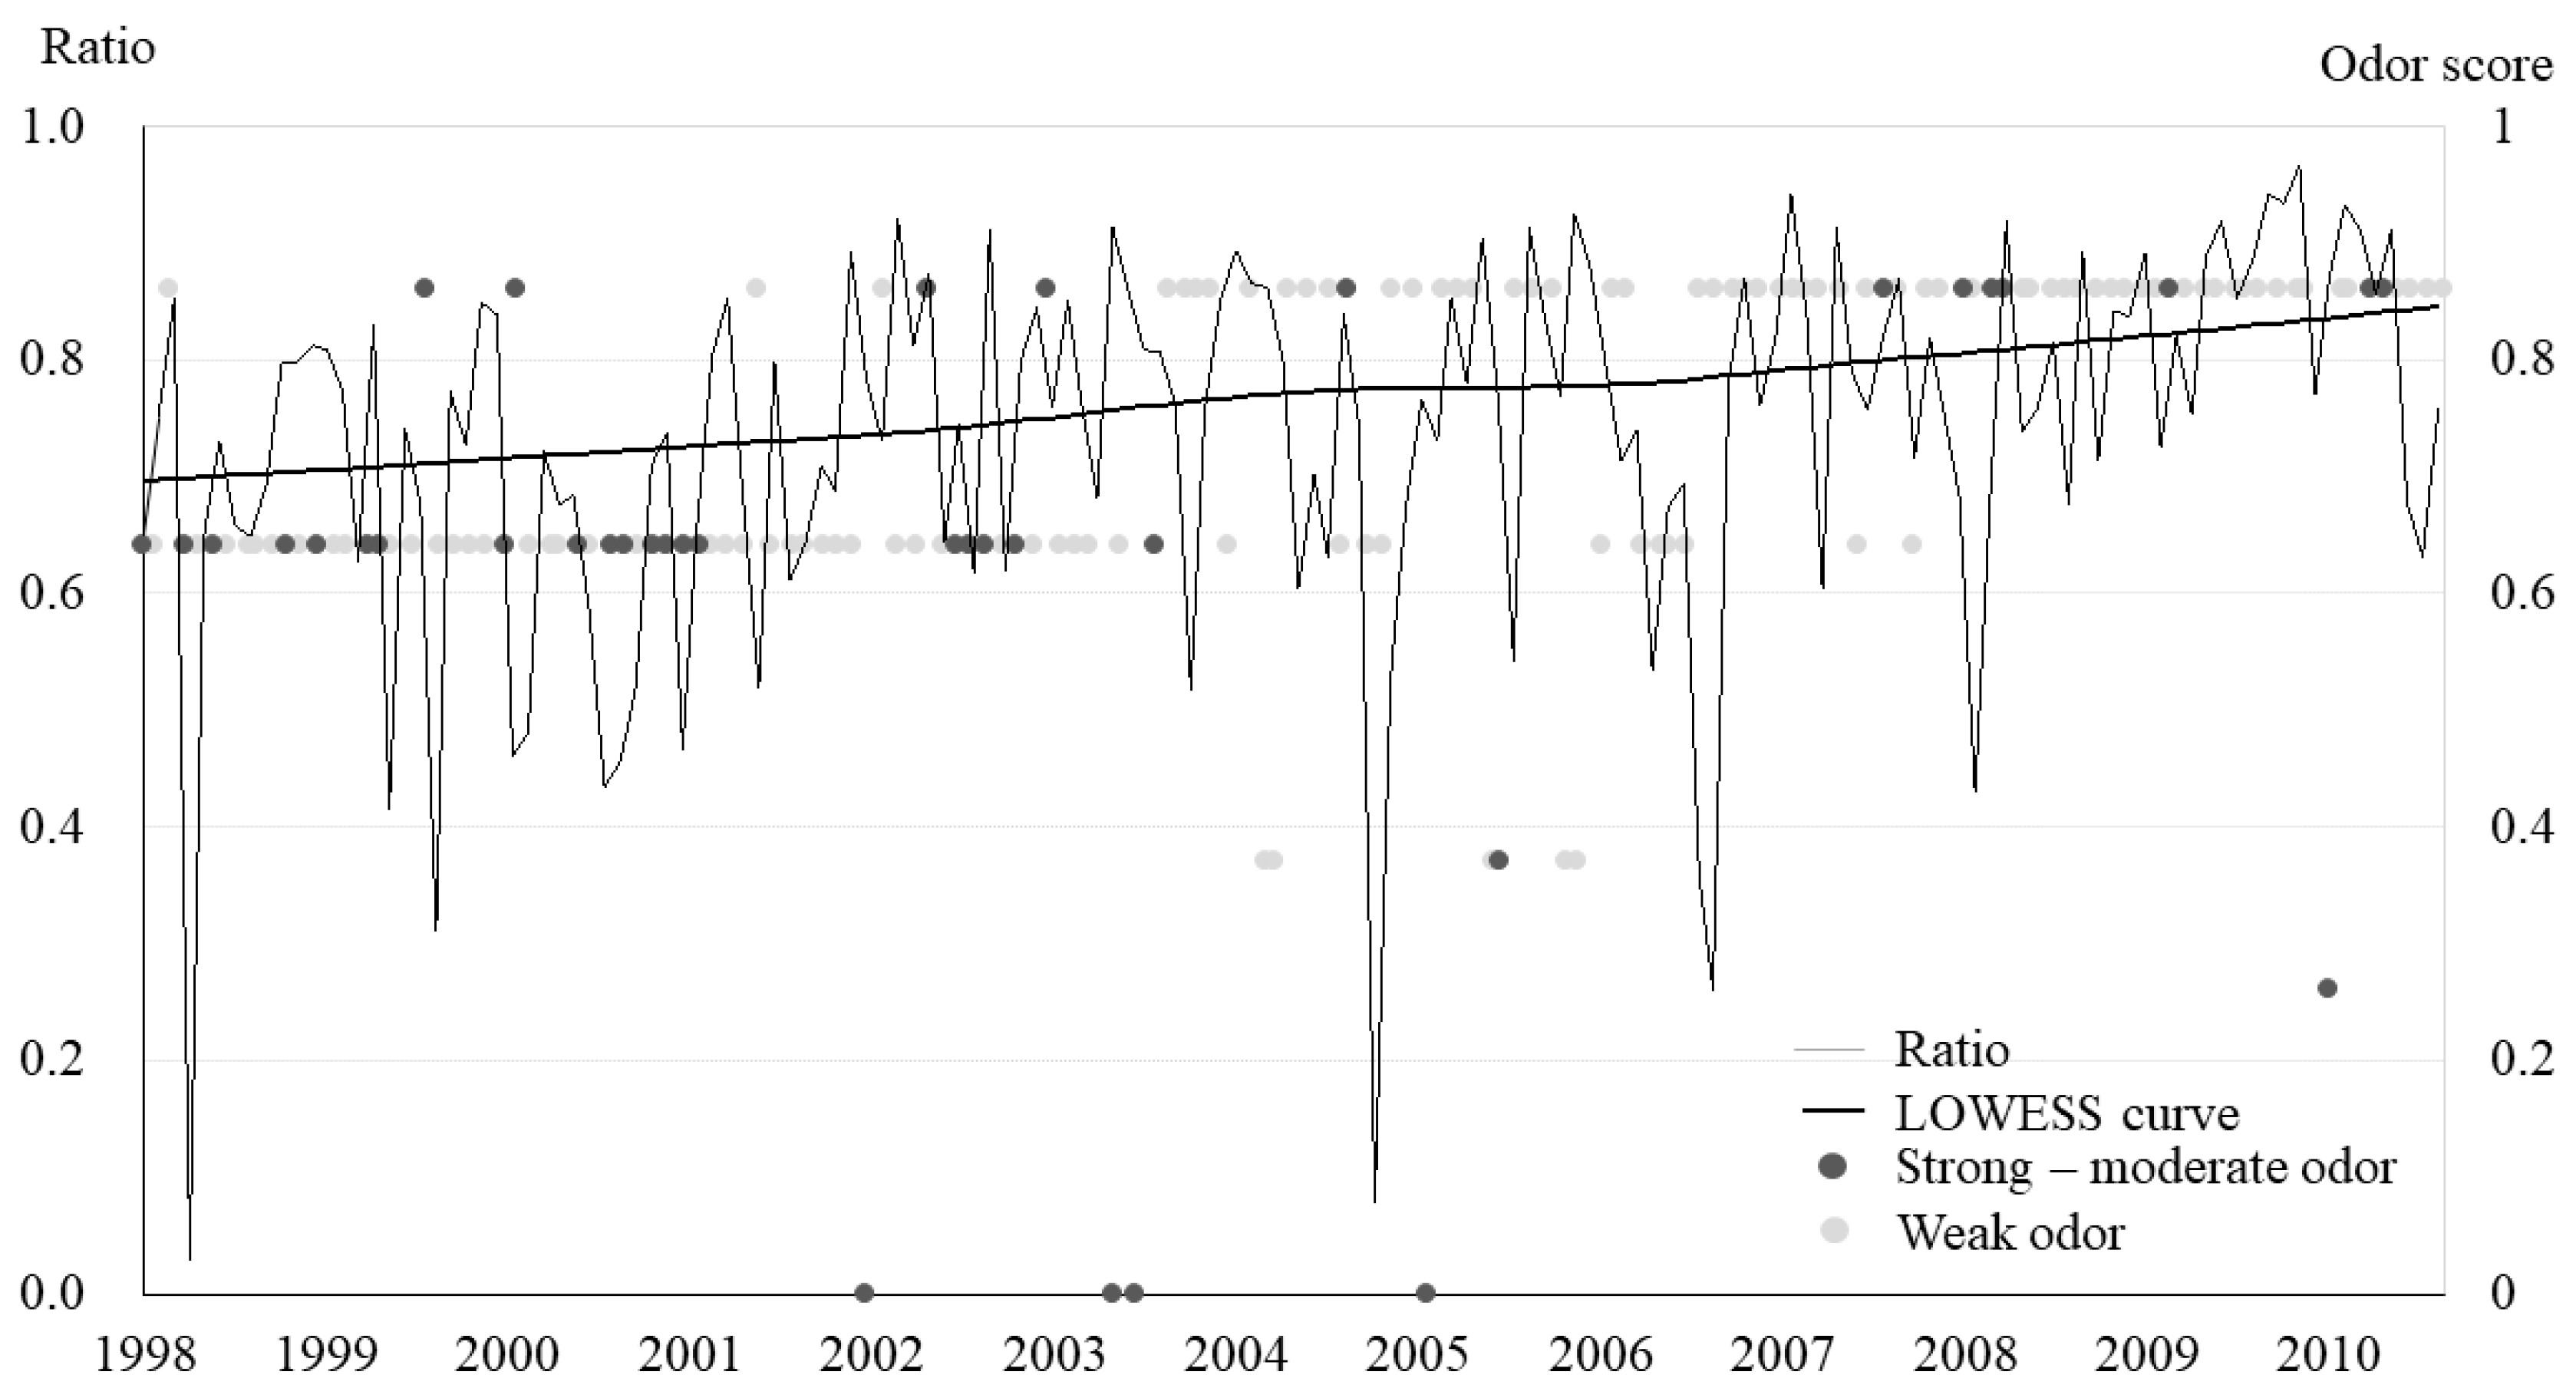
Additionally, the source of small- and medium-size rivers in Tokyo is often a spring, and the depletion of spring water leads to use the effluent from water reclamation centers (WRC) in order to maintain the flow of rivers. Effluent from WRC emits earthy/musty type of odor [26], and it contributes to malodor downstream. The effluent from WRC in Tokyo is mostly from advanced sewage treatment plants; however, a study found that river water containing the effluent from WRC emits sulfur type odor, especially strong odor in summer [42]. Two treatment plants, the Nakano Water Reclamation Center (NWRC) and the Ochiai Water Reclamation Center (OWRC), discharge the effluent into the Kanda River. In 2015, 70% of the daily effluent from OWRC is through the advanced treatment while none was through the advanced treatment from NWRC. The daily amount of effluent discharged from OWRC was about nine times more than NWRC. The share of the effluent from OWRC in flow of the Kanda River was estimated using the flow data from the Ochiai Bridge on the Myoshoji River as well as upstream and midstream of the Kanda River (Figure 6). The ratio of the effluent from WRC to flow at midstream was calculated and plotted with a locally weighted scatterplot smoothing (LOWESS) curve (Figure 7). The LOWESS curve is a smoothing line to connect fitted values computed from local polynomial regression, and it depicts a trend among the data points without estimating parameters [43]. The plot shows volatility, but the LOWESS curve indicates an upward trend of the effluent from OWRC over time. The type of odor changed to more unpleasant type from 1998 to 2010 at the same time as the effluent from OWRC increased, although the odor strength weakened. Considering the findings from the past study regarding odor arising from the effluent of WRC, the existence of malodor in aerobic conditions downstream of the Kanda River could be partly explained by the increasing flow of the effluent from WRC.
In Tokyo, river boat tourism has been a seasonal tradition for centuries, but the tradition had a break when rivers were severely polluted and emitted offensive odor. The tradition is now back, and visitors enjoy sightseeing on boats. Many docks are located downstream of the Kanda River, and the boat business owners have an office by the dock and spend most of the day in the office. During the interview with an owner, the persisting odor problem was mentioned, although water has become cleaner. The odor problem no longer attracts attention when considering the quality of rivers in Tokyo, but mediators between cultural services of river and people such as river boat operators are sensitive to malodor problems. It is difficult to convey the problem because odor is fast-moving, but their appeal is backed by the data and the analyses.
The odor problem is subjective, and the perception of unpleasantness depends on the individual tolerance level as well as influenced by emotions at the time [13]. The duration of exposure to odor affects the correlation between unpleasantness and intensity [12], and moreover, cross-cultural differences are seen on the perception of everyday odor [10]. Although quantifying the odor involves uncertainties, the study applied hedonic tones developed by Dravinieks et al. [11] because they studied a wide range of odor and established generalized tones through aggregating subjective evaluations. This study objectively illustrated the persistent odor problem regardless of water quality improvement, but for a practical use, the odor from surface water and the perception require further study, including establishing hedonic tones through laboratory analysis.
5. Conclusions
Rivers in Tokyo were impaired due to a lack of a sewerage treatment in the past, but water quality has improved significantly through investing in developing wastewater management. The study analyzed odor arising from rivers and found a persistent odor problem downstream. Using the 0–1 score of unpleasantness, odor upstream of the Kanda River was not unpleasant as the highest MA12 of the odor score was below 0.8, while the scores at other sites went above 0.8. The graphic analyses illustrated that the odor problem upstream of the Shakujii River was mitigated over time along with water quality improvement, and the statistical analysis also indicated that water quality improvement contributed to mitigate unpleasant odor upstream of the Shakujii River. On the other hand, the graphic analyses showed the opposite outcomes downstream of the Kanda and the Shakujii rivers. Improving DO concentration did not lead to mitigate unpleasant odor, and the statistical analysis of the Kanda River data backed up the graphic analyses. CSO, being a tidal river and effluent from WRC are likely to cause observed conditions downstream. Further mitigation of the odor problem is desired because the water environment is one of the scarce urban natures in Tokyo, and urban nature is important to maintain well-being of urban residents. Moreover, if the water environment is included in a plan for promoting the tourism in Tokyo, odor arising from water resources needs to be addressed with water quality.
Sewerage pipes in central Tokyo have already gone beyond their estimated service life, and upgrading them has become an urgent task. Upgrading the system would eventually solve the CSO problem, and solving the problem would partially mitigate foul odor in Tokyo. Modifying the existing sewerage system requires a significant amount of time and resources, especially in densely developed areas. Tokyo is well resourced, but it is expected to take over a decade to replace the current sewage system. Some developing countries are at the stage of developing sewerage systems, and others may be at the stage of facing CSO problems. In either case, preparing the sewerage register with detailed information on sewage pipes is indispensable to avoid extra costs and maintain sewer work efficiently, and the path that Tokyo is taking would be a reference in the future.
Moreover, intensive studies are necessary to understand odor from natural resources, sensory perception, tolerance level of residents, and the impacts of odor on well-being. The water quality of rivers in Tokyo has been improved, and ecosystem services are gradually restored. As odor from rivers has weakened, tolerance level of people may also have been changed. Living in odorless environment could make olfactory sense more sensitive, and weak odor would cause an unpleasant feeling. When water quality is measured for urban rivers, chemical properties receive major attention. However, the study presented that improving the indices does not necessarily solve all the problems, and moreover, it may conceal other problems. The study analyzed a qualitative problem quantitatively and showed that odor from urban rivers is a persistent problem even after improving water quality. The odor problem is studied from many perspectives such as composting, livestock management, waste and wastewater treatment, and measurement technology, but unpleasant odor from imminent urban environment and olfactory sense of people toward the odor are rarely studied. People notice offensive odor without laboratorial measurement and immediately develop unpleasant feeling, affecting human well-being. Since human well-being has become more important in urban life and urban nature plays a role therein, addressing odor problems in urban rivers contributes to build a sustainable society.
The analyses of the historical water quality data in Tokyo provided the pictures of changing unpleasantness of odor and the existence of external factors. Odor is subjective, and measuring the intensity and unpleasantness in a laboratory provides more accurate figures but requires intensive resources. Comprehensive studies including olfactory sense and human well-being are needed to go further, but developing an index to estimate unpleasantness of odor using conventional water quality indices would help to anticipate residents’ annoyance and understand the amenity of urban life in the future.
Author Contributions
Yukako Sado-Inamura and Kensuke Fukushi conceived and designed the study. Yukako Sado-Inamura analyzed the data and the initial draft manuscript. All authors have taken equal contribution in writing the final manuscript.
Conflicts of Interest
The authors declare no conflict of interest.
References
- Aylward, B.; Bandyopadhyay, J.; Belausteguigotia, J.-C.; Börkey, P.; Cassar, A.; Meadors, L.; Saade, L.; Siebentritt, M.; Stein, R.; Tognetti, S.; et al. Freshwater Ecosystem Services. In Ecosystems and Human Well-Being: Policy Responses; Island Press: Washington, DC, USA, 2005; pp. 213–255. ISBN 9781559632706. [Google Scholar]
- Lambin, E.F.; Turner, B.L.; Geist, H.J.; Agbola, S.B.; Angelsen, A.; Bruce, J.W.; Coomes, O.T.; Dirzo, R.; Fischer, G.; Folke, C.; et al. The causes of land-use and land-cover change: Moving beyond the myths. Glob. Environ. Chang. 2001, 11, 261–269. [Google Scholar] [CrossRef]
- Wolf, K.L.; Robbins, A.S.T.T. Metro nature, environmental health, and economic value. Environ. Health Perspect. 2015, 123, 390–398. [Google Scholar] [CrossRef] [PubMed]
- Barton, H. Land use planning and health and well-being. Land Use Policy 2009, 26, 115–123. [Google Scholar] [CrossRef]
- Kannel, P.R.; Lee, S.; Lee, Y.-S.; Kanel, S.R.; Khan, S.P. Application of Water Quality Indices and Dissolved Oxygen as Indicators for River Water Classification and Urban Impact Assessment. Environ. Monit. Assess. 2007, 132, 93–110. [Google Scholar] [CrossRef] [PubMed]
- Wang, J.; Da, L.; Song, K.; Li, B.-L. Temporal variations of surface water quality in urban, suburban and rural areas during rapid urbanization in Shanghai, China. Environ. Pollut. 2008, 152, 387–393. [Google Scholar] [CrossRef] [PubMed]
- Yamashita, S. Perception and evaluation of water in landscape: Use of Photo-Projective Method to compare child and adult residents’ perceptions of a Japanese river environment. Landsc. Urban Plan. 2002, 62, 3–17. [Google Scholar] [CrossRef]
- Pflüger, Y.; Rackham, A.; Larned, S. The aesthetic value of river flows: An assessment of flow preferences for large and small rivers. Landsc. Urban Plan. 2010, 95, 68–78. [Google Scholar] [CrossRef]
- Andrews, M.J. Thames Estuary: Pollution and recovery. In Effects of Pollutants at the Ecosystem Level; Sheehan, P.J., Miller, D.R., Butler, G.C., Bourdeau, P., Ridgeway, J.M., Eds.; John Wiley & Sons: Chichester, UK, 1984; pp. 195–228. [Google Scholar]
- Ayabe-Kanamura, S.; Schicker, I.; Laska, M.; Hudson, R.; Distel, H.; Kobayakawa, T.; Saito, S. Differences in perception of everyday odors: A Japanese-German cross-cultural study. Chem. Senses 1998, 23, 31–38. [Google Scholar] [CrossRef] [PubMed]
- Dravnieks, A.; Masurat, T.; Lamm, R.A. Hedonics of Odors and Odor Descriptors. J. Air Pollut. Control Assoc. 1984, 34, 752–755. [Google Scholar] [CrossRef]
- Sucker, K.; Both, R.; Bischoff, M.; Guski, R.; Winneke, G. Odor frequency and odor annoyance. Part I: Assessment of frequency, intensity and hedonic tone of environmental odors in the field. Int. Arch. Occup. Environ. Health 2008, 81, 671–682. [Google Scholar] [CrossRef] [PubMed]
- Nicell, J.A. Assessment and regulation of odor impacts. Atmos. Environ. 2009, 43, 196–206. [Google Scholar] [CrossRef]
- Sironi, S.; Capelli, L.; Céntola, P.; Del Rosso, R.; Il Grande, M. Odour emission factors for the prediction of odour emissions from plants for the mechanical and biological treatment of MSW. Atmos. Environ. 2006, 40, 7632–7643. [Google Scholar] [CrossRef]
- Hwang, Y.; Matsuo, T.; Hanaki, K.; Suzuki, N. Identification and quantification of sulfur and nitrogen containing odorous compounds in wastewater. Water Res. 1995, 29, 711–718. [Google Scholar] [CrossRef]
- Muezzinoglu, A. A study of volatile organic sulfur emissions causing urban odors. Chemosphere 2003, 51, 245–252. [Google Scholar] [CrossRef]
- Gostelow, P.; Parsons, S.A.; Stuetz, R.M. Odour measurements for sewage treatment works. Water Res. 2001, 35, 579–597. [Google Scholar] [CrossRef]
- Schiffman, S.S.; Williams, C.M. Science of odor as a potential health issue. J. Environ. Qual. 2005, 34, 129–138. [Google Scholar] [CrossRef] [PubMed]
- Kodama, K.; Horiguchi, T. Effects of hypoxia on benthic organisms in Tokyo Bay, Japan: A review. Mar. Pollut. Bull. 2011, 63, 215–220. [Google Scholar] [CrossRef] [PubMed]
- Naqvi, S.W.A.; Bange, H.W.; Bange, L.; Farías, P.M.S.; Scranton, M.I.; Zhang, J. Marine hypoxia/anoxia as a source of CH4 and N2O. Biogeosciences 2010, 7, 2159–2190. [Google Scholar] [CrossRef] [Green Version]
- Winneke, G.; Neuf, M.; Steinheider, B. Separating the impact of exposure and personality in annoyance response to environmental stressors, particularly odors. Environ. Int. 1996, 22, 73–81. [Google Scholar] [CrossRef]
- Kasanko, M.; Barredo, J.I.; Lavalle, C.; McCormick, N.; Demicheli, L.; Sagris, V.; Brezger, A. Are European cities becoming dispersed? A comparative analysis of 15 European urban areas. Landsc. Urban Plan. 2006, 77, 111–130. [Google Scholar] [CrossRef]
- Tagsold, C. Modernity, space and national representation at the Tokyo Olympics 1964. Urban Hist. 2010, 37, 289–300. [Google Scholar] [CrossRef]
- Chalkley, B.; Essex, S. Urban development through hosting international events: A history of the Olympic Games. Plan. Perspect. 1999, 14, 369–394. [Google Scholar] [CrossRef]
- Sorensen, A. Building world city Tokyo: Globalization and conflict over urban space. Ann. Reg. Sci. 2003, 37, 519–531. [Google Scholar] [CrossRef]
- Agus, E.; Zhang, L.; Sedlak, D.L. A framework for identifying characteristic odor compounds in municipal wastewater effluent. Water Res. 2012, 46, 5970–5980. [Google Scholar] [CrossRef] [PubMed]
- De Guardia, A.; Petiot, C.; Rogeau, D.; Druilhe, C. Influence of aeration rate on nitrogen dynamics during composting. Waste Manag. 2008, 28, 575–587. [Google Scholar] [CrossRef] [PubMed]
- Tatsuichi, S.; Iwasaki, Y.; Kayashima, M. Relationship between Threshold Odor Number and BOD of River Water. J. Jpn. Soc. Air Pollut. 1990, 25, 415–420. [Google Scholar] [CrossRef]
- Sawyer, C.N.; McCarty, P.L.; Parkin, G.F. Chemistry for Environmental Engineering, 4th ed.; McGraw-Hill: New York, NY, USA, 1994. [Google Scholar]
- Cox, B.A. A review of dissolved oxygen modelling techniques for lowland rivers. Sci. Total Environ. 2003, 314–316, 303–334. [Google Scholar] [CrossRef]
- Nihei, Y.; Yamaguchi, H.; Kashiwada, J.; Iwamoto, H. Do Environments in Tidal Rivers with Massive Fish Death. J. Jpn. Soc. Civ. Eng. 2009, B2-65, 1021–1025. [Google Scholar] [CrossRef]
- Rabalais, N.N.; Wiseman, W.J.; Turner, R.E. Comparison of continuous records of near-bottom dissolved oxygen from the hypoxia zone along the Louisiana coast. Estuaries 1994, 17, 850–861. [Google Scholar] [CrossRef]
- Ferrari, S.; Cribari-Neto, F. Beta Regression for Modelling Rates and Proportions. J. Appl. Stat. 2004, 31, 799–815. [Google Scholar] [CrossRef]
- Cribari-Neto, F.; Zeileis, A. Beta Regression in R. J. Stat. Softw. 2010, 34, 1–24. [Google Scholar] [CrossRef]
- Nordin, A.; Göttert, D.; Vinnerås, B. Decentralised black water treatment by combined auto-thermal aerobic digestion and ammonia—A pilot study optimising treatment capacity. J. Environ. Manag. 2018, 207, 313–318. [Google Scholar] [CrossRef] [PubMed]
- Ribera-Guardia, A.; Pijuan, M. Distinctive NO and N2O emission patterns in ammonia oxidizing bacteria: Effect of ammonia oxidation rate, DO and pH. Chem. Eng. J. 2017, 321, 358–365. [Google Scholar] [CrossRef]
- Eganhouse, R.P.; Sherblom, P.M. Anthropogenic organic contaminants in the effluent of a combined sewer overflow: Impact on Boston Harbor. Mar. Environ. Res. 2001, 51, 51–74. [Google Scholar] [CrossRef]
- Huntley, S.L.; Iannuzzi, T.J.; Avantaggio, J.D.; Carlson-Lynch, H.; Schmidt, C.W.; Finley, B.L. Combined sewer overflows (CSOs) as sources of sediment contamination in the lower Passaic River, New Jersey. II. Polychlorinated dibenzo-p-dioxins, polychlorinated dibenzofurans, and polychlorinated biphenyls. Chemosphere 1997, 34, 233–250. [Google Scholar] [CrossRef]
- Iannuzzi, T.J.; Huntley, S.L.; Schmidt, C.W.; Finley, B.L.; McNutt, R.P.; Burton, S.J. Combined sewer overflows (CSOs) as sources of sediment contamination in the lower Passaic River, New Jersey. 1. Priority pollutants, and inorganic chemicals. Chemosphere 1997, 34, 213–231. [Google Scholar] [CrossRef]
- Horie, N. Current Status of Combined Sewer System in Japan. Presented at Japan-Korea Special Workshop on Impact Assessment and Control of Combined Sewer Overflow, Tokyo, Japan, October 2011. [Google Scholar]
- Tibbetts, J. Combined sewer systems: Down, dirty, and out of date. Environ. Health Perspect. 2005, 113, A464–A467. [Google Scholar] [CrossRef] [PubMed]
- Urase, T. Aldehyde Type Odor as a Cause of Sewage Odor at the Tama River; The Tokyu Foundation for Better Environment: Tokyo, Japan, 2010. (In Japanese) [Google Scholar]
- Cleveland, W.S. Robust locally weighted regression and smoothing scatterplots. J. Am. Stat. Assoc. 1979, 74, 829–836. [Google Scholar] [CrossRef]
Figure 1.
Map of Greater Tokyo Area and the rivers and the locations of water sampling points. Up (S) and Down (S) are the upstream and downstream sampling points of the Shakujii River, and Up (K) and Down (K) are the upstream and downstream sampling points of the Kanda River.
Figure 1.
Map of Greater Tokyo Area and the rivers and the locations of water sampling points. Up (S) and Down (S) are the upstream and downstream sampling points of the Shakujii River, and Up (K) and Down (K) are the upstream and downstream sampling points of the Kanda River.

Figure 2.
Unpleasantness of odor by type. 1.0 = most unpleasant and 0.0 = least unpleasant. The means are used as odor score in the analysis. They are: Aromatic (0.26); Plant (0.37); Chemical/oil (0.63); Earthy/musty (0.64); Fishy (0.70), and; Foul/rotten (0.86).
Figure 2.
Unpleasantness of odor by type. 1.0 = most unpleasant and 0.0 = least unpleasant. The means are used as odor score in the analysis. They are: Aromatic (0.26); Plant (0.37); Chemical/oil (0.63); Earthy/musty (0.64); Fishy (0.70), and; Foul/rotten (0.86).

Figure 3.
Transition of odor and BOD concentration (12-month moving average of monthly data): (a) Shakujii River and (b) Kanda River. The moving average of odor from April 1995 to March 1998 is not shown because of missing data from 1995 to 1997. The scale of BOD concentration is different for the Shakujii and the Kanda rivers.

Figure 4.
DO concentration and odor score: (a) Shakujii River and (b) Kanda River.
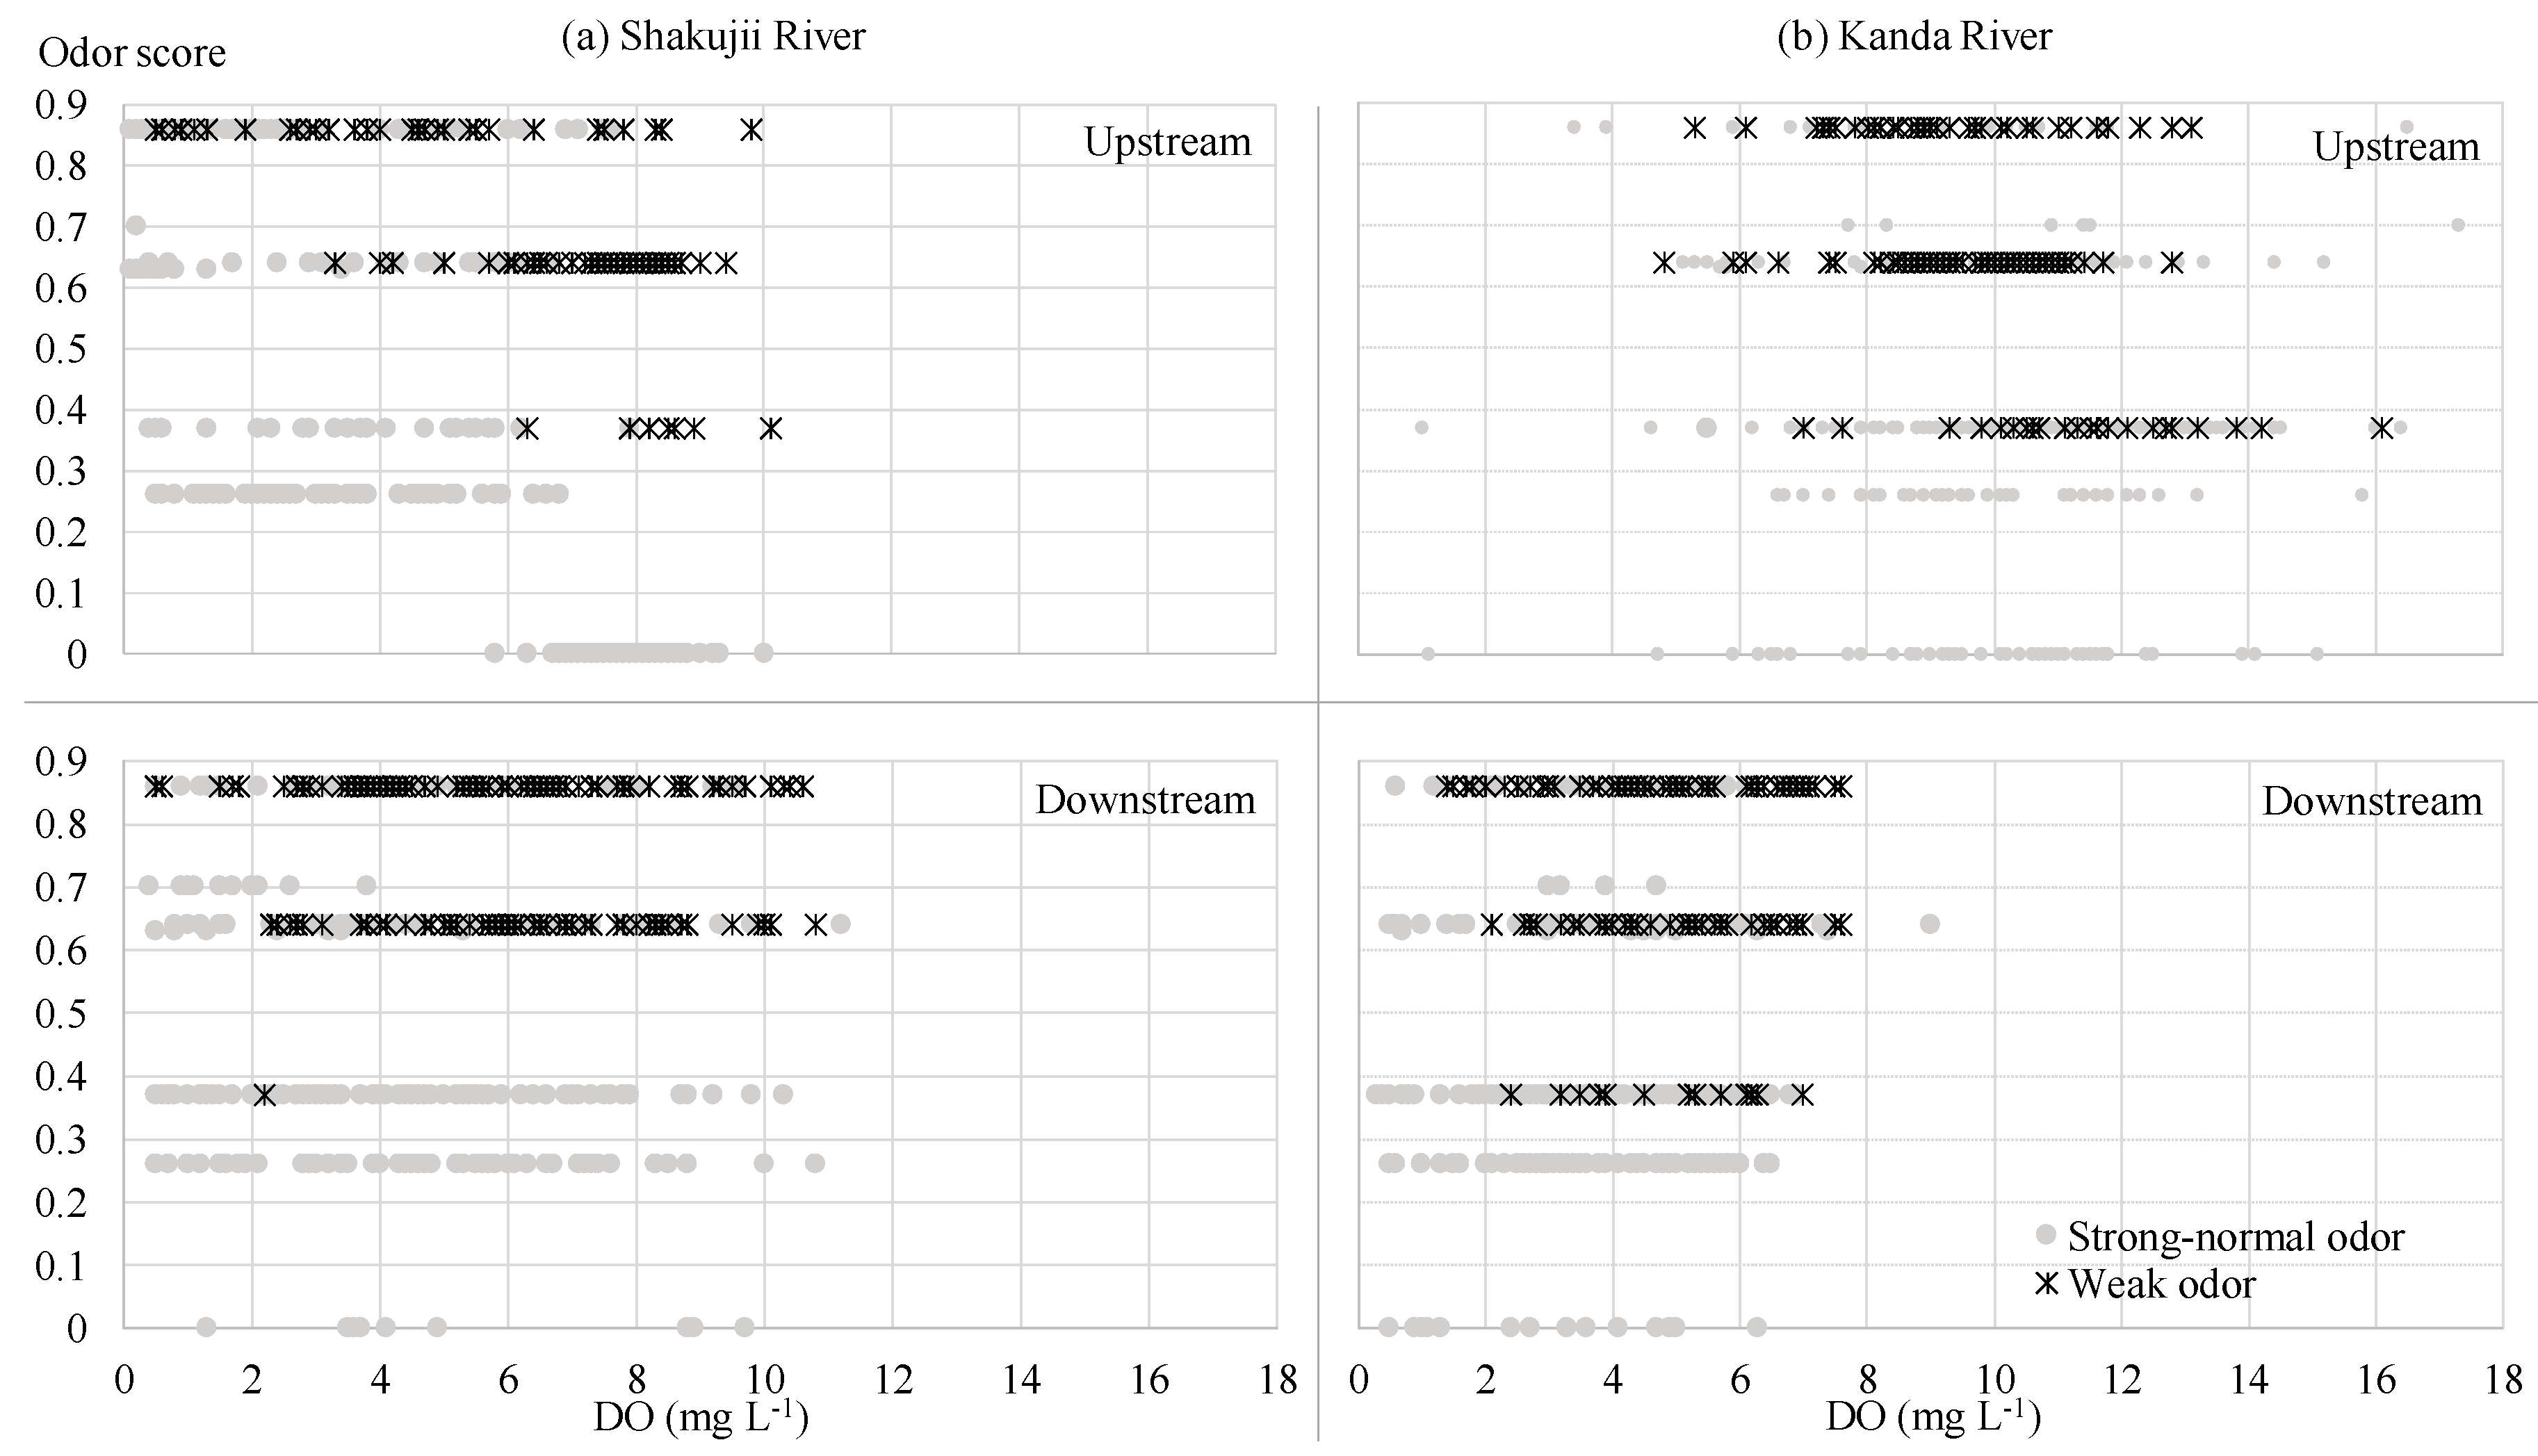
Figure 5.
Development of DO and BOD concentrations at the upstream and downstream sampling points: (a) Shakujii River and (b) Kanda River.
Figure 5.
Development of DO and BOD concentrations at the upstream and downstream sampling points: (a) Shakujii River and (b) Kanda River.
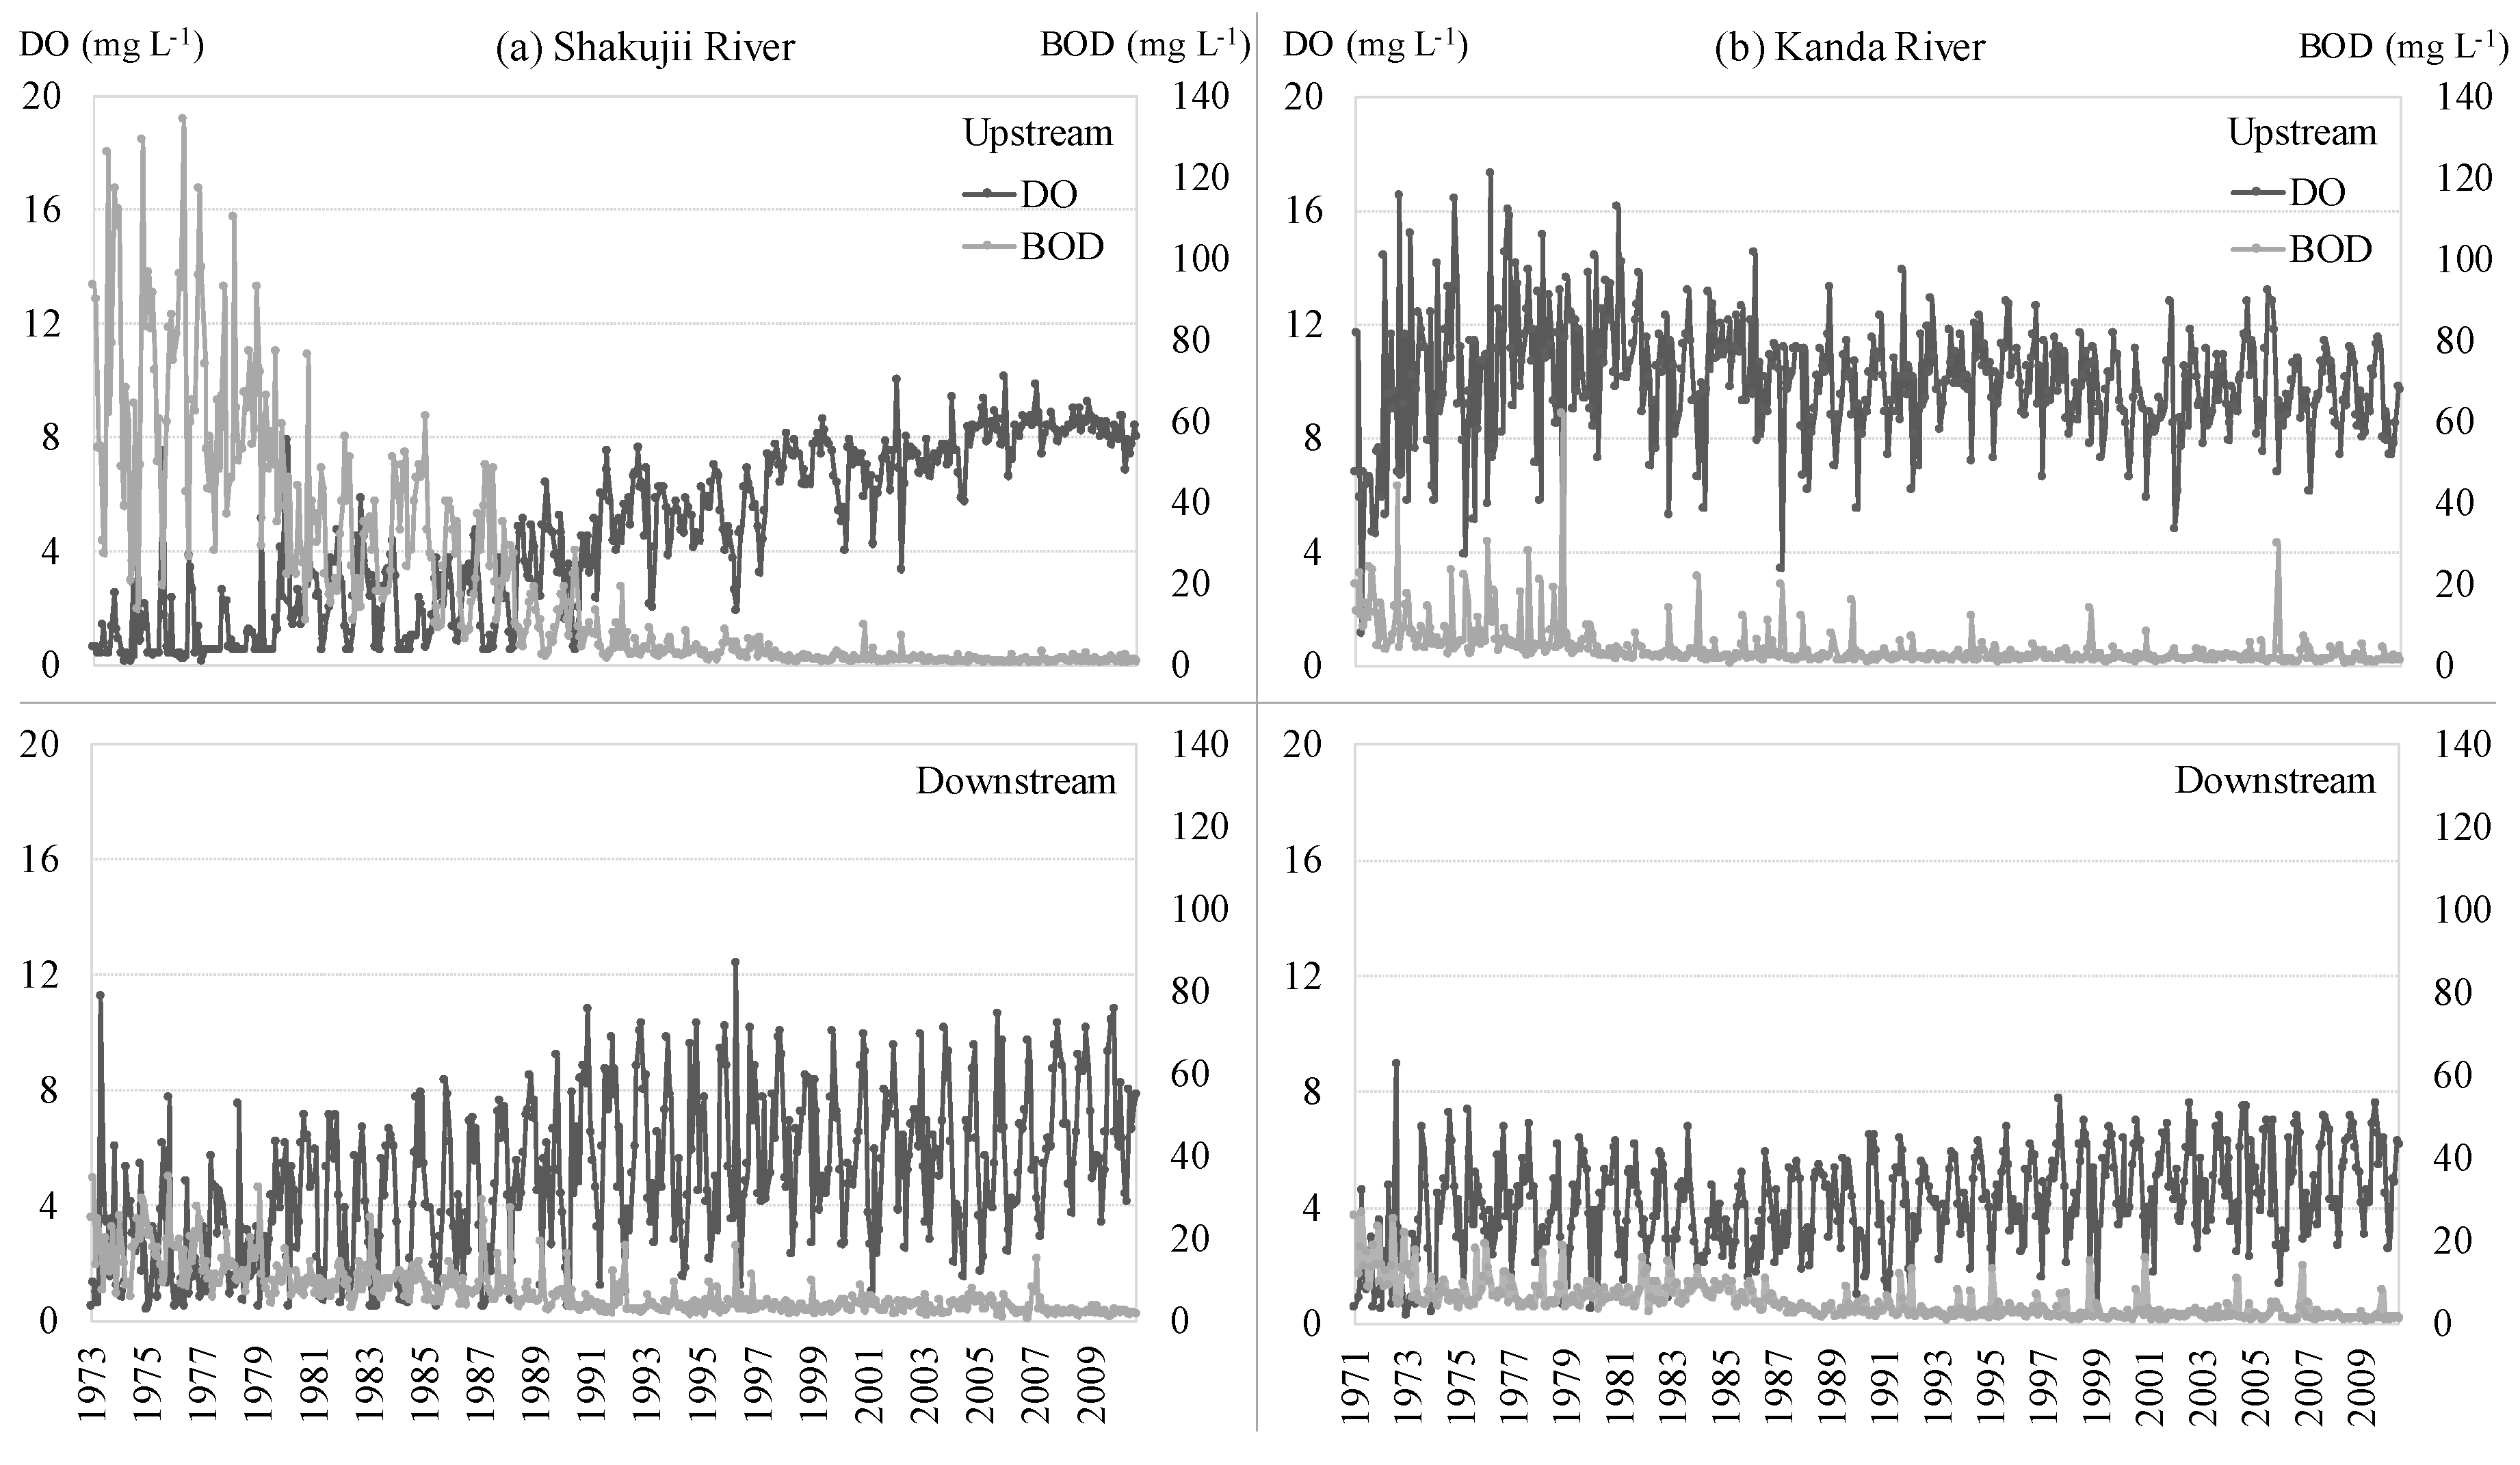
Figure 6.
Locations of sampling points and discharge points. The amount of effluent from Ochiai Water Reclamation Center (OWRC flow) is estimated by: OWRC flow = C − (A + B).
Figure 6.
Locations of sampling points and discharge points. The amount of effluent from Ochiai Water Reclamation Center (OWRC flow) is estimated by: OWRC flow = C − (A + B).

Figure 7.
The ratio of effluent from Ochiai Water Reclamation Center to flow at midstream of the Kanda River with scatter plot of odor score downstream of the Kanda River. The ratio is calculated by: Ratio = OWRC flow/Flow at C. The horizontal line is a locally weighted scatter plot smoothing (LOWESS) curve.


Table 1.
Consolidated odor groups and original odor.
| Consolidated Group | Original Record |
|---|---|
| Aromatic | Aroma, Detergent |
| Chemical/oil | Chemical, Oil |
| Earthy/musty | Earth, Mold |
| Fishy | Fishy |
| Foul/rotten | Foul, Hydrogen sulfide, Rotten, Sewage |
| Plant | Grass, Plant, Sea grass, Water plant |
| None | Odorless |
Table 2.
Aggregated mean of dissolved oxygen (DO) and biochemical oxygen demand (BOD) concentrations in river water.
Table 2.
Aggregated mean of dissolved oxygen (DO) and biochemical oxygen demand (BOD) concentrations in river water.
| River | DO (mg L−1) | BOD (mg L−1) | |||||
|---|---|---|---|---|---|---|---|
| Mean | 75th Percentile | Minimum | Mean | 75th Percentile | Maximum | ||
| 1970s | Shakujii | 2.1 | 2.9 | 0.1 | 38.5 | 54.0 | 170.0 |
| 1980s | 4.3 | 5.9 | 0.5 | 16.3 | 21.0 | 76.0 | |
| 1990s | 7.7 | 10.3 | 0.5 | 3.8 | 4.3 | 28.0 | |
| 2000s | 8.2 | 10.1 | 1.0 | 2.0 | 2.3 | 15.0 | |
| 1970s | Kanda | 7.0 | 8.9 | 0.3 | 13.1 | 17.0 | 62.0 |
| 1980s | 7.3 | 9.5 | 0.5 | 7.3 | 10.0 | 29.0 | |
| 1990s | 7.4 | 9.3 | 0.5 | 3.8 | 4.5 | 20.0 | |
| 2000s | 7.6 | 9.1 | 0.5 | 2.4 | 2.5 | 30.0 | |
Table 3.
Seasonality of DO concentration.
| Coefficient | OR | t-Value | |
|---|---|---|---|
| April–September | −0.52 | 0.59 | −11.96 ** |
| October–December | −0.25 | 0.78 | −4.97 ** |
| Constant | 1.84 | 51.91 ** |
Dependent variable is January–March period. ** p < 0.01. Odds ratio (OR).
Table 4.
Relation between odor score and water quality indices.
| Shakujii | Kanda | Expected Sign | |||||
|---|---|---|---|---|---|---|---|
| Coefficient | Coefficient | OR | z-Value | Coefficient | OR | z-Value | |
| DO model | |||||||
| Downstream (dummy) | 0.27 | 1.31 | 9.61 ** | 1.31 | 3.69 | 9.98 ** | + |
| DO conc. | −0.13 | 0.87 | 5.17 ** | 0.16 | 1.18 | 7.64 ** | - |
| Constant | 0.61 | 1.84 | −11.23 ** | −1.79 | 0.17 | −8.36 ** | |
| pseudo R2 | 0.16 | 0.15 | |||||
| BOD model | |||||||
| Downstream (dummy) | 0.55 | 1.73 | 10.37 ** | 0.43 | 1.53 | 2.83 ** | + |
| BOD conc. | 0.02 | 1.02 | 15.66 ** | −0.06 | 0.94 | 11.73 ** | + |
| Constant | −0.49 | 0.62 | −10.44 ** | 0.10 | 1.10 | −11.69 ** | |
| pseudo R2 | 0.27 | 0.21 | |||||
** p < 0.01. Dependent variable is odor score. Downstream dummy: upstream = 0 and downstream = 1. Odds ratio (OR) was calculated from the coefficient.
© 2018 by the authors. Licensee MDPI, Basel, Switzerland. This article is an open access article distributed under the terms and conditions of the Creative Commons Attribution (CC BY) license (http://creativecommons.org/licenses/by/4.0/).
Share and Cite
MDPI and ACS Style
Sado-Inamura, Y.; Fukushi, K. Considering Water Quality of Urban Rivers from the Perspectives of Unpleasant Odor. Sustainability 2018, 10, 650. https://doi.org/10.3390/su10030650
AMA Style
Sado-Inamura Y, Fukushi K. Considering Water Quality of Urban Rivers from the Perspectives of Unpleasant Odor. Sustainability. 2018; 10(3):650. https://doi.org/10.3390/su10030650
Chicago/Turabian StyleSado-Inamura, Yukako, and Kensuke Fukushi. 2018. "Considering Water Quality of Urban Rivers from the Perspectives of Unpleasant Odor" Sustainability 10, no. 3: 650. https://doi.org/10.3390/su10030650
Note that from the first issue of 2016, this journal uses article numbers instead of page numbers. See further details here.