Article

Post-Disaster Business Recovery and Sustainable Development: A Study of 2008 Wenchuan Earthquake

1
School of Construction Management and Real Estate, Chongqing University, Chongqing 40045, China
2
School of Construction Management and Real Estate, Research Center for Construction Economy and Management, Chongqing University, Chongqing 40045, China
3
Faculty of Architecture and Urban Planning, Key Laboratory of New Technology for Construction of Cities in Mountain Area, Chongqing University, Chongqing 400030, China
*
Authors to whom correspondence should be addressed.
Sustainability 2018, 10(3), 651; https://doi.org/10.3390/su10030651
Submission received: 21 December 2017 / Revised: 26 January 2018 / Accepted: 27 February 2018 / Published: 28 February 2018
(This article belongs to the Special Issue Disasters, Crisis, Hazards, Emergencies and Sustainable Development)

Abstract

:
Business sectors are essential for community prosperity, and thus it is important to investigate the recovery of businesses after disasters. However, current studies on business recovery after natural disasters are limited, particularly a lack of empirical observations in developing countries. Our observations of the patterns and transformations of small businesses in the recovery process after the 2008 Wenchuan earthquake in China can bridge this gap and provide a valuable contribution to academia. We conducted research through a four-year longitudinal study to track small business recovery in Beichuan County since 2014. Field observations, repeat photography, and semi-structured interviews were used to collect data. The operating status, business type, and spatiotemporal changes of small businesses in the new business district, Banaqia, were demonstrated. Overall, less than 50% of the planned shops were occupied and in operation, and this figure keeps declining from 2014 to 2017. Catering, garments, and souvenirs are the primary business types, but they show individual patterns in terms of sustainable development and spatial configuration. The results help to inform the development of recovery policies following disasters in developing countries.

1. Introduction

When a community encounters disasters, the ability of local businesses to survive is an important factor in the recovery process because businesses play a crucial socio-economic role in the community by providing jobs, goods and services, and tax revenue [1]. However, post-disaster restoration is affected not only by direct physical impact on businesses at the time of events, but also by the ways in which disasters create long-term disturbance to business owners [2]. Disasters may cause extended periods of business interruption, logistic difficulties, revenue decline due to the loss of customers and other operational issues [2].
Disaster research has focused on documenting the ways in which hazards affect individuals, households, communities, and public sector organizations [3,4,5]. Some have looked at how private sector entities prepare for, respond to, and recover from disasters [6,7]. Substantial numbers of empirical work on natural disasters [8,9] not only have dealt with the issues of small communities and firms [10,11], but have included governments, large cites and multi-national corporations as well [3]. An important difference between the sizes is that smaller communities tend to have fewer resources than their larger counterparts [12].
Some research has concentrated on disasters and their impact on businesses. Researchers at the Disaster Research Center at the University of Delaware investigated the impact of major disasters, including the 1993 Midwest floods, Hurricane Andrew in 1992, and the Loma Prieta and Northridge earthquakes [6,13]. They found that direct physical damage was only one of the many factors influencing business loss and recovery. Disruption to infrastructure services, such as utilities and transportation, could have a significant consequence as well. Other operational problems, such as difficulties with supplies and shipment, or drops in customer traffic and demand, could also be phenomenal [14]. Small businesses, particularly in developing countries, have a higher probability of being located in hazard prone areas, equipped with unsafe business facilities and not having enough human and financial resources, as well as the necessary knowledge of their vulnerability in the face of hazards [15,16,17].
In addition, business characteristics such as primary market and ownership structures may also play an important role in post disaster recovery and operation. Sole proprietorship and local businesses are less likely to get access to multiple locations once a disaster strikes; as a result, they are more vulnerable to disasters [18]. Businesses that depended chiefly on non-local markets tend to be better than home-based ones precisely because their products or services are tied to a wider range of regional or national areas where disaster-related problems are relatively small [19,20]. Similarly, joint ventures and non-local market businesses are more likely to achieve sustainable operations after a disaster because they can help each other when one of them falls into poor operation. In addition, disaster impact, disruption of raw material supply, reduced employees, and loss of customers appear to have a significant relationship with a firm’s ability to recover from a disaster [18,21].
There are few studies on post-disaster business sustainable operations. Most research is on sustainable business operations, focused on how businesses improve their development level and competitiveness in non-disaster settings [22,23]. If it takes disasters into consideration, the sustainable operation of a business that initially survived a disaster will generally have a similar meaning to long-term business recovery after disaster; namely, how short-term survived businesses can achieve long-term recovery after a disaster.
This paper focused on the Banaqia commercial streets as a study area and performed a four-year longitudinal study researching the post-disaster sustainable development of Banaqia Business Street in New Beichuan City. The research contributes to disaster literature and practice in three areas. First, it helps to inform the policy making of post-disaster reconstruction in developing countries such as China. Second, it adds insights into how small businesses are impacted by disasters and recover from the shocks. Third, it also sheds light on the understanding of small business unsustainability in new planned cities—which burgeon during the rapid urbanization in China.
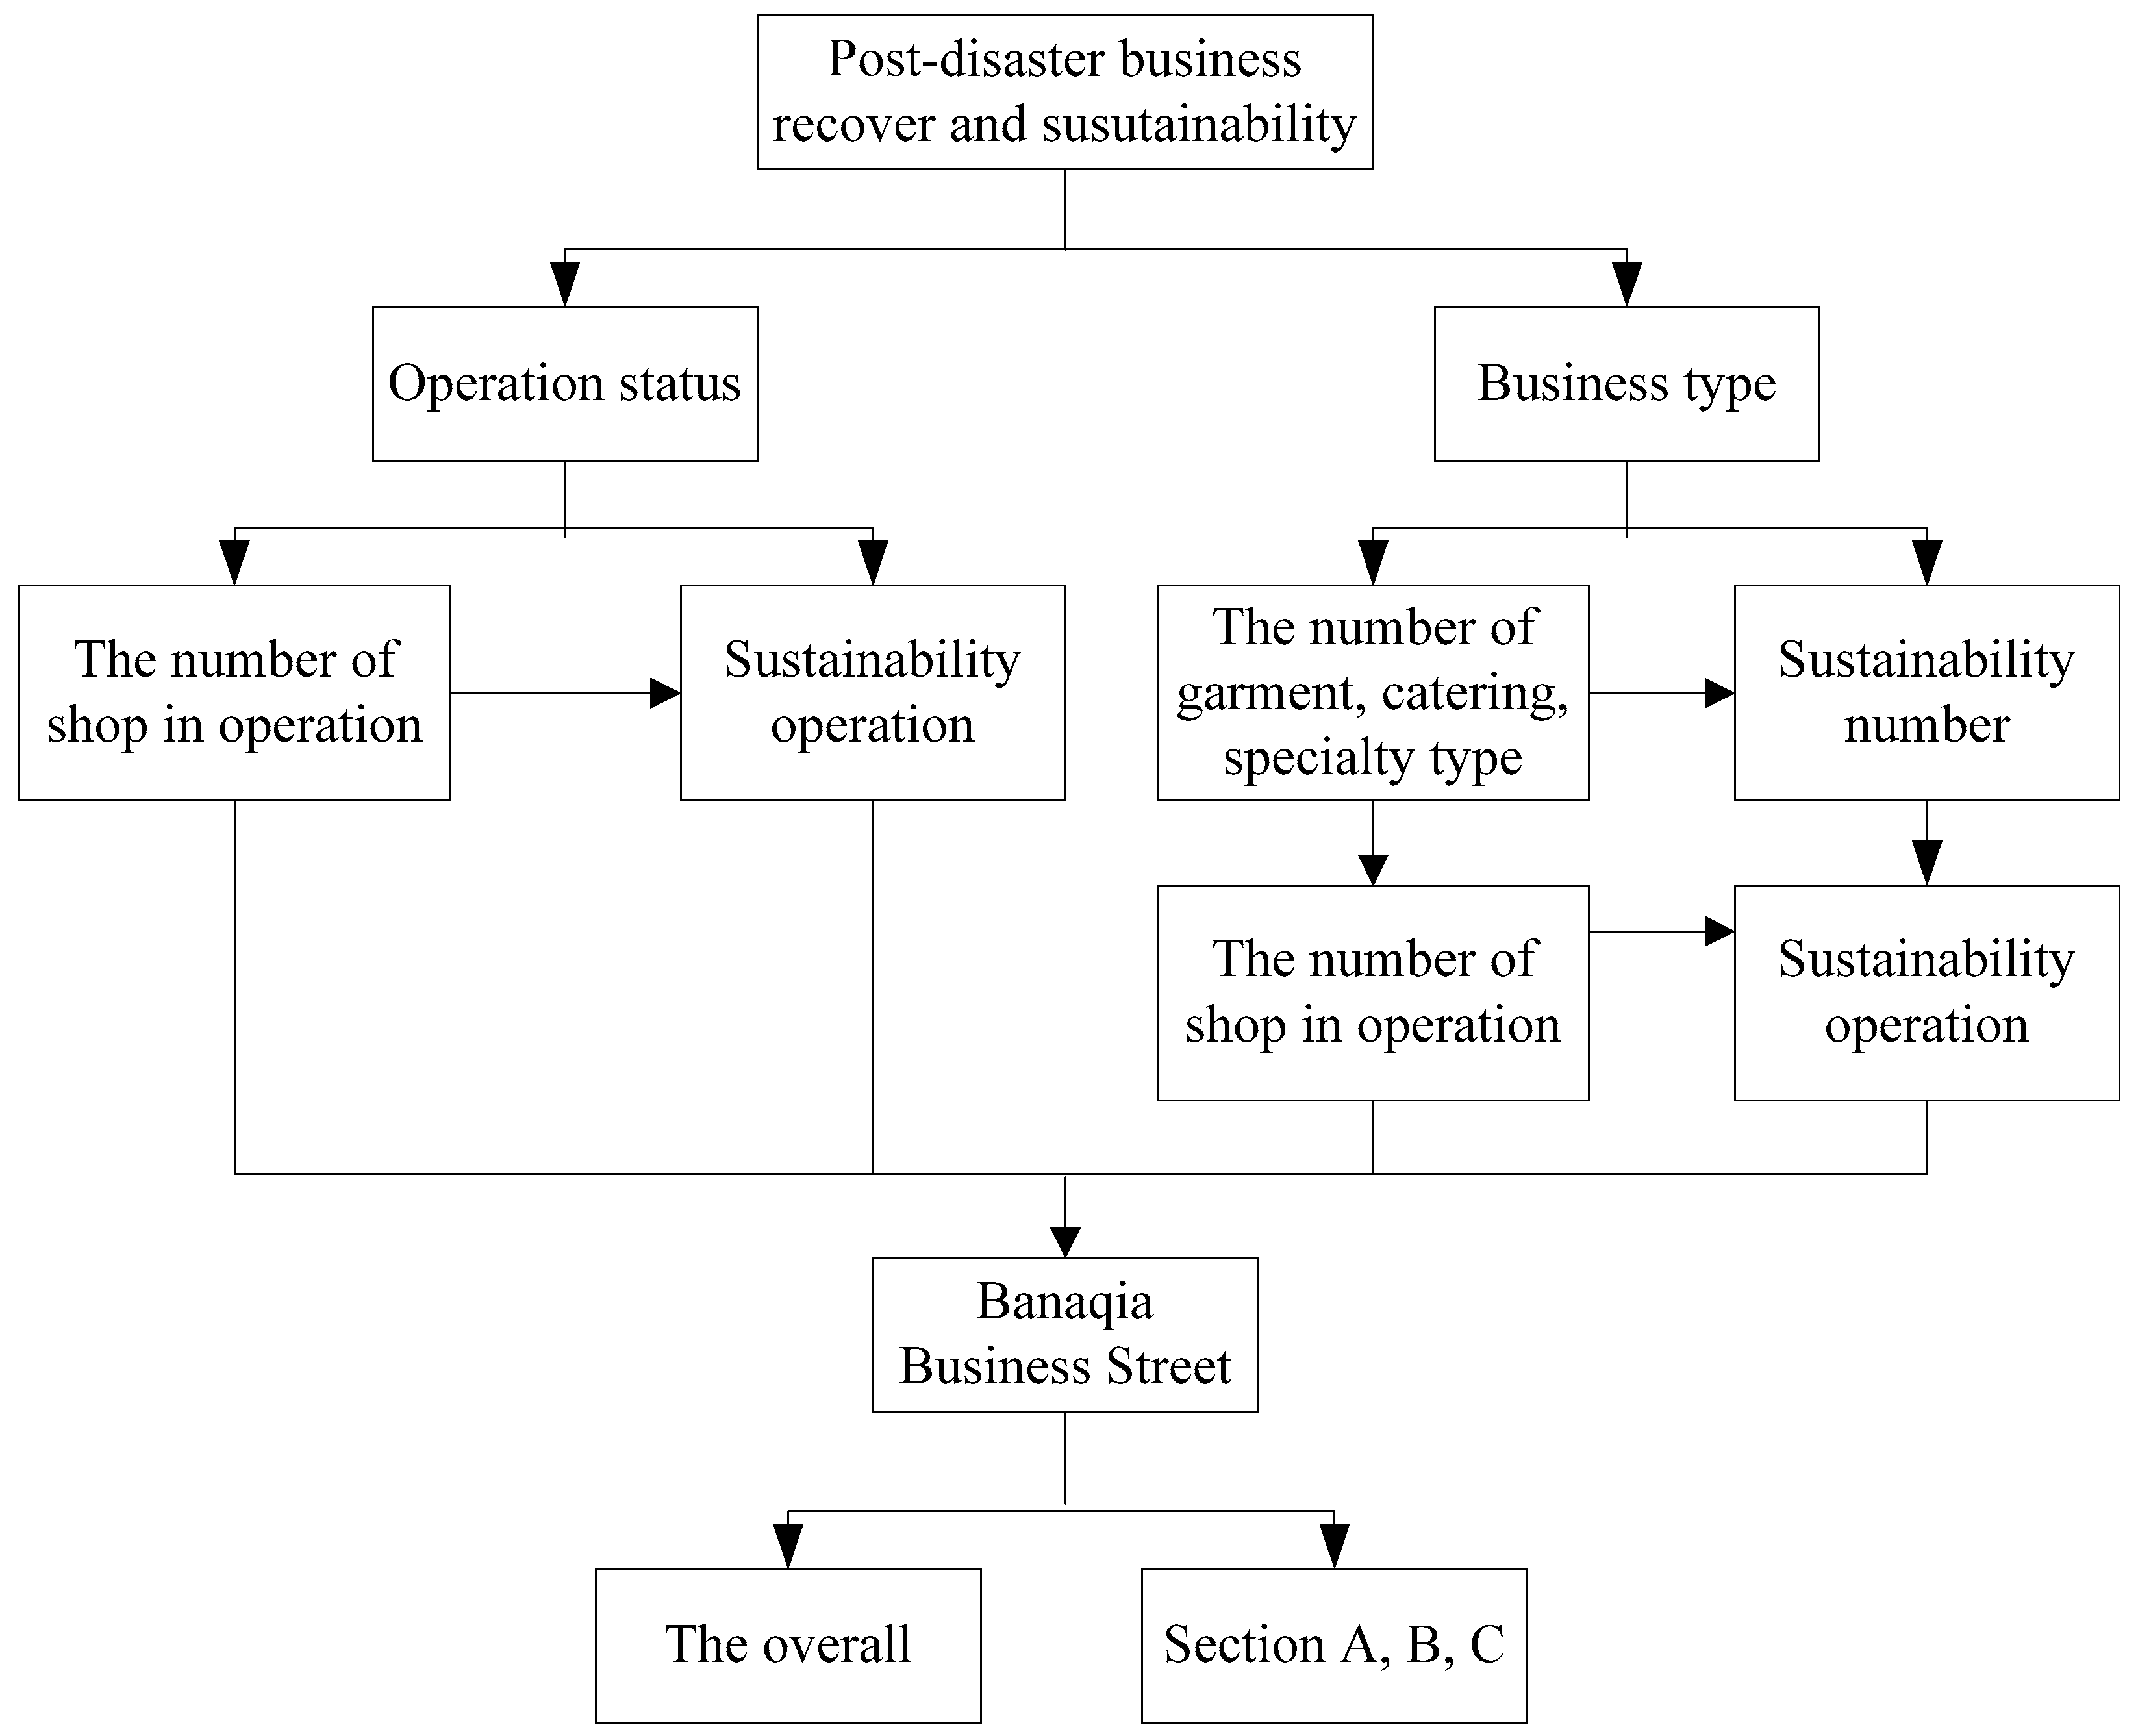
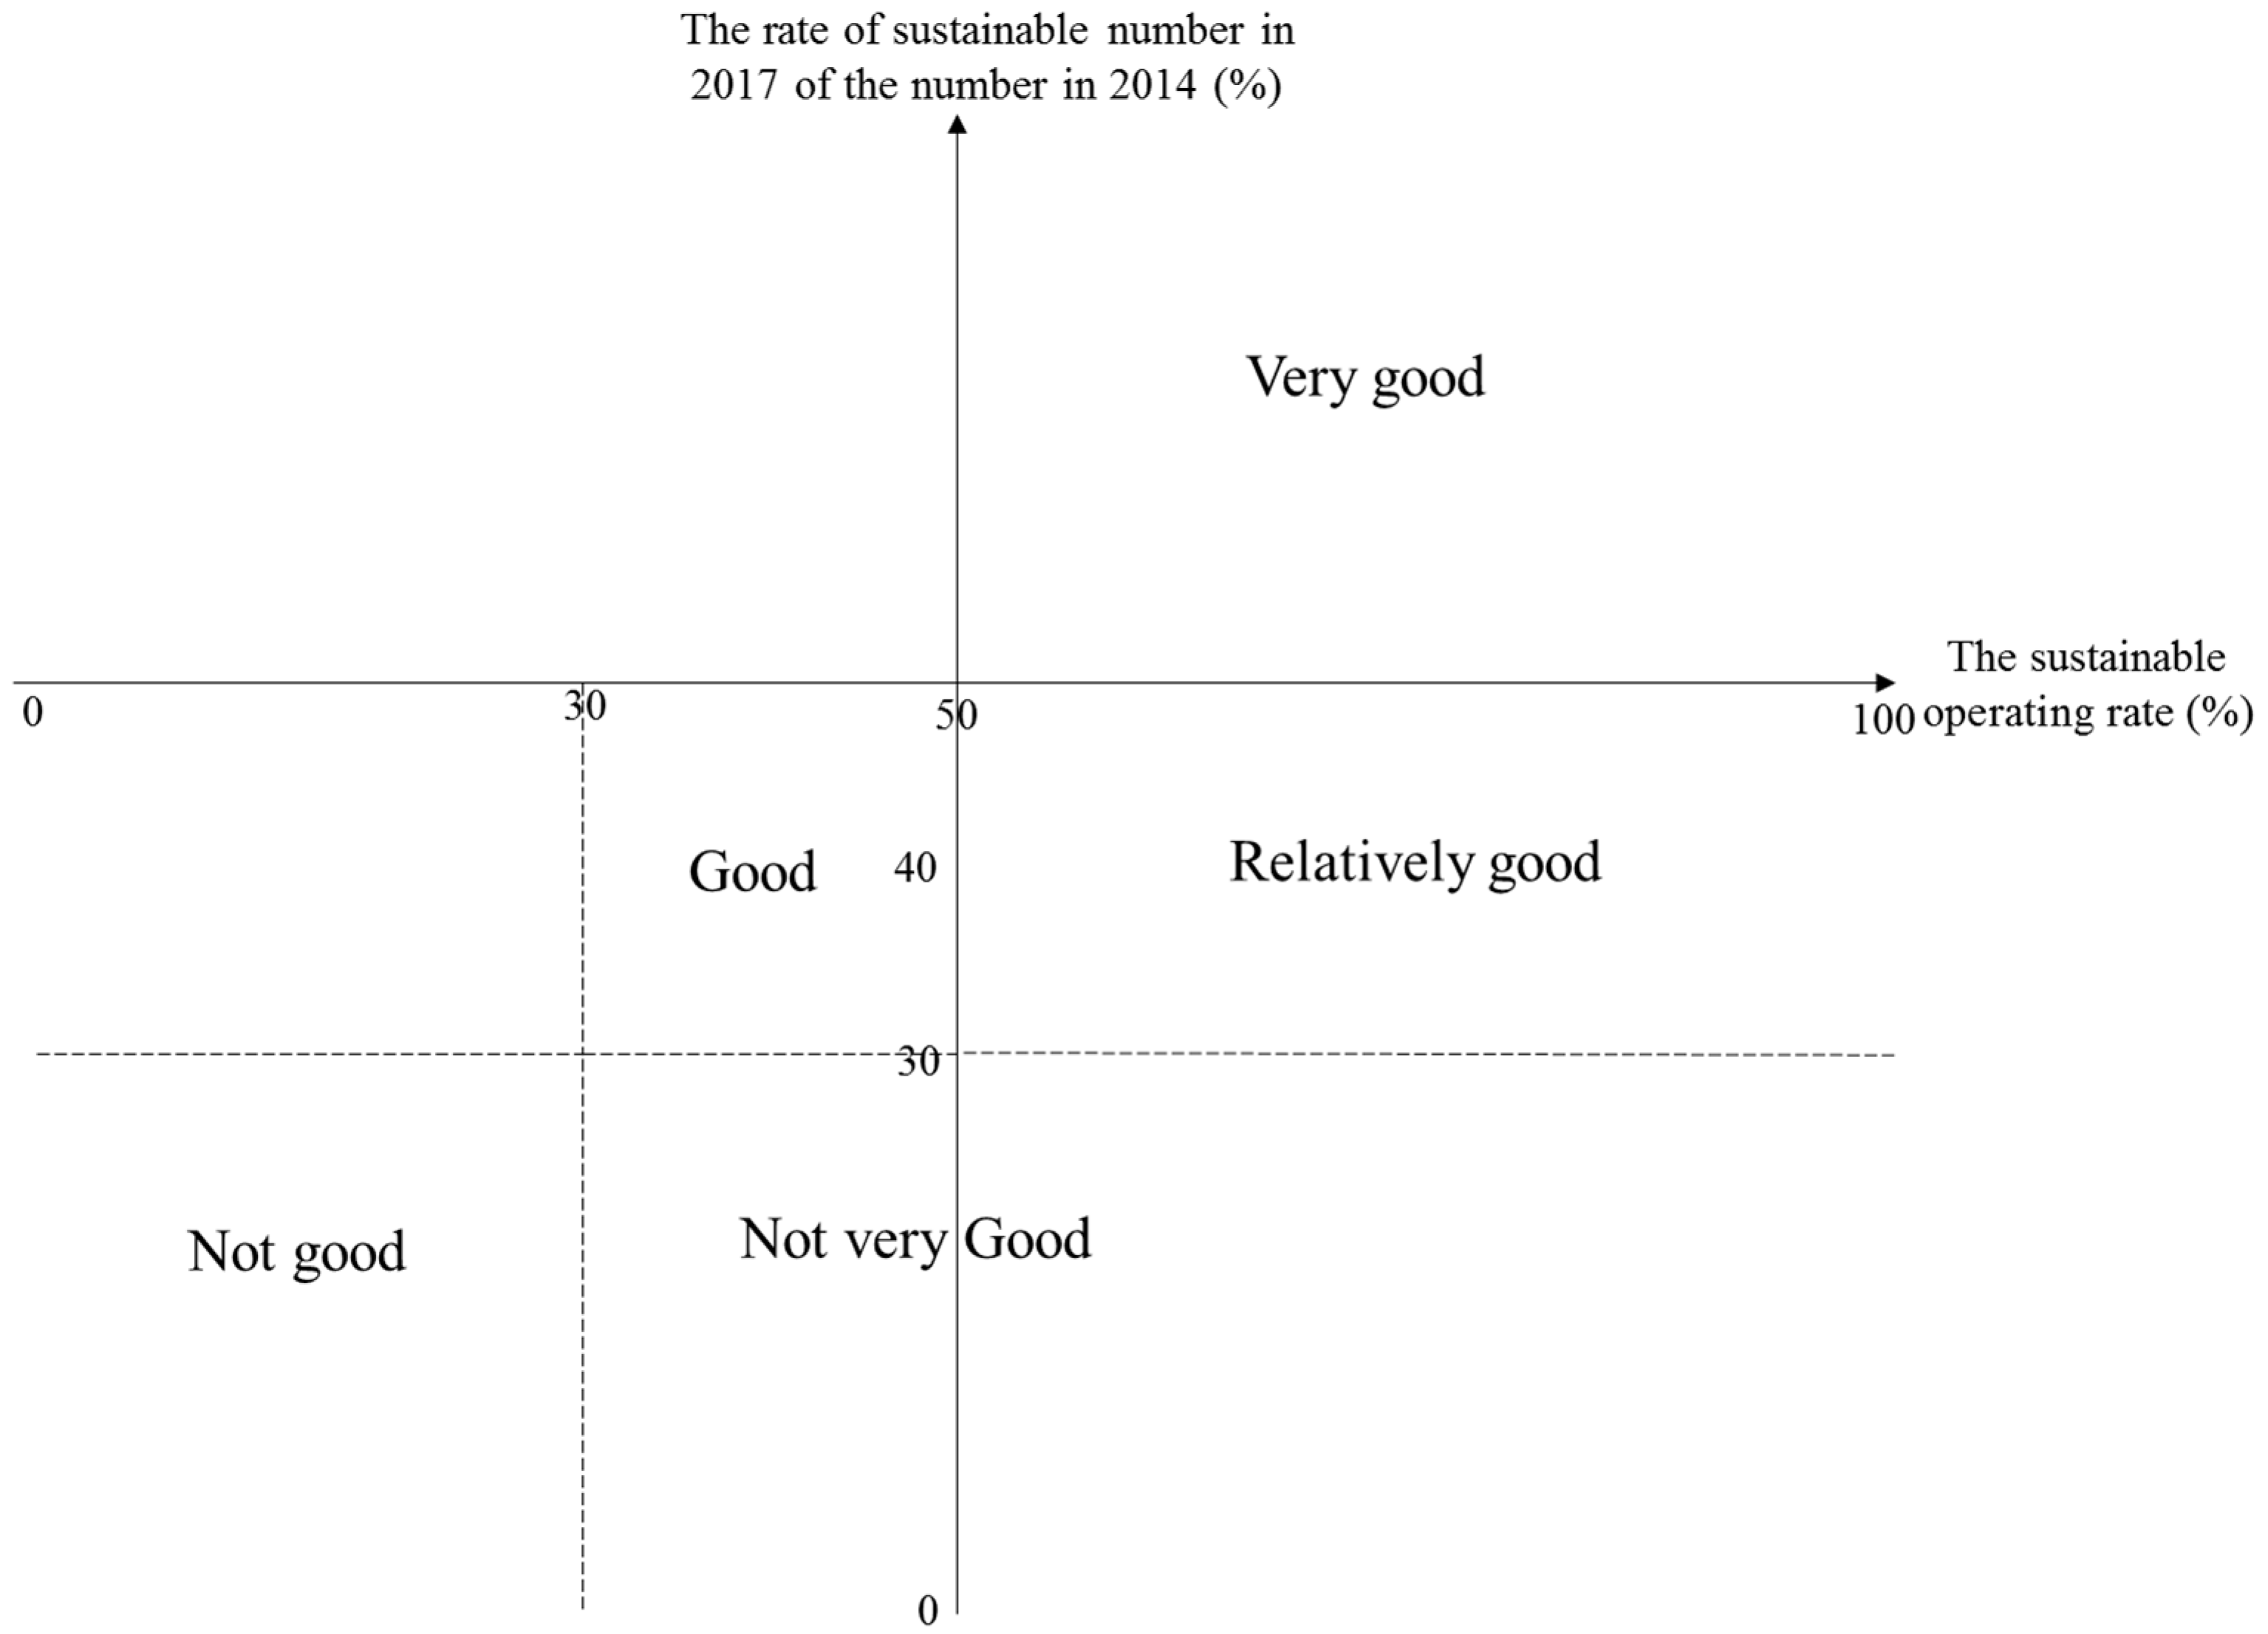
Based on the disaster recovery and sustainable development literature reviewed above, an analytical framework was developed (Figure 1) that contains four components of post-disaster business recovery and sustainability development: (1) the temporal fluctuation of the number of stores in Banaqia Business Street; (2) the sustainable operation rate of shops in Banaqia Business Street; (3) the evolution of business type in Banaqia; and (4) the sustainable development of business type in Banaqia.
This paper was organized into the following sections. It commences with an introduction of the Banaqia district and the research methods employed. It then analyzes the spatial patterns of different business types and the sustainable development of the stores located in three districts in Banaqia. It concludes with a discussion of the spatiotemporal transformation of small businesses in Banaqia and other similar areas in China.

2. Background

On 12 May 2008, a devastating earthquake hit the southwest of China. Over 60,000 people were killed, around 17,000 were declared missing, and almost 400,000 were injured. The disaster resulted in 23.17 billion RMB of direct losses due to structural damages [24]. Shortly after the earthquake, the central government of China coordinated a nationwide effort to help the earthquake-impacted areas recover [25].
The capital of Beichuan County, which accounts for 58.67% of the total population, was the most devastated major town, with 15,646 fatalities and 4932 missing. Beichuan County was buried by a landslide and became inhabitable. It was ranked as one of the most damaged areas. Later, the damaged city was preserved and protected as an earthquake museum.
Beichuan City is the only Qiang Autonomous County in China. For the great importance of the development and revitalization of ethnic minorities, and protecting the ethnic cultural heritage of Qiang nationally, Beichuan City’s recovery and reconstruction drew national attention. After the earthquake, the Party Central Committee and the State Council gave instructions to “Make sure to construct Beichuan well” and “Construct a new Beichuan”. Beichuan City’s reconstruction was to be the symbol of the whole post-disaster reconstruction. However, experts repeatedly demonstrated to the government that Beichuan City could not be reconstructed locally, and determined “2 km northeast of Anchang Town” as the best site for New Beichuan City. The selected site is 23 km from the old city. Many experts, including six academics of the Chinese Academy of Sciences and Chinese Academy of Engineering, participated in New Beichuan City’s planning and design.
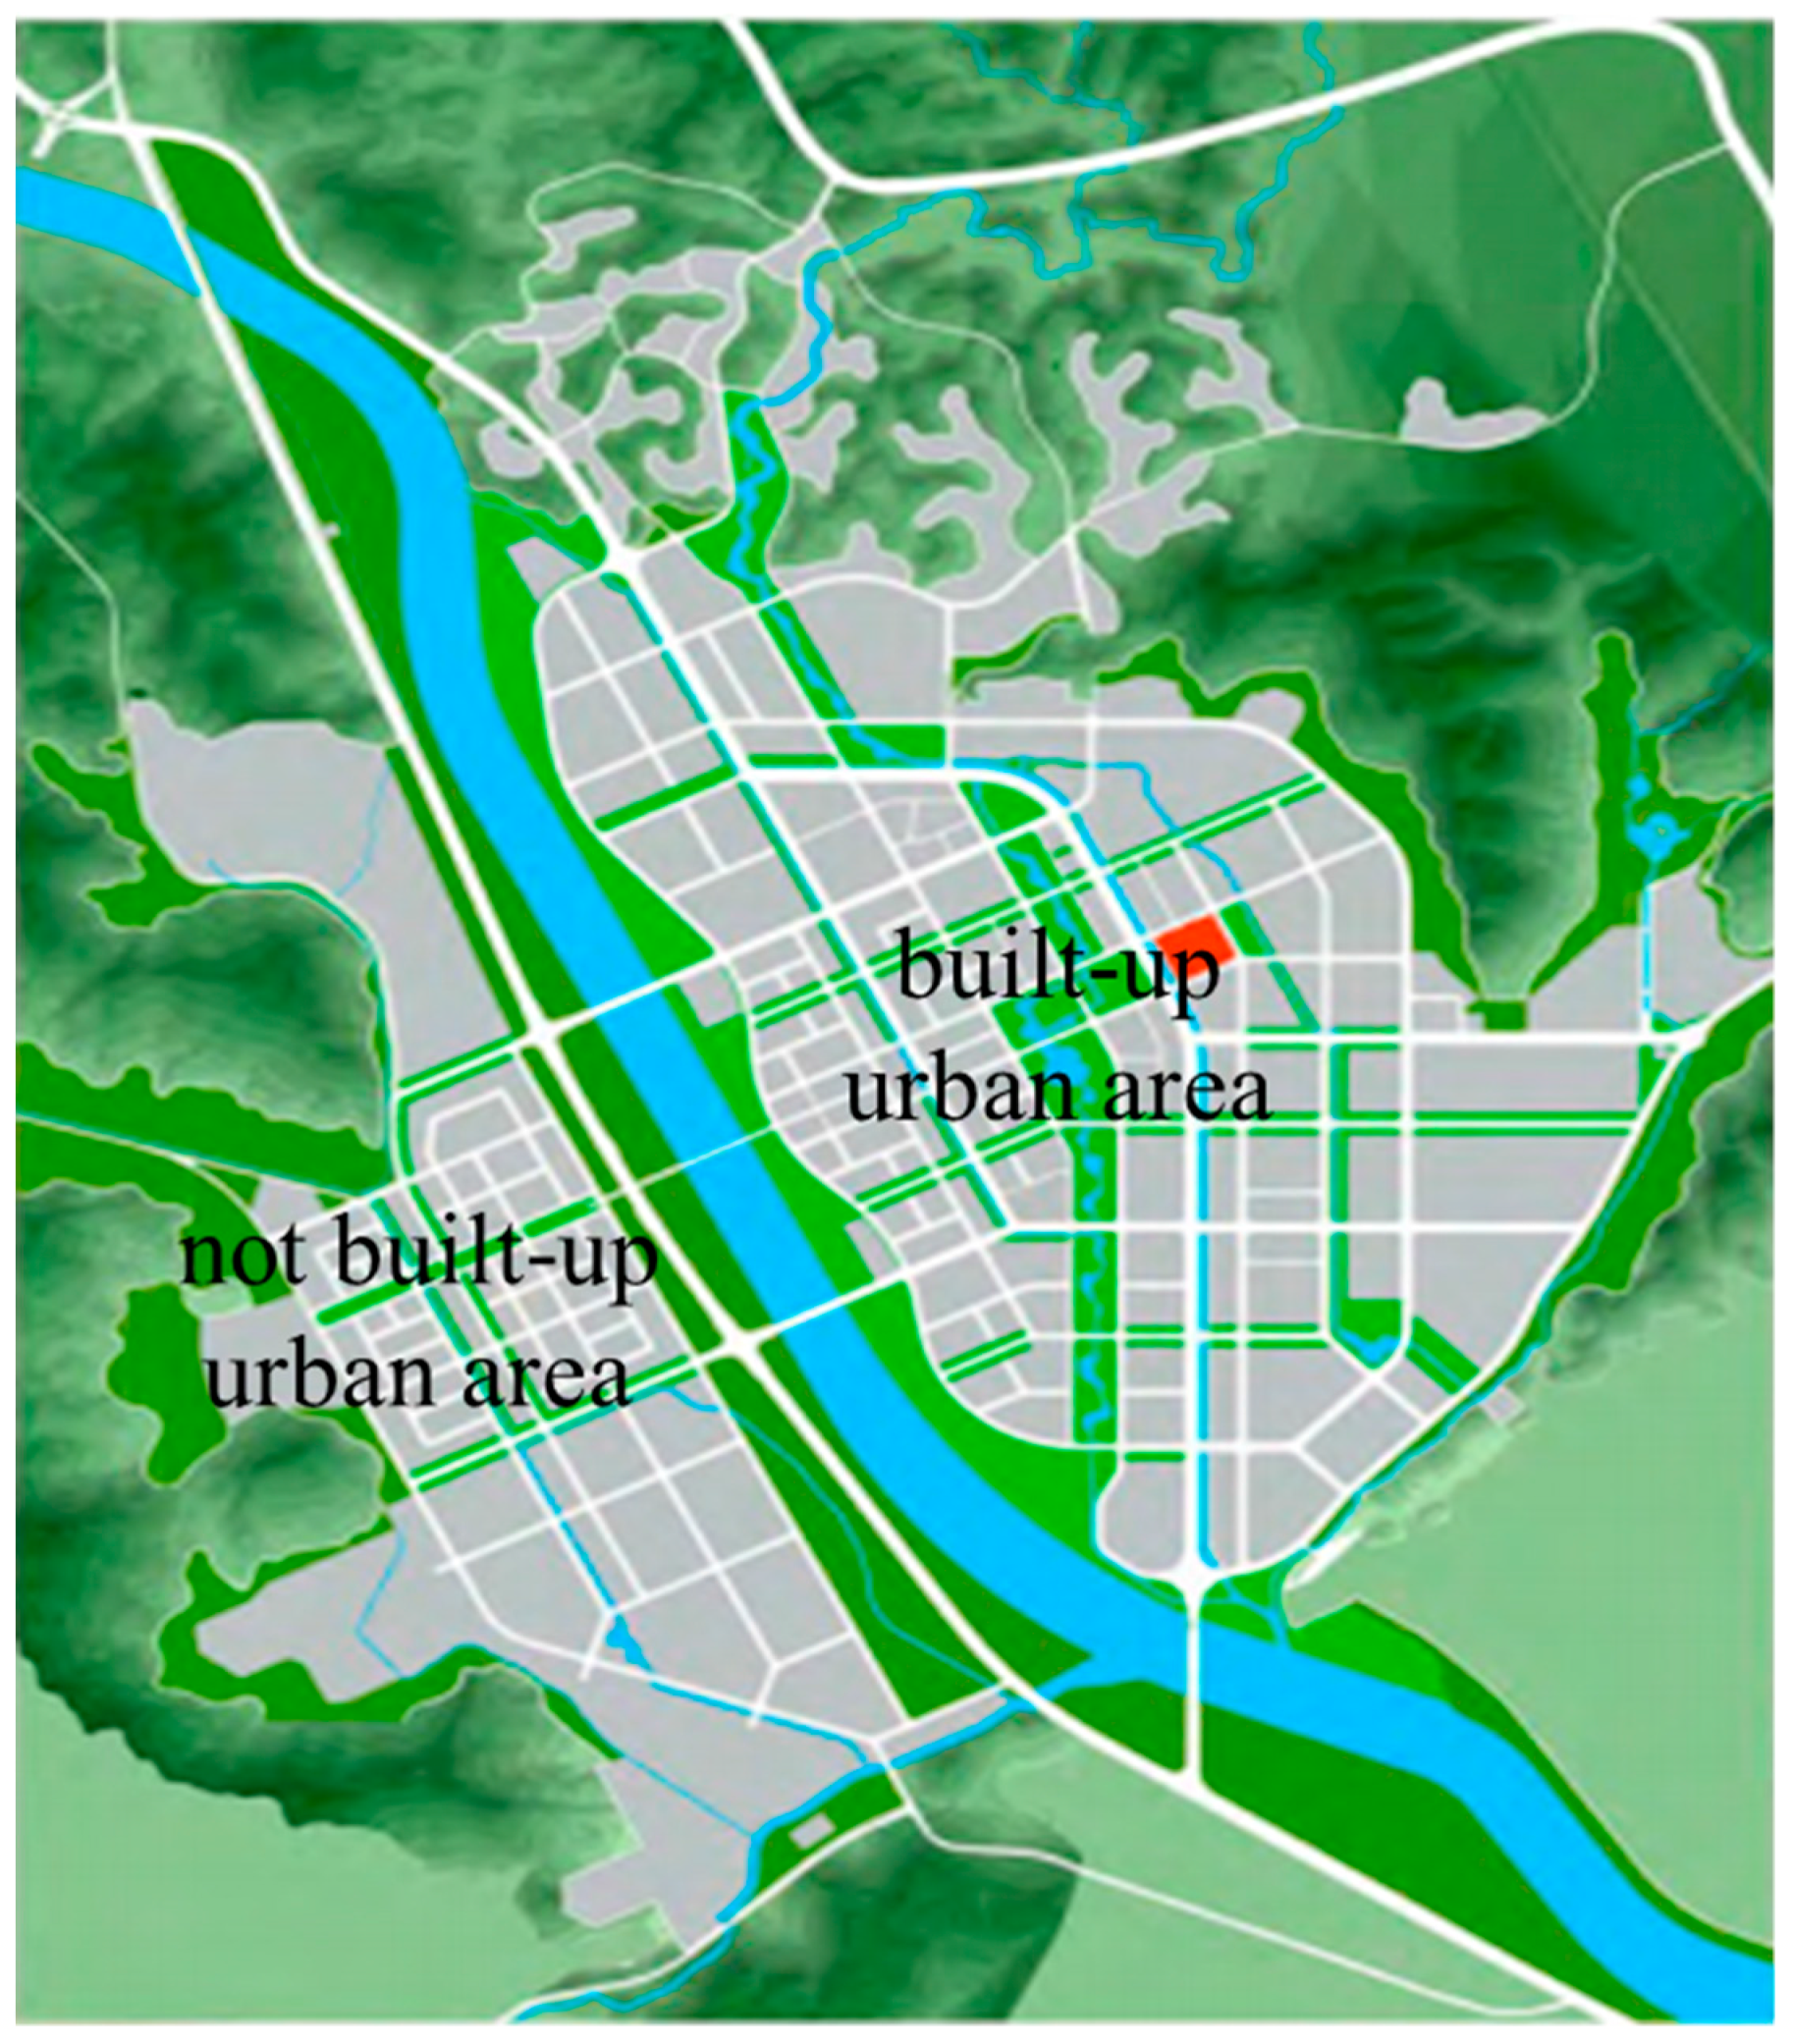
In total, 218 projects were started simultaneously through the hard work of 30,000 construction workers, using more than 1000 tower cranes. After 15 months, all projects were completed. The construction of New Beichuan City was something of a miracle in the history of Chinese urban construction. The built-up area covers 4 km2 (Figure 2), with a resident population of 35,000. Within New Beichuan City, we can see a lot of buildings with Qiang characteristics have been built, such as Banaqia Business Street, and Beichuan Museum, which has greatly promoted the quality of the physical environment of the city. The appearance and layout of the city even surpasses some central and eastern cities of the same size.
Town planning and construction are mainly initiated by top-down planning and discussions among governmental officials and experts, lacking the natural process whereby human settlements form, develop, and prosper. Since Beichuan was the only Qiang minority autonomous county in China, New Beichuan City was designed to demonstrate its inheritance and protect the Qiang ethnic culture. It was also designed as a tourism and eco-city. In other words, commerce and tourism are both crucial industries for the city. Among ten landmark buildings throughout the city, Banaqia Commercial Street is the most influential in terms of the role of promoting local economy and vitalizing the city. Furthermore, it may be concluded that the overall prospect of the commercial and tourism industries largely depends on whether Banaqia can develop sustainably.
Research regarding new businesses in rebuilt cities following disasters is relatively rare, yet of great importance. In China, central commercial districts represent the overall image and general competiveness of a city. The recent publicity of these districts in new town planning also reflects urban development and economic boom after the market reform in China in 1980s. Therefore, these featured commercial areas are significant for the rebuilt counties after the earthquake. For instance, Banaqia’s commercial areas largely serve as an axis of the New Beichuan City, lead economic development, and grow as the city expands. According to planning documents, the New Beichuan City would accomplish several new goals: the transformation of the developmental patterns of mountainous urban areas in Beichuan, the promotion of labor force migration from rural to urban areas, and the development of commercial, vacation, tourism, and other service-related industries. These industries are crucial to new towns; most importantly, Banaqia is home to these industries and thus plays a pivotal role in the spatial layout of urban functions.
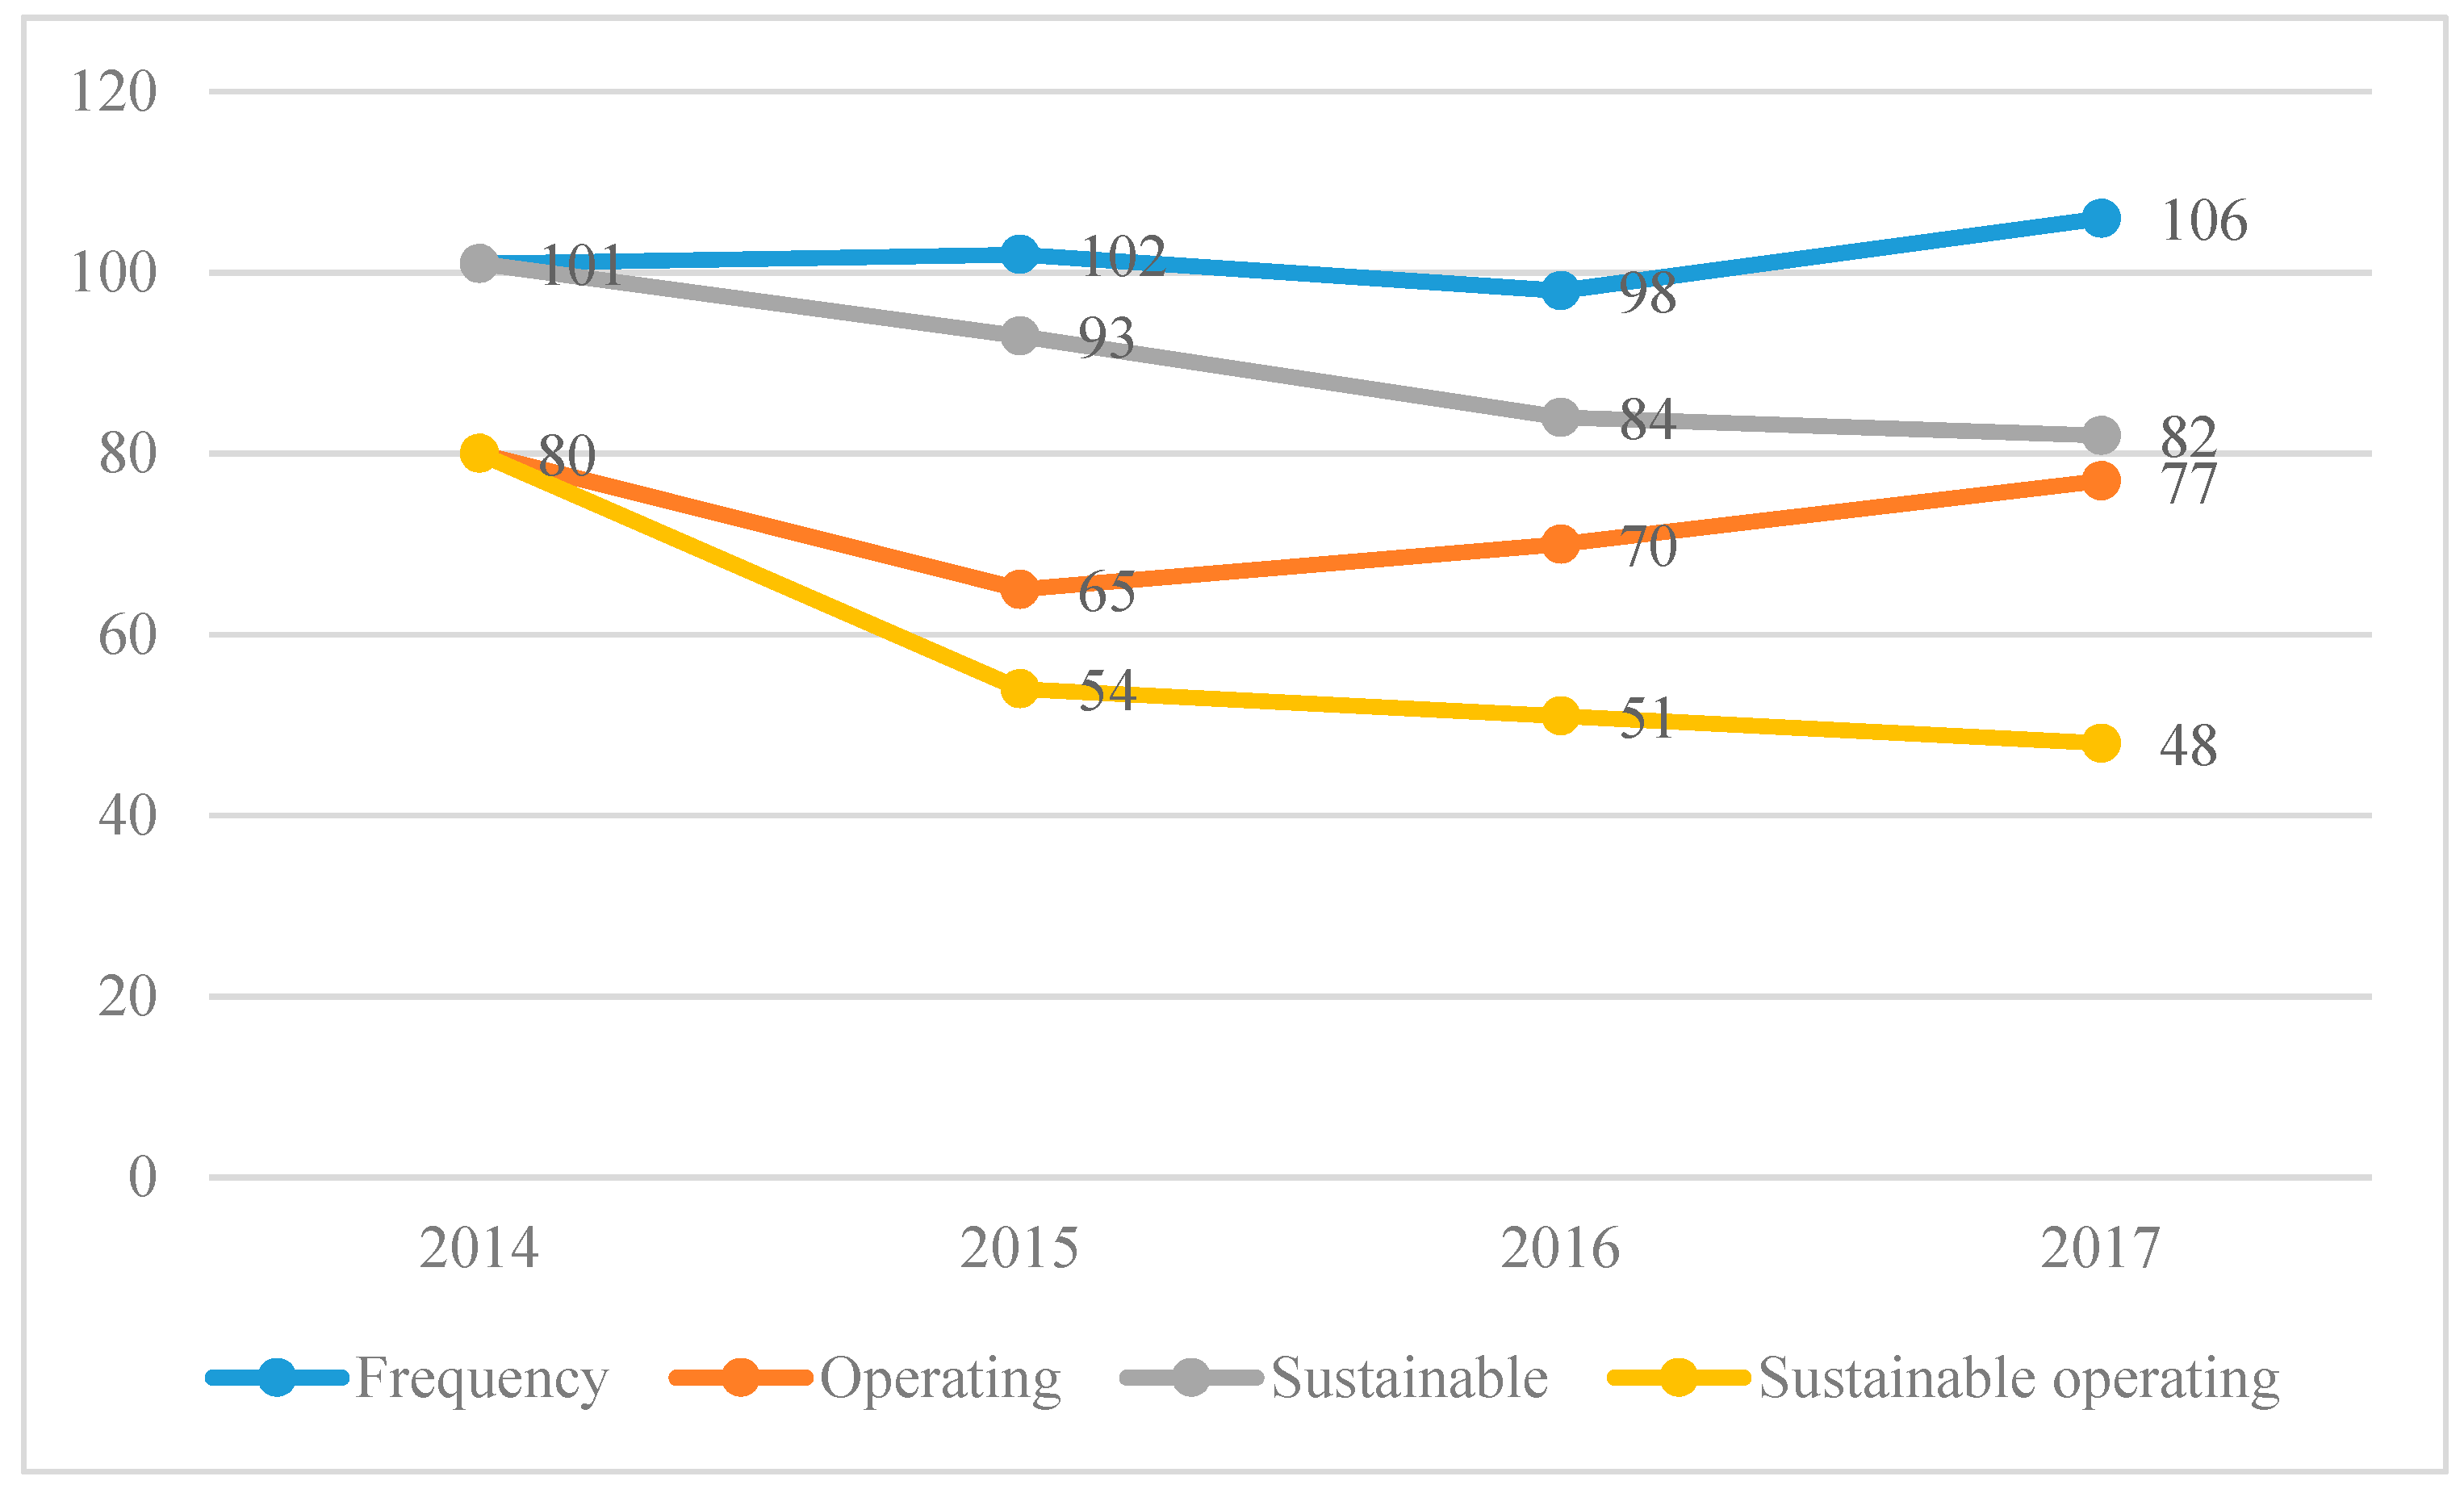
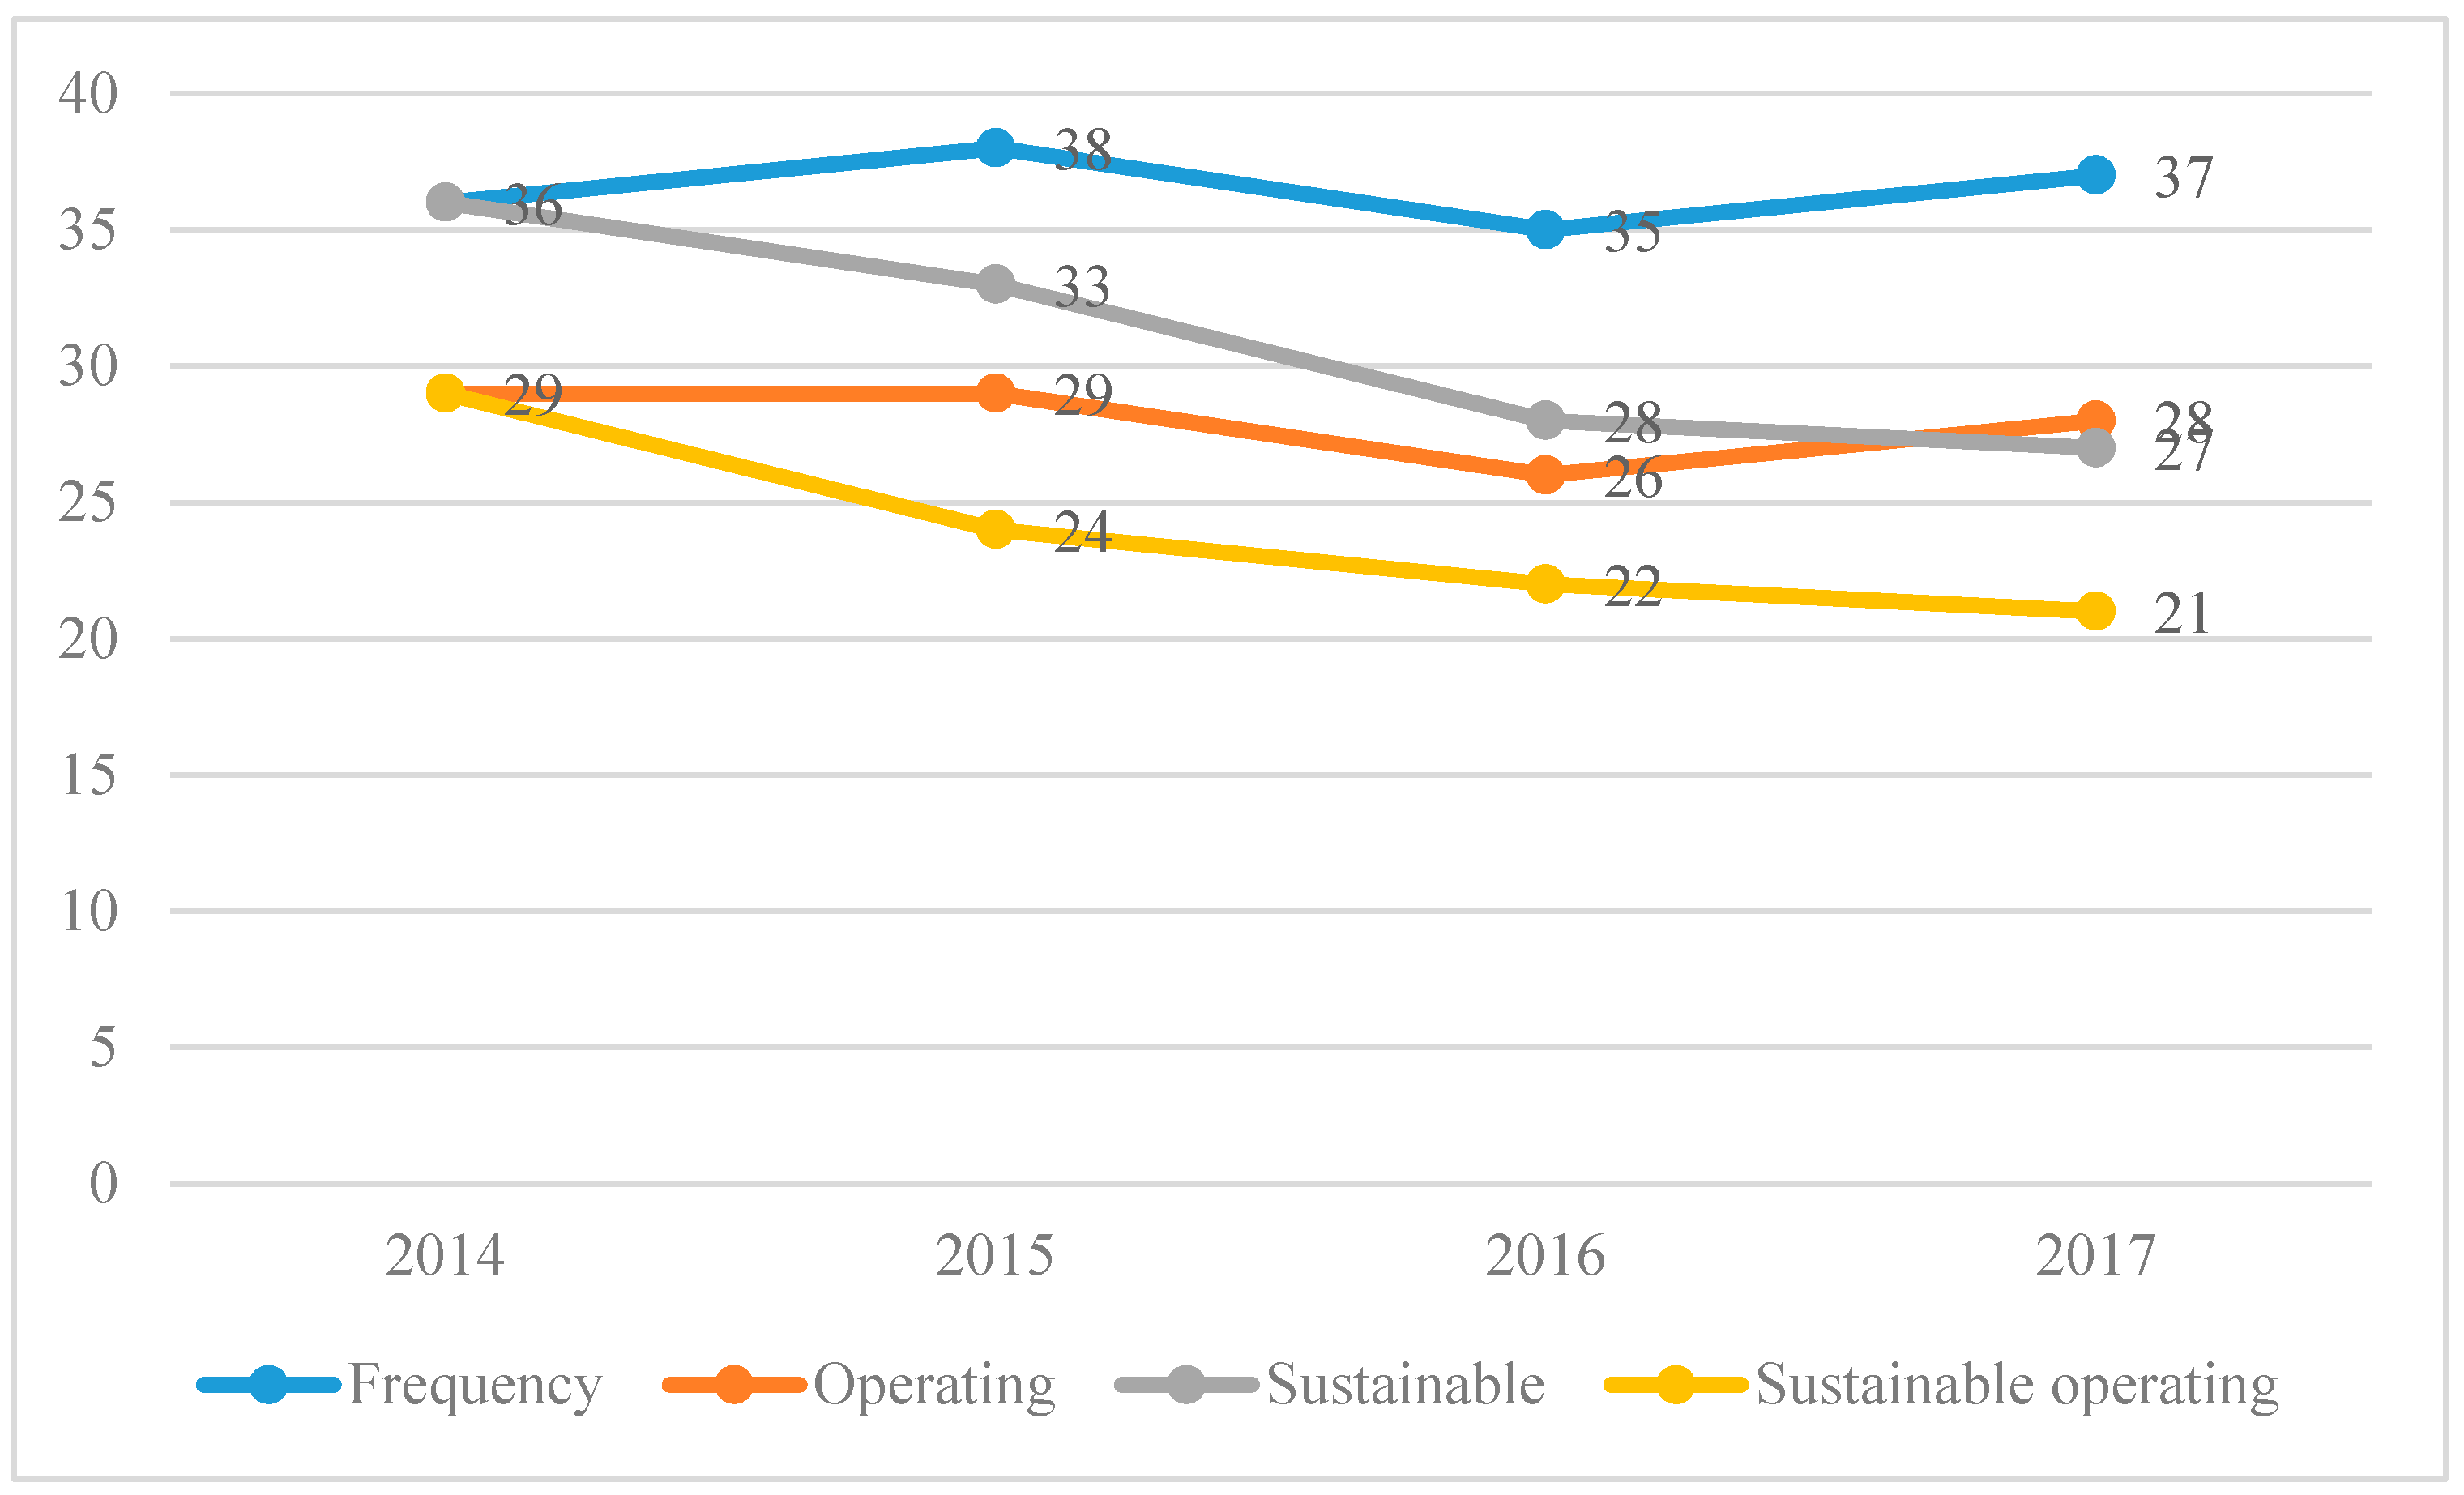
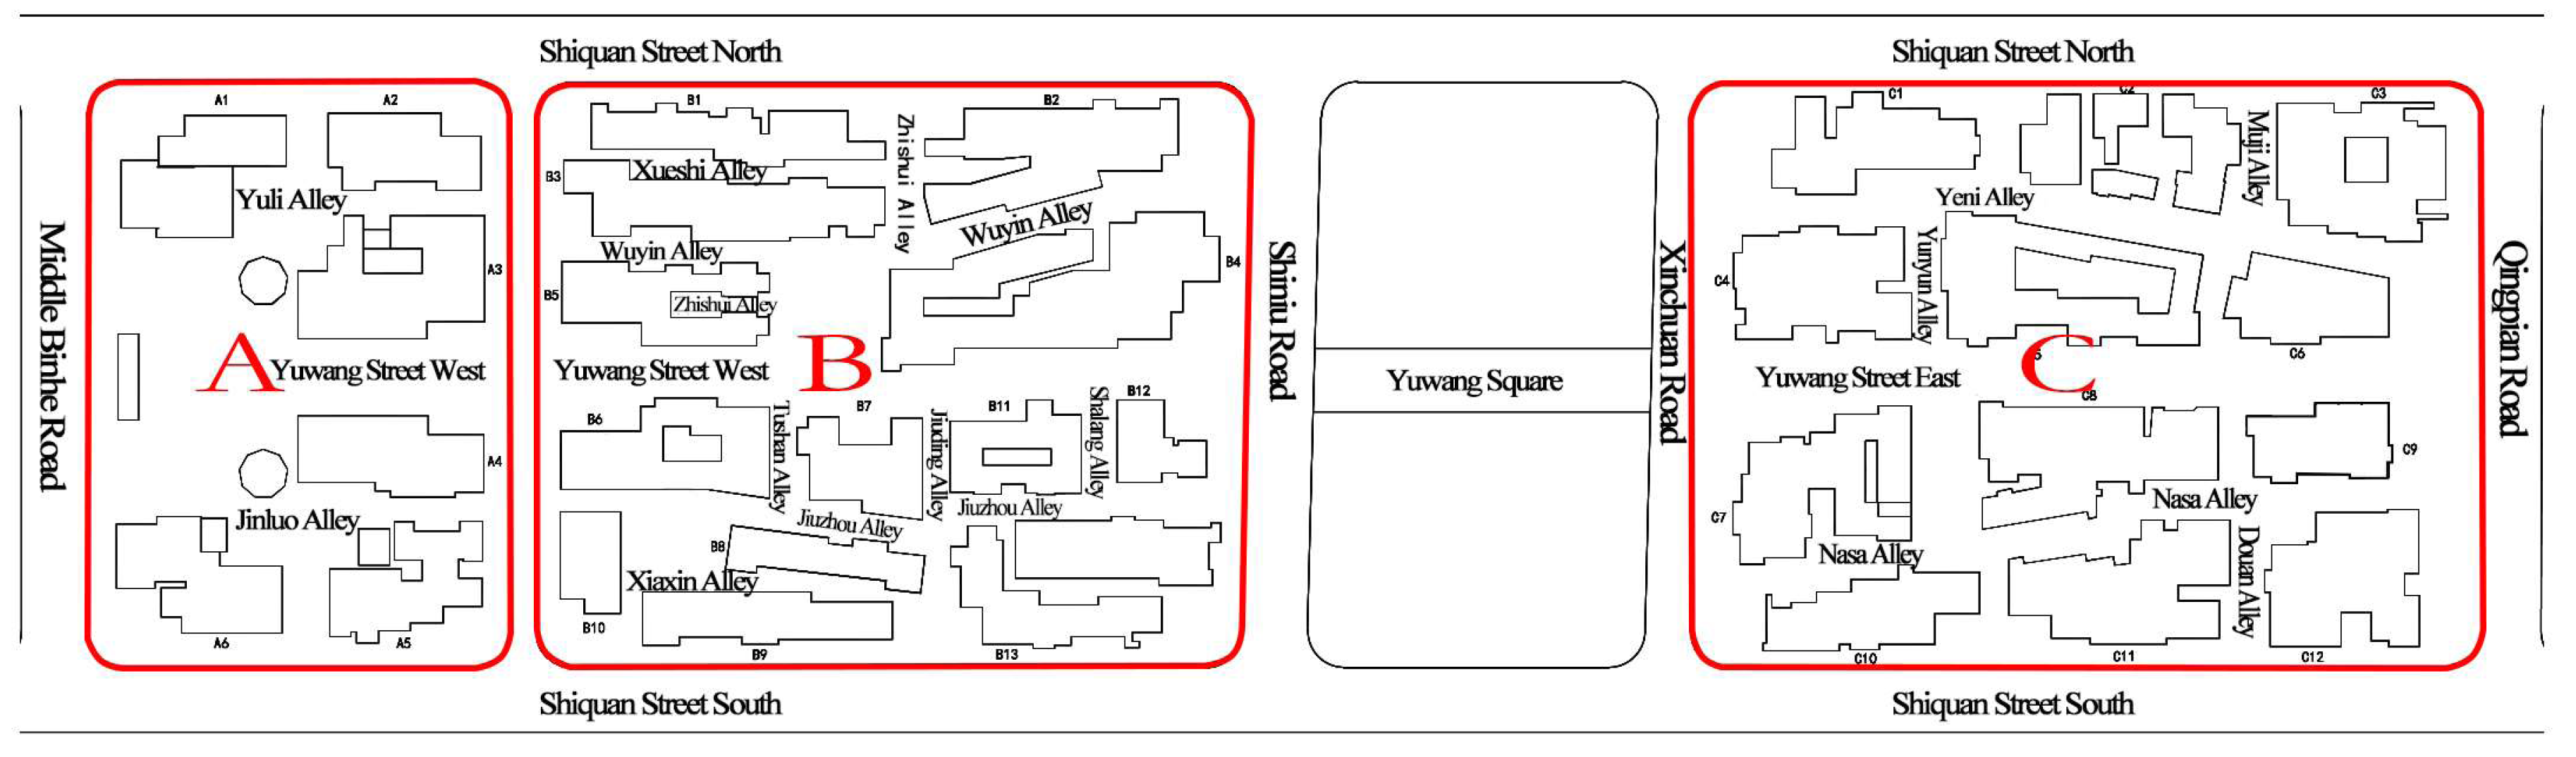
Banaqia Business Street is located in the center of the new town and is designed as a commercial complex that offers cultural related products, shopping, catering, and entertainment businesses. The local government and the public had high expectations of the role of this business district in revitalizing the local economy. When Banaqia started to invite businesses in April 2011, more than 8000 merchants came to investigate, and 110 businesses from Mianyang, Shanghai, Chongqing, and other provinces determined to settle in Banaqia. In total, 110 (out of a possible 156) shops were in operation. Eighty percent of these were catering services, or souvenir related to Qiang culture, selling items such as Qiang silk, Qiang tea, and Qiang foods [26]. Banaqia has three sections. Section A, near the tourism district, focuses on Qiang ethnic culture and products. Section C, near the river, is designed as the sector for catering, recreation and entertainment. Section B, located between A and C, is a commercial complex, designed as a space where traditional culture and modern life integrate.

3. Methods

Field observation, repeat photography [27], and semi-structured interviews were the main methods adopted in this study. As presented in the Background, Banaqia Business Street was the main study area. The research team visited this location four times and recorded the operational status of all 538 stores, took photos, and conducted semi-structured interviews. The information details can be found in Table 1.

3.1. Field Observation

The research team conducted four field trips between 2014 and 2017. As shown in Figure 3, the designed area of the business district is 76,400 square meters and the available commercial area is 50,000 square meters. It consists of three sections. Section A is the plate of Qiangyun Beichuan, and it mainly reflects the fine Qiang ethnic culture. Section B is the plate of Haina Beichuan and Chuangyi Beichuan, which is the inheritance of traditional culture, combined with modern fashion. Section C is the plate of Night Beichuan, Touring Beichuan and Charming Beichuan, and brings together catering, leisure, and entertainment as one. Within each section, we gave one number to each building: Section A had coding numbers from A-1 to A-6; Section B had coding numbers from B-1 to B-13; and Section C had coding numbers from C-1 to C-12. Since not every shop in a building was occupied, we then divided them according to the rooms occupied. Finally, 538 samples (rooms) were coded. The first-hand data were obtained by field observation, which is the key to the analysis of business recovery and sustainable development in Banaqia.
Basic geographical characteristics, such as sample ID, section area, location, shop name, administrative and business features, and survey time were collected (see Table 2).
As shown in Table 2, the business type of our sample was classified using the “Classification of Retail Formats” (GB/T 18106-2004) code; the code in the literature of “Rising from the Ashes-Disaster, Reconstruction and Social Change”; and the code of “Research on Classification of Retail Formats in China”. Businesses were classified into five groups: specialty, garment, catering, other, and vacant. Among them, “specialty” refers to local featured products such as manger wine and Qiang embroidery; “garment” includes clothes, shoes, and accessories; and “other” denotes book stores and bars that are not included in the three major types. If a shop is not occupied, it is cataloged as “vacant”.
Timeframe is not negligible when long-term business recovery is analyzed [28]. It should be recorded before disasters and consists of the measurement of recovery conditions, serving as a baseline from which the changes of the measurements can be identified. Marshall and Schrank [29] designed an approach that helps researchers track related information over the whole pre- and post-event timeframe. Specifically, businesses are classified into five categories: “operating”, “not operating”, “demised”, “recovered”, or “resilient”. These represent different states of a business that show the subtle changes of business status over the long term [29]. However, in this paper, because New Beichuan City was reconstructed on another site, Banaqia is a new commercial center built after the earthquake. Thus, there exists no pre-event baseline. Therefore, this paper categorized business status into operating and not operating. Whether a business is operating or not is needed for classification purposes. The information about operating status may be provided by business owners, the government, and other channels. The operating status obtained by this research mainly came from field observations and was aided by semi-structured interviews with business owners who shut down their stores. If a store is identified as operational during the four-year field research, it is regarded as sustainable development.
Meanwhile, to analyze the recovery and sustainable development of different business type in Banaqia, Sections A–C, this paper selected three indicators: the operating rate, the sustainable operating rate, and the rate of sustainable operating numbers in 2017 relative to the number in 2014. The operating rate is used to estimate the recovery, while the other indicators are used to judge the sustainable development. As shown in Figure 4 and Figure 5, we divide the business recovery and sustainable development into five levels: not good, not very good, good, relatively good, and very good.

3.2. Repeat Photography

Repeat photography is a newly developed method to record spatiotemporal landscape change [30,31]. It is the practice of re-photographing the same scene that appears in an earlier photograph [32], and therefore, the analysis of the photographic records can reveal changes from spatial and temporal perspectives. In this study, we also adopted this method to record the business changes in our field site in the recovery process. By comparing the changes at different times, we can observe and analyze the business continuity situations of the various business types. For each photo, the name of the business, address, business type, operating status, and the time of photographing were recorded. In total, we collected 2195 photos of this business district over the four-year period, and these pictures were coded for analysis.
Repeat photography ensures the accuracy of the information regarding the name, address, industry, and operating status of small businesses. Additionally, it identifies customer flow, building structures and surroundings, and offers visual evidence for a temporal analysis of small businesses in Banaqia.

3.3. Semi-Structured Interviewing

Semi-structured interviewing is the third research method employed in this study. It is a common research method widely used in social science studies [33]. Some business recovery studies also use this method as their main data collection method [12,29]. The semi-structured interview covered such topics as the business operating history and status of the shop, the owner’s characteristics, the degree to which the tourism industry affected their business, and how each business owner observed and perceived the overall economic atmosphere.
The interview was guided by the underlying aim of post-disaster recovery of small businesses and was conducted with both the owners and citizens. Annual numbers of interviewees may differ, but the interview serves as a way to adjust the information obtained from field observations. Interview logs were saved in order to ensure transcript accuracy.

4. Results

4.1. Overall Operation Status of Banaqia Commercial Street

In this section, the operational status of small businesses from 2014 to 2017 is discussed (Figure 6). Within the 538 observations collected, 260 were in operation in 2014. This number decreased to 215 in 2015, increased to 227 in 2016, and finally reached 230 in 2017. Of the 260 stores in operation in 2014, 181 were operating in 2015, 163 in 2016, and 151 in 2017. The decline in numbers of the previously operating shops from 2014 to 2017 did not indicate a very optimistic business environment, even though there were new businesses opening every year.
The studies in the Disaster Research Center at the University of Delaware suggests that small businesses are capable of being resilient to external shocks such as earthquakes, and can recover to a level that is even better than before the shocks [19]. In 2011, when Banaqia was opened, over 80% of shops were in normal situations; however, the rate of operation declined to less than 50% in 2017, indicating that the overall resilience level of Banaqia is low.

4.2. The Spatial Distribution of the Business in Operation

Out of the 538 observations in 2014, around 22% (121) were in Section A, 43.49% (234) were in Section B, and 34.02% (183) were in Section C.
As shown in Table 3, within Section A, approximately 55% were in operation in 2014. This number decreased to 45.45% (55) in 2015, bounced back to 54.55% (66) in 2016, and finally ended as 61 in 2017. It indicates that the business recovery is not good. Within the original 67 shops, 68% (46) were still in operation in 2015, 45% were operating in 2016, and 41% were still open in 2017. Some new stores opened each year: 9 in 2015, 15 in 2016, and 9 in 2017. It means that 33.9% (41 of the total 121) of the shops’ sustainable operating cycle was more than four years, suggesting that the sustainable development is relatively good.
Table 4 shows that the number of businesses in Section B remains largely unchanged from 2014 to 2017, while the number of firms that maintain operation status over the four years declines by around 30% to 64.76% by 2017. It indicates that the recovery and sustainable development of small business is good in Section B. However, the business situations in Section C show a different picture. Both the number of stores and the rate of sustainable operation fall substantially, suggesting that the business recovery and sustainable development are not very good in Section C.
As shown in Table 3, Table 4 and Table 5, the sustainable operating number of shops follows a downward trend, but the declining trend of Section A was slower than that of Sections B and C. The fluctuation in the operating status in Section A was obvious, and the operating rate was basically maintained above 50%. The result indicated that there is an apparent difference in the post-disaster recovery and sustainable development in among Sections A, B, and C.

4.3. The Overall Layout of Business Types in Banaqia Business Street

From the 538 observations we collected, the proportion of the “vacant” type remained at about 30% during 2014–2017, indicating a far from optimistic business environment. The proportion of “other” types was 29.4% in 2014. This number declined to 28.1% in 2015, continued to decrease to 27.9% in 2016, and finally ended as 26.2% in 2017 (Table 6). About 28 (18.7%) stores with “other” types were in entertainment during 2014–2017. Despite the high operating rate of culture and sports shops, it was found that they only displayed several sets of Qiang merchandise. As such, it cannot reflect Qiang Culture very well, and we did not find tourists visiting.
To grasp the evolution of the post-disaster recovery and sustainable development in Banaqia Business Street, the following sections will analyze the distribution and operational status of specialty, catering and garment types to discern any obvious changes.
As shown in Figure 7, 101 of the total 538 were the “specialty” type in 2014, and this number increases marginally to 106 (19.7%) in 2017. Within specialty businesses, the operating rate was 79.2% in 2014. This decreased to 63.7% in 2015, bounced back to 71.4% in 2016, and finally ended as 72.6% in 2017. Within the 101 specialty businesses in 2014, 93 (92.1%) were still specialty type in 2015. This number declined to 81.2% (84) in 2016, and finally ended at 81.2% (82) in 2017. The results indicate that 58.5% (48 of the total 82) of the specialty shops’ sustainable operating cycle was more than four years, suggesting that the sustainable operation and development of specialty type is relatively good.
Figure 8 shows that 86 stores were in the “catering” sector in 2014, and this number remains on a downward trend from 2014 to 2017. Within catering businesses, the operating rate was 67.4% (i.e., 58 of the total 86 were operating) in 2014, and this number declined to 48.4% (41 of 83) in 2015, continued to decrease to 48.1% (38 of 79) in 2016, and finally bounced back to 56.0% (42 of 75) in 2017. Among the 86 catering businesses in 2014, over 90% were specialty businesses in 2015. The original 58 stores have a high proportion of catering types in 2015, and around half of the original stores continue with the same services in 2016 and 2017. The trend means that 50.0% (29 of the total 58) of specialty shops’ sustainable operating cycle was more than four years, which, compared to the original 86 shops, is somewhat low.
Approximately 40 of the total 538 shops were “garment” type in 2014. This number declined to 42 in 2015, and remained consistent in 2016 and 2017 (Figure 9). However, the number of stores maintaining garment as a main business type fell steadily over the four-year period, indicating that the recovery and sustainable development of garment stores is not as good as expected by the initial planning.

4.4. The Spatial Distribution of Different Business Types

Within Section A, as shown in Table 7, 4% (5) of the total 121 were the “vacant” business type in 2014, and this number spikes to 25 in 2017. Slightly less than 40% (47) of the total 121 were the “other” business type in 2014. This number decreased to 41 in 2015, remained constant in 2016, and finally declined to 25.6% in 2017. It indicates that commercial function or initial functioning falls in Section A.
Meanwhile, as shown in Figure 10, the numbers of specialty type stayed around 40 during 2014–2017. Within specialty businesses, the operating rate was 70.7% in 2014, sharply decreasing to 48.9% in 2015, bouncing back to 62.5% in 2016, and finally ending as 73.8% in 2017. Within the original 41 specialty shops, 87.8% (36) were still specialty types in 2015. This number decreased to 82.9% (34) in 2016, and finally ended as 33 in 2017. Within the 29 shops in 2014, 16 were still specialty types and open in 2015; this figure remained constant in 2016 and 2017. Overall, 55.2% (16) of the 29 originally operating specialty shops’ sustainable operating cycle was more than four years, indicating that the recovery and sustainable development are relatively good.
As shown in Table 8, the numbers of catering type remained around 14 during 2014–2017. Within catering businesses, the operating rate did not exceed one third during 2014–2017. Meanwhile, we found that the number of sustainable and sustainable operating catering businesses were the same as the original number of catering shops throughout 2014–2017. This indicates that the post-disaster recovery and sustainable development of catering type are not very good in Section A.
Finally, as shown in Figure 11, the numbers of garment type remained about 11 during 2014–2017. Within garment businesses, the operating rate was 46.2% in 2014. This number sharply rises to 64.3% in 2015, decreases to 63.6% in 2016, and finally reaches 54.5% in 2017. Within the original 13 garment shops, all (13) of them were still garment type in 2015. However, this number decreased to 76.9% (10) in 2016, and finally ended as nine in 2017. Within the six shops in 2014, all of them were still garment type and operating in 2015; this figure remained constant in 2016, but finally decreased to five in 2017. Overall, 88.3% (5) of the six originally operating garment shops’ sustainable operating cycle was more than four years, which, compared to the 13 catering businesses in 2014, is not high. This suggests that the recovery of garment types is good, but the sustainable development is not good in Section A.
Within Section B, as shown in Table 9, around 35% (83) of the total 234 were vacant business types in 2014. This number rose by about 2% (88) in 2015, continued to increase to 40.6%, and finally ended as 40.2% in 2017. It indicated that the number of vacant shops is increasing. In total, 27.4% (64) of the total 234 were “other” business type in 2014, and this number decreased to 63 in 2015, continued to decline to 25.6% (60) in 2016, and finally rose to 26.1% (61) in 2017. This indicates that commercial function or initial functioning fell in Section B.
Firstly, as shown in Figure 12, on average, one seventh of the total 234 shops were the specialty type during 2014–2017. The operational rate of specialty stores was 80.6% in 2014 but declined to 75.7% in 2017. Within 36 specialty shops in 2014, 33 of them were still specialty types in 2015, but this number declined to 28 in 2016, and finally ended as 27 in 2017. Of the original 29 shops, 82.8% (24) were still specialty type and operating in 2015. This decreased to 75.9% (22) in 2016, and finally ended as 21 in 2017. Overall, 72.4% (21) of the 29 originally operating specialty shops’ sustainable operating cycle was more than four years, which, compared to the 36 specialty businesses in 2014, is high. It suggests that the post-disaster recovery and sustainable development of specialty type is good in Section B.
Secondly, as shown in Figure 13, 40 of the total 234 shops were catering type in 2014. This number decreased to 15.8% (37) in 2015, continued to decline to 34 in 2016, and finally ended as 13.7% (32) in 2017. Within the catering businesses, the operating rate was 67.5% in 2014, decreased to 64.9% in 2015, continued to decline to 61.8% in 2016, and finally rose to 71.9% in 2017. Of 40 catering shops in 2014, 36 were still catering shops in 2015. This number decreased to 77.5% (31) in 2016, and finally ended as 29 in 2017. Within the original 27 operating catering businesses, 18 were still catering business and operating in 2015, and this number declined to 16 in 2016, and remained constant in 2017. Overall, 59.3% (16) of the 27 original catering shops’ sustainable operating cycle was more than four years, which, compared to 40 catering businesses, is not too low. It indicated that the post-disaster recovery of catering type is relatively good, and the sustainable development is very good in Section B.
Thirdly, as shown in Figure 14, around 10 of the total 234 shops were garment type during 2014–2017. Within the garment type, the operating rate was 81.8% in 2014, with this number decreasing to 75.0% in 2015, bouncing back to 80.0% in 2016, and finally ending up as 60.0% in 2017. Of 11 garment shops in 2014, eight were still garment type in 2015, and this number remained constant in 2016 and 2017. Of the original nine shops, 66.7% (6) of them were still garment type and in operation in 2015. This figure decreased to 55.6% (5) in 2016, and finally ended as three in 2017. One third (3) of the nine originally operating garment shops’ sustainable operating cycle was more than four years, which, compared to the 11 specialty businesses in 2014, is not very high. It indicates that the post-disaster recovery of garment type is good, but the sustainable development is not very good in Section B.
Within Section C, as shown in Table 10, 61 of the total 183 shops were vacant business type in 2014, and the number declined to 55 in 2017. About 48 of the total 183 shops were “other” business type during 2014–2017. It indicates that commercial function or initial functioning falls overall in Section C, but has made some improvement.
As shown in Figure 15, about 13.0% (24) of the total 183 shops were specialty type in 2014–2016, and this number rises to 14.8% (27) in 2017. Within the specialty type, the operating rate was 91.7% in 2014. This number decreased to 68.2% in 2015, bounced back to 82.6% in 2016, and finally ended as 66.7% in 2017. It suggests that the initial recovery of specialty is very good but gets worse later, although the number of specialty shops does increase. Als 24 specialty shops in 2014 were still specialty type in 2015. This number declined to 22 in 2016, and remained constant in 2017. Of the original 22 shops, 63.6% (22) were still specialty type and operating in 2015, which decreased to 59.1% (13) in 2016, and finally ended as 11 in 2017. Half (11) of the 22 originally operating specialty shops’ sustainable operating cycle was more than four years compared to the 24 specialty businesses in 2014, which reached 45.8%. It means that the sustainable development of specialty type is good in Section C.
Additionally, as shown in Figure 16, the operational rate of catering shops falls significantly from 2014 to 2017. All 31 catering shops in 2014 were still catering shops in 2015 and 2016, but this figure decreased to 29 in 2017. Within the original 26 operating catering businesses, 12 were still catering businesses and operating in 2015, which declined to nine in 2016, and remained constant in 2017. Overall, 34.6% (9) of the 26 original catering shops’ sustainable operating cycle was more than four years, which, compared to the 31 catering businesses, is not high. This indicates that the post-disaster recovery is good, but the sustainable development of catering type is not very good in Section C.
Finally, as shown in Figure 17, around 20 of the total 183 shops were garment type during 2014–2017. Within the garment type, the operating rate was only 20.0% in 2014, with this number rising to 25.0% in 2015, sharply decreasing to 9.5% in 2016, and finally ending as 14.3% in 2017. All 20 garment shops in 2014 were still garment type during 2015–2017. Within the original four shops, 75.0% (3) were still garment type and in operation in 2015. This figure then sharply decreased to 25.0% (1) in 2016, and remained constant in 2017. One of the four (25%) originally operating garment shops’ sustainable operating cycle was more than four years, which, compared to the 20 specialty businesses in 2014, is not high. This indicates that the post-disaster recovery and sustainable development of garment type are not good in Section C.

5. Discussions

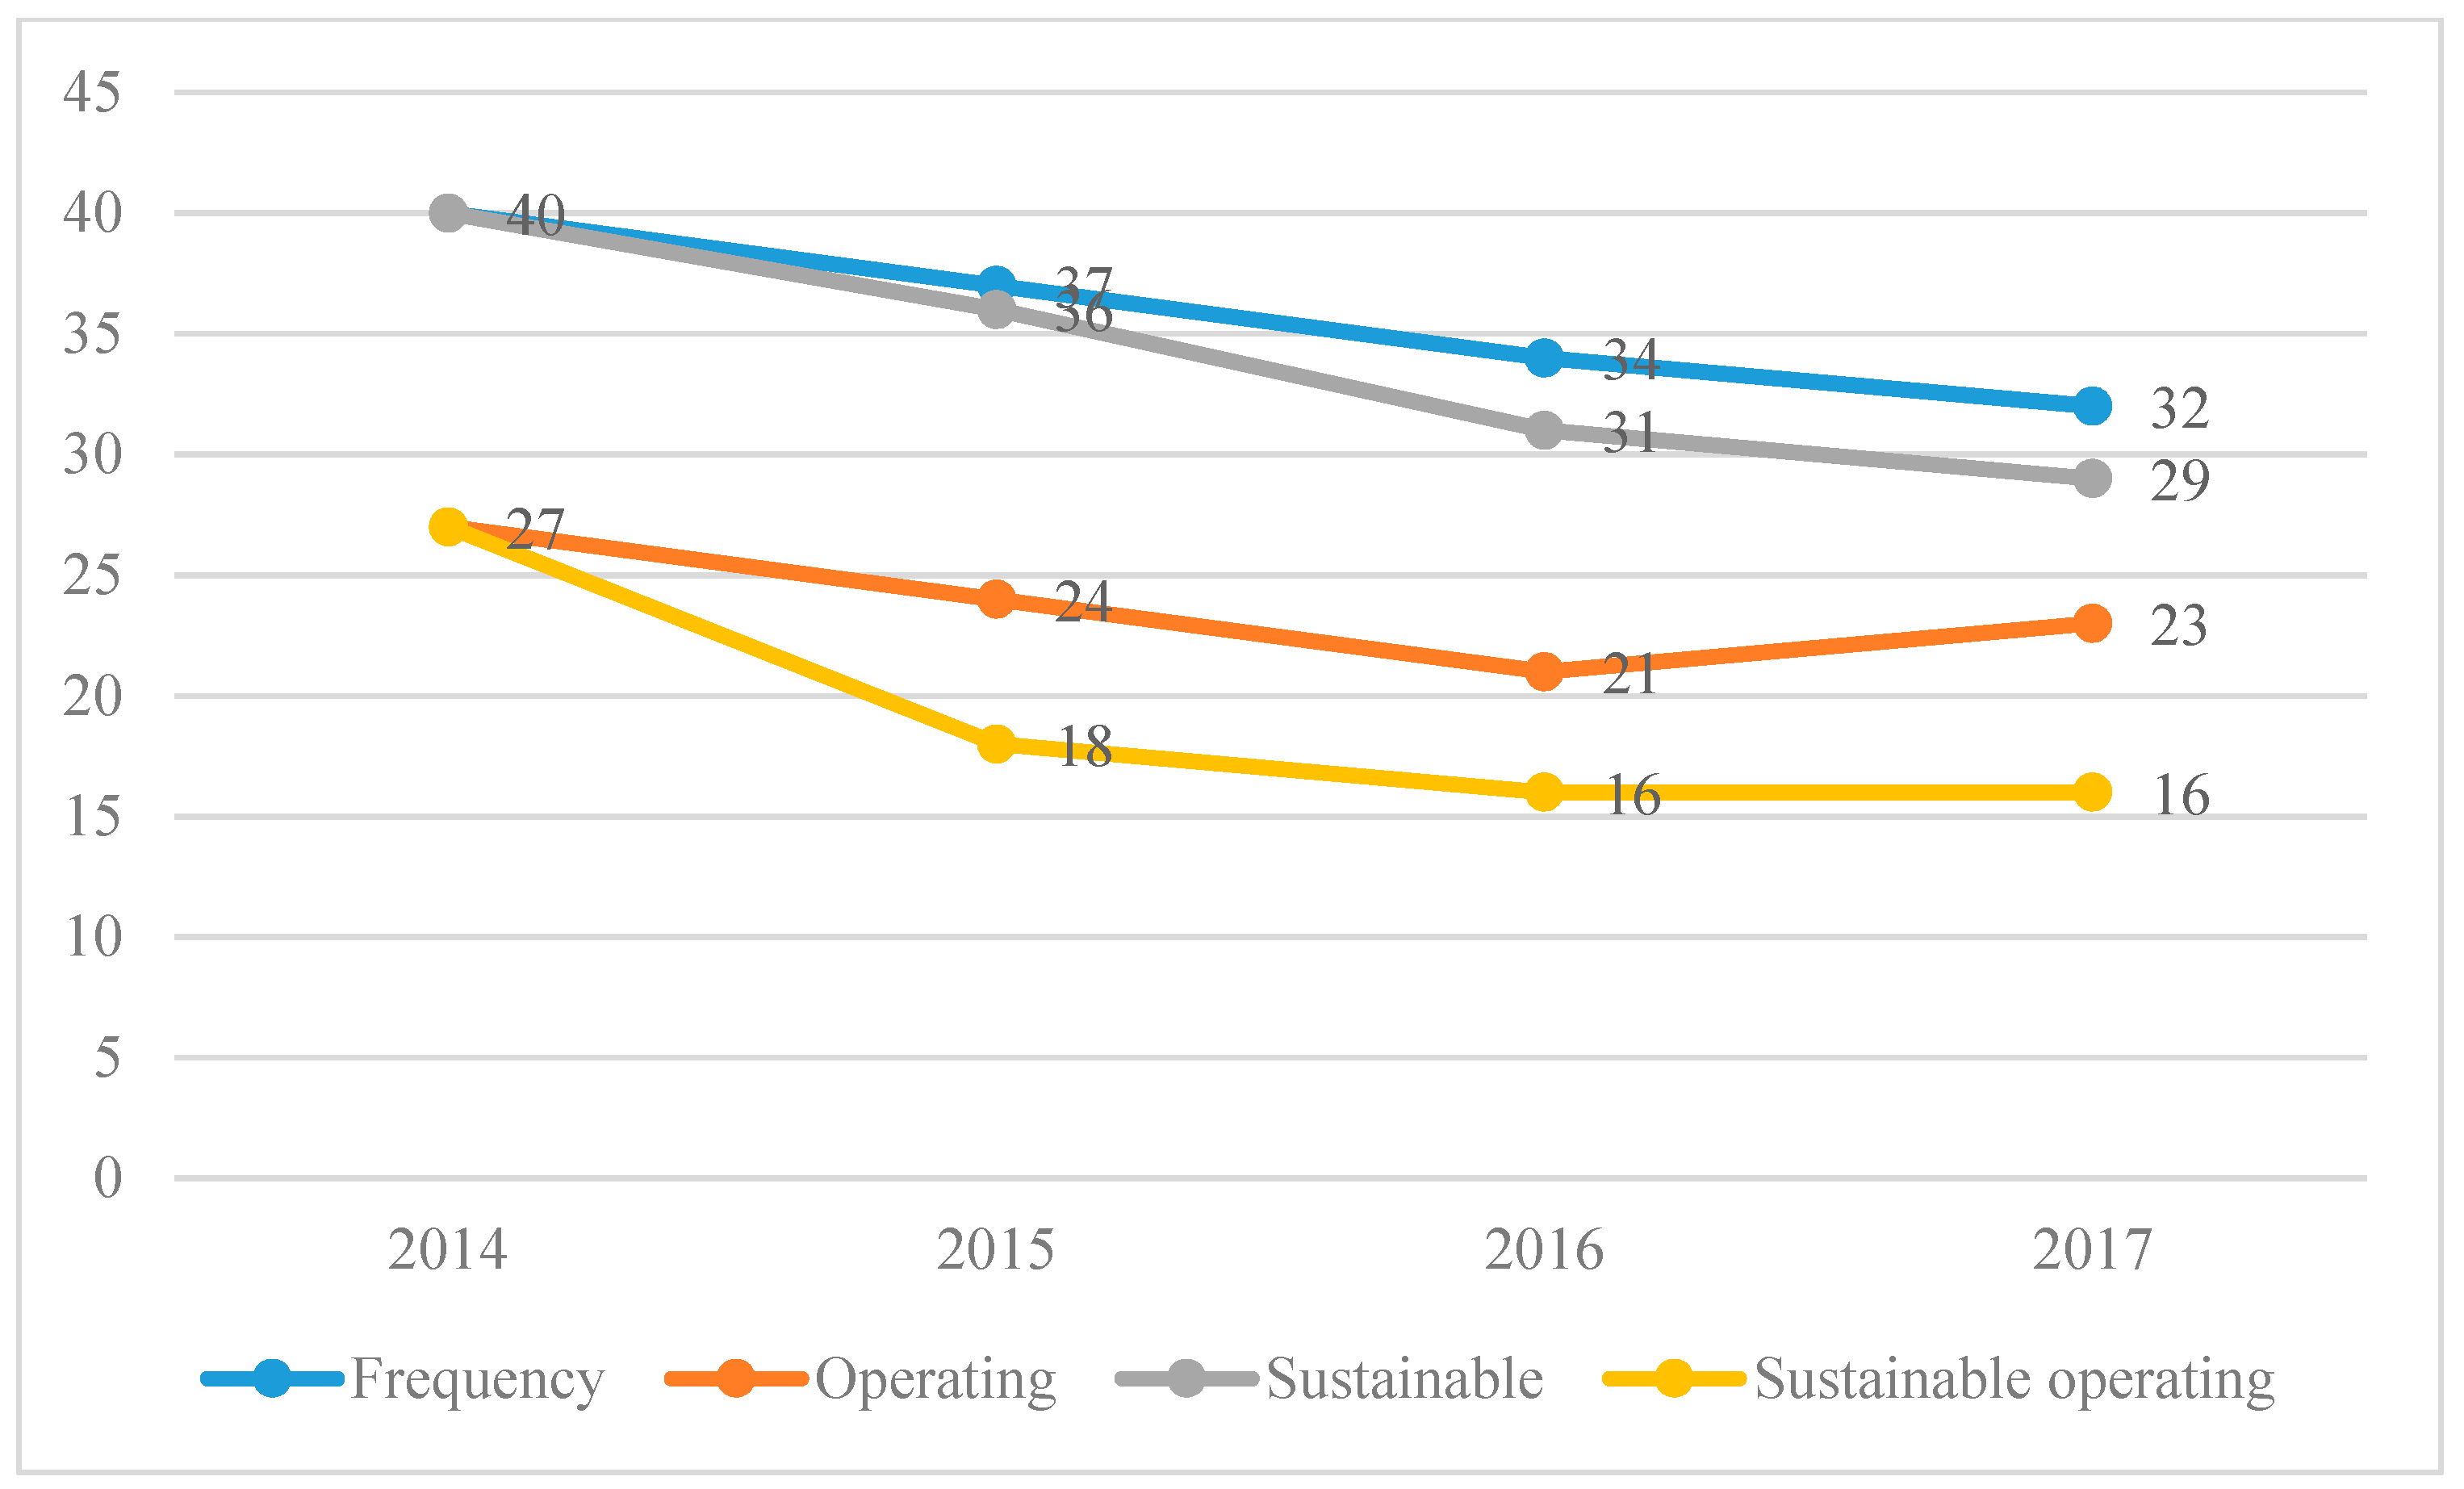
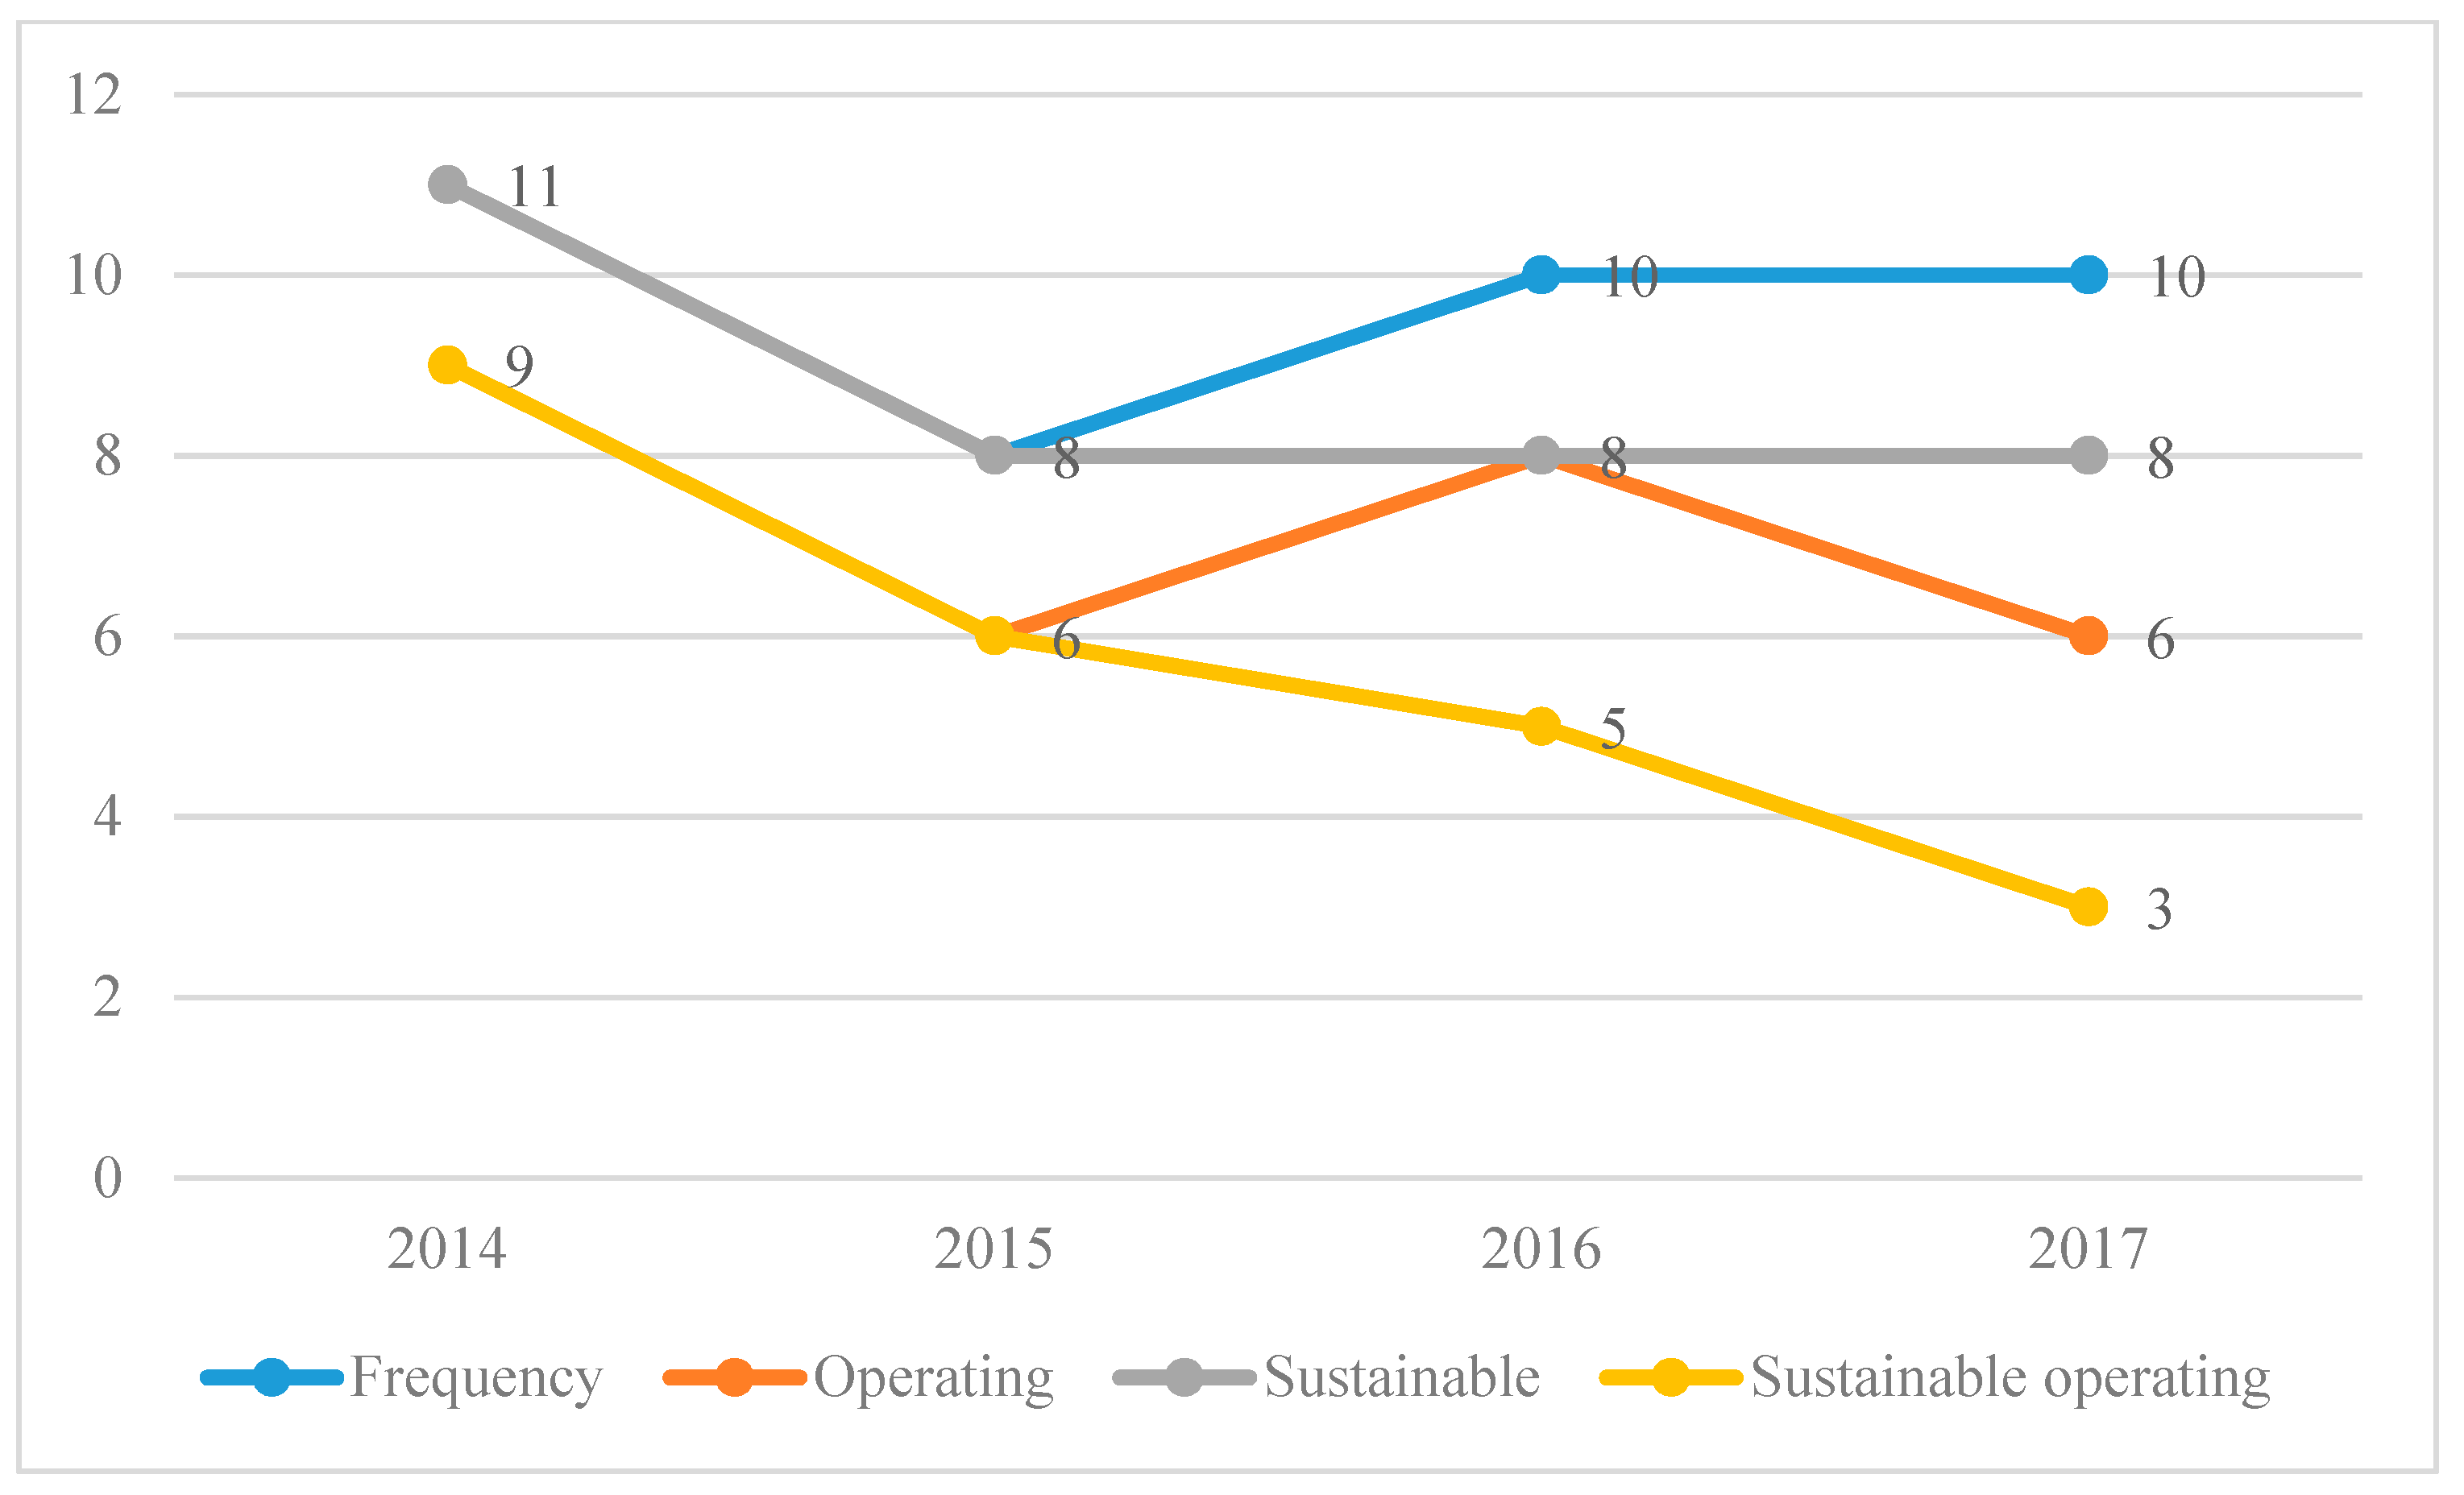
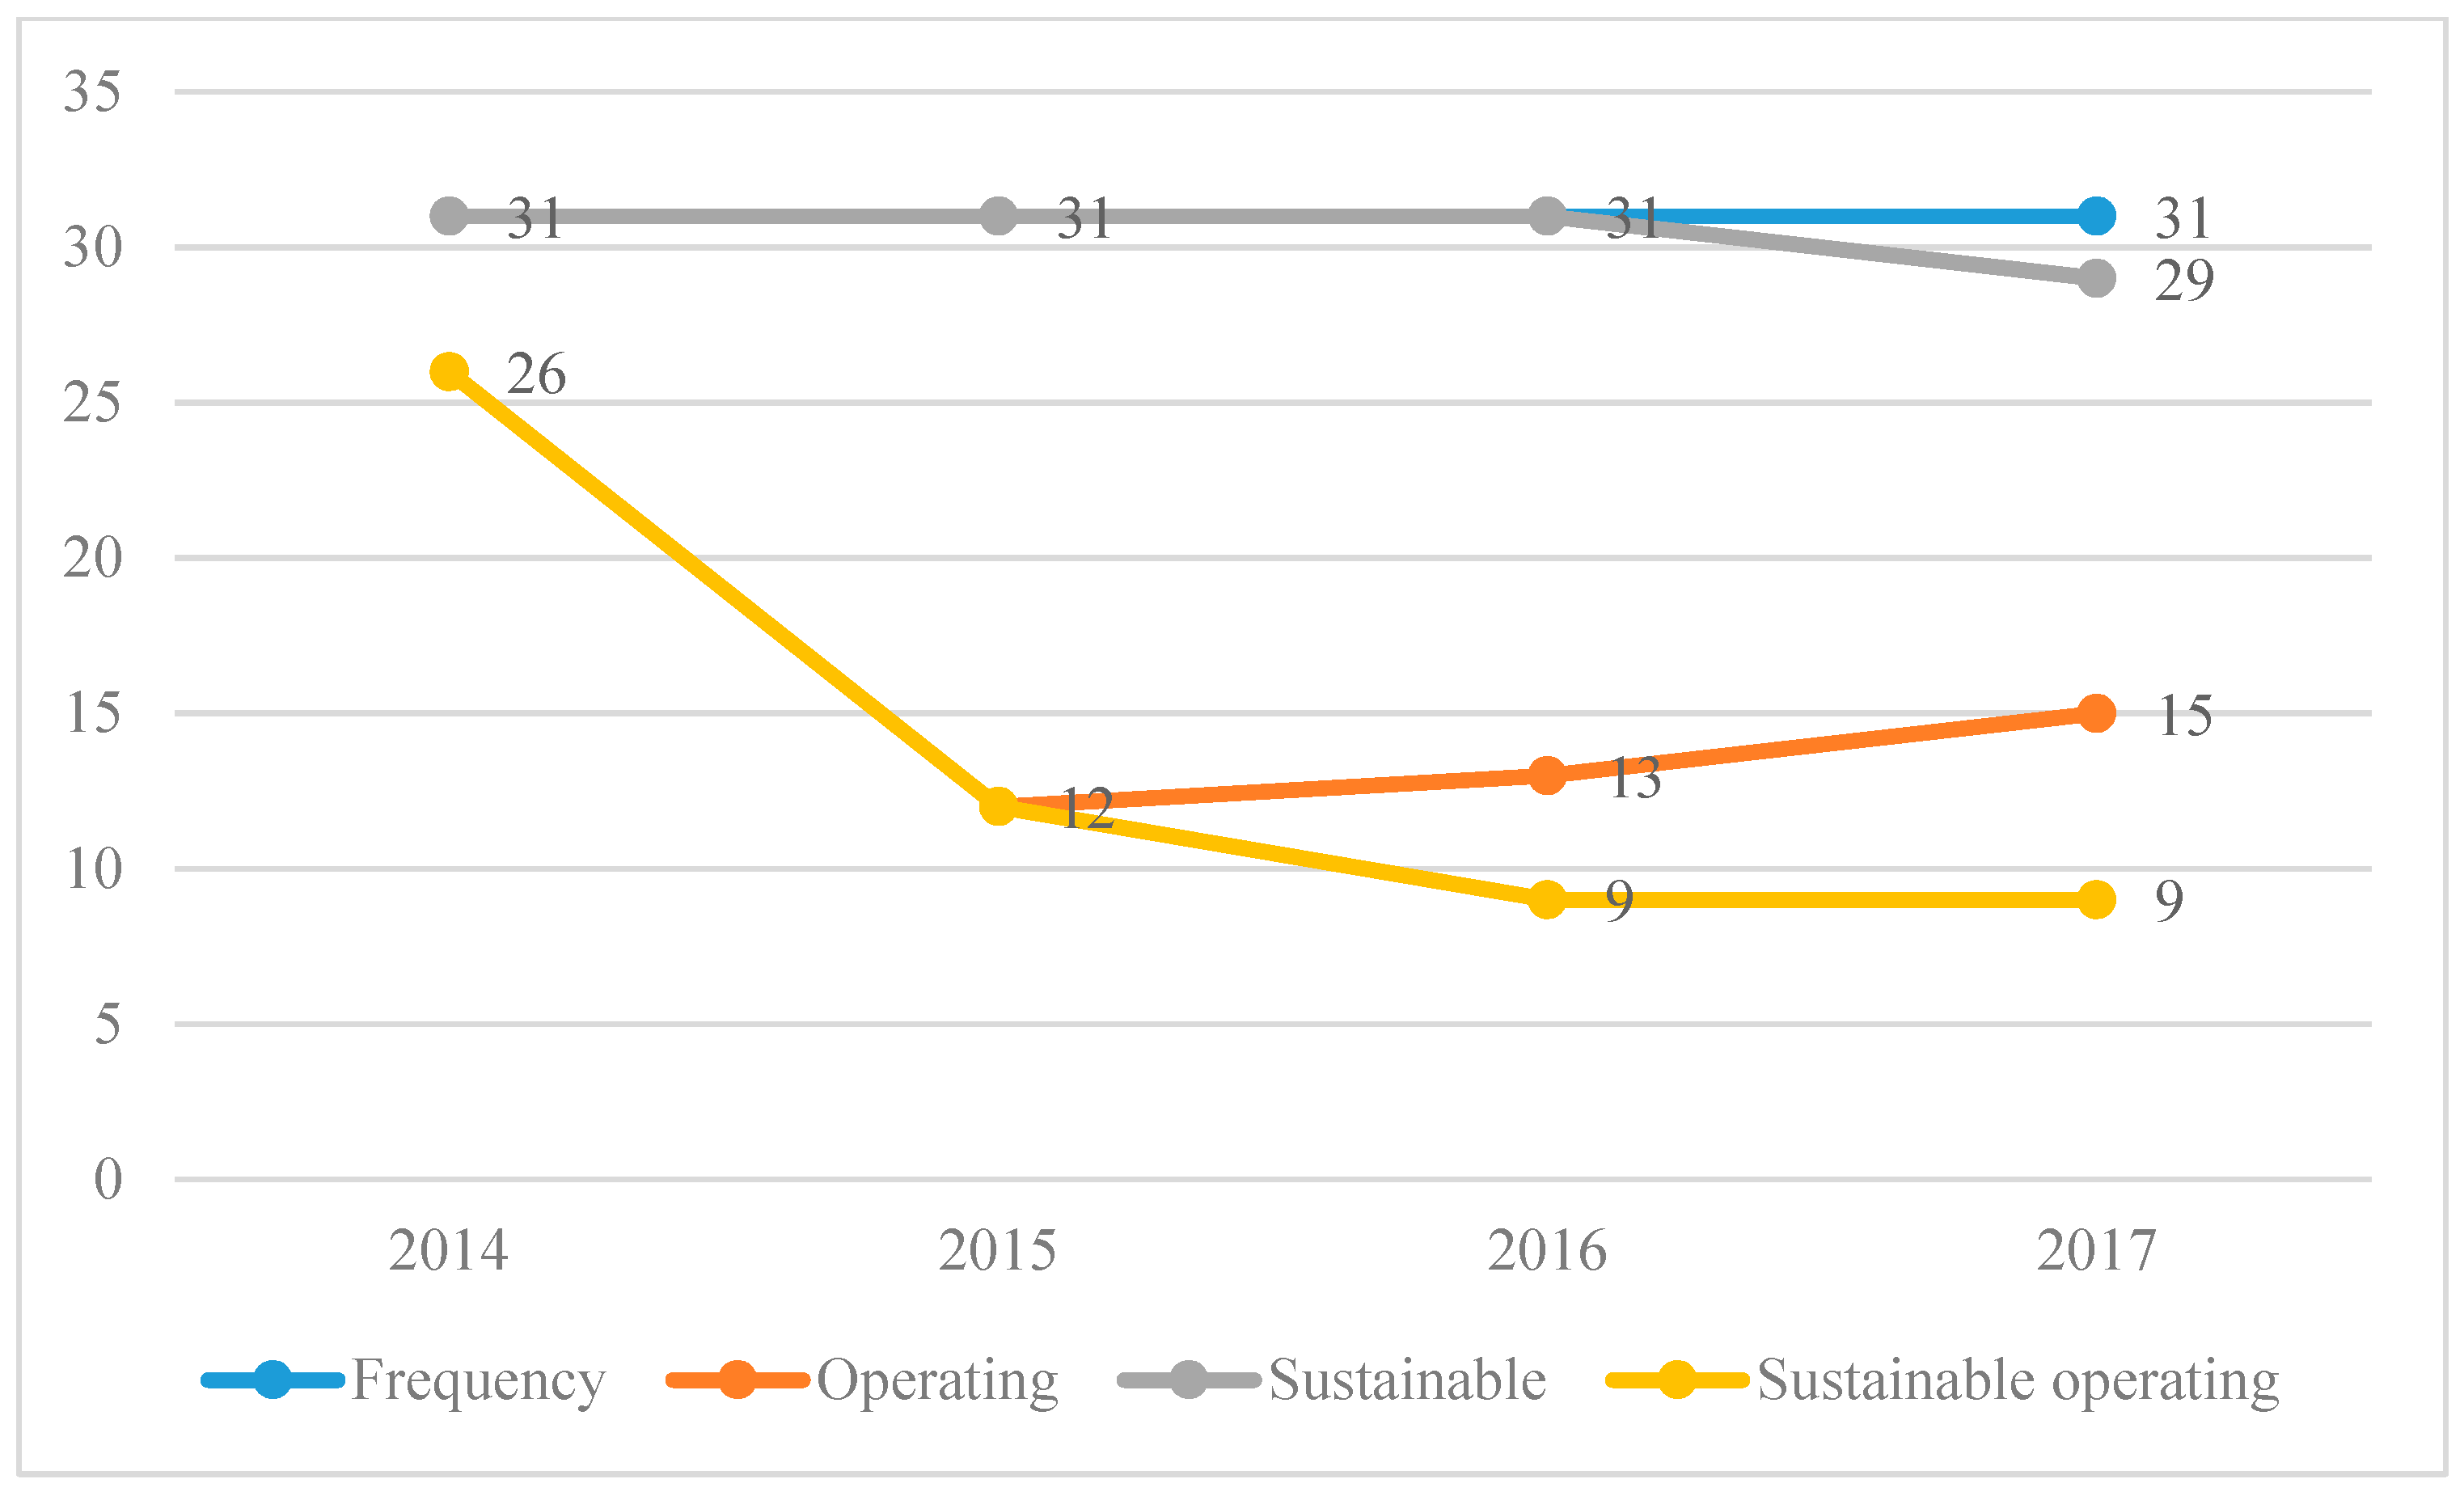
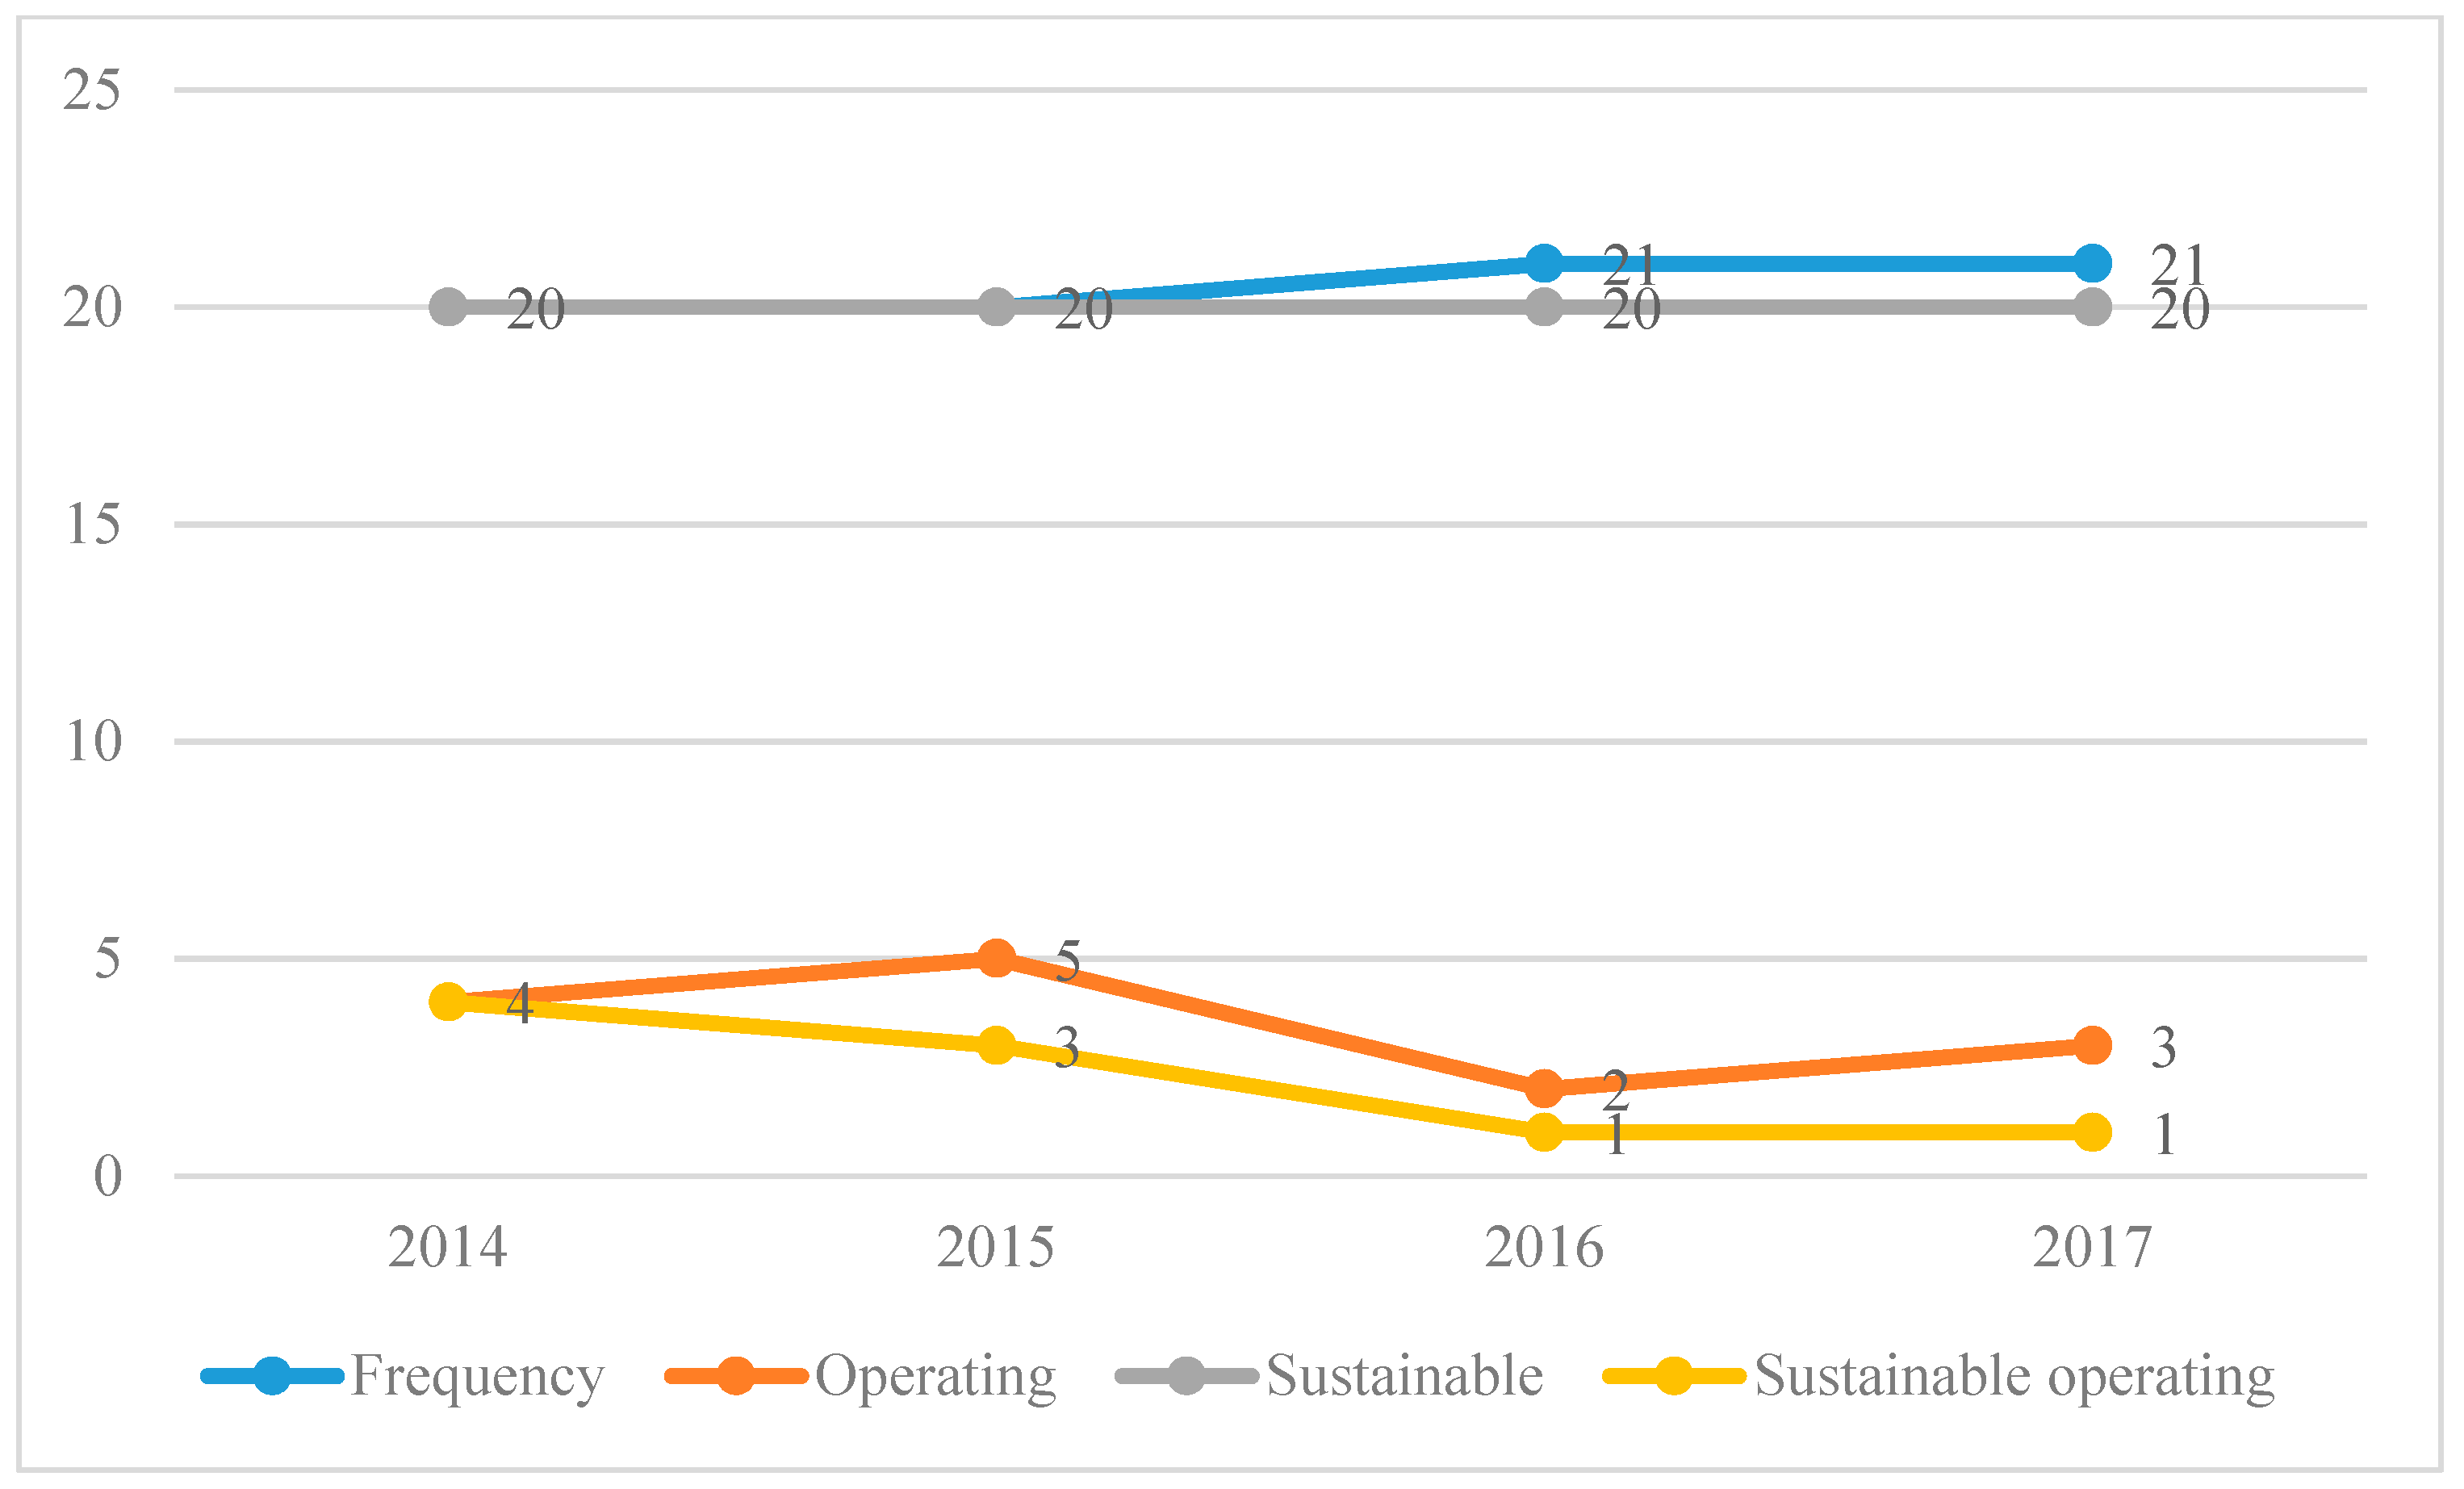
We have shown that the New Beichuan City consisted of residential, institutional, Banaqia commercial, industrial park, and tourism areas. Most business activities occur in Banaqia commercial streets. The residents of the new city come from the disaster-stricken areas and Huangtu Town. Residential areas were largely located in the northern and southern parts of the city and divide Beichuan County into three separate regions: old Beichuan resettlement, Huangtu resettlement, and the tourism district. Community businesses were situated in the two resettlement areas, and Banaqia includes small businesses that accommodate tourists. Our four-year survey indicates that the developmental patterns and types of stores in the different districts are distinct. While this paper focuses primarily on Banaqia commercial development, the discussions of the recovery of community businesses in the resettlement areas are being formulated in another paper.
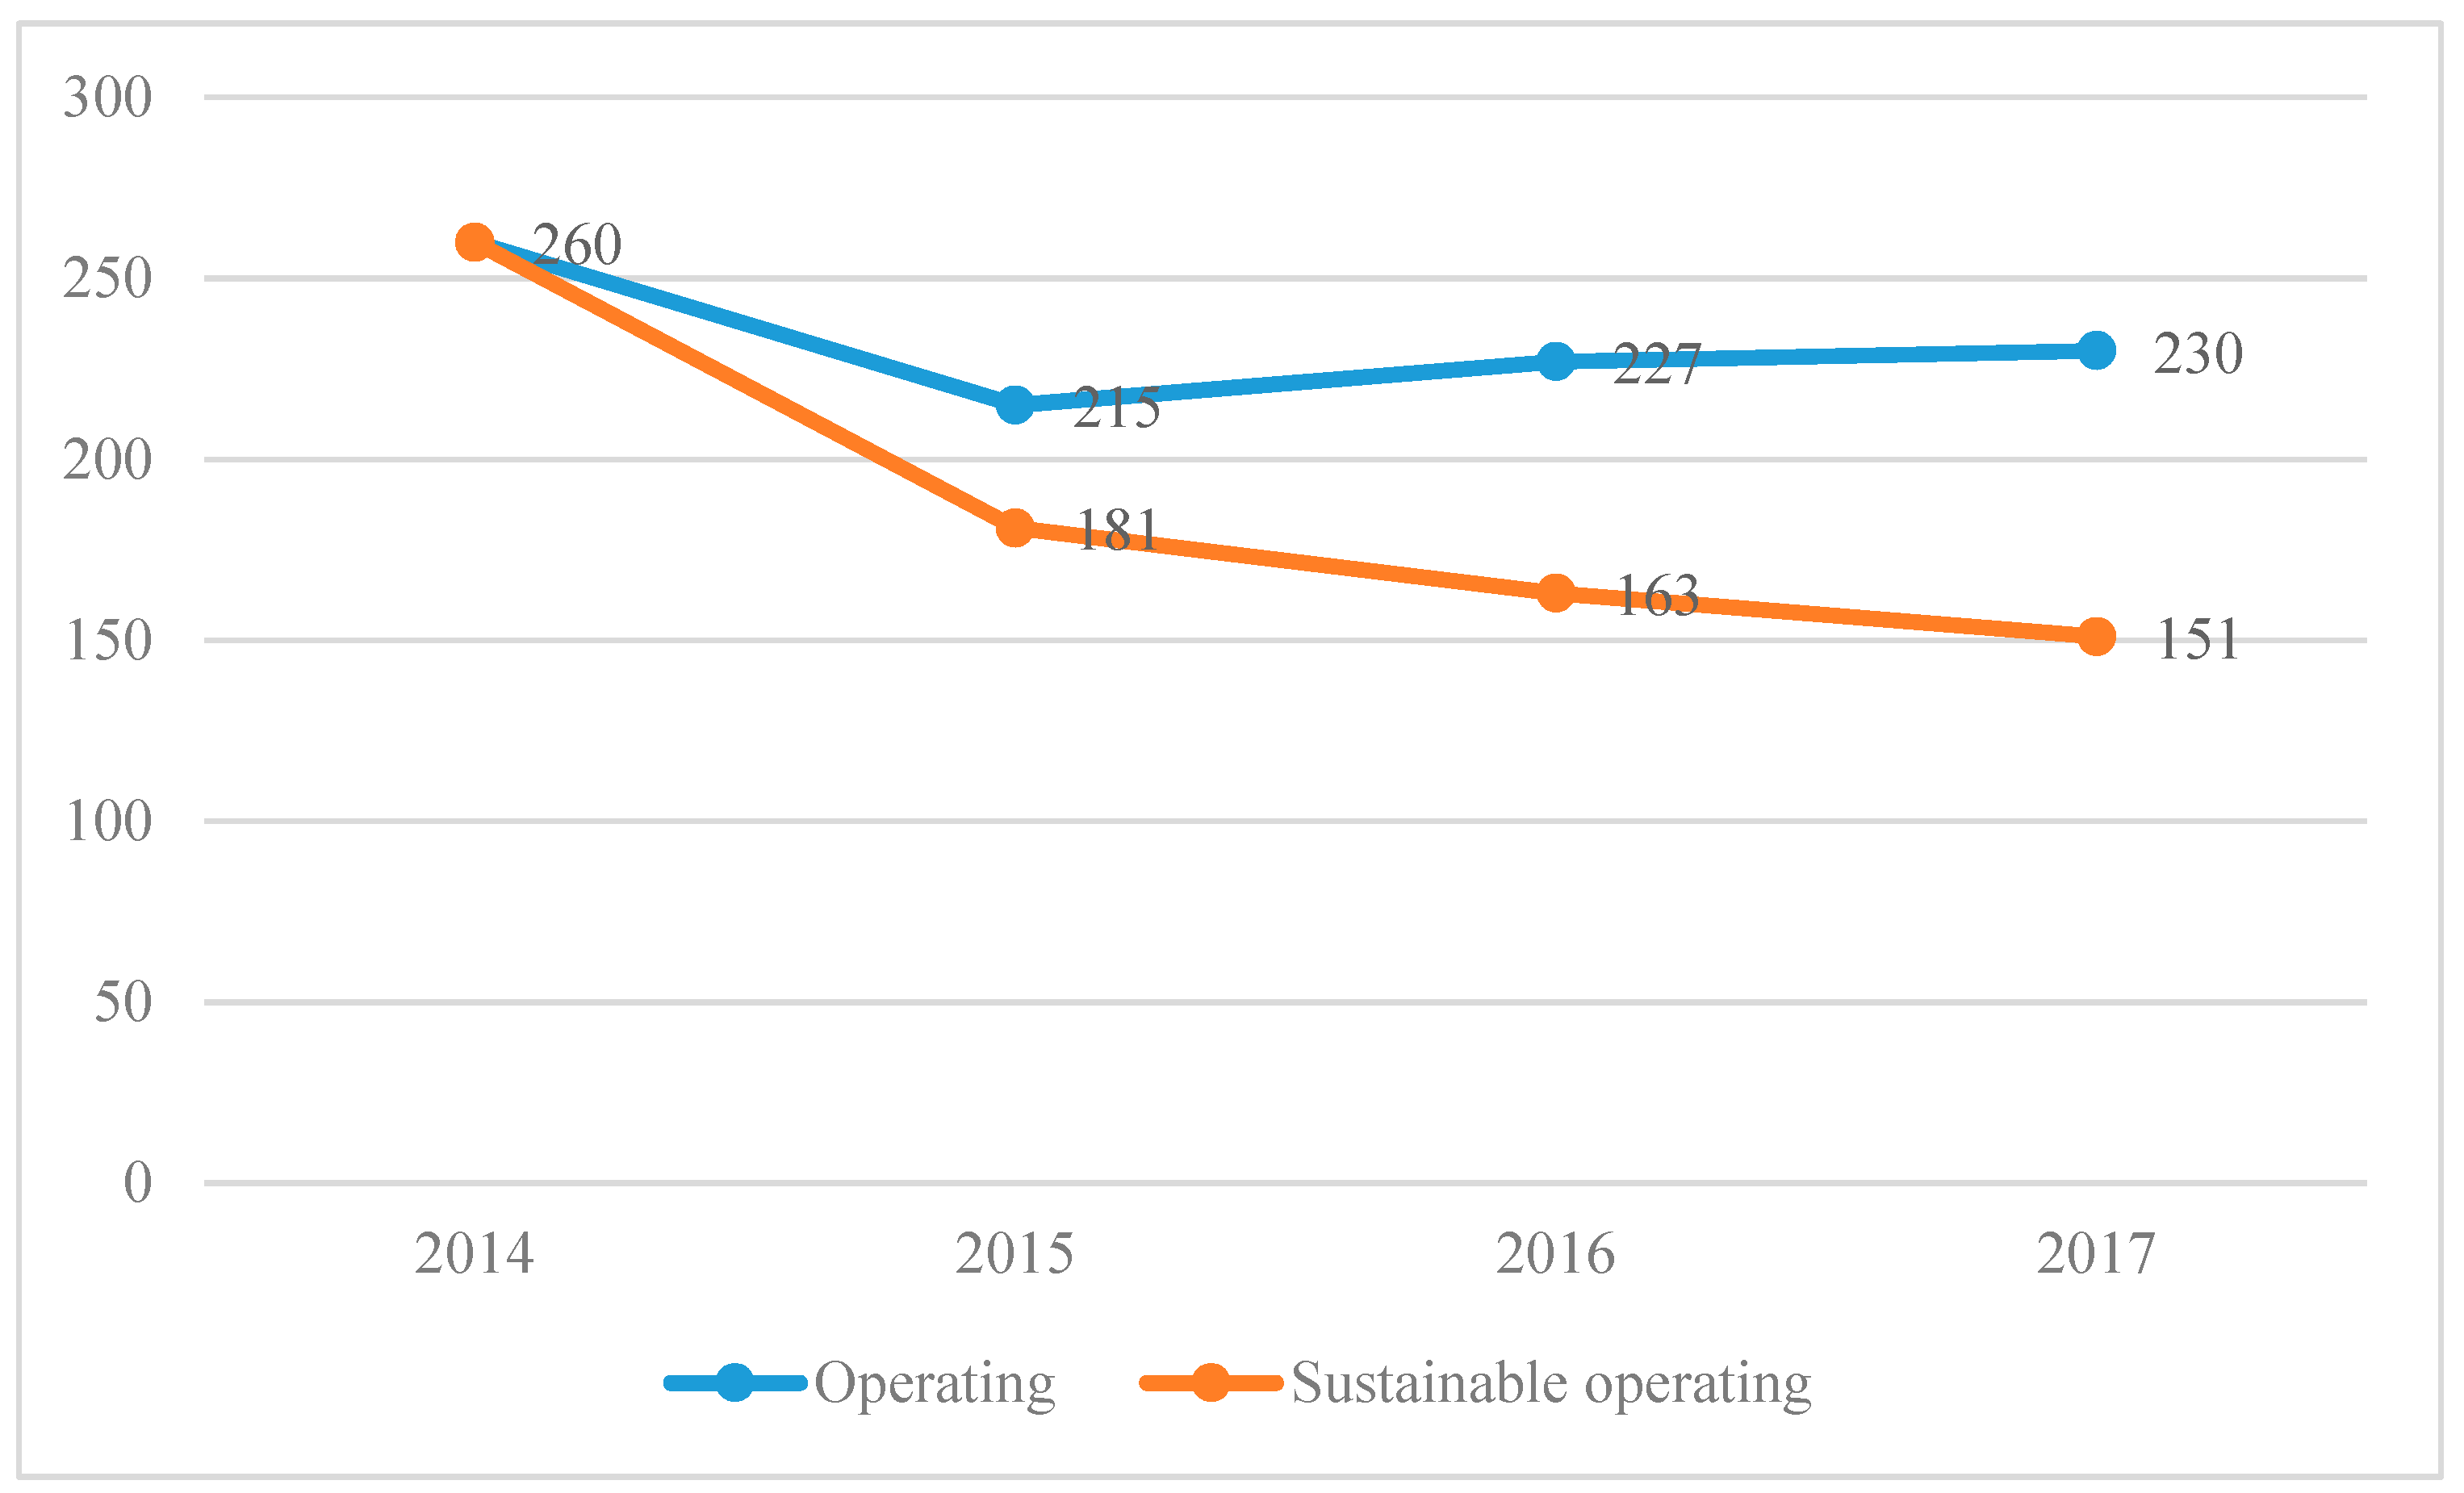
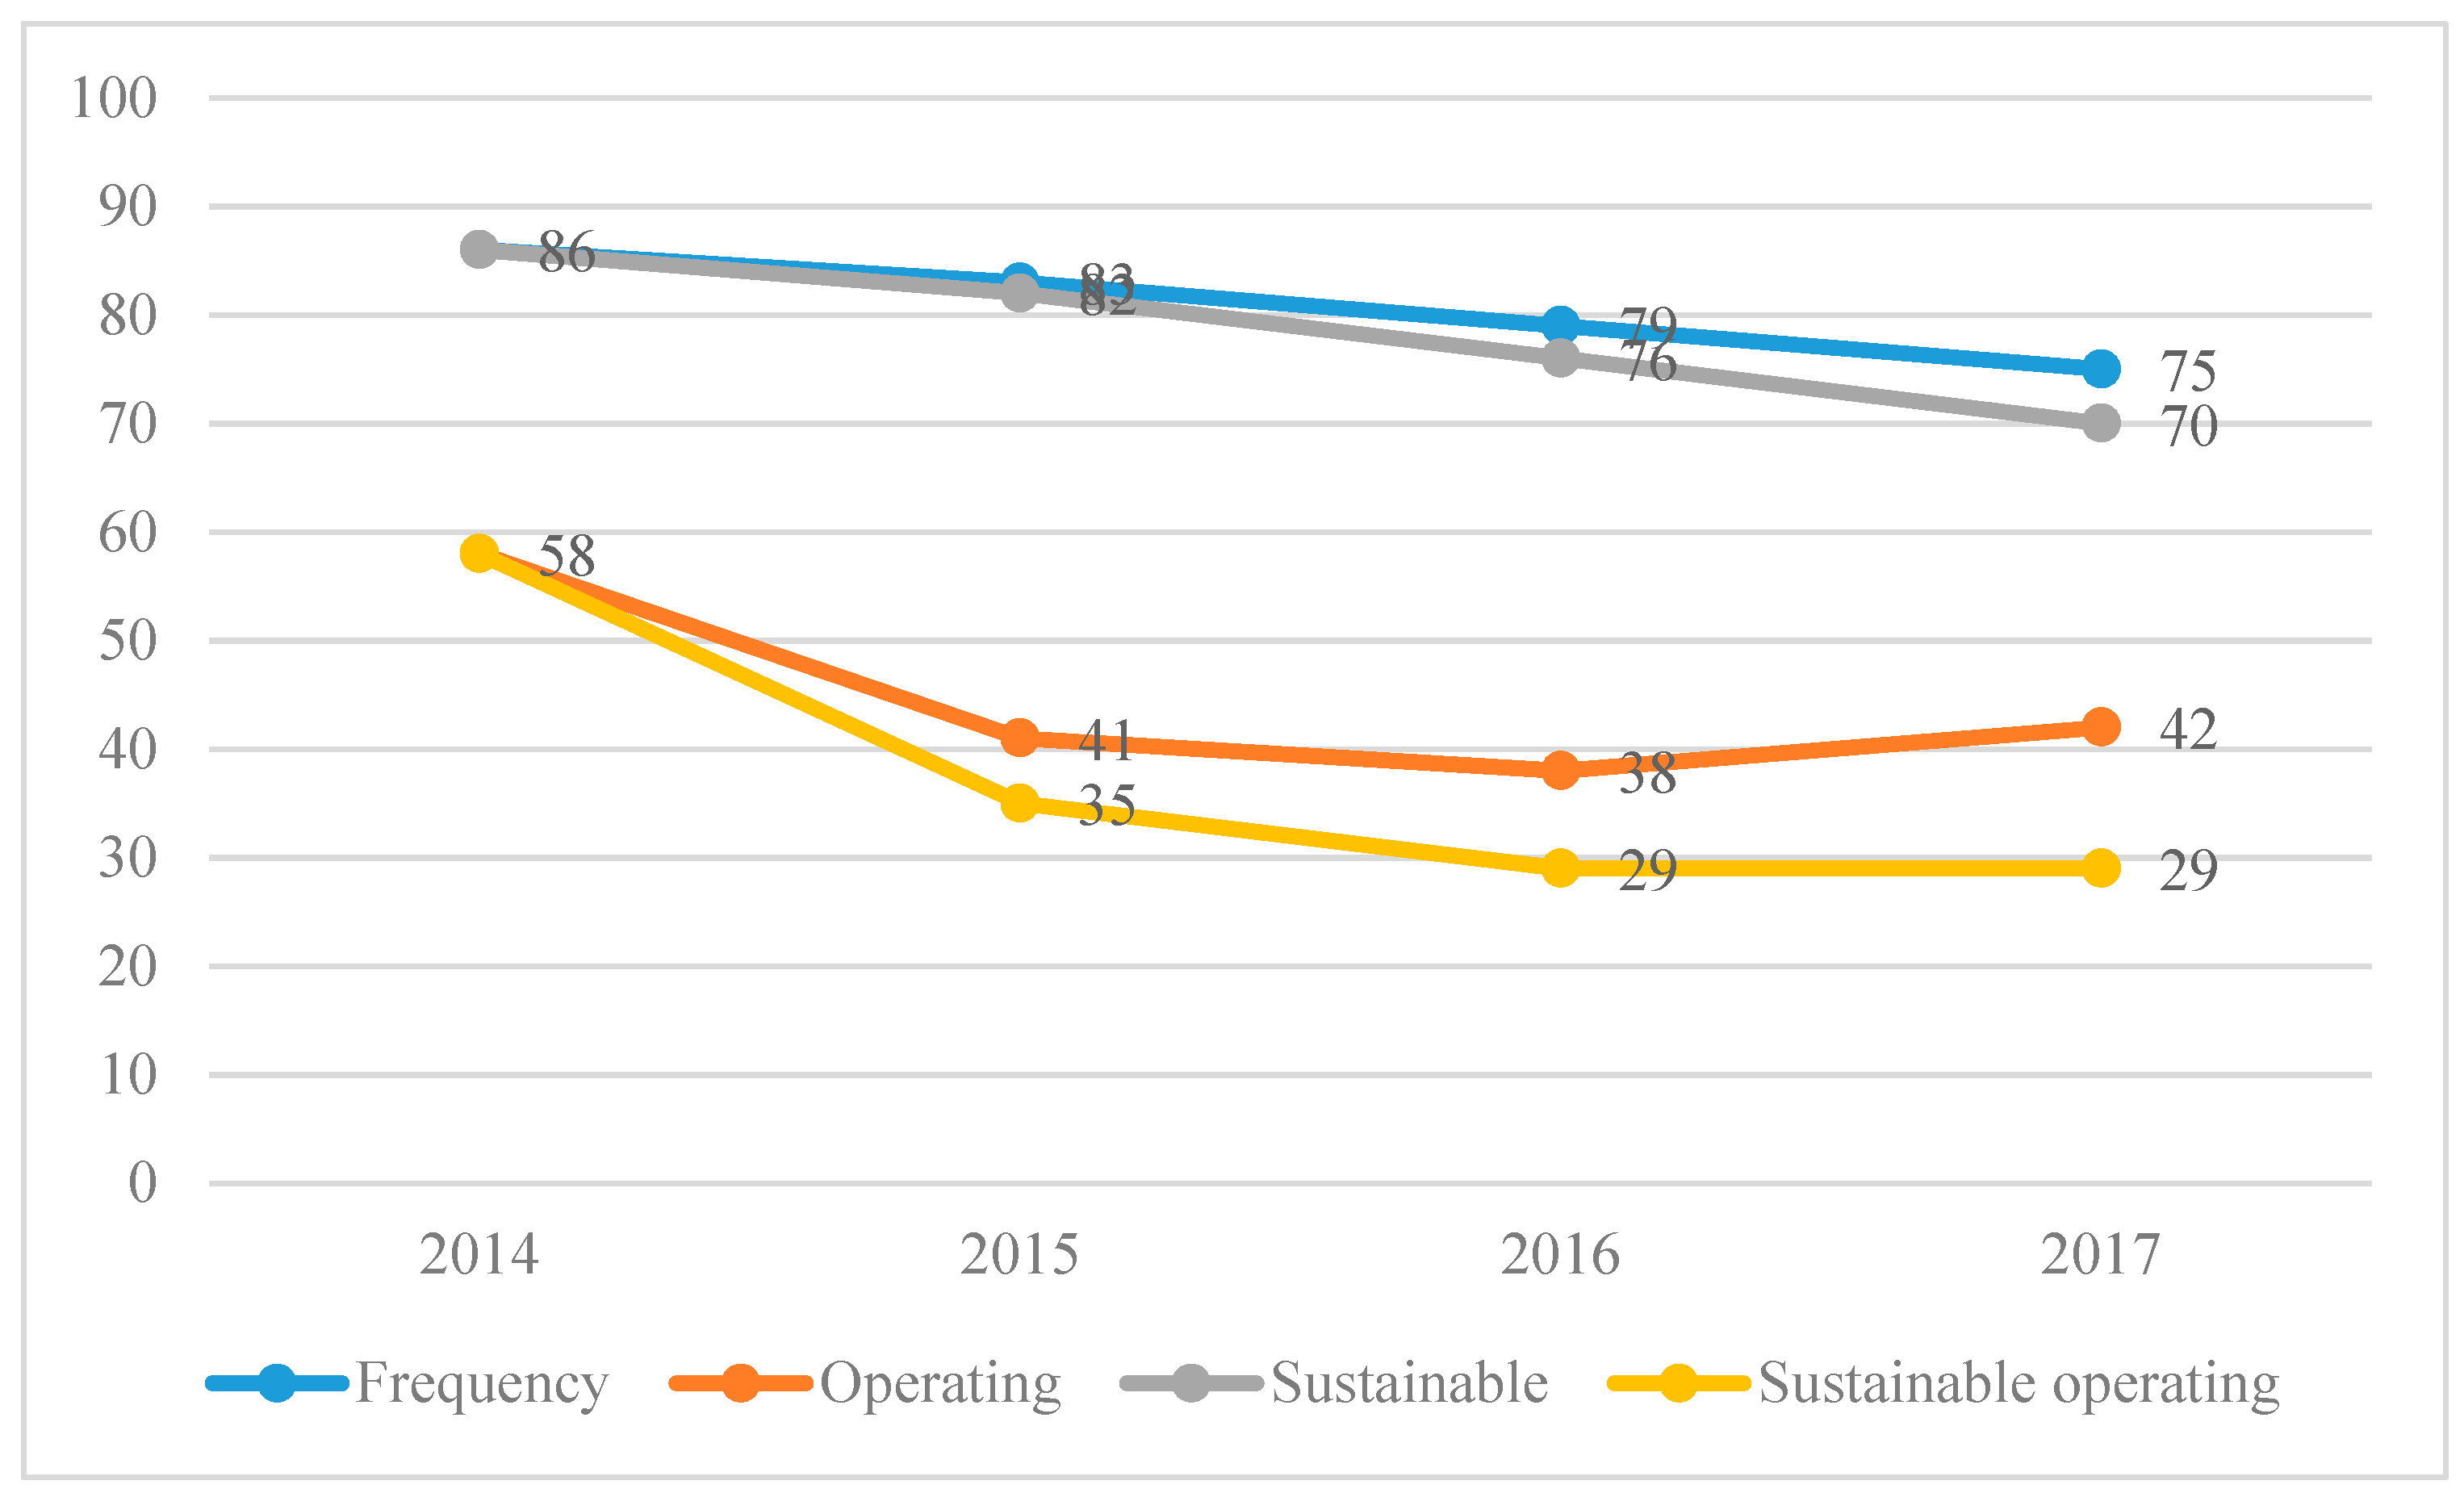
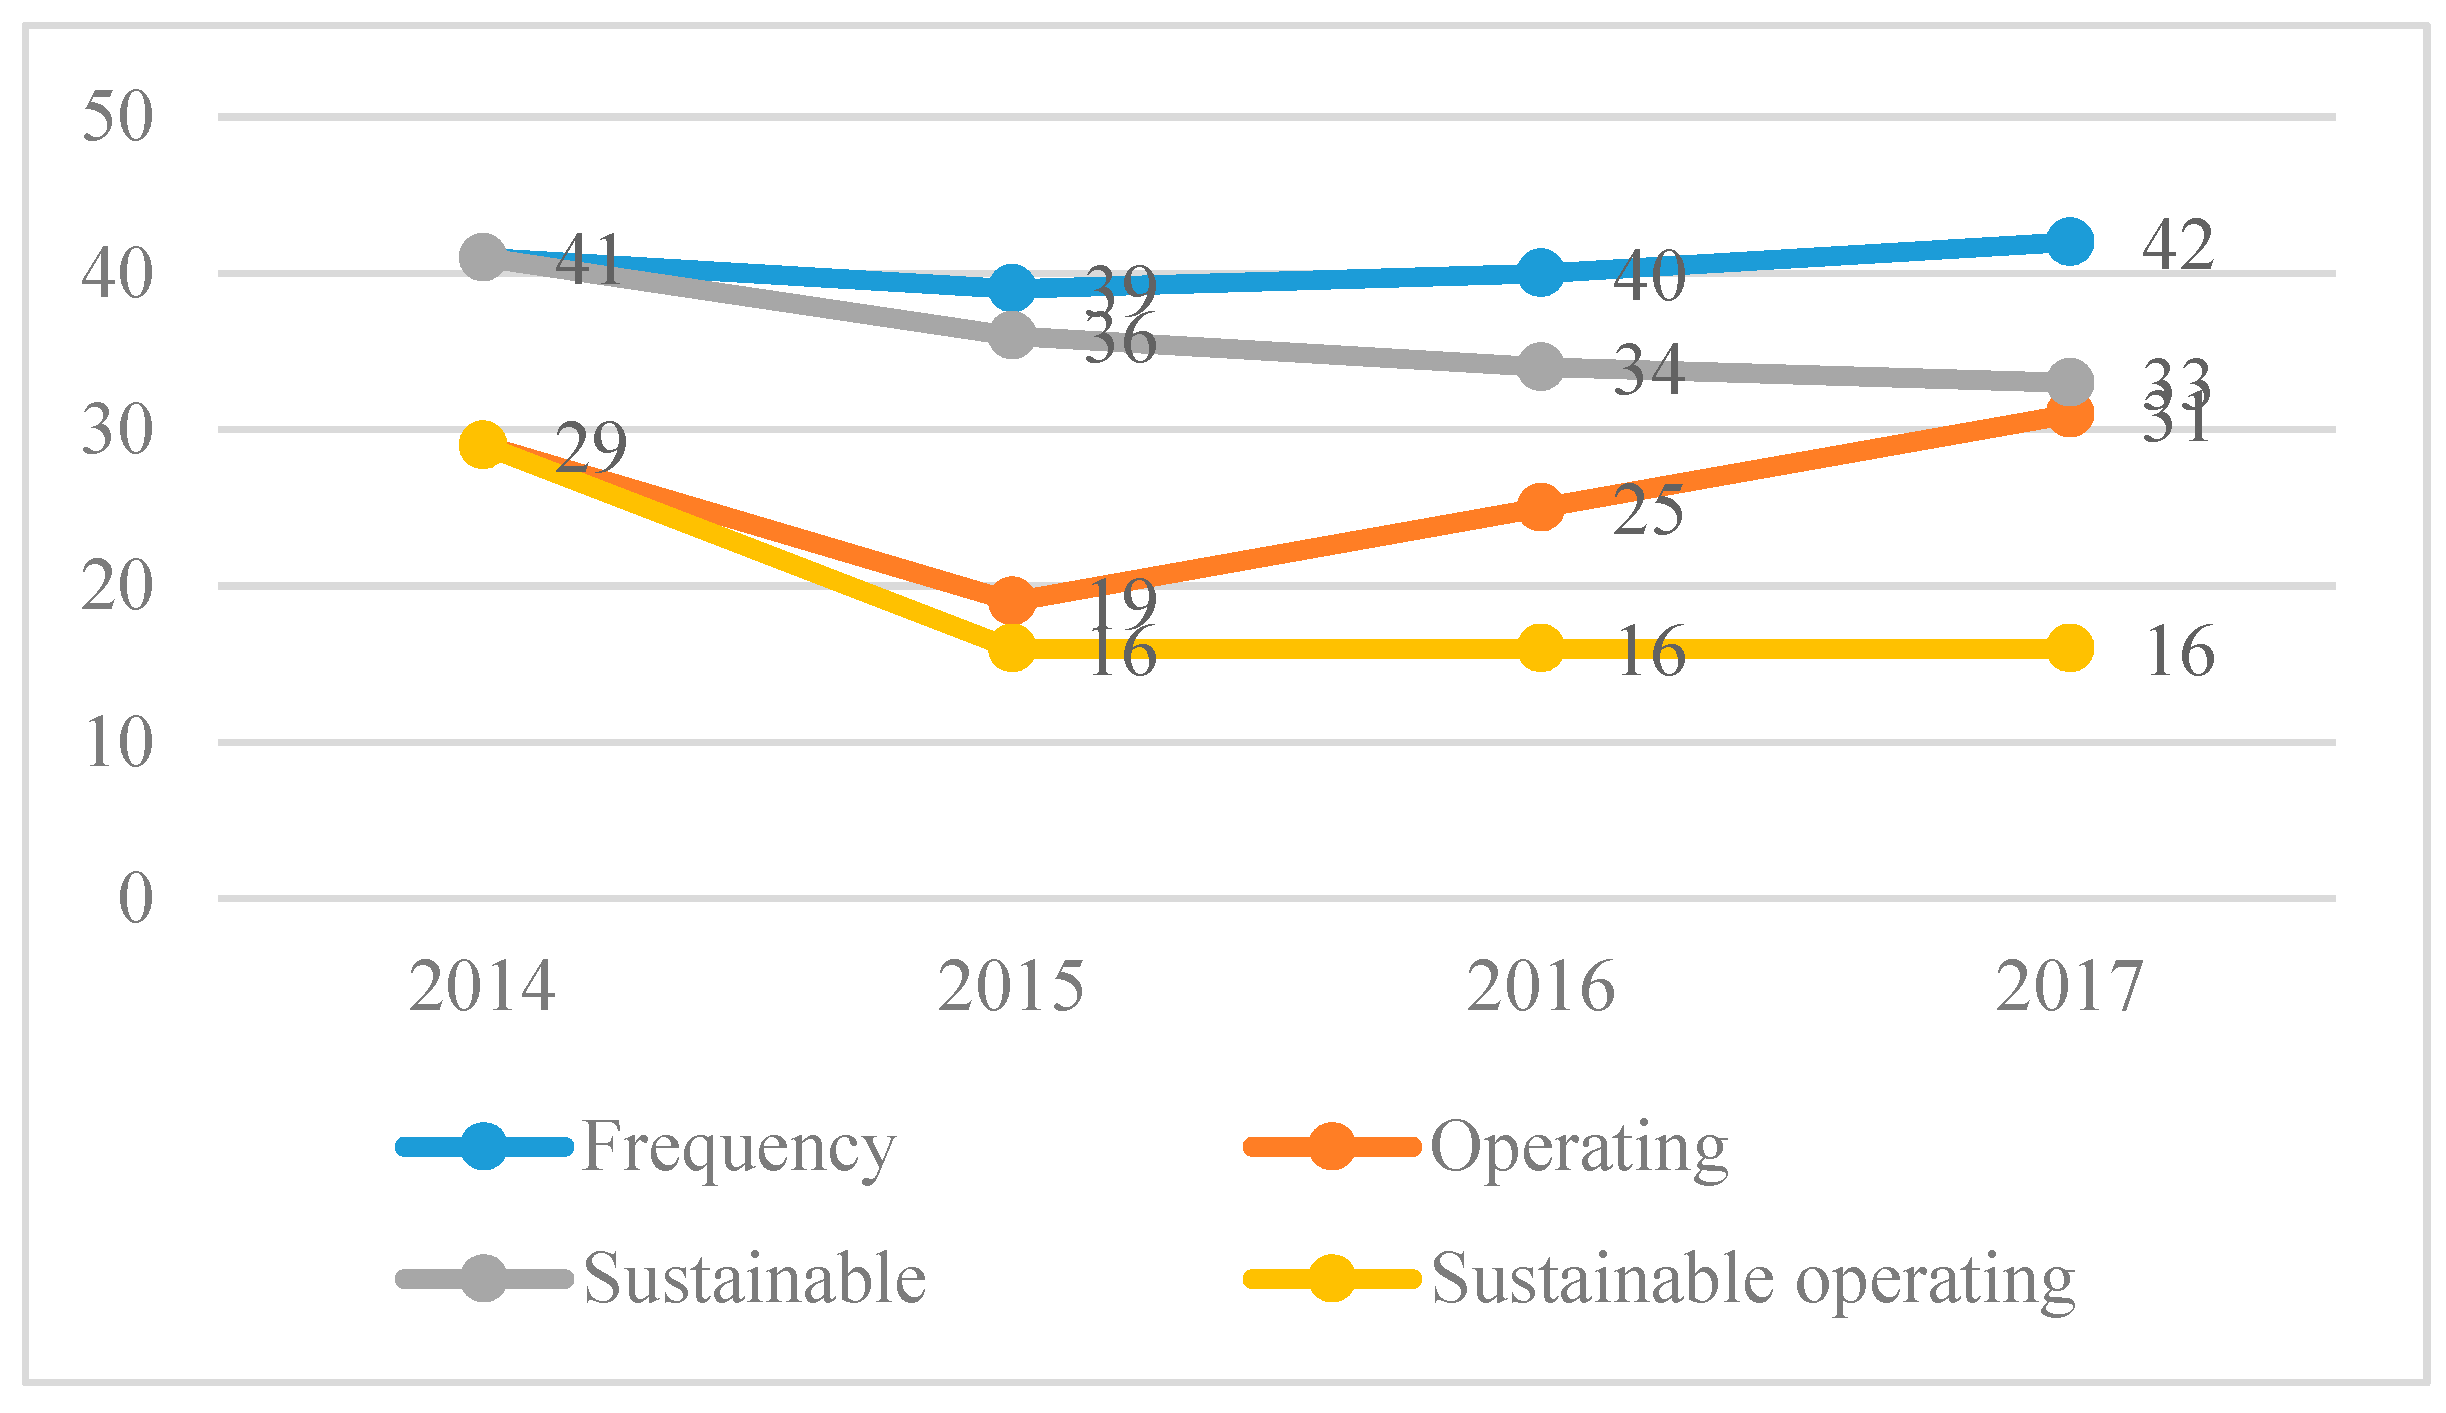
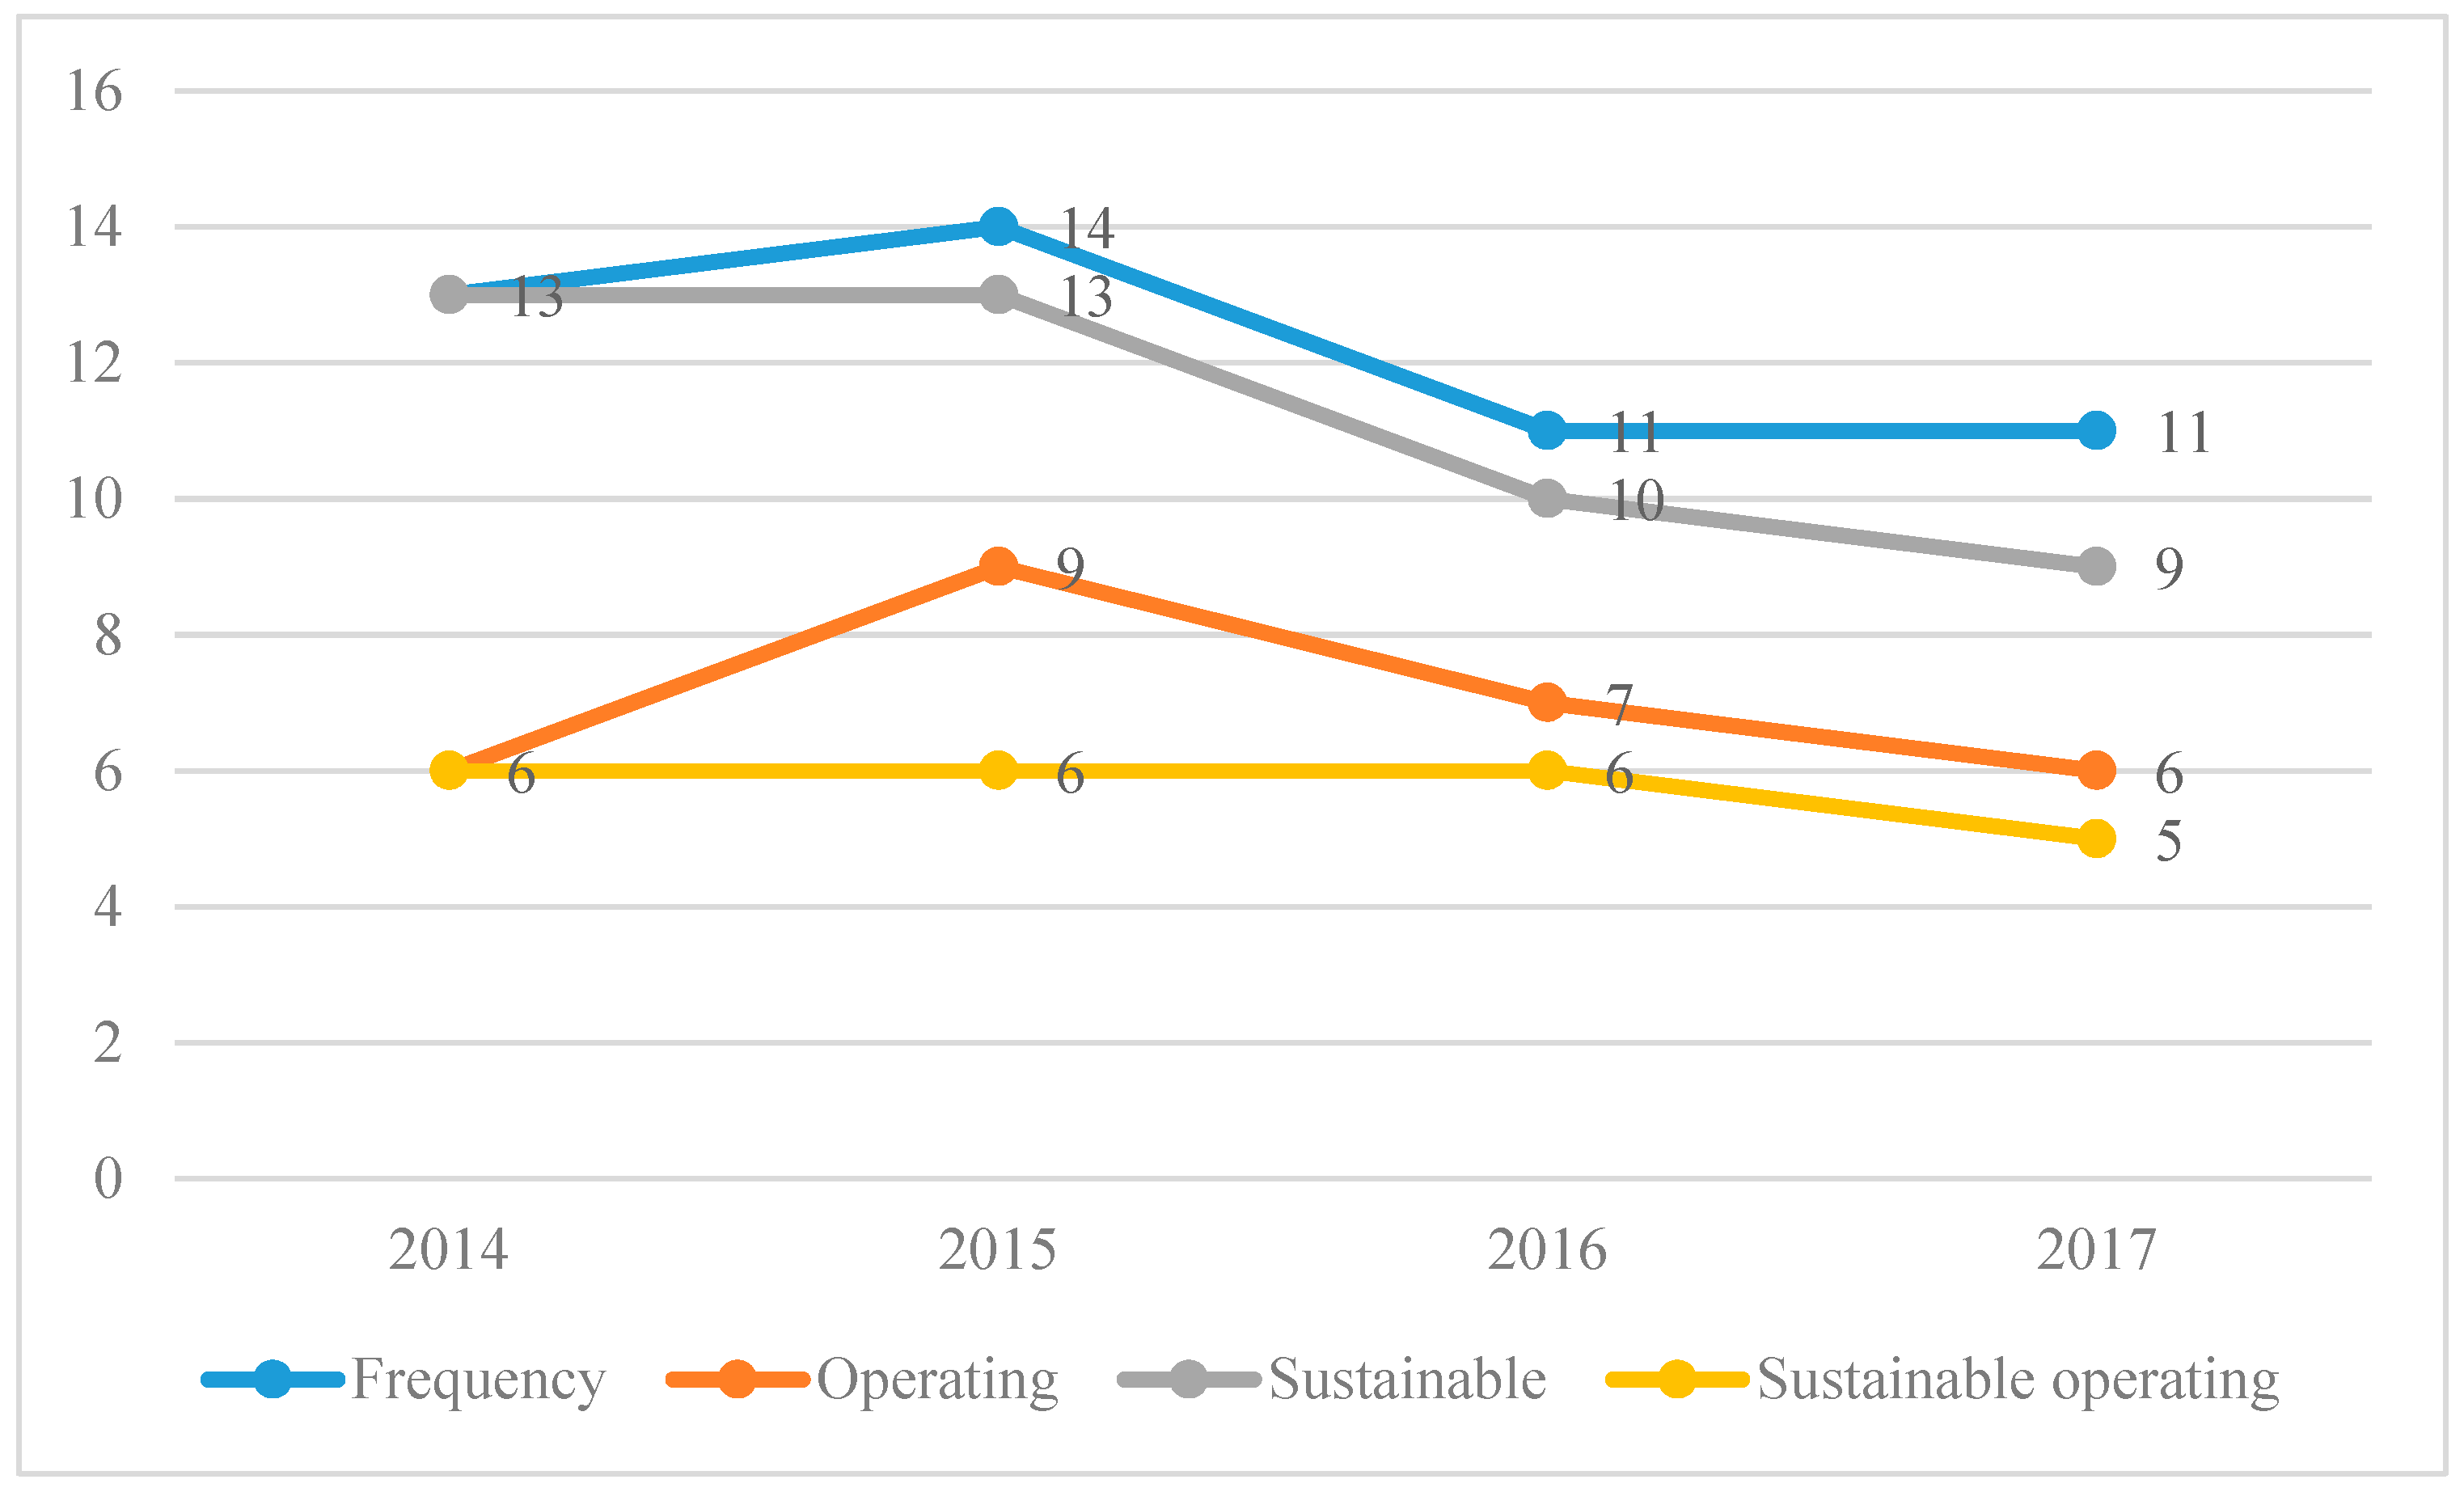
The analysis of the business operation of Banaqia shows that initial merchant invitation was conducted according to planning. However, after several years of operations, it is noted that Banaqia did not develop into a cultural and commercial area in western Sichuan, featuring Qiang culture exhibitions, shopping, entertainment, and catering, as was originally envisaged by the post-disaster recovery planning. Furthermore, numerous businesses have shut down for various reasons, and business types are inclined to be homogeneous, with the majority including local food, catering and clothes; the other types are minority. Meanwhile, entertainment businesses, such as bars, are largely unsustainable and changed into shops selling milk teas. Several commercial facilities transformed, and their commercial function has deteriorated. Additionally, the closure of shops possibly decreases the number of retail stores, threatening the other business owners and hampering the economic activities in Banaqia. Economic decline may produce an increasing number of vacant stores that induces the discontinuity of businesses. This discontinuity creates an area that does not have a commercial function or whose initial functioning falls, thereby rendering Banaqia as a place where there is no memory in collective cognition or a failed region. The spatial analysis of business operation status and types indicate that there exist apparent distinctions regarding business rates in different districts and streets. Our results additionally suggest that the post-disaster resilience in Banaqia is weak.
Several factors, such as business characteristics [6,34], indirect and direct damage due to disasters [19], pre-earthquake preparation [34,35], post-disaster assistance [36], and hazard experience [37], influence affected businesses’ capacities to recover in the short or long term. Alesh et al. [38] stated that catastrophic disasters such as earthquakes result in demographic shifts and severely impact on the profitability of firms. When small businesses do not have profitability, closure is more preferable to the situation in which “business owners continually put money into a failing business by draining their personal assets after the business assets are gone ” [38].
Besides the above-mentioned factors affecting disaster resilience, post-disaster reconstruction planning is another indispensable consideration [39,40]. Scientific circles have given increased recognition to disaster planning that serves as an effective means of intervention in the face of natural hazards and aims at achieving the overarching goal of a sustainable community. Disaster planning interests multidisciplinary research and targets understanding the dynamic coping mechanism of the governance of the uncertainties associated with human-environment sustainability [41]. Post-disaster recovery and reconstruction planning is a pivotal part in any disaster management system and represents an overall response to recovery following disasters [42].
After the Wenchuan earthquake, the State Department organized a national-level post-disaster recovery planning system—as a responsive emergency response [43]. As a majority of areas were destroyed by the earthquake, creating a huge demand for housing reconstruction, the planning system focused on city and town reconstruction led by multiple-level government agencies, from central to local municipalities [42]. Beichuan is one of the regions that was most heavily damaged by the Wenchuan earthquake. To expedite its post-disaster recovery, the county government developed a master plan—the Beichuan Qiang autonomous new county post-disaster master planning (2008–2020). These planning documents particularly stress the rebuilding of physical spaces, and the scale, pace, and quality of reconstruction is quite impressive, although socioeconomic dimensions are less emphasized. This constrains local economic development and results in a “forgotten phase” [44]. Small businesses are a crucial component of local economy and their reconstruction is negatively impacted by the economic constraint [45].
The reconstruction planning was initiated by the central government, while local government, at various levels, and outside experts were the primary policy makers. The formation of the plan lacked public participation [46]. Thus, the real needs of local residents are inconsistent with the actual reconstruction planning [42,47], which makes the recovery of small businesses less resilient. Such inconsistency is exemplified by the Banaqia commercial districts. Banaqia was planned as a commercial complex with multiple functions, from shopping to catering, but its functionalities intended to satisfy tourists’ needs, rather than the needs of local citizens. Moreover, the straight-line distances from Banaqia, Erma, Yulong, Yuchang, and Xinchuan residential districts are approximately 420 m, 430 m, 440 m, and 390 m, respectively. Such a spatial layout makes Banaqia incapable of becoming a commercial district for the citizens of New Beichuan City. Meanwhile, the total area of Banaqia is over 70,000 m2. According to the rate of 1.2 m2 per capita in developed countries, a commercial center of such magnitude should be supported by at least 40,000 residents—without considering community commerce. At present, the total population of New Beichuan City is around 31,000, so can hardly support this commercial street. As stated by Lam et al. [48], population displacement is often triggered by disasters, and this consequence is accompanied by a declined customer base and decreased sales volume. Thus, a stable local customer base is particularly crucial to local businesses [18]. The old Beichuan town, earthquake museum, and Jina Qiang Village are representative scenic sties. These are not separated far by distance. Compared with the museum and the old town, New Beichuan City only has Banaqia as a city’s landmark. In addition, tourists normally visit the museum and the other scenic places first. After these trips, when they return to the new city, they are exhausted, and do not have motivation to walk around Banaqia. Additionally, our four-year observation shows that the daily flow of customers in Banaqia is around 200, and most of these visitors left very quickly after they bought local products in the stores located in Middle Binhe Road. Therefore, the failure to meet the needs of local customers, the inadequate numbers of external customers, and their short visiting time, all have a negative impact of the business recovery and sustainable development in Banaqia.
The rapid urbanization and upgrade of urban infrastructure, along with external political and economic incentives, facilitate the conversion of agricultural to commercial economy in the small city. Such transformation is incongruent with current economic development in Beichuan. Moreover, local industry forms are still in their infancy, and employers cannot afford high labor force costs, but increasing living costs impact low-income employees and households. Therefore, the demands of local residents can hardly be high enough to promote the post-recovery of businesses in Banaqia and this further impedes tourism in New Beichuan City.
Finally, it is suggested that business recovery processes are sensitive to the overall economic climate [19]. After the reconstruction, local government aimed at promoting the image of the new city as “a nationally renowned tourism city”. During the time of investment invitation, 2011 and 2012, businesses around the country invested in the city and created a prosperous picture of Banaqia, which is consistent with the research conducted by DRC [19]. However, small business owners held overly ambitious expectations for Banaqia and opened luxury cloth stores and entertainment shops which targeted customers who were mainly visitors and high-income citizens. When the number of tourists decreased and local residents did not come, business owners had to make adjustments: adding investment, maintaining operational status by changing business type, offering discounts, or simply shutting the store. From 2014 to 2017, the overall numbers of operating stores kept falling, although the number of specialty and catering shops rose, indicating that the owners considered making adjustments or closing their stores to accommodate customer situation. According to Alesh et al. [38], for many small business owners, an outright decision to close would have been preferable to this gradual decline into commercial and personal ruin. Therefore, the shrinking of investments further deteriorates the overall commercial operation of Banaqia.

6. Conclusions

This study focused on the developmental changes of the operating status of initial surviving businesses in Banaqia Business Street after the Wenchuan Earthquake. The evolution of garment, catering, and specialty types are also explored, and a comparative analysis was made. The results of this study reveal two conclusions: (1) Banaqia declined rapidly after a short period of initial prosperity; and (2) although the business types of the three districts gradually converge, there still exists distinct patterns in terms of post-disaster recovery and sustainable development.
Our findings show that the rate of business shutdown in Banaqia is higher than that of the firms with 1–250 employees from 2000 to 2010 calculated by the U.S. census [49]. Our estimates do not account for non-employer small business, but do include employer and non-employer businesses. There might be a marginal increase of sustainable business rates in the future, but equilibrium may be expected if no substantial adjustments are to be developed.
The reconstruction following the Wenchuan earthquake was not a natural process and required the complete involvement of the government and various community organizations. This process included collective efforts of human capital, technology, and funding, and it was led by the central government [50]. Demanding standards and somewhat unrealistic goals largely shortened the construction period of the new county, resulting in the three-year rebuilding project being finished within two years. Such a short period is inadequate for the long-term recovery in response to such a devastating earthquake [43]. The reconstruction planning was top-down and coercive, and was facilitated by the implementation of partner province assistance. Post-disaster recovery was well-planned and highly political; however, local businesses lack long-term vitality and are, therefore, unsustainable.
This paper offers the following policy implications regarding small business recovery following disasters: (1) the participation of local residents, NGOs, and business owners should be prioritized during the planning stage of post-disaster construction; (2) post-event reconstruction should be reasonably prolonged and dependent on progress and concrete conditions; and (3) commercial centers or streets should be located in communities in small cities.

Acknowledgments

This research was funded by the Chongqing Social Science Fund (Grant No. 2017BS06). It is also supported by the National Social Science Fund of China (Grant No. 11XZZ001) and Chongqing University Postgraduates’ Innovation Project (Grant No. CYB15005).

Author Contributions

Lin Wang and Jie Song conceived and designed the paper; Lifang Huang collected the data; and Lifang Huang and Jie Song wrote the paper.

Conflicts of Interest

The authors declare no conflict of interest.

References

  1. Cochrane, H.C. Overview of Economic Research on Earthquake Consequences, in the Committee on Earthquake Engineering. In National Research Council Editors, the Economic Consequences of a Catastrophic Earthquake: Proceeding of a Forum; National Academy Press: Washington, DC, USA, 1992; pp. 100–111. [Google Scholar]
  2. Tierney, K.J. Businesses and disasters: Vulnerability, impacts, and recovery. In Handbook of Disaster Research; Handbooks of Sociology and Social Research; Springer: Berlin, Germany, 2007; pp. 275–296. [Google Scholar]
  3. Asgary, A.; Anjum, M.I.; Azimi, N. Disaster recovery and business continuity after the 2010 flood in Pakistan: Case of small businesses. Int. J. Disaster Risk Reduct. 2012, 2, 46–56. [Google Scholar] [CrossRef]
  4. Burton, M.L.; Hicks, M.J. Hurricane Katrina: Preliminary Estimates of Commercial and Public Sector Damages; Marshall University Center for Business and Economic Research: Huntington, WV, USA, 2005. [Google Scholar]
  5. Jones, B.G.; Chang, S.E. Economic aspects of urban vulnerability and disaster mitigation. In The Role of Engineering and Technology; Cheng, F.Y., Shen, M.S., Eds.; Elsevier Science Ltd.: Oxford, UK, 1995; pp. 311–320. [Google Scholar]
  6. Tierney, K.J. Business impacts of the Northridge earthquake. J. Conting. Crisis Manag. 1997, 5, 87–97. [Google Scholar] [CrossRef]
  7. Sahebjamnia, N.; Torabi, S.A.; Mansouri, S.A. Integrated business continuity and disaster recovery planning: Towards organizational resilience. Eur. J. Oper. Res. 2015, 242, 261–273. [Google Scholar] [CrossRef]
  8. Lagadec, P. Understanding the French 2003 Heat Wave Experience: Beyond the heat, a Multi-Layered Challenge. J. Conting. Crisis Manag. 2004, 12, 160–169. [Google Scholar] [CrossRef]
  9. Min, J.C. SARS devastation on tourism: The Taiwan case. J. Am. Acad. Bus. 2005, 6, 278–284. [Google Scholar]
  10. Quarantelli, E.L. Disaster crisis management: A summary of research findings. J. Manag. Stud. 1988, 25, 373–385. [Google Scholar] [CrossRef]
  11. Hale, J.E.; Dulek, R.E.; Hale, D.P. Crisis response communication challenges: Building theory from qualitative data. J. Bus. Commun. (1973) 2005, 42, 112–134. [Google Scholar] [CrossRef]
  12. Runyan, R.C. Small business in the face of crisis: Identifying barriers to recovery from a natural disaster. J. Conting. Crisis Manag. 2006, 14, 12–26. [Google Scholar] [CrossRef]
  13. Webb, G.R.; Tierney, K.J.; Dahlhamer, J.M. Businesses and disasters: Empirical patterns and unanswered questions. Nat. Hazards Rev. 2000, 1, 83–90. [Google Scholar] [CrossRef]
  14. Chang, S.E.; Falit-Baiamonte, A. Disaster vulnerability of businesses in the 2001 Nisqually earthquake. Glob. Environ. Chang. Part B Environ. Hazards 2002, 4, 59–71. [Google Scholar] [CrossRef]
  15. Lindell, M.K.; Perry, R.W. Earthquake impacts and hazard adjustment by acutely hazardous materials facilities following the Northridge earthquake. Earthq. Spectra 1998, 14, 285–299. [Google Scholar] [CrossRef]
  16. Whitney, D.J.; Dickerson, A.; Lindell, M.K. Nonstructural seismic preparedness of Southern California hospitals. Earthq. Spectra 2001, 17, 153–171. [Google Scholar] [CrossRef]
  17. Rebekah, G.; Scott, M.; Gala, G.; Jason, L. Business Recovery Related to High-Frequency Natural Hazard Events. Quick Response Report, Natural Hazards Center, 2008. Available online: https://www.preventionweb.net/publications/view/16721 (accessed on 28 February 2018).
  18. Sydnor, S.; Niehm, L.; Lee, Y.; Marshall, M.; Schrank, H. Analysis of post-disaster damage and disruptive impacts on the operating status of small businesses after Hurricane Katrina. Nat. Hazards 2017, 85, 1637–1663. [Google Scholar] [CrossRef]
  19. Tierney, K.J.; Webb, G.R. Business Vulnerability to Earthquakes and Other Disasters. Disaster Research Center, 2001. Available online: http://udspace.udel.edu/bitstream/handle/19716/729/PP320.pdf?sequence=1 (accessed on 28 February 2018).
  20. Webb, G.R.; Tierney, K.J.; Dahlhamer, J.M. Predicting long-term business recovery from disaster: A comparison of the Loma Prieta earthquake and Hurricane Andrew. Glob. Environ. Chang. Part B Environ. Hazards 2002, 4, 45–58. [Google Scholar] [CrossRef]
  21. Kroll, C.A.; Landis, J.D.; Shen, Q.; Stryker, S. Economic Impacts of the Loma Prieta Earthquake: A Focus on Small Business. Philosophy 1991, 1, 1–40. [Google Scholar]
  22. Kleindorfer, P.R.; Singhal, K.; Wassenhove, L.N.V. Sustainable Operations Management. Prod. Oper. Manag. 2005, 14, 482–492. [Google Scholar] [CrossRef]
  23. Liu, Y. Sustainable competitive advantage in turbulent business environments. Int. J. Prod. Res. 2013, 51, 2821–2841. [Google Scholar] [CrossRef]
  24. Earthquake Disaster Records. The Rescue Records of Wenchuan Earthquake-Vo. 4; Local Records Publishing: Chengdu, China, 2015. [Google Scholar]
  25. Zhong, K.; Lu, X. Exploring the administrative mechanism of China’s Paired Assistance to Disaster Affected Areas programme. Disasters 2017, 3. [Google Scholar] [CrossRef] [PubMed]
  26. China Network Television. The Opening Ceremony of “Banaqia Business Street” in Beichuan. 2011. Available online: http://news.cntv.cn/20110421/109817.shtml (accessed on 5 December 2017).
  27. Khan, S.F.; Kamp, U.; Owen, L.A. Documenting five years of landsliding after the 2005 Kashmir earthquake, using repeat photography. Geomorphology 2013, 197, 45–55. [Google Scholar] [CrossRef]
  28. Brown, D.; So, E. Indicators for measuring, monitoring and evaluating post-disaster recovery. In Proceedings of the 6th International Workshop on Remote Sensing for Disaster Applications, Pavia, Italy, 12 September 2008. [Google Scholar]
  29. Marshall, M.I.; Schrank, H.L. Small business disaster recovery: A research framework. Nat. Hazards 2014, 72, 597–616. [Google Scholar] [CrossRef]
  30. Jensen, J.R. Remote Sensing of the Environment: An Earth Resource Perspective; Prentice Hall: Saddle River, NJ, USA, 2000. [Google Scholar]
  31. Burton, C.; Mitchell, J.T.; Cutter, S.L. Evaluating post—Katrina recovery in Mississippi using repeat photography. Disasters 2011, 35, 488–509. [Google Scholar] [CrossRef] [PubMed]
  32. Bass, J.O.J. More trees in the tropics. Area 2004, 36, 19–32. [Google Scholar] [CrossRef]
  33. Wildemuth, B.M. Applications of Social Research Methods to Questions in Information and Library Science; Libraries Unlimited Inc.: Walse, UK, 2009. [Google Scholar]
  34. Han, Z.; Nigg, J. The influences of business and decision makers’ characteristics on disaster preparedness—A study on the 1989 Loma Prieta earthquake. Int. J. Disaster Risk Sci. 2011, 2, 22–31. [Google Scholar] [CrossRef]
  35. Bond, B. Lessons in preparedness from the response to Hurricane Katrina. J. Bus. Contin. Emerg. Plan. 2007, 1, 426–431. [Google Scholar]
  36. Corey, C.M.; Deitch, E.A. Factors affecting business recovery immediately after Hurricane Katrina. J. Conting. Crisis Manag. 2011, 19, 169–181. [Google Scholar] [CrossRef]
  37. Lindell, M.K.; Perry, R.W. Household adjustment to earthquake hazard: A review of research. Environ. Behav. 2000, 32, 461–501. [Google Scholar] [CrossRef]
  38. Alesch, D.J.; Holly, J.N.; Mittler, E.; Nagy, R. Organizations at Risk: What Happens When Small Businesses and Not-For-Profits Encounter Natural Disasters; Public Entity Risk Institute: Fairfax, VA, USA, 2001. [Google Scholar]
  39. Flynn, D.T. The impact of disasters on small business disaster planning: A case study. Disasters 2007, 31, 508–515. [Google Scholar] [CrossRef] [PubMed]
  40. Wright, C.S.H. Small Business Owners’ Perceived Barriers and Motivators in Disaster Planning in Sri Lanka: A Multiple Case Study; Northcentral University: San Diego, CA, USA, 2017. [Google Scholar]
  41. Clark, W.C.; Dickson, N.M. Sustainability science: The emerging research program. Proc. Natl. Acad. Sci. USA 2003, 100, 8059–8061. [Google Scholar] [CrossRef] [PubMed]
  42. Ge, Y.; Gu, Y.; Deng, W. Evaluating China’s national post-disaster plans: The 2008 Wenchuan earthquake’s recovery and reconstruction planning. Int. J. Disaster Risk Sci. 2010, 1, 17–27. [Google Scholar]
  43. Lu, Y.; Xu, J. Comparative study on the key issues of Postearthquake recovery and reconstruction planning: Lessons from the United States, Japan, Iran, and China. Nat. Hazards Rev. 2014, 16. Available online: https://doi.org/10.1061/(ASCE)NH.1527-6996.0000172 (accessed on 17 May 2014). [CrossRef]
  44. Dunford, M.; Li, L. Earthquake reconstruction in Wenchuan: Assessing the state overall plan and addressing the ‘forgotten phase’. Appl. Geogr. 2011, 31, 998–1009. [Google Scholar] [CrossRef]
  45. Yoshida, K.; Deyle, R.E. Determinants of Small Business Hazard Mitigation. Nat. Hazards Rev. 2005, 6, 1–12. [Google Scholar] [CrossRef]
  46. Huang, Y.; Zhou, L.; Wei, K. 5.12 Wenchuan Earthquake Recovery Government Policies and Non-Governmental Organizations’ Participation. Asia Pac. J. Soc. Work Dev. 2011, 21, 77–91. [Google Scholar] [CrossRef]
  47. Ghafory-Ashtiany, M.; Hosseini, M. Post-Bam earthquake: Recovery and reconstruction. Nat. Hazards 2008, 44, 229–241. [Google Scholar] [CrossRef]
  48. Lam, N.S.; Arenas, H.; Pace, K.; LeSage, J.; Campanella, R. Predictors of business return in New Orleans after Hurricane Katrina. PLoS ONE 2012, 7, e47935. [Google Scholar] [CrossRef] [PubMed]
  49. U.S. Bureau of Census. Business Dynamics Statistics Data Tables: Establishment Characteristics. 2012. Available online: http://www.census.gov/ces/dataproducts/bds/data_estab.html (accessed on 4 December 2017).
  50. Shaoqiong, X. Rising from the Ashes—Disaster, Recostruction and Social Change; Guangdong Peoples Publishing House: Guangzhou, China, 2011. [Google Scholar]
Figure 1. The framework of this paper.
Sustainability 10 00651 g001
Figure 2. The overall planning and design of New Beichuan City.
Sustainability 10 00651 g002
Figure 3. The land use planning of Banaqia.
Sustainability 10 00651 g003
Figure 4. The standard of business recovery.
Sustainability 10 00651 g004
Figure 5. The standard of business sustainable development.
Sustainability 10 00651 g005
Figure 6. The number of businesses during 2014–2017 in Banaqia Business Street.
Sustainability 10 00651 g006
Figure 7. The number of specialty stores from 2014 to 2017 in Banaqia.
Sustainability 10 00651 g007
Figure 8. The number of catering stores from 2014 to 2017 in Banaqia.
Sustainability 10 00651 g008
Figure 9. The number of garment stores in operation from 2014 to 2017.
Sustainability 10 00651 g009
Figure 10. The number of Specialty shops from 2014 to 2017 in Section A.
Sustainability 10 00651 g010
Figure 11. The number of garment shops from 2014 to 2017 in Section A.
Sustainability 10 00651 g011
Figure 12. The number of specialty shops from 2014 to 2017 in Section B.
Sustainability 10 00651 g012
Figure 13. The number of catering shops from 2014 to 2017 in Section B.
Sustainability 10 00651 g013
Figure 14. The number of garment shops from 2014 to 2017 in Section B.
Sustainability 10 00651 g014
Figure 15. The number of specialty shops from 2015 to 2017 in Section C.
Sustainability 10 00651 g015
Figure 16. The number of catering shops from 2014 to 2017 in Section C.
Sustainability 10 00651 g016
Figure 17. The number of garment shops from 2014 to 2017 in Section C.
Sustainability 10 00651 g017
Table 1. Field Trip and Data Collected.
20–23 July 201420–23 July 20153–6 August 20163–6 July 2017
Field observation538 samples538 samples538 samples538 samples
Repeat photography545 images540 images550 images560 images
Semi-structured interview20 small business owners15 small business owners26 small business owners56 small business owners
Table 2. Samples from field observation.
Sample IDSection AreaStreetNameOperating StatusBusiness TypeSurvey Time
C-6-YWSE-33CYuwang Street EastQiangjiapuziOperatingSpecialty22 July 2015, 15:18
C-6-YWSE-31CYuwang Street EastYuqiang SpecialtyNot operatingSpecialty22 July 2015, 15:20
C-6-YWSE-29CYuwang Street EastDayiyanOperatingGarmentJuly 22, 2015, 15:22
C-6-YWSE-27CYuwang Street EastShaodongjiaOperatingSpecialty22 July 2015, 15:23
C-6-YWSE-25CYuwang Street EastQiangbatuhuoOperatingSpecialty22 July 2015, 15:25
C-6-YWSE-23CYuwang Street EastQiangbatuhuoOperatingSpecialty22 July 2015, 15:25
Table 3. The operating situation of shops in Section A from 2014 to 2017.
OperatingSustainable Operating
FrequencyPercentage (%)FrequencyPercentage (%)
20146755.3767100.00
20155545.454668.66
20166654.554567.16
20176150.414161.19
Table 4. The operating situation of shops in Section B from 2014 to 2017.
OperatingSustainable Operating
FrequencyPercentage (%)FrequencyPercentage (%)
201410544.87105100.00
20159741.458177.14
20169741.457167.62
201710243.596864.76
Table 5. The operating situation of shops in Section C from 2014 to 2017.
OperatingSustainable Operating
FrequencyPercentage (%)FrequencyPercentage (%)
20148848.0988100.00
20156334.435461.36
20166434.974753.41
20176736.614247.73
Table 6. The frequency (Fre) and percentage (Per) of each business type during 2014–2017
2014201520162017
FrePer (%)FrePer (%)FrePer (%)FrePer (%)
Specialty10118.810219.09818.210619.7
Catering8616.08315.47914.77513.9
Garment448.2427.8427.8427.8
Other15829.415128.115027.914126.2
Vacant14927.716029.716931.417432.3
Table 7. The frequency (Fre) and percentage (Per) of each business type in Section A during 2014–2017.
2014201520162017
FrePer (%)FrePer (%)FrePer (%)FrePer (%)
Specialty4133.93932.24033.14234.7
Catering1512.41512.41411.6129.9
Garment1310.71411.6119.1119.1
Other4738.84133.94133.93125.6
Vacant54.1129.91512.42520.7
Table 8. The number of Catering shops from 2014 to 2017 in Section A.
2014201520162017
Frequency15151412
Operating5544
Sustainable15151412
Sustainable operating5544
Table 9. The frequency (Fre) and percentage (Per) of each business type in Section B in 2014–2017.
2014201520162017
FrePer (%)FrePer (%)FrePer (%)FrePer (%)
Specialty3615.43816.23515.03715.8
Catering4017.13715.83414.53213.7
Garment114.783.4104.3104.3
Other6427.46326.96025.66126.1
Vacant8335.58837.69540.69440.2
Table 10. The frequency (Fre) and percentage (Per) of each business type in Section C in 2014–2017.
2014201520162017
FrePer (%)FrePer (%)FrePer (%)FrePer (%)
Specialty2413.12513.72312.62714.8
Catering3116.93116.93116.93116.9
Garment2010.92010.92111.52111.5
Other4725.74725.74926.84926.8
Vacant6133.36032.85932.25530.1

