Article

Estimating the Possibility of Surface Soil Pollution with Atmospheric Lead Deposits Using the ADMER Model

Department of Risk Management and Environmental Sciences, Yokohama National University, Yokohama 240-8501, Japan
*
Author to whom correspondence should be addressed.
Sustainability 2018, 10(3), 720; https://doi.org/10.3390/su10030720
Submission received: 3 January 2018 / Revised: 15 February 2018 / Accepted: 28 February 2018 / Published: 6 March 2018
(This article belongs to the Section Environmental Sustainability and Applications)

Abstract

:
The literature assessing the risks of soil pollution from atmospheric lead (Pb) deposition is still insufficient, given that Pb deposition can cause large-scale surface soil pollution. This study estimated the possibility of Pb deposition causing soil pollution by calibrating a numerical model of deposition flux with a measured Pb content dataset in proximity to a pollution source. A total 34 surface soil samples were collected around an industrial park that emits Pb into the atmosphere. The sample’s Pb content was determined using hydrochloric acid extraction and an ICP-MS. The amount of annual Pb deposition was estimated using the atmospheric dispersion model for exposure and risk assessment (ADMER model). This approach resulted in accurate predictions of Pb distribution for most sites (<800 m from the pollution source), but the results indicated that the dry deposition velocity of Pb-containing particles was a significant determinant of horizontal Pb distribution. We conducted a sensitivity analysis of the ADMER’s estimated Pb deposition flux values by changing the diameter of Pb-containing particles. This analysis showed large fluctuations in soil Pb content within 1 km of the source, within the range of the previously reported dry deposition velocity.

1. Introduction

According to a report from the Japanese Ministry of the Environment, in most cases of soil pollution, the causes could not be specified [1]. Among cases with unknown causes, 71% were polluted by heavy metals, and the most frequent pollutant was Pb [1]. According to Japan’s established Pollutant Release and Transfer Register system (PRTR) data [2], the amount of Pb discharged in Japan during the 2015 fiscal year was approximately 7.0 Mg for the atmospheric environment. The deposition of Pb from the atmosphere could increase the risk of its direct inhalation and affect the quality of surface soils [3,4,5]. We estimate that the 7.0 Mg of atmospheric Pb pollutes ca. 2.3 km2 of surface soil (0–2 cm depth, 1 g cm−3 bulk density) with Pb to Japan’s legal limit (150 mg Pb kg−1 dry soil) every year. Elemental, sulfate, and carbonate forms of Pb, which have low solubility in water, are commonly found in the atmosphere, and most ionized Pb can be adsorbed on soil minerals [6]. Therefore, the Pb species can accumulate within surface soil [7,8], and the possibility of deposition on ground surfaces should be carefully assessed.
Concerning the path of contamination by deposition, the spatial distribution of heavy metals has been reported on surface soils around a cement factory [9]. Krishna et al. investigated the spatial distribution of Pb in surface soils around a factory, and differentiated the effects of industrial activity on surface ground pollution from the impacts of pollution from natural sources [10]. Soriano et al. confirmed the soil pollution from atmospheric deposition by analyzing heavy metals in particles collected by an air sampler [11]; Qiao et al. reported that soil type was a main factor influencing the migration of As, Pb, and Cd in rainfall, based on Geographical Detector Software [12]; and Kobayashi et al. reported that the adsorption and elution of metals from contaminated soil was influenced by pH, content of humic substances, and salt concentration [13]. Therefore, depending on the environmental factors mentioned above, various heavy metals forms can stay on the soil surface or migrate along the soil profile. Other studies have also shown that soil pollution can be caused by deposition of heavy metals from the atmosphere [14,15,16,17,18]. For soil and groundwater protection, it therefore important to consider the soil contamination due to heavy metals deposition from the atmosphere, but this input to soil pollution is still not emphasized in environmental assessment and management practices of polluted sites.
Specifically, Pb deposition has not been assessed due to the lack of verification data on the tools used for linking large-scale meteorological data and atmospheric Pb deposition. There have been some efforts to estimate the spatial distribution of polluted sites by modeling dispersion and deposition of atmospheric pollutants [19,20,21,22,23]. The atmospheric dispersion model for exposure and risk assessment (ADMER model) is a series of models and systems designed for estimating atmospheric levels of chemicals and assessing their exposure. It uses data from various sources—Google Earth™ maps, the automated meteorological data acquisition system (AMeDAS), the PRTR, and other statistics (e.g., traffic, population)—in a single interface [24,25]. The ADMER is a puff-plume model that simulates the dispersion of atmospheric pollutants from their emission sources and evaluates dry deposition and washout of atmospheric pollutants at 100-m resolution [24,25]. The ADMER has been verified for various pollutants (e.g., 1, 3-butadiene [26]), but it has not yet been evaluated based on its estimation of the horizontal distribution of Pb deposited on ground surfaces. Nor has it been evaluated with a precise dataset showing the Pb content of surface soil samples.
The aim of this study, illustrated in Figure 1, was to evaluate the contribution of atmospheric Pb deposition potential on pollution of a soil surrounding an industrial site. First, we measured the soil Pb concentration around the industry emitting Pb. Then, the ADMER model was used to estimate the distribution of annual deposition flux in the soil where the emitted Pb settled. Third, the estimated horizontal distribution of Pb deposition and the measured Pb content of the surface soil were compared to optimal estimates of atmospheric Pb deposition. Furthermore, because the parameter values entered into the ADMER model could have a significant influence on the deposition flux to soil surface calculation results, we compared the estimated results of the deposition flux with meteorological data and Pb-containing particle diameters.

2. Materials and Methods

2.1. Study Area and Sampling Techniques

An intensive source of aerosol-form Pb emissions was located in the park (Figure 2). The study area, illustrated in Figure 2, was selected by searching the established survey data in the PRTR system [27] from April 2001 to March 2015 (2001–2014 fiscal years). For 2010–2014 the amount of released Pb was calculated from the PRTR Pb compounds data with conversion factors for the Pb compounds, while for 2001–2009 we used reported PRTR Pb data. In the 2001–2014 fiscal years, the selected factory discharged Pb into the atmosphere at rates of 500–5500 kg year−1. This factory had been conducting Pb emitting in the vicinity of residential areas (apartments, schools, parks, etc.) for many decades. Surface soil samples were collected from 34 sites within the study area (Figure 2) at a depth of 0–2 cm, and then fine particles were collected for Pb analysis using a sieve with 2-mm openings. Each of the analytical samples was stored in a 50-mL polypropylene bottle.

2.2. Measurement of Lead Content in Soil Samples

In this study, the Pb content of each of the surface soil samples was measured in order to monitor the horizontal distribution of polluted soil. We included the legal limit for Pb in soil (150 mg kg−1 [28]) in our visualization of the horizontal distribution results. Each extract solution of Pb was made in accordance with the Japanese Ministry of the Environment’s Notification No. 19 [29]. Then, the Pb content of the solution was measured using an inductively coupled plasma mass spectrometer (ICP-MS, ELAN DRC-e, Perkin Elmer, Ltd., Waltham, MA, USA). The Pb content (mg kg−1) of each soil sample was calculated based on ICP-MS results. Six grams (dry matter basis) of each soil sample was mixed with 200 g of 1 M HCl in a 500-mL polypropylene bottle, and the suspension was shaken reciprocally for two hours at 200 strokes per minute at room temperature (Figure 3). After shaking, the mixture was left undisturbed for 20 min so that the supernatant could be collected. The supernatant was then purified by centrifugation at 3000 rpm (1510× g) for 20 min and filtered with a 0.45-μm pore size membrane filter (Membrane Solutions, Tokyo, Japan). Finally, the Pb content of the test solution was determined by the ICP-MS.

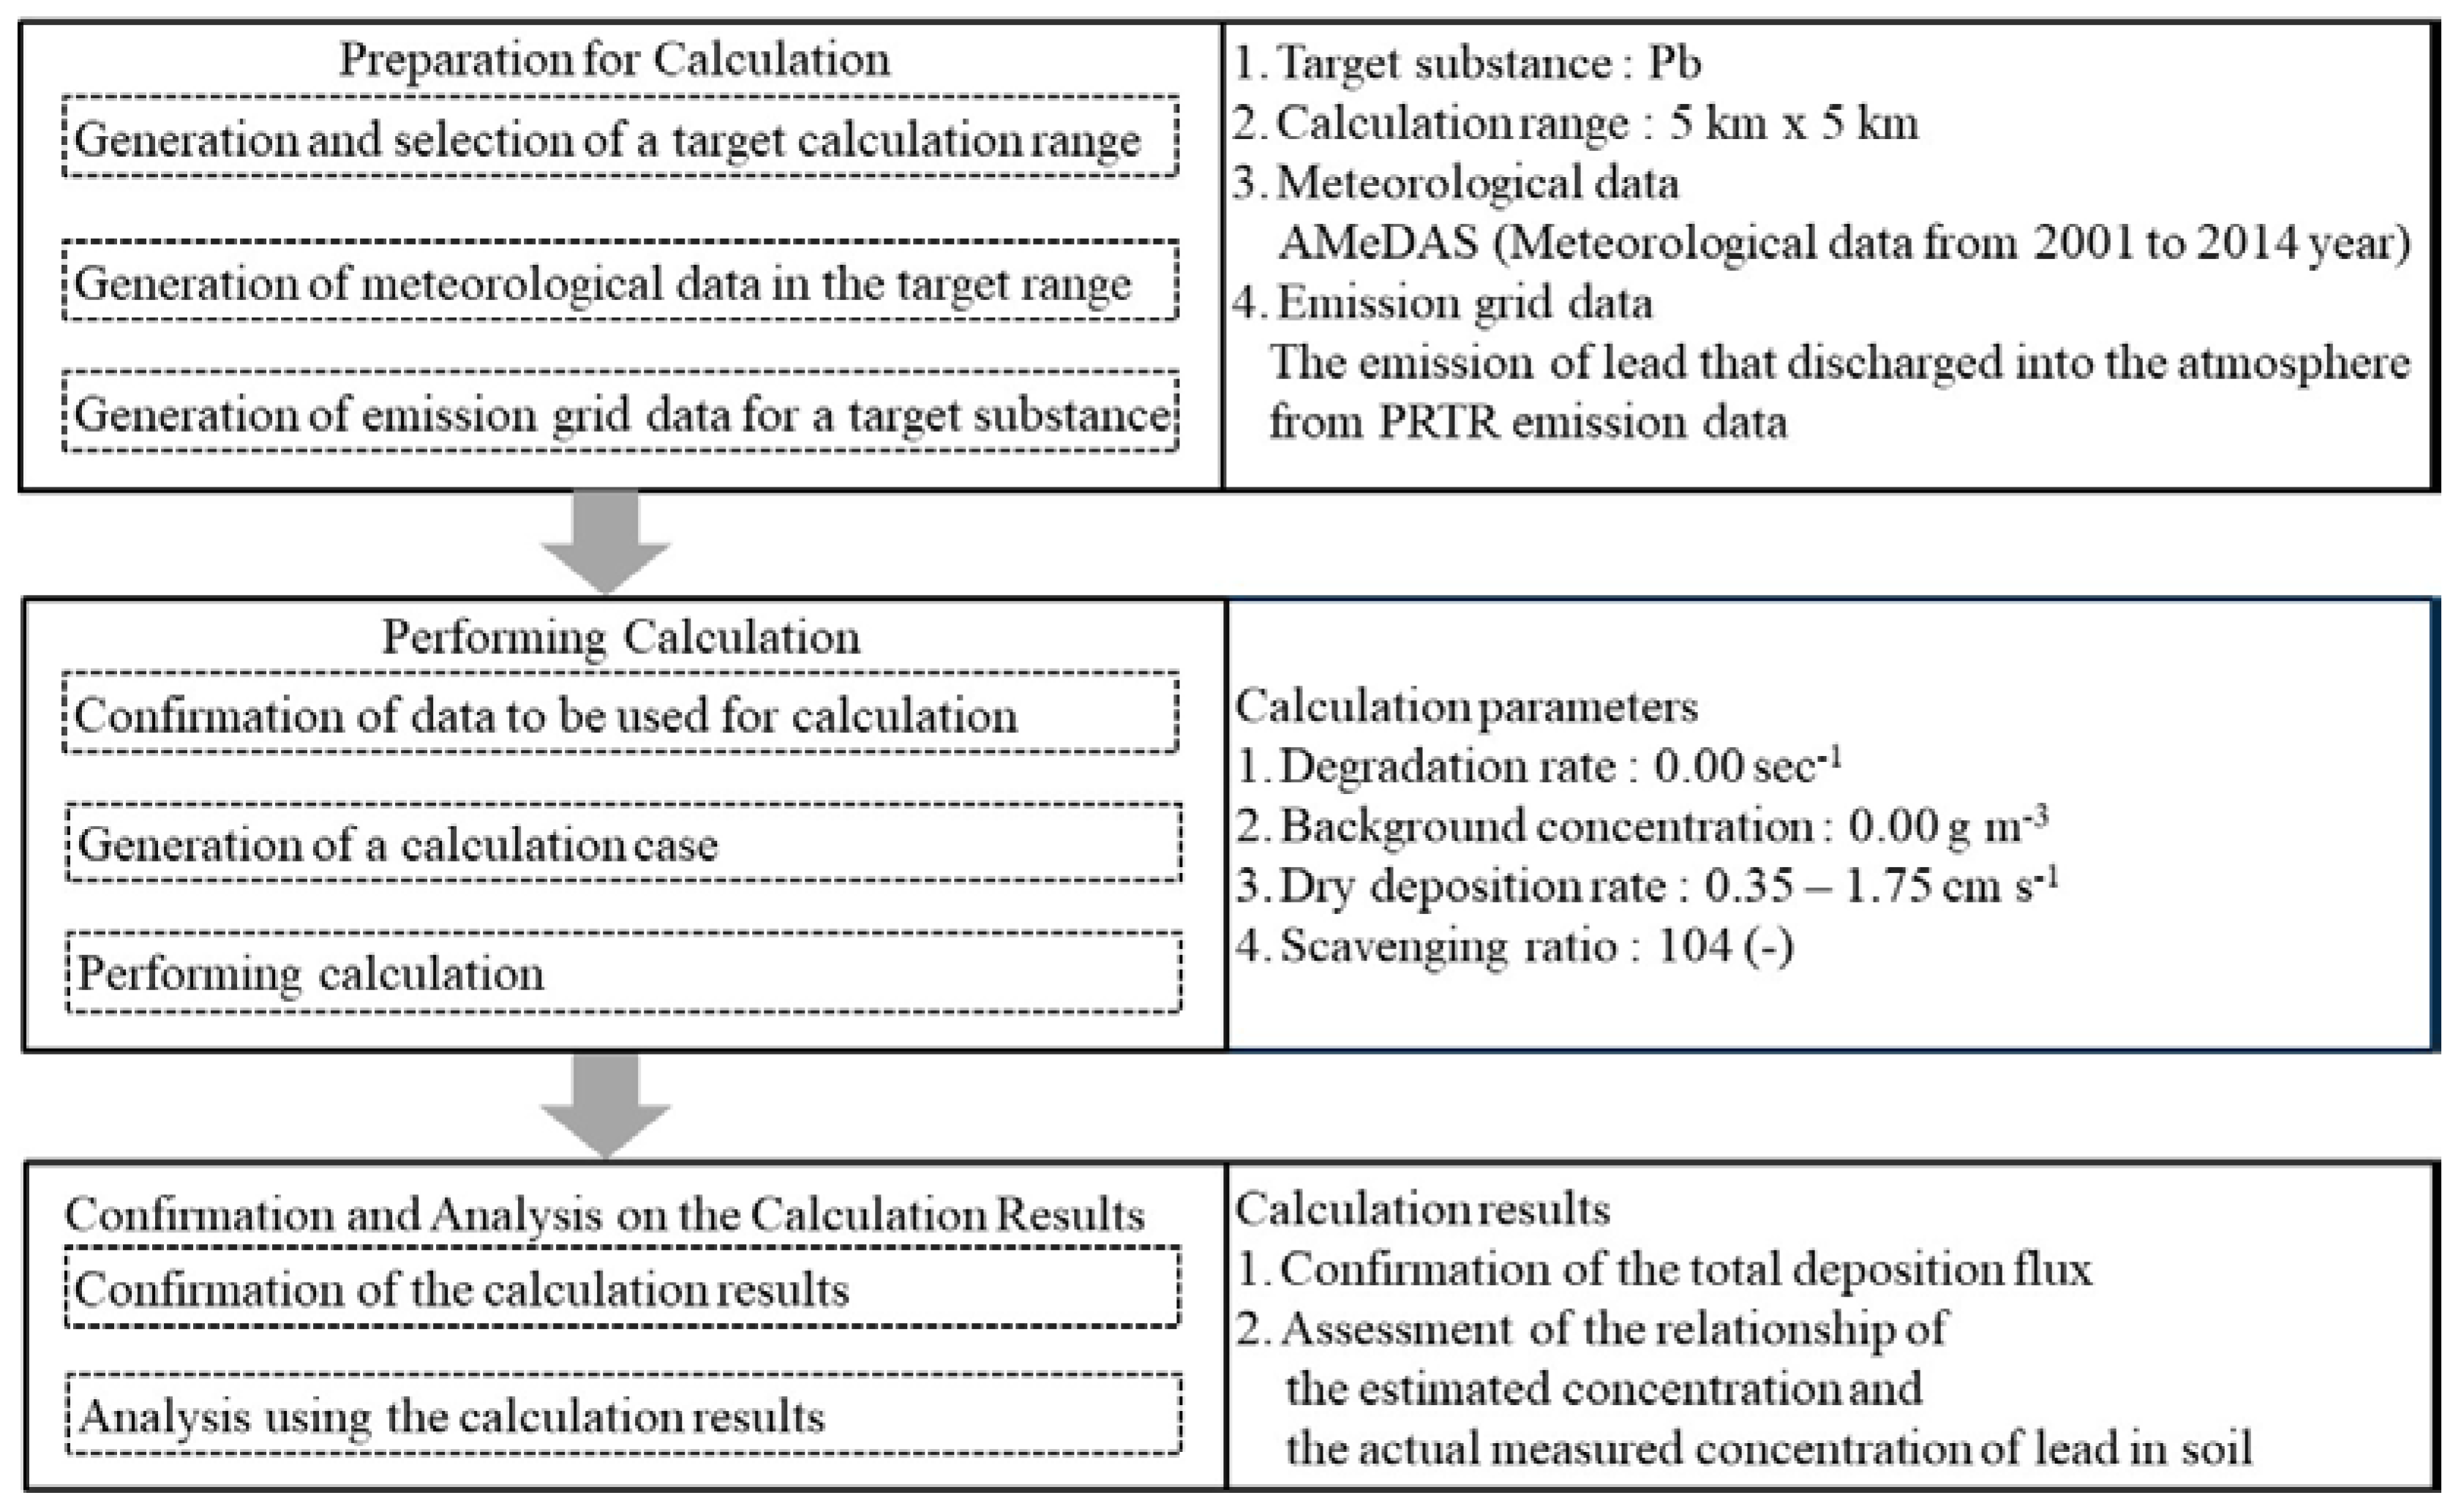
2.3. Estimation of Annual Deposition Flux Using ADMER

To determine whether atmospheric deposition is the cause of the soil’s Pb pollution, we compared the observed distribution of Pb content in the soil near the source factory with an atmospheric dispersion model’s estimated distribution of Pb deposition. In the estimation of the deposition flux, the ADMER model version 2.6.0 was used [30]. This model estimates the atmospheric concentrations of chemical substances as well as the deposition flux in surface soil at 100-m horizontal resolution. As shown in Figure 4, in order to obtain the annual atmospheric deposition flux using the ADMER model, we prepared the input data, executed a Pb deposition simulation, confirmed all calculations, and analyzed our data based on the results of the estimation. In the estimation, we used data from meteorological stations close to the sampling area, the map of the around the Pb emission site, and the PRTR on atmospheric Pb emissions. We used degradation rate, background concentration, dry deposition velocity, and scavenging ratio as input parameters in estimating Pb deposition using the ADMER model. We assumed that Pb-particles discharged from the factory did not decompose in the atmosphere under normal conditions (radioactive decay in 204Pb/205Pb/210Pb was considered to be negligible for the estimation of total Pb deposition). Thus, we set the degradation rate at zero. The background concentration was assumed to be zero because the natural concentration of Pb in the atmosphere was negligible compared to concentrations seen around the factory [31]. For example, in 2004, the annual average Pb concentration in 15 countries of the European Union ranged from 0.63 to 12.8 ng m−3 [32], and was 0.076 ng m−3 (76 pg m−3) in Antarctica [33]. In order to elucidate the influence of the source factory, we omitted background Pb aerosols from our visualizations.
Because no data on the particle size emitted from the factory were available and we could not measure the particle size of the emitted particulate Pb to analyze the ADMER model’s sensitivity, we assumed the velocity of particulate Pb dry deposition in the range of 0.35 to 1.75 cm s−1 corresponding to particle diameters of 6.1–9.5 μm [34,35]. Sakata & Marumoto [34] reported that the washout ratio for Pb species (the ratio between the wet deposition velocity and the precipitation intensity/atmospheric concentration) was in the range of 87–119; therefore, the average value of 104 was used for the estimation of Pb horizontal distribution. The ADMER model calculations were done for a five km2 area around the factory (Pb source) at 100-m horizontal resolution.

3. Results and Discussion

3.1. Lead Content in Soil

Pb concentration in the surface soil samples is shown in Figure 5. Among the samples, 20 samples (59%) had Pb concentrations exceeding Japan’s legal limit (150 mg kg−1), 8 samples had values in the range of 50–100% of the limit, and 1 sample had a concentration lower than 20% of the limit (Figure 5). Although the legal limit has been set as a vertical average over the 0–5 cm and 5–50 cm of soil depth [36], intensive surface soil (which we define as the top 2 cm of soil) pollution should be evaluated using a prognostic approach for factories operating over long periods of time. Furthermore, it was noted that a few sites were polluted despite being far from the source factory (several hundred meters away).

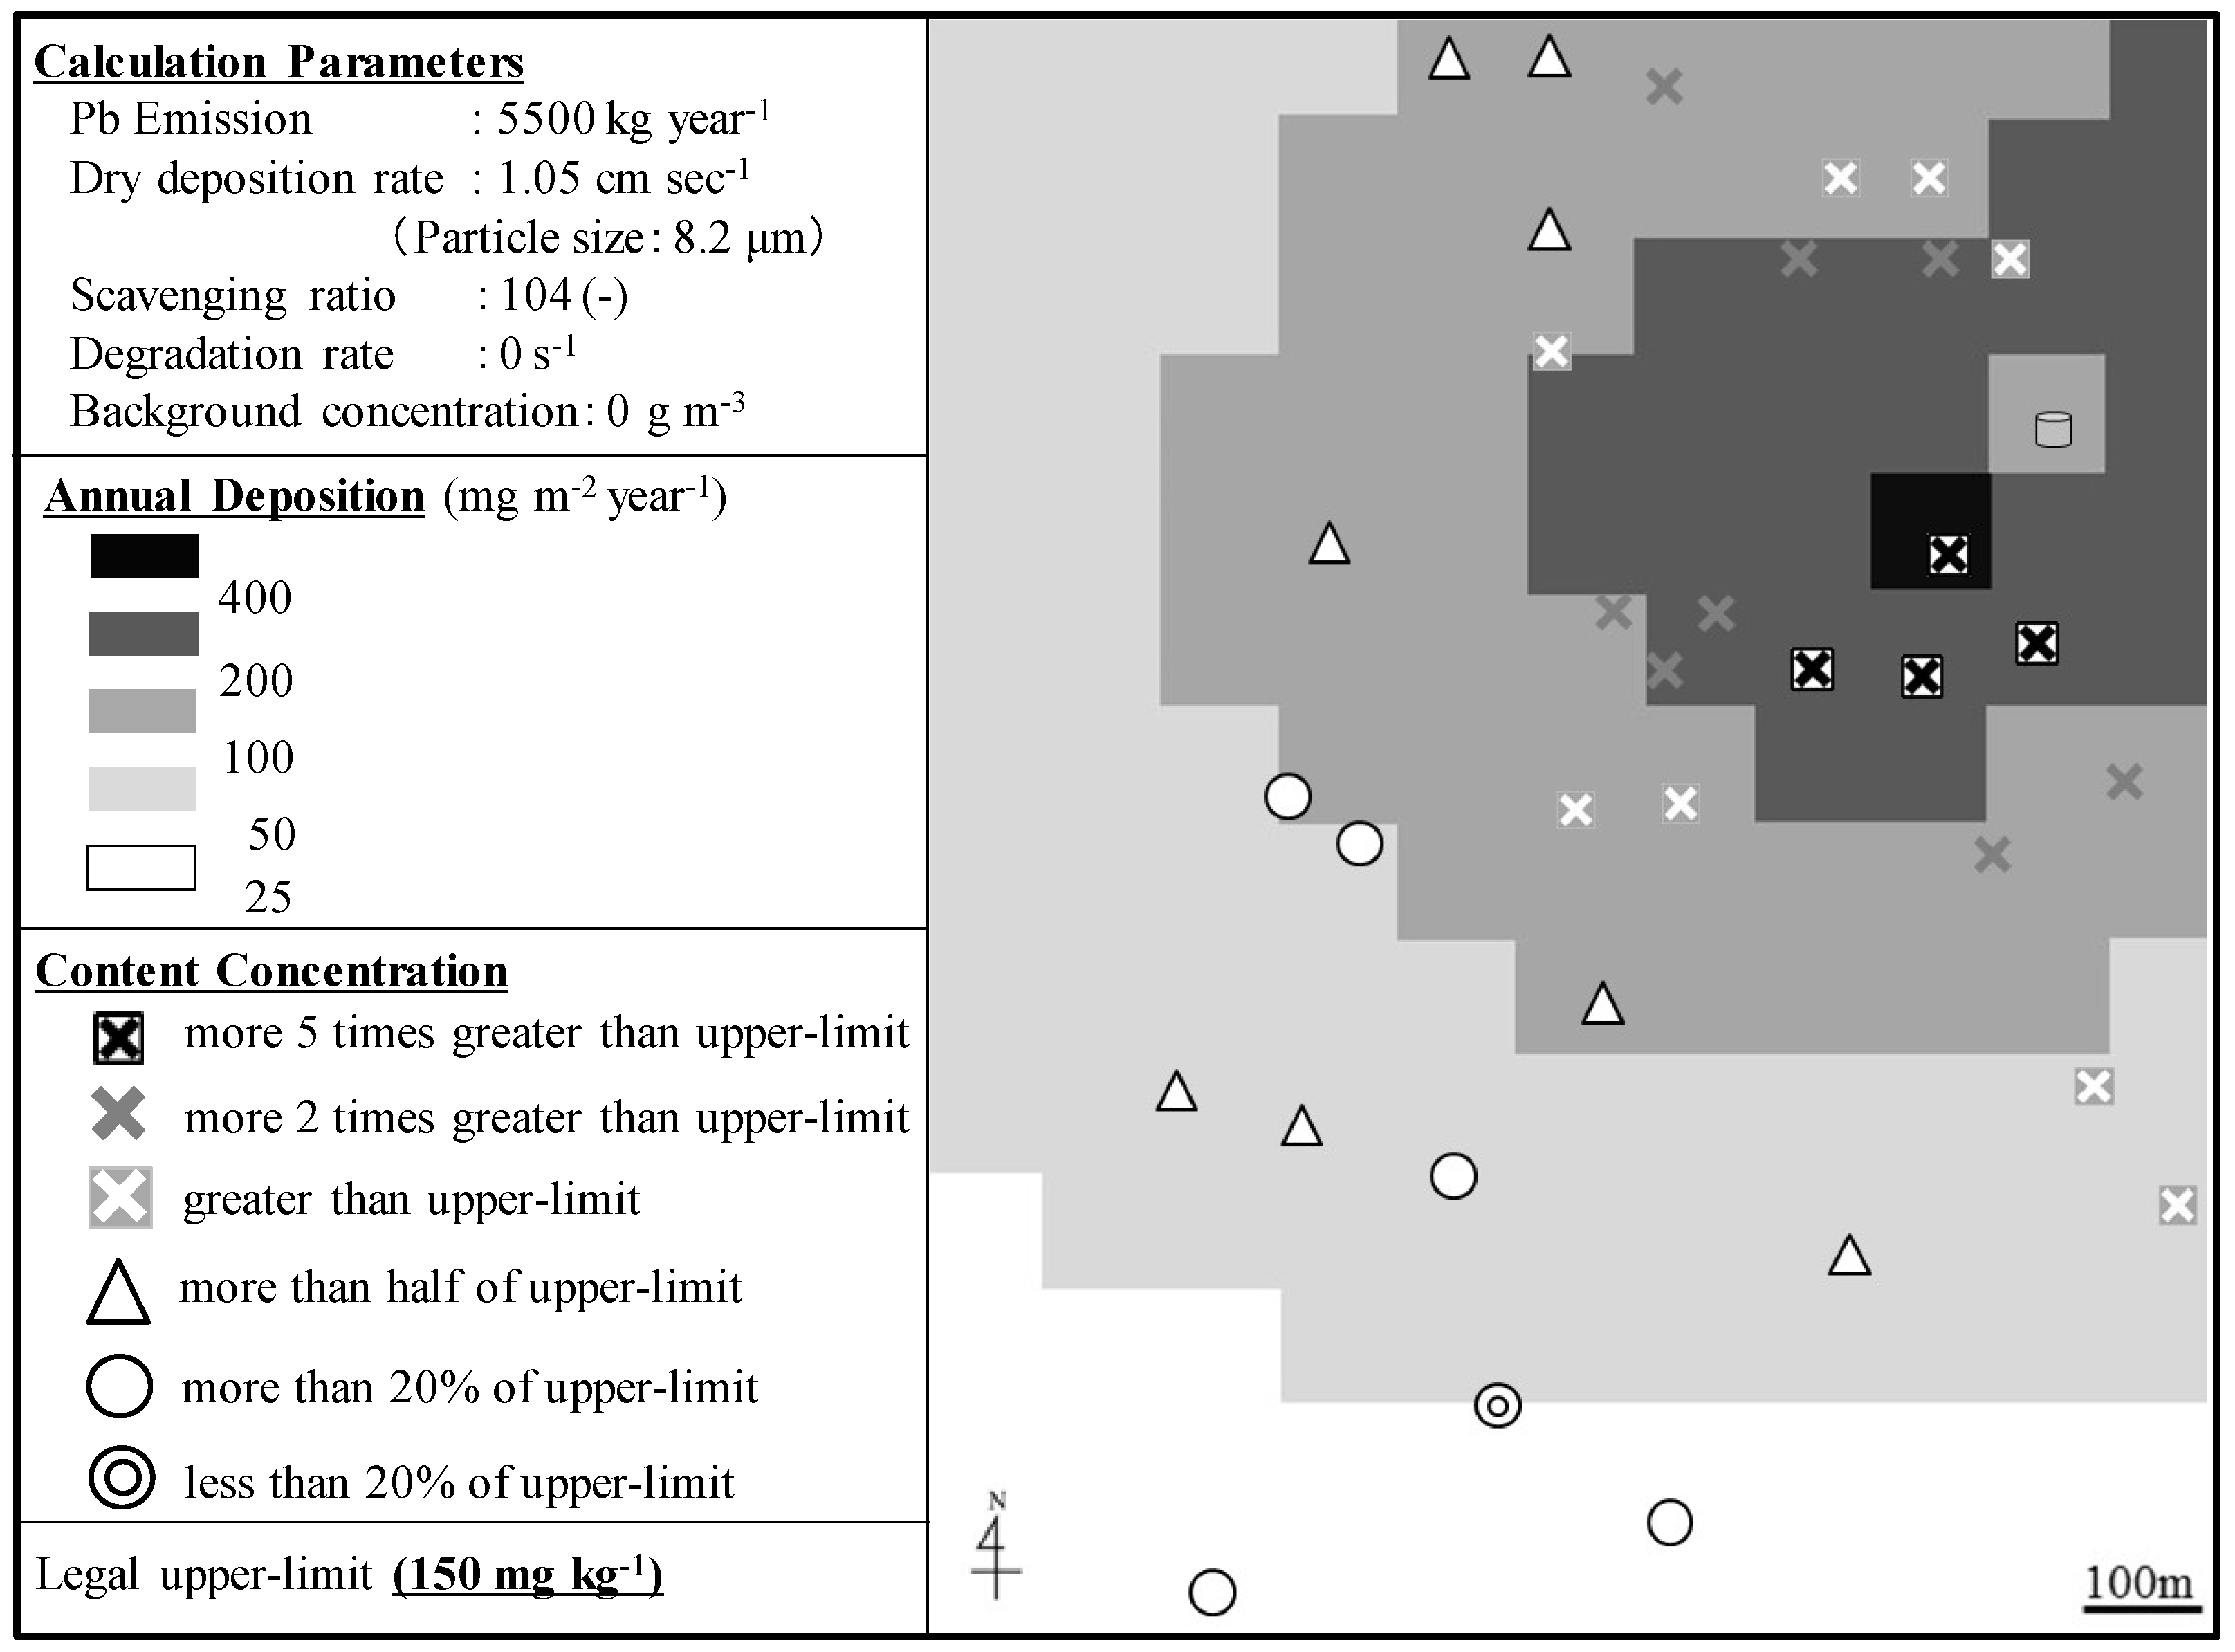
3.2. ADMER and Field Measurement Calculation Results—Comparison & Discussion

First, we compared the measured and the estimated Pb distribution with the average dry deposition velocity (1.05 cm s−1) of the reported values (0.35–1.75 cm s−1) using the ADMER model, using the PRTR data of the year with the highest Pb emission (5500 kg year−1) between 2001 and 2014 (Figure 6). Measured Pb concentration in soil and the estimated results using PRTR data from 14 consecutive years are shown in Figure 7. In most of the samples with high estimated annual deposition flux, the measured Pb concentration was also high, and both estimated and measured Pb distribution showed that Pb deposition decreased with the distance from the emission source (Figure 6 and Figure 7). Even at distances of 400 to 500 m from the source, where there a lower soil pollution could be expected, the Pb concentrations in the surface soil exceeded the legal limit, further indicating atmospheric Pb deposition. The relationship between the estimated cumulative Pb deposition flux over 14 y and the soil Pb concentration is shown in Figure 8. Measured Pb concentrations in soil is influenced by environmental factors such as soil erosion, Pb adsorption onto soil solid phases, soil pH value, salinity, and humic substances content, which control the Pb solubility and mobility in soil over time. Also PRTR data, particle size, and meteorological change influence the estimated total Pb deposition flux by over time using ADMER model (x-axis). Use of the ADMER model to estimate the total deposition flux does not take into account the factors on the y-axis. We found a quasi linear relationship in the scatter plot of measured and estimated results (Figure 8), but the deviation of the correlation coefficient value was large due to the variability of the above mentioned environmental factors regulating the Pb. In this study, we analyzed the factors that have significant impact on the estimated Pb deposition flux by using ADMER model as the following Section 3.3 and Section 3.4. The relationship between the estimated cumulative Pb deposition flux over 14 y and the soil Pb concentration at the corresponding location is shown in Figure 8. Annual climate fluctuations could explain this deviation, but other factors could be also important for the variation in Pb deposition results such as heterogeneity in the size of the Pb-containing particles, chemical reactions causing alterations in particle density or water solubility, and need further evaluation for improving simulation. In Figure 8, two separate classes corresponding to plots with large (class 1) and small (class 2) annual deposition fluxes, respectively. Most of the class 1 sites were closer to the emission source, compared with class 2 sites, and the threshold values of the Pb deposition of the two classes were ca. 200 mg m−2 year−1 flux (Figure 6). The low Pb content of soil samples taken from remote sites (class 2) could be also related to differences in particle diameter. The fixed diameter of Pb-containing particles in the calculation of dry deposition velocity was likely responsible for the difference between the measured and estimated results in the Pb distribution in the polluted sites. Further, at sampling sites 3, 23, and 26, the deposition simulation did not explain the high Pb concentrations, which could be possibly due to long-distance migration of Pb from other sources (e.g., surrounding buildings), or deposition before the registration of PRTR data.

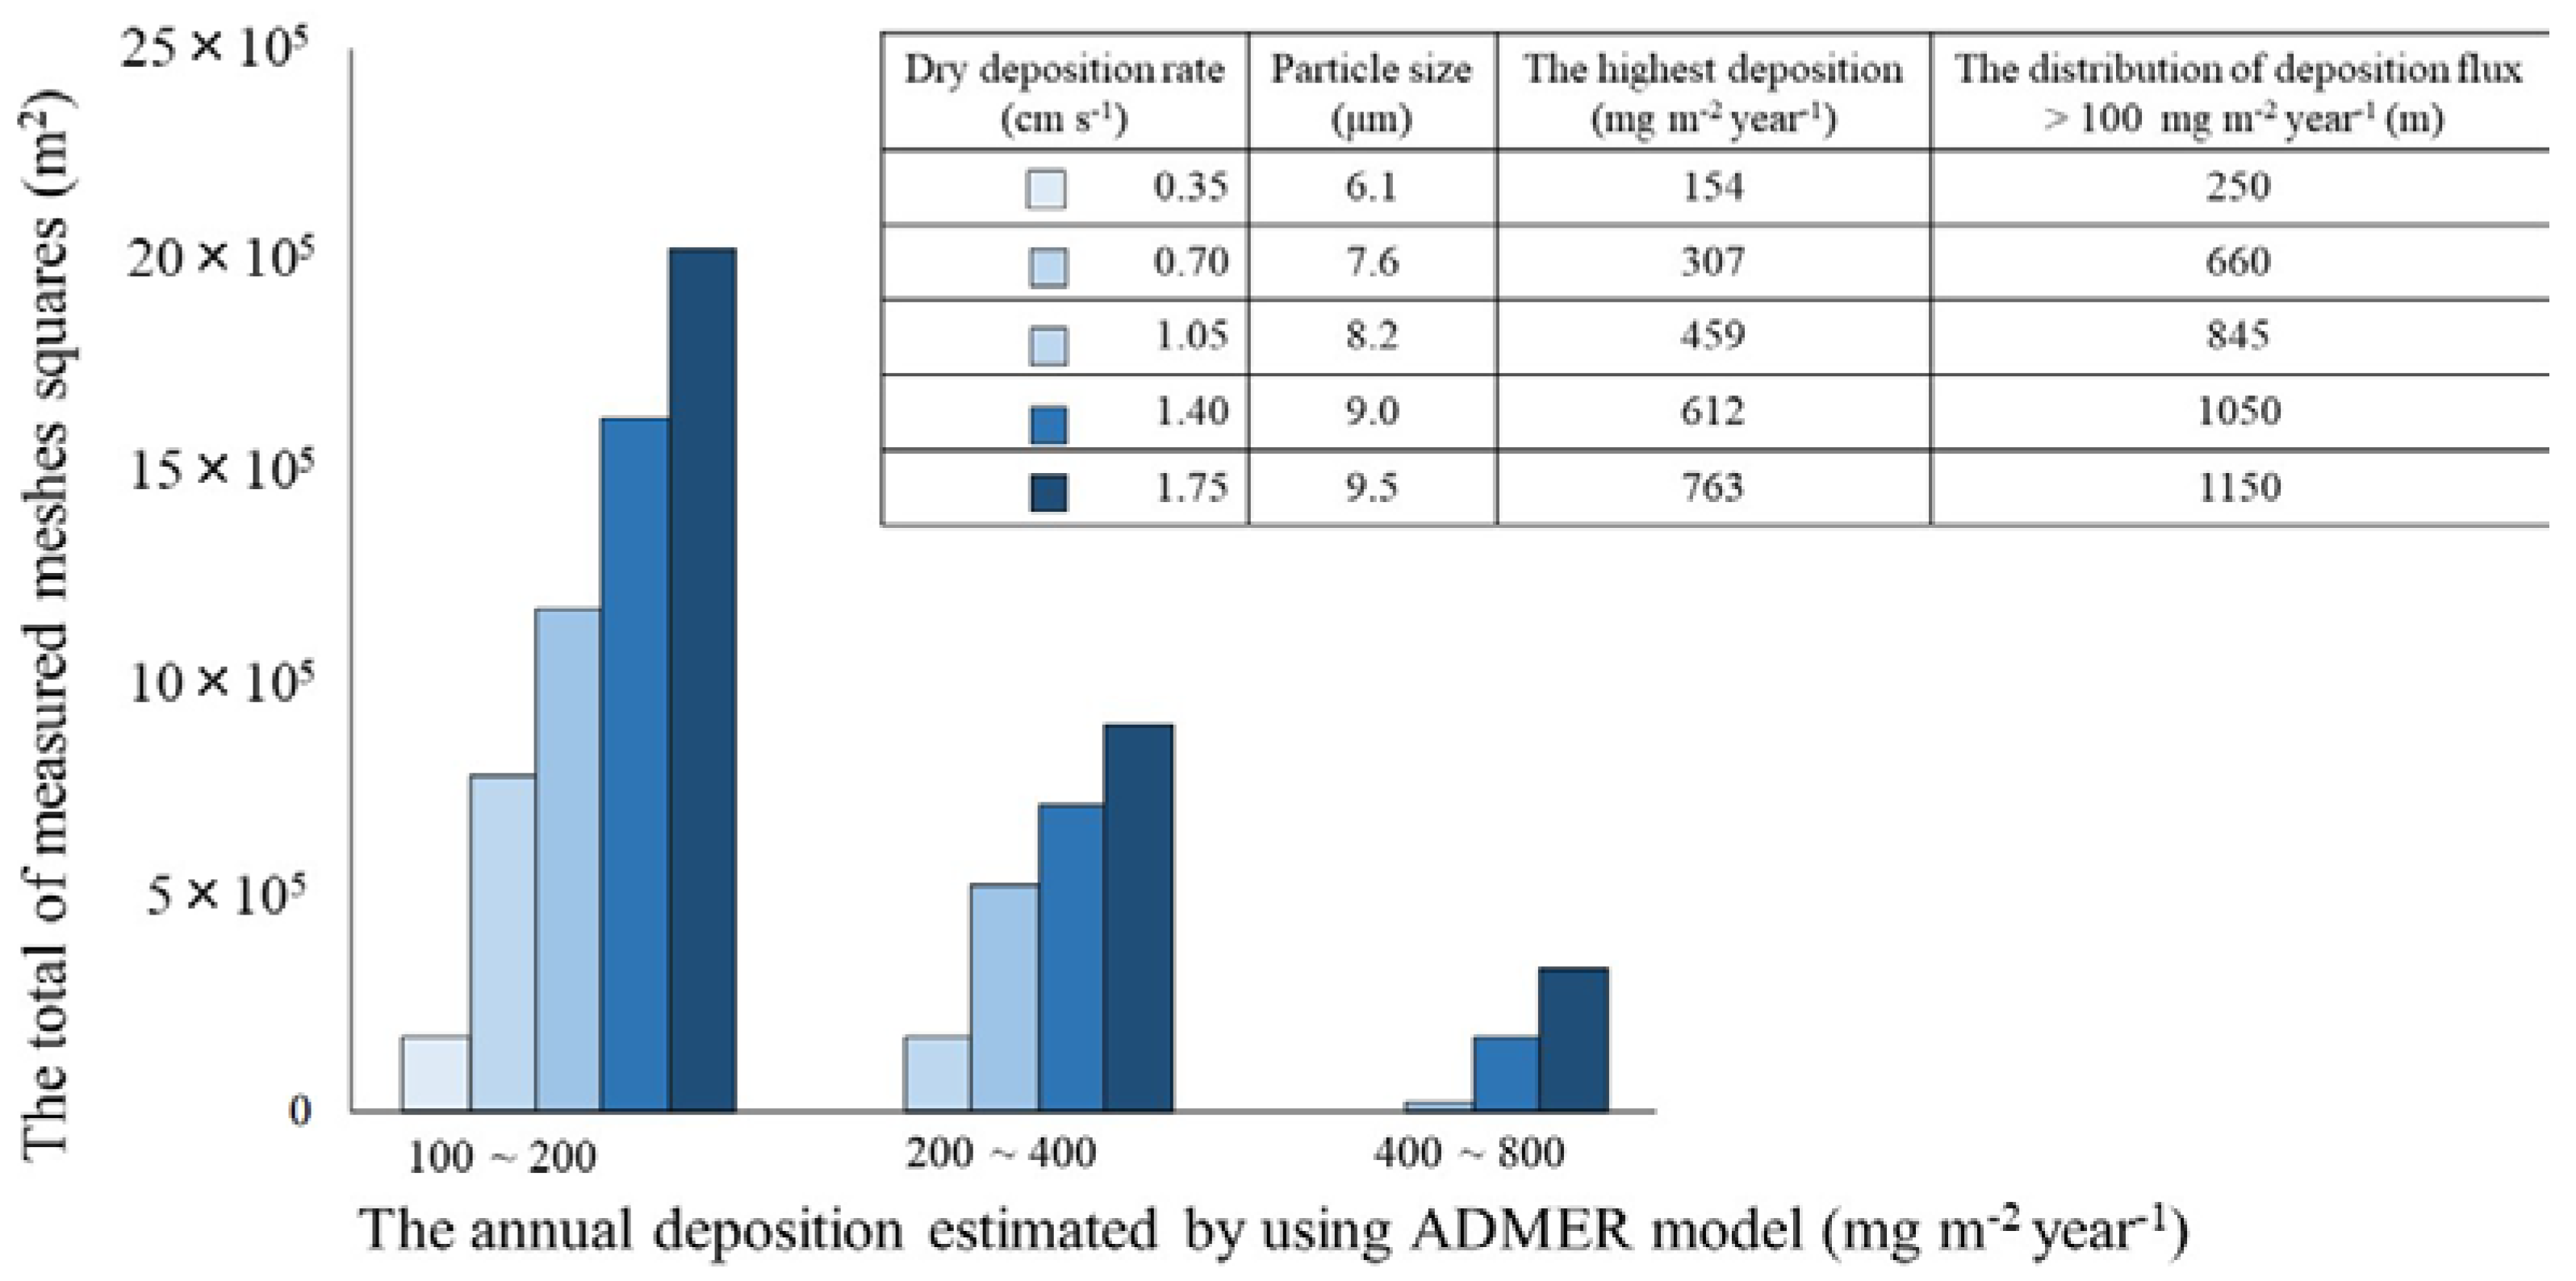
3.3. Sensitivity Analysis of Estimated Lead Deposition Flux Using Varied Dry Deposition Velocities

By considering the particle size as a significant factor that has significant impact on the variation on the x-axis of Figure 8, to determine the effect of particle size on the simulated Pb deposition results, in the estimation of Pb deposition we fixed the input data except for dry deposition velocity. We used AMeDAS and PRTR data from 2004 when the highest atmospheric Pb emission was reported (5500 kg year−1). Then we used the ADMER model to calculate the annual Pb deposition with varied particle diameters (6.1, 7.6, 8.2, 9, and 9.5 μm) at 100-m resolution. These particle diameters corresponded to dry deposition velocity rates of 0.35, 0.7, 1.05, 1.4, and 1.75 cm s−1, and the results are shown in Figure 9. Based on the results, we concluded that the larger the diameter of emitted Pb particles, the larger the expected deposition flux on the ground surface. However, the area nearest to the source (100–200 m) received the largest deposition flux, regardless of the diameter of Pb-containing particles. The estimated total deposition flux increases by approximately 5 times when the Pb particle size increases approximately 1.6 times, and furthermore, at a distance of 1 km from the emission source, this correlation did not change, regardless of the distance from the source. Although in this study the Pb particle size was a hypothetical value, the results showed that the Pb particle size has a great impact on the estimated total deposition flux but did not affect the concentration distribution. This indicated that the concentration distribution was calculated by a single particle size did not significantly affect the deviation of the distribution between the measured value and the estimated value. The present version of the ADMER model does not perform deposition calculations at resolution lower than 100 m, and therefore we may be observing effects at insufficient resolution.
As far as the horizontal distribution of Pb in soil using different particle sizes is concerned, for the same amount of total Pb emitted, the larger was the particle size of Pb aerosols, the larger was the observed numbers of mesh (a unit of 100 m2) within 1 km of the factory with a high deposition flux (Figure 10). Among highly polluted sites (deposition flux >100 mg m−2 year−1), for Pb particle diameter of 6.1 μm the polluted area extended to 250-m from the emission source. Analogously, when Pb particles had diameters of 7.6, 8.2, 9, and 9.5 μm, the highly polluted sites extended 660, 845, 1050, and 1150 m from the emission source. In the simulation, the highest deposition flux was also increased by increasing the diameter of Pb-containing particles (flux of 154, 307, 459, 612, and 763 mg m−2 year−1 for 6.1, 7.6, 8.2, 9, and 9.5 μm diameters). It was confirmed that even a minor change in the particle size of Pb particle diameter (e.g., from 6.1 to 9.5 μm, a 1.6 times increase) intensifies the Pb deposition flux (from 154 to 763 mg m−2 year−1, a 5.0 times increase). Based on these results, it is crucial to monitor deposition flux and polluted area distribution in order to optimize dry deposition velocity, which can help prevent surface soil from being polluted by Pb aerosol deposition.

3.4. Differences in Estimated Deposition due to Annual Climate Fluctuations

Meteorological data can change Pb deposition results when it deviates from averaged climate parameter values, and we investigated variations in atmospheric deposition flux due to annual climate fluctuations. To predict the range of variation in Pb deposition flux, we used the highest annual atmospheric Pb emission in recent years (5500 kg year−1). Then, we performed simulation of Pb deposition using 14 y of data from the AMeDAS database providing an estimate of annual fluctuation in the highest deposition flux at 100-m resolution. The mesh with the highest annual deposition was selected and used to evaluate the worst case of fluctuation in the deposition estimation. Figure 11 shows the annual variation in deposition flux due to climate fluctuations. The standard variation in annual deposition for the 14 years was 7.24 mg m−2 year−1, and the coefficient of variation (CV) was 5.6. Based on the results, we concluded that annual climate fluctuation data should be included in precise deposition flux estimates. Therefore, it is necessary to consider the range of fluctuation in climate data. The variation in deposition flux caused by climate fluctuation was not large in the present study, but verification of the model with a series of long-term meteorological data is necessary for other factories and regions.

4. Conclusions

The horizontal distribution of surface soil polluted with Pb around a factory can be monitored by sampling surface soils and by using the ADMER model to simulate atmospheric deposition. At sites with a high estimated annual Pb deposition flux, the measured Pb content in surface soil samples (0–2 cm depth) was also high. As the distance from the emission source increases, the deposition flux and content tended to be smaller. There was good agreement between the estimated annual deposition flux and the distribution of soil’s measured Pb content. Even at sites considered far from the Pb emission source (>400 m), where the possibility of soil pollution caused by leaking drainage water was low, the Pb content of the surface soil samples still exceeded Japan’s legal limit. Therefore, a highly mobile form of Pb, such as particulate matter could spread the Pb pollution. Based on the correlation between the measured and estimated levels of Pb pollution, sites near the emission source (<680 m from the factory) tended to have larger values for measured Pb content than estimated Pb deposition; this result was obtained using a fixed particle size in the ADMER model, but varying particle size, the larger particles are deposited faster and closer. We found that even holding Pb emissions constant, the greater the size of emitted particles, the higher the amount of Pb deposited on the soil and the larger the polluted area. Therefore, in order to prevent soil pollution due to atmospheric Pb deposition, it is essential to monitor the amount of deposition on soils, and the distribution of areas polluted with Pb-containing particles of various sizes. Lead pollution of soil is a stock type contamination, and therefore a long-term estimate of Pb deposition flux is necessary. In our long-term estimate, we evaluated annual fluctuation of the Pb deposition estimates in relation to changing meteorological data. Variations in deposition flux due to annual climate fluctuations were not significant for our case. However, the impact of climate fluctuations on deposition flux must be investigated in other factories and regions.

Acknowledgments

This work was supported by JSPS KAKENHI Grant No. 26281047.

Author Contributions

Binh Nguyen Thi Lan and Takeshi Kobayashi conceived and designed the experiments; Binh Nguyen Thi Lan performed the experiments; Binh Nguyen Thi Lan and Takeshi Kobayashi analysed the data and wrote the paper; Atsushi Suetsugu, Xiaowei Tian, and Takashi Kameya checked the paper and contributed important comments about analysis method and results.

Conflicts of Interest

The authors declare no conflict of interests.

References

  1. Japan Ministry of the Environment. Results of the Survey on the Enforcement Status of the Soil Contamination Countermeasures Act and Soil Contamination Investigations and Countermeasures in FY 2015. Available online: http://www.env.go.jp/en/headline/2331.html (accessed on 2 October 2017).
  2. Japan Ministry of Economy Trade and Industry. The Result of the Pollutant Release and Transfer Register (PRTR), 2015. Available online: http://www.env.go.jp/en/chemi/prtr/prtr.html (accessed on 2 October 2017).
  3. Urrutia-Goyes, R.; Argyraki, A.; Ornelas-Soto, N. Assessing Lead, Nickel, and Zinc Pollution in Topsoil from a Historic Shooting Range Rehabilitated into a Public Urban Park. Int. J. Environ. Res. Public Health 2017, 14, 698. [Google Scholar] [CrossRef] [PubMed]
  4. Gray, C.W.; McLaren, R.G.; Roberts, A.H.C. Atmospheric accessions of heavy metals to some New Zealand pastoral soils. Sci. Total Environ. 2003, 305, 105–115. [Google Scholar] [CrossRef]
  5. Chen, T.; Zheng, Y.; Lei, M.; Huang, Z.; Wu, H.; Chen, H.; Fan, K.; Yu, K.; Wu, X.; Tian, Q. Assessment of heavy metal pollution in surface soils of urban parks in Beijing, China. Chemosphere 2005, 60, 542–551. [Google Scholar] [CrossRef] [PubMed]
  6. United States Geological Survey. Lead in the Environment; QE516.P3L4 553′.44 76-7962; United States Government Printing Office: Washington, DC, USA, 1976.
  7. European Commission (‘DG Environment’). Science for Environment Policy; Soil Contamination: Impacts on Human Health; European Commission: Bristol, UK, 2013. [Google Scholar]
  8. Benjamin, M.M.; Leckie, J.O. Multiple-Site Adsorption of Cd, Cu, Zn, and Pb on Amorphous Iron Oxyhydroxide. J. Colloid Interface Sci. 1981, 79, 209–221. [Google Scholar] [CrossRef]
  9. Al-Khashman, O.A.; Shawabkeh, R.A. Metals distribution in soils around the cement factory in southern Jordan. Environ. Pollut. 2006, 140, 387–394. [Google Scholar] [CrossRef] [PubMed]
  10. Krishna, A.K.; Govil, P.K. Soil contamination due to heavy metals from an industrial area of Surat, Gujarat, Western India. Environ. Monit. Assess. 2007, 124, 263–275. [Google Scholar] [CrossRef] [PubMed]
  11. Soriano, A.; Pallarés, S.; Pardo, F.; Vicente, A.B.; Sanfeliu, T.; Bech, J. Deposition of heavy metals from particulate settleable matter in soils of an industrialised area. J. Geochem. Explor. 2012, 113, 36–44. [Google Scholar] [CrossRef]
  12. Qiao, P.; Lei, M.; Guo, G.; Yang, J.; Zhou, X.; Chen, T. Quantitative Analysis of the Factors Influencing Soil Heavy Metal Lateral Migration in Rainfalls Based on Geographical Detector Software: A Case Study in Huanjiang County, China. Sustainability 2017, 9, 1227. [Google Scholar] [CrossRef]
  13. Kobayashi, T.; Liu, Y.; Takahashi, Y.; Kameya, T.; Yamada, Y. The Adsorption Equilibrium of Pb and Cd on Several Soils in Various pH Solutions or in the Presence of Dissolved Humic Substances. In Heavy Metal Contamination of Soils; Springer: Berlin, Germany, 2015. [Google Scholar]
  14. Godin, P.M.; Feinberg, M.H.; Ducauze, C.J. Modelling of Soil Contamination by Airborne Lead and Cadmium around Several Emission Sources. Environ. Pollut. Ser. B 1985, 10, 97–114. [Google Scholar] [CrossRef]
  15. Steinnes, E.; Solberg, W.; Petersen, H.M.; Wren, C.D. Heavy metal pollution by long range atmospheric transport in natural soils of Southern Norway. Water Air Soil Pollut. 1989, 45, 207–218. [Google Scholar] [CrossRef]
  16. Zhang, G.; Yang, F.; Zhao, Y.; Zhao, W.; Yang, J.; Gong, Z. Historical change of heavy metals in urban soils of Nanjing, China during the past 20 centuries. Environ. Int. 2005, 31, 913–919. [Google Scholar] [CrossRef] [PubMed]
  17. Cheng, H.; Hu, Y. Lead (Pb) isotopic fingerprinting and its applications in lead pollution studies in China: A review. Environ. Pollut. 2010, 158, 1134–1146. [Google Scholar] [CrossRef] [PubMed]
  18. Hu, Y.; Liu, X.; Bai, J.; Shih, K.; Zeng, E.Y.; Cheng, H. Assessing heavy metal pollution in the surface soils of a region that had undergone three decades of intense industrialization and urbanization. Environ. Sci. Pollut. Res. Int. 2013, 20, 6150–6159. [Google Scholar] [CrossRef] [PubMed]
  19. Benson, P.; Baishiki, R. CALINE3—A Versatile Dispersion Model for Predicting Air Pollutant Levels Near Highways and Arterial Streets; FHWA/CA/TL-79/23, NTIS: PB 220842; California State Department of Transportation: Sacramento, CA, USA, 1979; p. 129.
  20. Rao, S.T.; Sistla, G.; Keenan, M.T.; Wilson, J.S. An evaluation of some commonly used highway dispersion models. J. Air Pollut. Control 1980, 30, 239–246. [Google Scholar] [CrossRef]
  21. Rao, S.T.; Keenan, M.; Sistla, G.; Samson, P. Dispersion of Pollutants near Highways—Data Analysis and Model Evaluation; EPA-600/479-011; U.S. Environmental Protection Agency: Washington, DC, USA, 1979.
  22. Brandt, J.; Christensen, J.H.; Frohn, L.M. Modelling transport and deposition of caesium and iodine from the Chernobyl accident using the DREAM model. Atmos. Chem. Phys. 2002, 2, 397–417. [Google Scholar] [CrossRef]
  23. Chino, M.; Nakayama, H.; Nagai, H.; Terada, H.; Katata, G.; Yamazawa, H. Preliminary Estimation of Release Amounts of 131I and 137Cs Accidentally Discharged from the Fukushima Daiichi Nuclear Power Plant into the Atmosphere. J. Nuclear Sci. Technol. 2011, 48, 1129–1134. [Google Scholar] [CrossRef]
  24. Higashino, H.; Inoue, K.; Mita, K.; Shinozaki, H.; Yoshikado, H. Atmospheric Dispersion Model for Exposure and Risk assessment (ADMER) development and verification of nationwide version. Environ. Manag. 2004, 40, 1242–1250. (In Japanese) [Google Scholar]
  25. Higashino, H.; Inoue, K. Development of an Atmospheric Dispersion Model for Exposure and Risk Assessment (ADMER) Ver. 3. Jpn. J. Risk Anal. 2016, 26, 41–46. [Google Scholar] [CrossRef]
  26. Higashino, H.; Mita, K.; Yoshikado, H.; Iwata, M.; Nakanishi, J. Exposure and risk assessment of 1,3-butadiene in Japan. Chem.-Biol. Interact. 2007, 166, 52–62. [Google Scholar] [CrossRef] [PubMed]
  27. Japan Ministry of Economy Trade and Industry. The Result of the Pollutant Release and Transfer Register (PRTR), 2001–2014. Available online: http://www.env.go.jp/en/chemi/prtr/prtr.html (accessed on 2 October 2017).
  28. Japan Ministry of the Environment. Environmental Quality Standards for Soil Pollution. Available online: http://www.env.go.jp/en/water/index.html (accessed on 2 October 2017).
  29. The Lead Content in the Soil Was Measured by the Japan Ministry of the Environment, Notification N.19, 2004. (In Japanese). Available online: http://www.env.go.jp/hourei/06/000029.html (accessed on 2 October 2017).
  30. Higashino, H.; Kitabayashi, K.; Inoue, K.; Mita, K.; Yonezawa, Y. Development of an atmospheric dispersion model for exposure and risk assessment (AIST–ADMER). J. Jpn. Soc. Atmos. Environ. 2003, 38, 100–115. [Google Scholar] [CrossRef]
  31. Maenhaut, W.; Zoller, W.H.; Duce, R.A.; Hoffman, G.L. Concentration and size distribution of particulate trace elements in the south polar atmosphere. J. Geophys. Res. 1979, 84, 2421–2431. [Google Scholar] [CrossRef]
  32. European Monitoring and Evaluation Programme (EMEP). Heavy Metals and POP Measurements, 2004; Norwegian Institute for Air Research: Kjeller, Norway, 2006; p. 20. [Google Scholar]
  33. Yoshinaga, J. Lead in the Japanese living environment. Environ. Health Prev. Med. 2012, 17, 433–443. [Google Scholar] [CrossRef] [PubMed]
  34. Sakata, M.; Marumoto, K. Dry deposition fluxes and deposition velocities of trace metals in the Tokyo Metropolitan Area Measured with a Water Surface Sampler. Environ. Sci. Technol. 2004, 38, 2190–2197. [Google Scholar] [CrossRef] [PubMed]
  35. Noll, K.E.; Fang, K.Y.P. Development of a Dry deposition model for atmosphere coarse paticles. Atmos. Environ. 1967, 23, 585–594. [Google Scholar] [CrossRef]
  36. Japan Ministry of the Environment. Soil Contamination Countermeasures. Available online: http://www.env.go.jp/en/water/soil/contami_cm.pdf (accessed on 2 October 2017).
Figure 1. Processes included in the estimation of deposition flux.
Sustainability 10 00720 g001
Figure 2. The location of soil sampling sites around industrial park.
Sustainability 10 00720 g002
Figure 3. Method for measuring Pb content.
Sustainability 10 00720 g003
Figure 4. The general flow of the ADMER analysis process.
Sustainability 10 00720 g004
Figure 5. Pb content of surface soil samples.
Sustainability 10 00720 g005
Figure 6. Results of soil’s measured Pb content and annual estimated deposition flux.
Sustainability 10 00720 g006
Figure 7. Results of soil’s measured Pb content and estimated deposition flux over 14 years.
Sustainability 10 00720 g007
Figure 8. The relationship between total deposition flux and soil’s measured Pb content.
Sustainability 10 00720 g008
Figure 9. Estimated deposition flux at sites various distances from the emission source.
Sustainability 10 00720 g009
Figure 10. The distribution of meshes with a high deposition flux by particle size.
Sustainability 10 00720 g010
Figure 11. Annual variation of deposition flux due to climate fluctuation.
Sustainability 10 00720 g011

