Article

Exergoecology Assessment of Mineral Exports from Latin America: Beyond a Tonnage Perspective

1
Departamento de Ingeniería Mecánica, Escuela Politécnica Nacional, Ladrón de Guevara E11·253, P.O.·Box 17-01-2759, Quito, Ecuador
2
Research Centre for Energy Resources and Consumption (CIRCE), Universidad de Zaragoza, Calle Mariano Esquillor Gómez, 15, 50018 Zaragoza, Spain
*
Author to whom correspondence should be addressed.
Sustainability 2018, 10(3), 723; https://doi.org/10.3390/su10030723
Submission received: 27 November 2017 / Revised: 28 February 2018 / Accepted: 3 March 2018 / Published: 6 March 2018
(This article belongs to the Special Issue Sustainability in the Mining, Minerals and Energy Industries)

Abstract

:
Latin America has traditionally been a raw material supplier since colonial times. In this paper, we analyze mineral exports from an exergoecology perspective from twenty countries in Latin American (LA-20). We apply material flow analysis (MFA) principles along with the concept of the exergy replacement cost (ERC), which considers both quantity and thermodynamic quality of minerals, reflecting their scarcity in the crust. ERC determines the energy that would be required to recover minerals to their original conditions in the mines once they have been totally dispersed into the Earth’s crust, with prevailing technology. Using ERC has helped us identify the importance of certain traded minerals that could be overlooked in a traditional MFA based on a mass basis only. Our method has enabled us to determine mineral balance, both in mass (tonnes) and in ERC terms (Mtoe). Using indicators, both in mass and ERC, we have assessed the self-sufficiency and dependency of the region. We have also analyzed the mineral exports flows from Latin America for 2013. Results show that half of the mineral production from LA-20 was mainly exported. High-quality minerals, such as, gold, silver, and aluminum were largely exported to China and the United States. Extraction of high-quality minerals also implies higher losses of natural stock and environmental overburdens in the region.

1. Introduction

Since colonial times, Latin America has traditionally been an exporter of raw materials [1]. Before World War I, the region was the main supplier of primary products in the world [2], and was also a significant supplier of primary products to foster the industrial revolution in Western European countries [3]. In recent years, the region has also been a key supplier of raw materials for China’s booming society [4,5,6]. Nowadays, the region is characterized for its importance in the global market. In 2014, exports of fossil fuels and mining products from South and Central America to Asia, North America, and Europe accounted for $89, $77, and $37 billion USD, respectively [7].
A useful way to study flows and patterns of resource use across regions is through Material Flow Analysis (MFA) [8]. Indeed, MFA offers a complete and systematic description of a specified system to support policymakers [9]. It provides data regarding the extraction and trade of materials, hence offering useful information for the establishment of sustainable schemes [10,11,12,13,14]. Moreover, this approach has been used to show the dependence of a region on mineral imports. To that end, Schaffartzik et al. [12] analyzed patterns and trends of materials extraction, trade, and consumption of 177 countries in the world, which were grouped in six regions, from 1950 to 2010. They stated the importance of Latin America and the Caribbean as metal producers, especially for copper, silver, tin, and iron, supplying 12% of world’s metal demand. Other prominent studies have analyzed material flows focusing only on Latin America. For instance, country-specific MFA were undertaken by Vexler et al. for Chile [15], by Perez-Rincon for Colombia [16], by Vallejo for Ecuador [17], Tanimoto et al. for Brazil [4], and Walter et al. for Argentina [18].
On a multi-country perspective, in 2007 a report published by the United Nations Environmental Programme (UNEP) on material flows and resource productivity, analyzed ten countries of South America and the Caribbean: Argentina, Plurinational State of Bolivia, Brazil, Chile, Colombia, Ecuador, Guatemala, Mexico, Peru, and the Bolivarian Republic of Venezuela [19]. The main conclusion of this study was that growth in demand of resources of other regions can have effects on Latin America’s material flows. Thus, MFA for Latin America are crucial in a globalized economy.
In another study, Russi et al. [20] analyzed the consequences of neoliberal economic reforms on natural resources of Chile, Ecuador, Mexico, and Peru through MFA from 1980 to 2000. This study demonstrated that domestic material extraction had increased in these four countries as a consequence of economic reforms. In a similar way, West and Schandl [21] analyzed material use and efficiency in 22 countries in Latin America and the Caribbean. Material flows from 1970 to 2008 were studied, and a remarkable conclusion was that these countries were less efficient in gaining economic profit by means of selling their natural resources. A similar conclusion was made in the study by Giljum and Eisenmenger [22], which observed “an unequal environmental distribution” at global level between the distribution of environmental goods and environmental burdens between the North and the South. The North, such as the European Union [23], which is mostly resource dependent on southern countries, sells high-value products to the South, while leaving the negative environmental impacts that are associated to raw material extraction in the South [22].
It is a fact that mining activities can result in important environmental damages. Web platforms, such as the Environmental Justice Atlas [24] and information by Bottaro and Sola-Alvarez [25], give an overview of the effects on the environment caused by mining activities in Latin America. The Observatory of mining conflicts in Latin America (OCMAL) reported in its database 229 conflicts, most of them in Peru, Mexico, Chile, and Argentina [26]. More specifically, problems that are related to water usage in mining were analyzed by Aitken et al. [27] in the north of Chile. Himley [28] in turn, raises questions regarding sustainable development and the role of large-scale mining industries through a study in a gold mine in Peru.
Neither environmental damages nor the loss of natural stock caused by mining activities are reflected in conventional MFA, which are commonly made using tonnage as the unit of measure. M, a tonnage-based assessment leaves out the quality of commodities. To overcome this issue, the loss of natural stock can be quantitatively analyzed through an indicator based on the Second Law of Thermodynamics, called exergy replacement costs (ERC) [29,30]. As it will be explained in the methodology section, using ERC instead of tonnage we can assign a greater value to scarcer and difficult to obtain minerals thereby avoiding the problem of “adding apples with oranges”. Note that this same study could be done on a monetary basis. Nevertheless, prices rarely take into account the physical reality of minerals, such as geological scarcity. They are volatile by nature since they are subject to market fluctuations [31].
Thus, to have an order of magnitude for the loss of natural stock in Latin America due to mineral extraction, and to identify where such valuable minerals ended up, this paper undertakes a material flow analysis (MFA) based on the Second Law of Thermodynamics. A total of 20 countries in Latin America have been analyzed: Argentina, Bolivia, Brazil, Chile, Colombia, Costa Rica, Cuba, Dominican Republic, Ecuador, El Salvador, Guatemala, Honduras, Mexico, Nicaragua, Panama, Paraguay, Peru, Uruguay, Venezuela, and Haiti (hereafter LA-20). For this purpose, the mineral balance for LA-20 was examined, using indicators that can help evaluate the self-sufficiency or dependency of the region and evaluating exports by destination. With the mineral balance, both in mass and ERC terms, mineral production from 1995 to 2013 was assessed and differences between both approaches were explored. Mineral exports by destination were examined for a particular year to see which countries benefit from the natural stock loss of LA-20. To that end, we have followed the exergoecology method proposed by Valero et al. [32] and guidelines of investigations published by Calvo et al. [33,34,35] and Carmona et al. [36]. In these studies, the ERC concept was used to develop a MFA for European countries (EU-28) and for Colombia in 2011. Alongside these studies, we seek to demonstrate that considering the thermodynamic quality of minerals through ERC would further improve the potential of MFA, especially when dealing with non-fuel minerals. The final aim is to contribute to a deeper discussion on the search for sustainable paths on mineral production in Latin America.

2. Methodology

2.1. Research Framework

Exergy has been traditionally used to measure any energy source, and is defined as the minimum amount of work that may be theoretically performed by bringing a system into equilibrium with its surrounding environment. It is a property of a system-environment combination and is helpful in recognizing and evaluating consumption of non-renewable resources, especially fuel minerals [37,38,39]. The exergy content of fuel minerals is associated to their chemical composition and can be approximated with no significant error to their High Heating Value (HHV), which can be obtained from [40]. Yet, non-fuel minerals cannot be evaluated using this same approach as they are not combustible. This is why non-fuel resources have been traditionally assessed through their chemical exergy content. The latter, in turn, can be obtained from the Gibbs free energy of the given substance Δ G f , i and the chemical exergy of the elements that form the substance, as expressed in Equation (1):
b c h i = Δ G f , i + j n j , i × b c h , j
where bchj is the standard chemical exergy of the elements nj,i that compose substance i. Gibbs free energy indicates the thermodynamic potential available for usage until a system reaches chemical equilibrium at a constant pressure and temperature [41,42]. Commonly, the chemical exergy of the elements is usually taken from the values obtained by Szargut [43] and the Gibbs free energy can be obtained from chemical databases, or, alternatively, estimated with different calculation procedures [44,45].
This way of assessing the exergy of substances, including mineral resources, has been used by different authors including Szargut et al. [33,46,47], Ayres [48], or Dewulf et al. [49]. Yet, as demonstrated by Domínguez et al. [50], assessing minerals solely with chemical exergy disregards important aspects that make minerals valuable. As an example, the chemical exergy of precious metal gold is 60 kJ/mol, whereas that of aluminum is 796 kJ/mol. In this respect, exergoecology has been established for the evaluation of natural resources and one division of this discipline is Physical Geonomics, which investigates how the exergy concept can be applied to the assessment of non-fuel minerals. In addition to the chemical exergy, minerals have an important physical feature that makes them valuable, mainly their relative concentration in the crust. The fact of having minerals concentrated in mines and not dispersed throughout the crust represents a “free bonus” provided by Nature, which allows for significantly reducing the costs that are associated with mining. When mines become depleted, this free bonus is reduced, meaning that more energy is required to extract the same amount of metal. Such a bonus can be assimilated to a hidden or avoided cost that can be quantified through the so-called exergy replacement costs (ERC). These are defined as the exergy costs that would be needed to extract and concentrate a mineral from a completely dispersed state to the conditions of concentration and composition found in the mine using prevailing technology. ERC values are, thus, related to the scarcity degree of a given mineral, which can be reflected through the concentration exergy (bci), as calculated with Equation (2).
b c i = R T 0 [ l n x i + ( 1 x i ) x i ] l n ( 1 x i )
where bci represents the minimum theoretical work, exergy, which required to concentrate a substance i from an ideal mixture of two components; xi can be either the average concentration in the mines measured in g/g (xm) or the concentration in the Earth’s crust (xc); R is the gas constant (8.314 J/molK); and, T0 is the absolute reference temperature (298.15 K).
The exergy (Δbc) associated to the concentration of minerals from a dispersed state in the crust to that in a given mineral deposit is determined by the concentration exergy when xi = xc and when xi = xm, thus Equation (3).
Δ b c ( x c x m ) = b c ( x i = x c ) b c ( x i = x m )
Since exergy only reports minimum values and man-made technology is very far removed from reversibility, we need to resort to exergy costs. Accordingly, the so-called exergy replacement costs (B*) are computed with Equation (4):
B * = k × Δ b c ( x c x m )
where variable k is a dimensionless constant called unit exergy cost. It is the ratio between: (a) the real cumulative exergy required to accomplish the process of concentrating the mineral from the ore grade xm to the commercial grade xr and (b) the minimum thermodynamic exergy required to accomplish the same process Δ b c ( x m x r ) [30]. An implicit assumption in the methodology is, thus, that the same technology applies for concentrating a mineral from xm to xr as from xc to xm.
The aforementioned methodology is used to calculate the exergy replacement costs of the main mineral commodities that are currently used by industry on a global basis. It should be noted that for obtaining the global ERC of minerals, it is assumed that each commodity (i.e., copper) is obtained from a single type of ore (i.e., chalcopyrite). For each mineral, the average global ore grades were considered (xm), mainly obtained from Cox and Singer [51], as well as the average energy values of state-of-the-art technologies in mining and beneficiation. The depleted ore grade (xc) was obtained through a model of dispersed Earth, called Thanatia [29]. Thanatia comes from the Greek Thanatos that means death. In our perspective, Thanatia is a baseline for the exergy assessment of mineral resources and represents an idealization of the planet when all of the fossil fuels have been burned and all minerals have been totally dispersed into the continental crust [29,52]. Thanatia’s crust is composed of the 300 most abundant minerals at average crustal concentrations [29]. Once exergy replacement costs of minerals are obtained (i.e., for chalcopyrite), those of the element (i.e., for Cu) are calculated through their corresponding molecular weights.
One key aspect that differentiates exergy replacement costs (ERC) from other thermodynamic properties is that ERC considers the scarcity degree of the commodities in the crust and the energy required to extract them. When a mineral is scarcer and its extraction and beneficiation processes are more difficult, its ERC value becomes higher. This is why, contrarily to what happens when only chemical exergy is used for the assessment, precious metals, such as gold and silver, exhibit higher values of ERC than more abundant ones, such as iron or limestone. Higher values of ERC thus represent a higher quality of minerals and would also mean a higher loss of the natural stock in a region if these become depleted.
These values have been taken from Valero et al. [40]. Due to the number of minerals that are considered in the current study, only selected ERC values of minerals have been listed in Table 1.
All the ERC values of minerals considered in the current study can be seen in Appendix A, but a complete list of all minerals with their corresponding ERC values can be found in [53].

2.2. Data Compilation

With the aforementioned methodology, the mineral balance of LA-20 from 1995 to 2013 was analyzed, taking into consideration several indicators that can be used to evaluate self-sufficiency or dependency of the region. Exports by destinations for 2013 were also analyzed. In all of the cases, 2013 was used as the last year analyzed as it was the most recent year for which there was information available for all LA-20 countries.
A total of 38 non-fuel minerals were considered in this paper: aluminum, antimony, barite, beryllium, bismuth, cadmium, chromium, cobalt, copper, fluorite, gold, graphite, gypsum, iron, lead, limestone, lithium, magnesite, manganese, mercury, molybdenum, nickel, niobium, platinum group metals (PGM), phosphate rock, potash, rare earth elements (REE), salt, selenium, silver, tantalum, tin, titanium, vanadium, wolfram, zinc, and zirconium. Additionally, fossil fuels were included in the study (oil, natural gas and coal).
The information needed for this study (extraction, imports, and exports) was gathered from different data sources for the 20 countries under study. Only data regarding bulk mineral production, imports, and exports were included, thus excluding semi-manufactured products, such as steel. This means that if a country extracts iron but exports steel, only iron was taken into account in the MFA. As suggested in economy-wide material flow accounts (EW-MFA) guidelines [55], the primary source of information was national databases and national agencies of each country. Brazil’s mineral production, imports, and exports data were gathered from the Departamento Nacional de Produção Mineral [56]. Chilean mineral production was obtained from Servicio Nacional de Geología y Minería [57], imports and exports from Comisión Chilena del Cobre [58]. Production, exports, and imports of Colombia were retrieved from Sistema de Información Minero Colombiano [59]. Ecuador’s mineral production was compiled from Agencia de Regulación y Control Minero [60], while exports and imports information from Banco Central del Ecuador [61]. Production, imports, and exports of Peru were provided by the Ministerio de Energía y Minas [62]. It was not possible to collect direct data from local agencies for Argentina, Costa Rica, Cuba, Dominican Republic, El Salvador, Guatemala, Honduras, Nicaragua, Panama, Paraguay, Uruguay, and Venezuela. Instead, mineral trade data of these countries were collected from British Geological Survey database [63], Economic Commission for Latin America and the Caribbean (ECLAC) [64] and the United Nations International Trade Statistics Database (UN Comtrade) [65]. The disaggregation level corresponding to mineral exports and imports was five digits (UN Comtrade license). To avoid double accounting, this database allows for treating a selected region, in our case, LA-20, as a single unit, therefore not taking into account exports and imports between each LA-20 country. For completing gaps and for cross-checking purposes, reports of the U.S. Geological Service [66] were also consulted. Due to the lack of information for Haiti in 2013, it was not possible to include it in the assessment of exports by destination and material flow indicators. Regarding fossil fuels, all production, imports, and exports values were gathered from the Latin American Organization of Energy (OLADE) databases [67].
ERC is expressed in GJ per tonne of element, hence all mineral information expressed in metal content was taken from these data sources. This information was then converted into exergy terms by means of the ERC and different indicators were calculated. One of the indicators that was used in the study is domestic material consumption (DMC), defined as the amount of physical minerals that are consumed inside one region. Hence, DMC is calculated as the sum of minerals that are produced in the region (domestic extraction = DE) plus imports (I) minus exports (E). The term consumption in this paper refers to apparent consumption and not final consumption (i.e., goods are excluded for the analysis). Goods are not considered in this analysis for two reasons: first, because of important information gaps regarding semi-manufactured products exported and imported in the analyzed countries; and second, because this same approach was used in Calvo et al. [35] for EU-28, and so the results can be compared. These indicators were calculated both in mass and ERC. Subsequently, using this information, different ratios of domestic extraction (DE/DMC), imports (I/DMC), and exports (E/DMC) were obtained. The usefulness of these ratios is that they can provide information about the dependency and self-sufficiency of a region [35].

3. Results and Analysis

Results of the study are separated into three sections. First, the evolution of mineral production of LA-20 from 1995 to 2013 is analyzed using both mass terms (tonnes) and ERC terms (Mtoe). Additionally, Sankey diagrams are used to represent the mineral trade in 2013 of three selected countries (Brazil, Chile, and Mexico) both in mass and ERC. Then, ratios that show the dependency or self-sufficiency of the region are calculated for 2013. Last, the destinations of the exports of materials produced in LA-20 are studied to have a better knowledge of which countries are relegating in LA-20 the environmental burden associated to the mining industry.

3.1. Mineral Balance

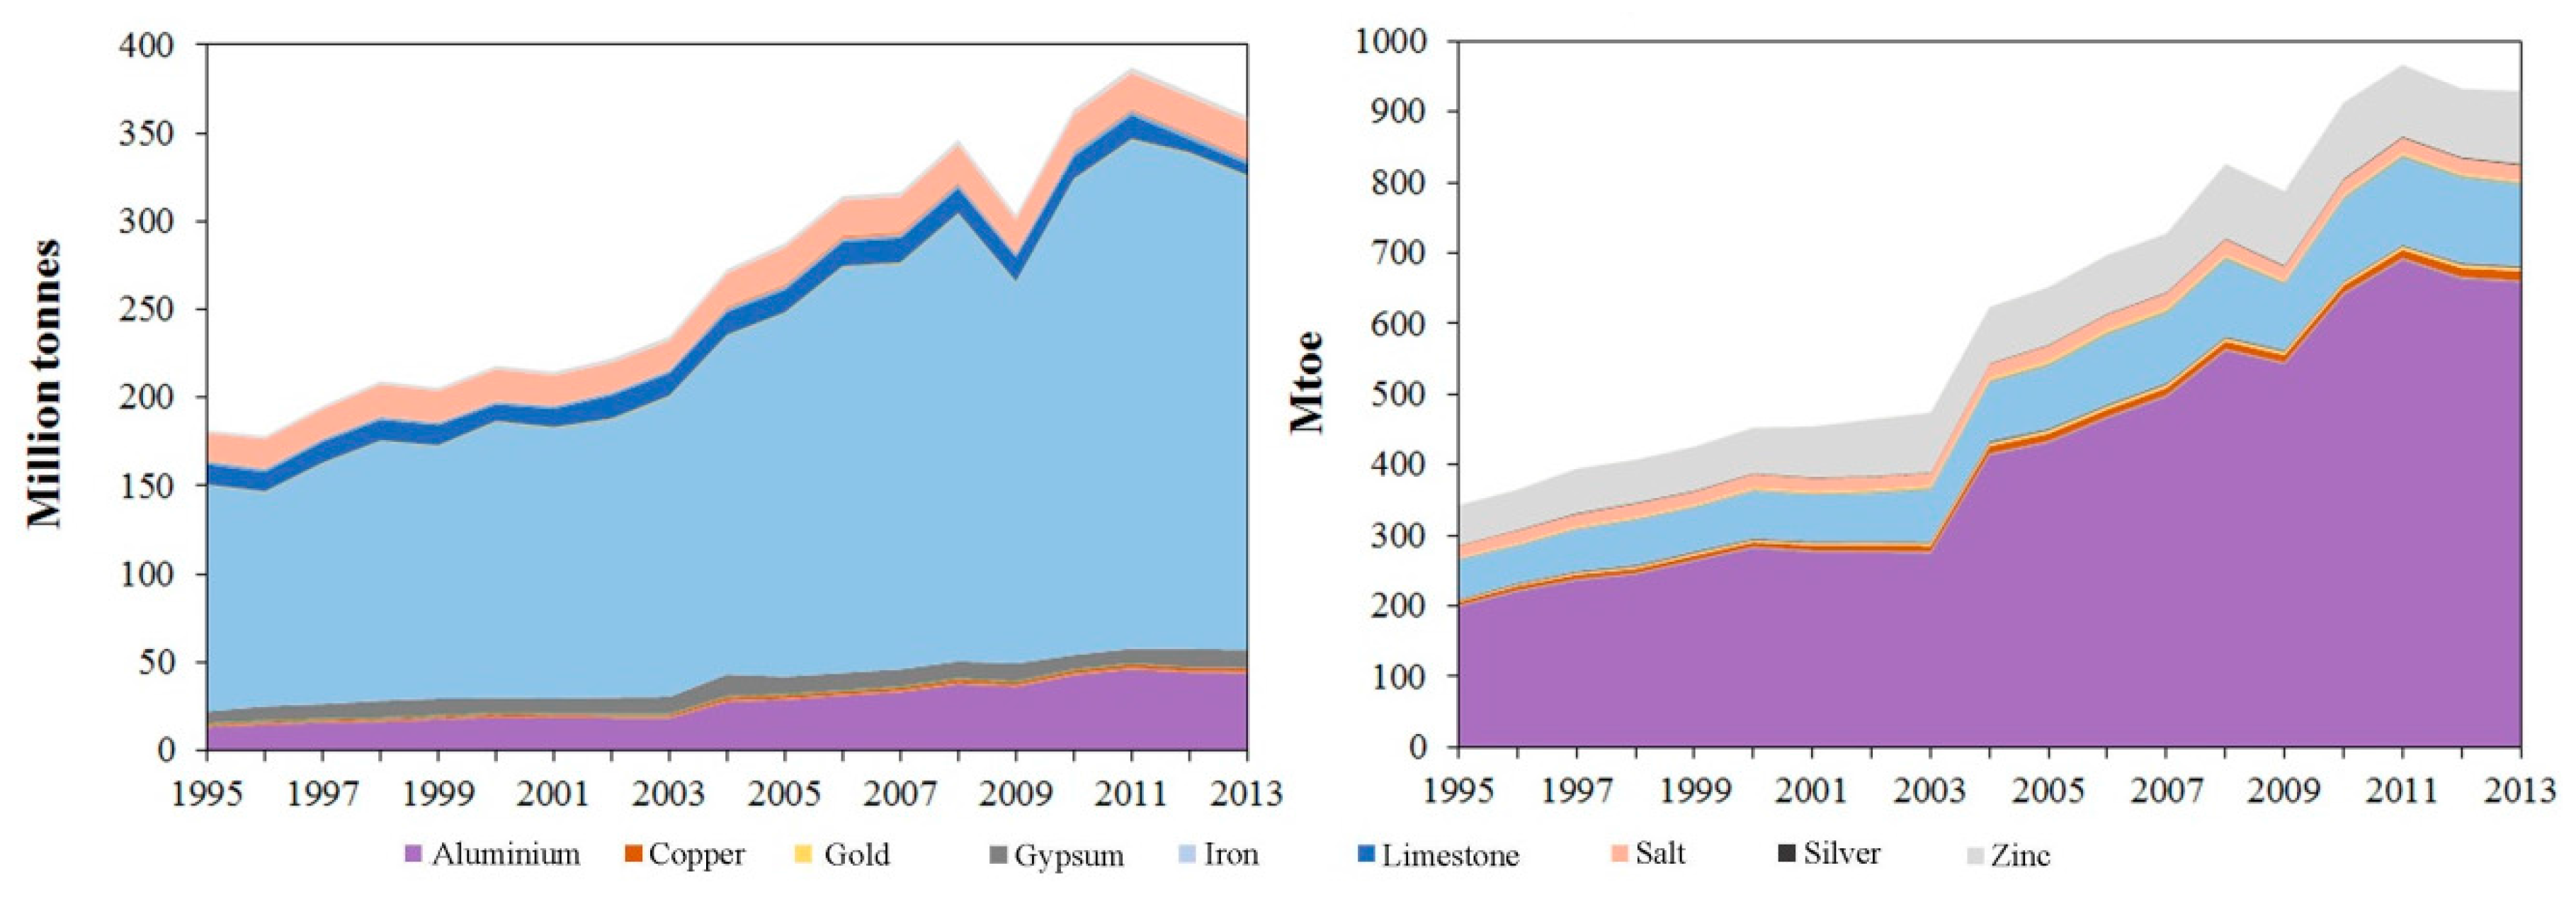
Figure 1 shows non-fuel mineral production of LA-20 disaggregated by minerals, data was compiled from USGS statistics [68] and then compared to the information provided by national agencies to ensure maximum coherence and completeness.
Overall, in mass terms, the most extracted minerals in LA-20 from 1995 to 2013, were iron, aluminum, salt, limestone, and gypsum (average of 197, 28, 18, 12, and 9 million tonnes per year, respectively). When these data is translated into loss of natural stock in the region, through the ERC concept, the highest loss corresponded to aluminum (average value of 413 Mtoe), followed by iron (84 Mtoe). In the period of analysis, iron production represented 72% as an average of the total production in tonnes, while in Mtoe it represented only 13%. On the opposite side, aluminum, which only represented 10% of the total production in tonnes, represented 66% in ERC. Hence, the loss of natural stock in LA-20 was mainly caused by aluminum rather than iron. The importance of taking into consideration quality and not only quantity of non-fuel minerals is revealed with this comparison.
The complete mineral balance disaggregated by mineral for LA-20 in 2013 in mass and ERC terms can be seen in the Appendix B and Appendix C. Analyzing these data in detail, it can be observed that the most extracted fuel minerals in that year were crude oil and natural gas, with a share of 63% and 23% of the total fossil fuels, respectively. Regarding non-fuel minerals, iron, aluminum, and salt were the most produced in mass terms (69%, 9%, and 6%, respectively). When looking at consumption data, crude oil, and natural gas were largely consumed within LA-20, and regarding non-fuel minerals, iron, aluminum, limestone, and salt were mostly consumed internally. The cases of limestone and salt can be easily explained as usually industrial minerals, which have lower prices than other metallic or non-metallic minerals, are consumed internally, rather than exported to other countries.
As stated before, mineral trade can be represented using Sankey diagrams, with arrows showing the production, imports, exports, and domestic consumption proportional to flow quantities. As it was previously mentioned, domestic consumption referred to apparent and not final consumption. Therefore, and as opposed to conventional EW-MFA, semi-manufactured products (either entering or leaving the analyzed system) were not taken into account. In conventional EW-MFA, the composition of most traded goods is assessed using the main material component or the main raw materials used in the production. On the contrary, in our analysis if for example iron was used internally to produce steel, and this in turn, was exported, the corresponding iron was considered as a commodity consumed internally. This is why, according to the EW-MFA definitions, our results are only partial when analyzing imports and exports as we only consider bulk commodities.
Three countries have been selected for such purposes, Brazil, Chile, and Mexico (Figure 2). These countries have been chosen as an example as they approximately represent 65% of the total mineral trade in LA-20. All of the mineral commodities (38) along with natural gas, oil, and coal are represented in the diagram, but the legend only shows those that can be easily seen in the figure.
In some countries, when calculating the domestic material consumption, negative values can be obtained for certain commodities, such as gold, silver, lead, or zinc, as exports are higher than production and imports combined. Illegal and artisanal mining are a serious problem in the region, especially in the case of precious metals, such as gold [69,70,71,72]. In 2013, it was estimated that 158 tonnes of gold were produced illegally, accounting for $6.9 billion USD. Countries with higher illegal gold production rates in that year were: Venezuela, Colombia, and Ecuador [72]. Negative values of domestic consumption can also be explained by the lack of reported data by official authorities and variation in stocks that are not shown on mineral statistics. The difference between input and output flows was represented in the diagram as “imbalance”. Still, this imbalance on average is quite low when compared to the remaining flows.
In Brazil in 2013, in mass terms, the most produced and exported commodity was iron, with a share of 57% of the total domestic production and 85% of the total exports, respectively. When analyzing that same information applying the ERC concept, the main commodity contributing to the loss of natural stock was aluminum, with a share of 66%. In a merely tonnage perspective there is almost no difference between total exports and total domestic consumption. On the other hand, in terms of quality, consumption of higher-quality minerals, such as aluminum, potash, and crude oil, was three times higher than exports.
As for Chile, the country imported large amounts of fossil fuels and principally produced copper, iron, and salt. Chile is a world leader in copper production, and in 2013 copper extracted represented one-third of the global copper production [73]. When transforming this information using ERC, it can be seen that copper plays a major role in exports as more emphasis is placed on its physical quality: it represents more than 90% of the total exports. Total exports in tonnes represent a fifth of the total outputs (exports plus domestic consumption) but when expressed in ERC they only account half.
As for Mexico, the most notable difference with the other two countries is that it mainly produces fossil fuels, along with small amounts of iron. It is also noteworthy that there was no major dependency on the external supply for internal consumption of minerals, as only small amounts of gas and coal were imported. In mass terms, Mexico’s consumption was mainly dominated by natural gas and crude oil and was one order of magnitude higher than exports. In ERC terms, consumption was approximately two times higher than exports. A possible explanation for this value is the high fossil-fuel consumption in Mexico, as, for instance, in 2014 more than 59% of the total final energy consumption came from fossil fuels [74].

3.2. Mass and ERC Indicators

As stated before, different ratios were calculated: DE/DMC, I/DMC, and E/DMC, each considering domestic extraction, imports, and exports, respectively, when compared to DMC. These ratios only include material trade of the fossil fuels and non-fuel minerals listed in previous sections.
All of the ratios were calculated both in tonnes and in Mtoe for LA-20 for 2013 (Table 2). Absolute results are not comparable between both units of measure. Yet that is not the case when we assess ratios, such as DE/DMC, I/DMC, or E/DMC.
When looking at DE/DMC ratios of non-fuel minerals, it is clear that LA-20 in 2013 produced more minerals than those it consumed internally. Imports were significantly lower than domestic consumption and exports were also significant, which is consistent with the image that LA-20 has of being a net exporter territory. In the case of DE/DMC ratio, the value in mass is higher than in ERC. The explanation relays on the weight of iron, a very abundant element that has a low ERC value (18 GJ/t). When expressed in tonnes iron accounts for 68% of the total LA-20 mineral production but in ERC this value is only for 13%. On the contrary, for the I/DMC ratio, the value in ERC is higher than in mass, meaning that the minerals imported have higher ERC values and are therefore more scarce, such is the case of potassium (665 GJ/t), which accounts for 79% of the total imports in ERC, but only 19% in mass.
The region produced more fossil fuels than those it consumed internally; analyzing the DE/DMC and E/DMC, it can be seen that a large amount of the fossil fuels produced in the region were exported. No high variation between ratios of DE/DMC, I/DMC, and E/DMC of fossil fuels can be appreciated when comparing the results in mass and ERC. This is related to the high importance of oil and gas in domestic extraction, as, as seen before, both represented approximately 85% of the total fossil fuels extracted in LA-20 in 2013. A higher variation would be perceived if coal would play a more important role. This is because coal has a comparatively lower HHV than oil or natural gas.
Calvo et al. [35] applied MFA with an exergoecology approach for twenty-eight European countries (EU-28) using 2011 as the reference year. Although the latter and current study differs by two years, a comparison among the indicators obtained in this study will give us an indication of mineral sufficiency and dependency for both regions.
In general, this comparison clearly shows a markedly difference between both regions, while DE/DMC is higher than 1 for LA-20 (i.e., exports are larger than imports), stating the relevance of domestic extraction and exports, for the EU-28 this value is considerably lower. This is understandable as EU-28 relies on minerals imports rather than on domestic extraction, therefore shifting the environmental burden of mineral extraction to other territories.
As expected, non-fuel mineral values of the ratio I/DMC for LA-20 were considerably lower than those for EU-28. This reveals that EU-28 had to rely on importing materials to meet its internal needs, while, in LA-20, domestic extraction was sufficient to cover most of its internal demand. In addition, the E/DMC ratio was higher for LA-20 than for EU-28, reflecting the importance of LA-20 as an exporter region.
Contrary to what happens in EU-28, which in 2011 was extremely dependent on fossil fuels, in LA-20 the import to DMC ratio was considerably lower and for the case of the exports ratio, it reflected the fossil fuel trade that takes place in the region.
Ratios of DE/DMC, I/DMC, and E/DMC, calculated in ERC terms only, for every country, except for Haiti due to a lack of data, are shown in Table 3. It is noteworthy that DMC values for Costa Rica and El Salvador are the only ones with negative figures. This is because, as it can be seen in the annexes, export values for these countries are higher than production and imports. The lack of mineral production official data, which can be incomplete or present gaps, can lead to lower values that do not reflect the reality of the country. This is even more notorious in ERC than in mass terms, because scarcer minerals have a higher weight.
Countries with a ratio DE/DMC higher than 1 in 2013 were: Colombia, Peru, Ecuador, Bolivia, Panama, Venezuela, Mexico, Chile, Brazil, and Argentina. Colombia, Ecuador, and Peru in 2013 produced three times more fuel and non-fuel minerals than their national consumption.
This classification also shows the importance of performing the analysis using ERC, since, until now, in a mass basis analysis, only a few countries, such as, Brazil, Venezuela, Mexico, and Chile, were considered as the most significant producers in the region because of their mining and oil tradition.

3.3. Exports by Destination

In this section, the destinations of the non-fuel minerals from Latin America were studied, not analyzing only quantities, as other studies previously did [12,19,20,21,22,75], but considering that minerals are more valuable from a quality point of view with the ERC approach.
Although all 38 non-fuel minerals previously mentioned before were considered in the analysis, in the graphs only those that can be seen appear on the legend. These graphs were based on data from UN Comtrade [65]. As explained before, this database allows for avoiding double accounting, being able to eliminate flows between LA-20 countries and only analyzing trade between LA-20 and the rest of the world.
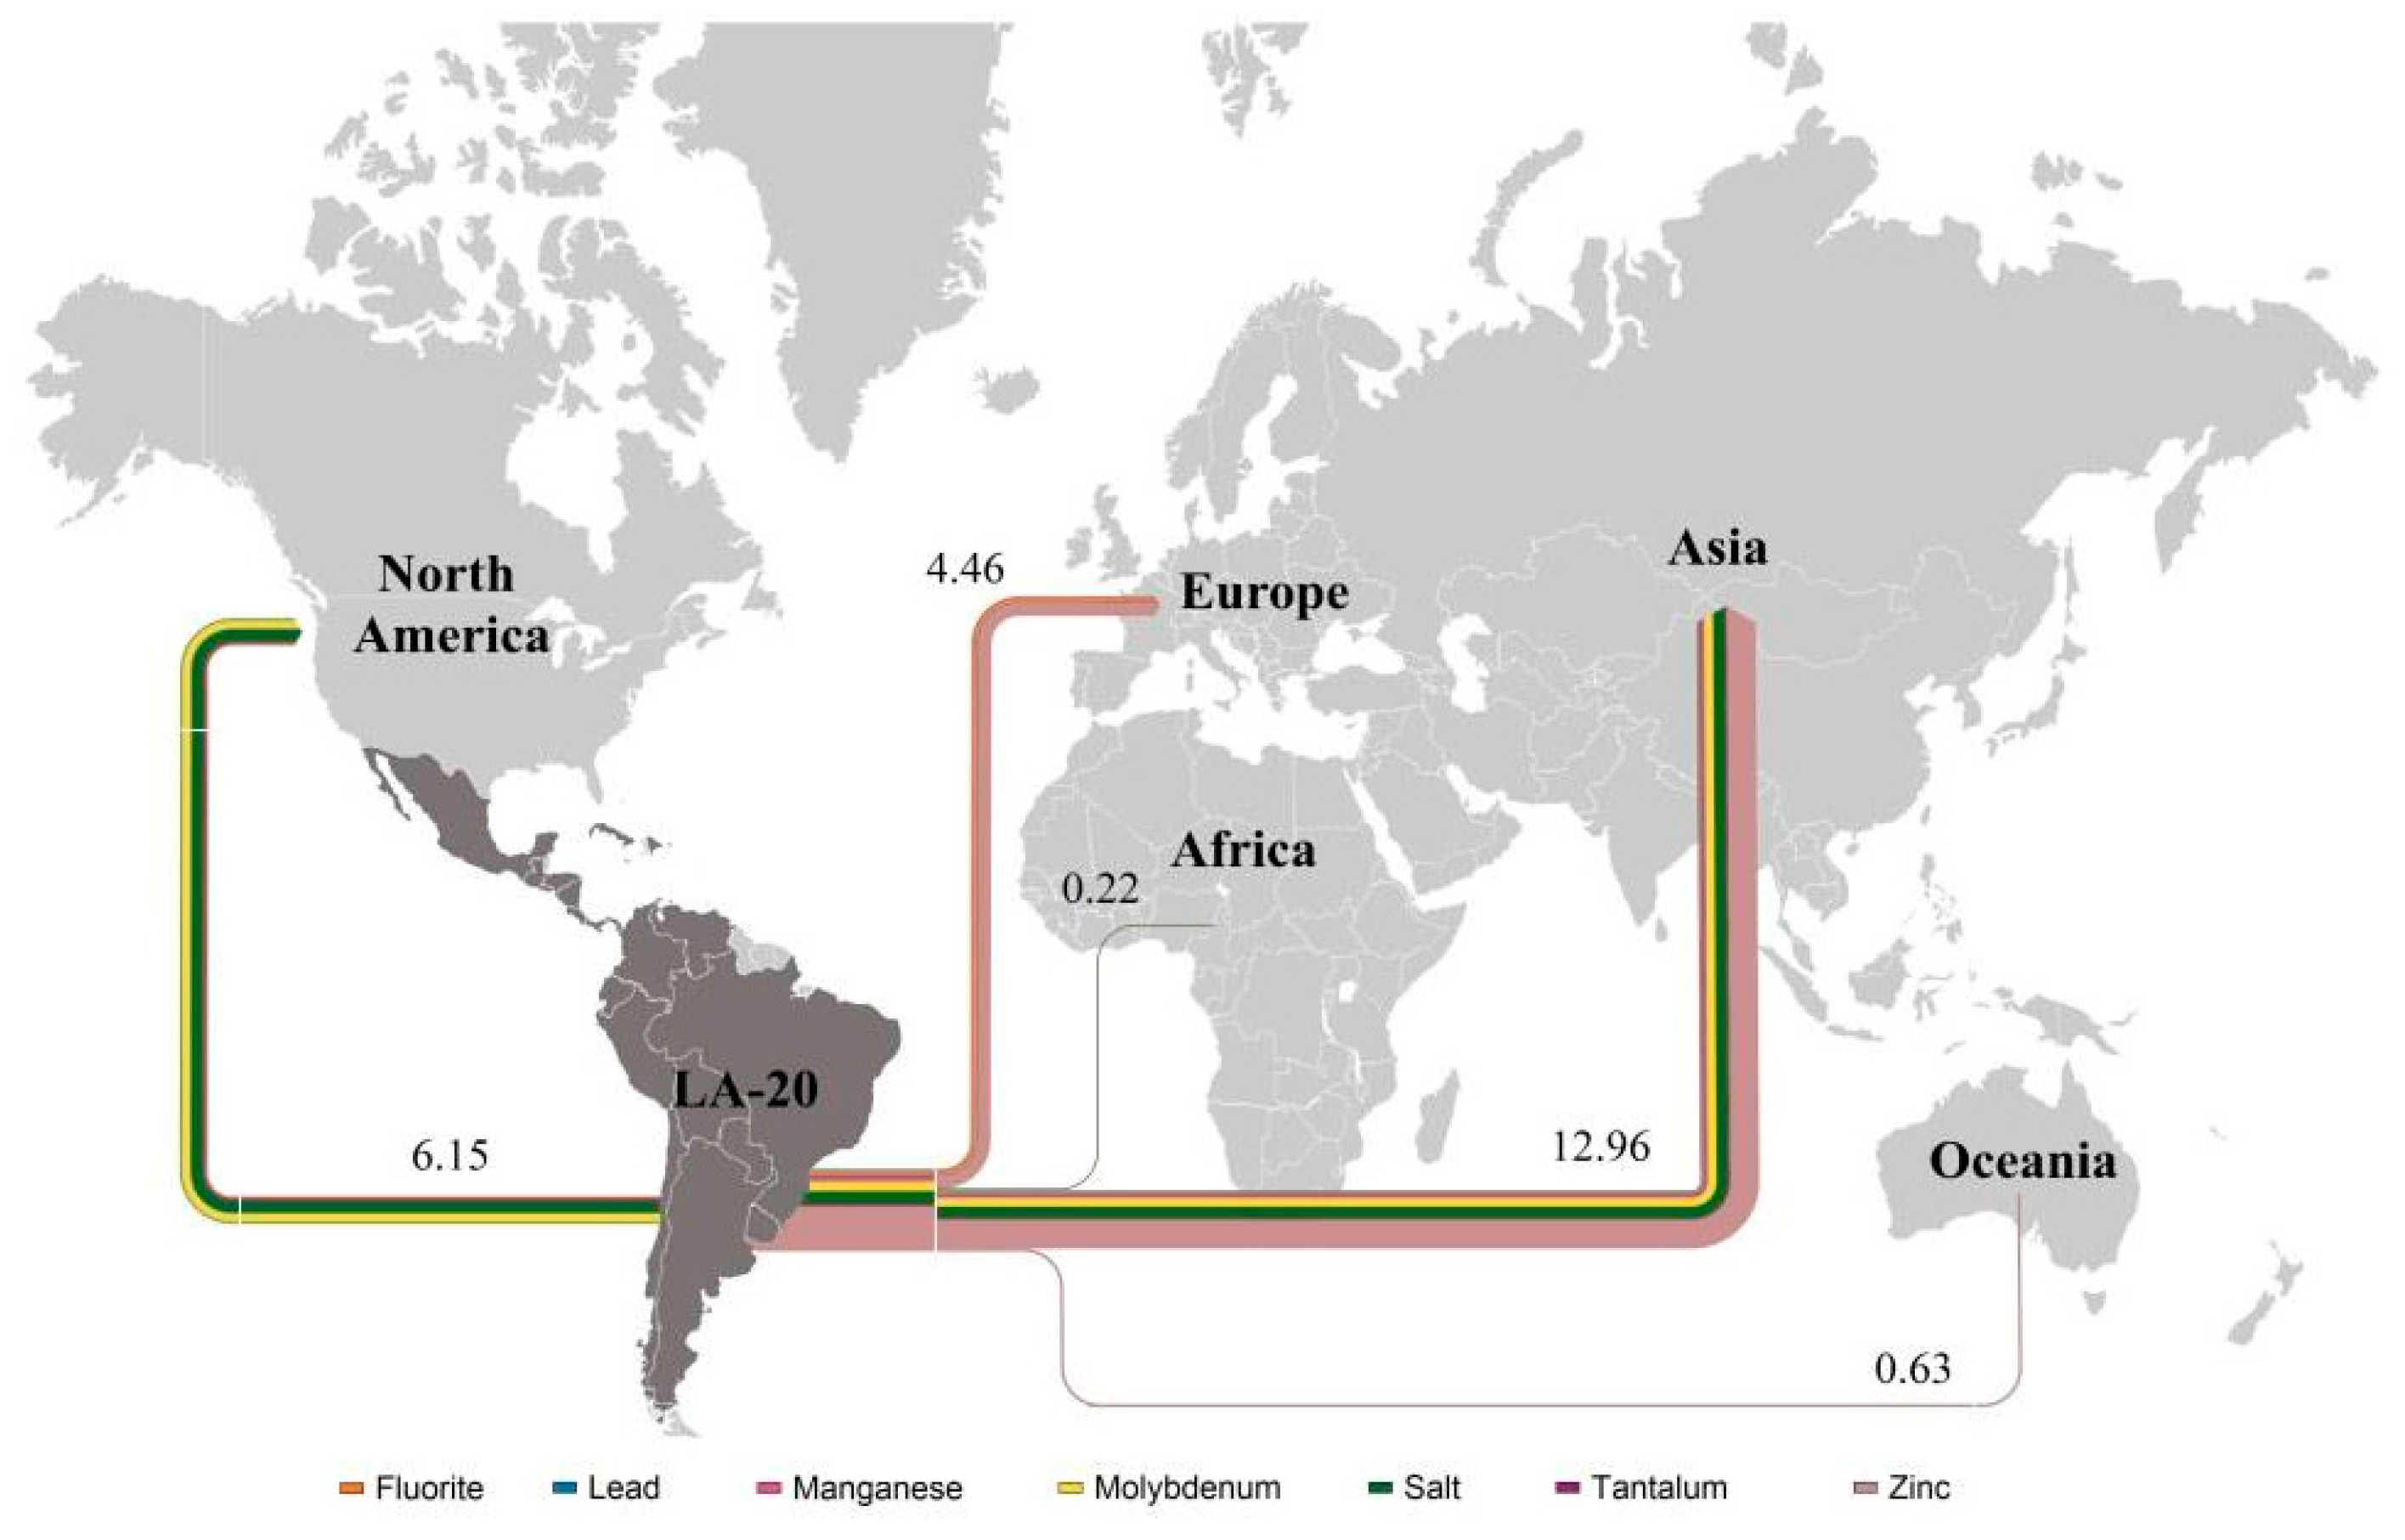
The main exported minerals were aluminum, iron, zinc, copper, silver, and gold (139, 134, 117, 58, 32, and 23 Mtoe, respectively). As it can be seen in Figure 3, approximately one quarter of all the minerals produced in LA-20 ended in North America, mainly going to the United States, while the rest went to other territories. This share can be understood because proximity is a key factor in mineral trade and also because some companies that own mines in LA-20 have processing plants in other parts of the world.
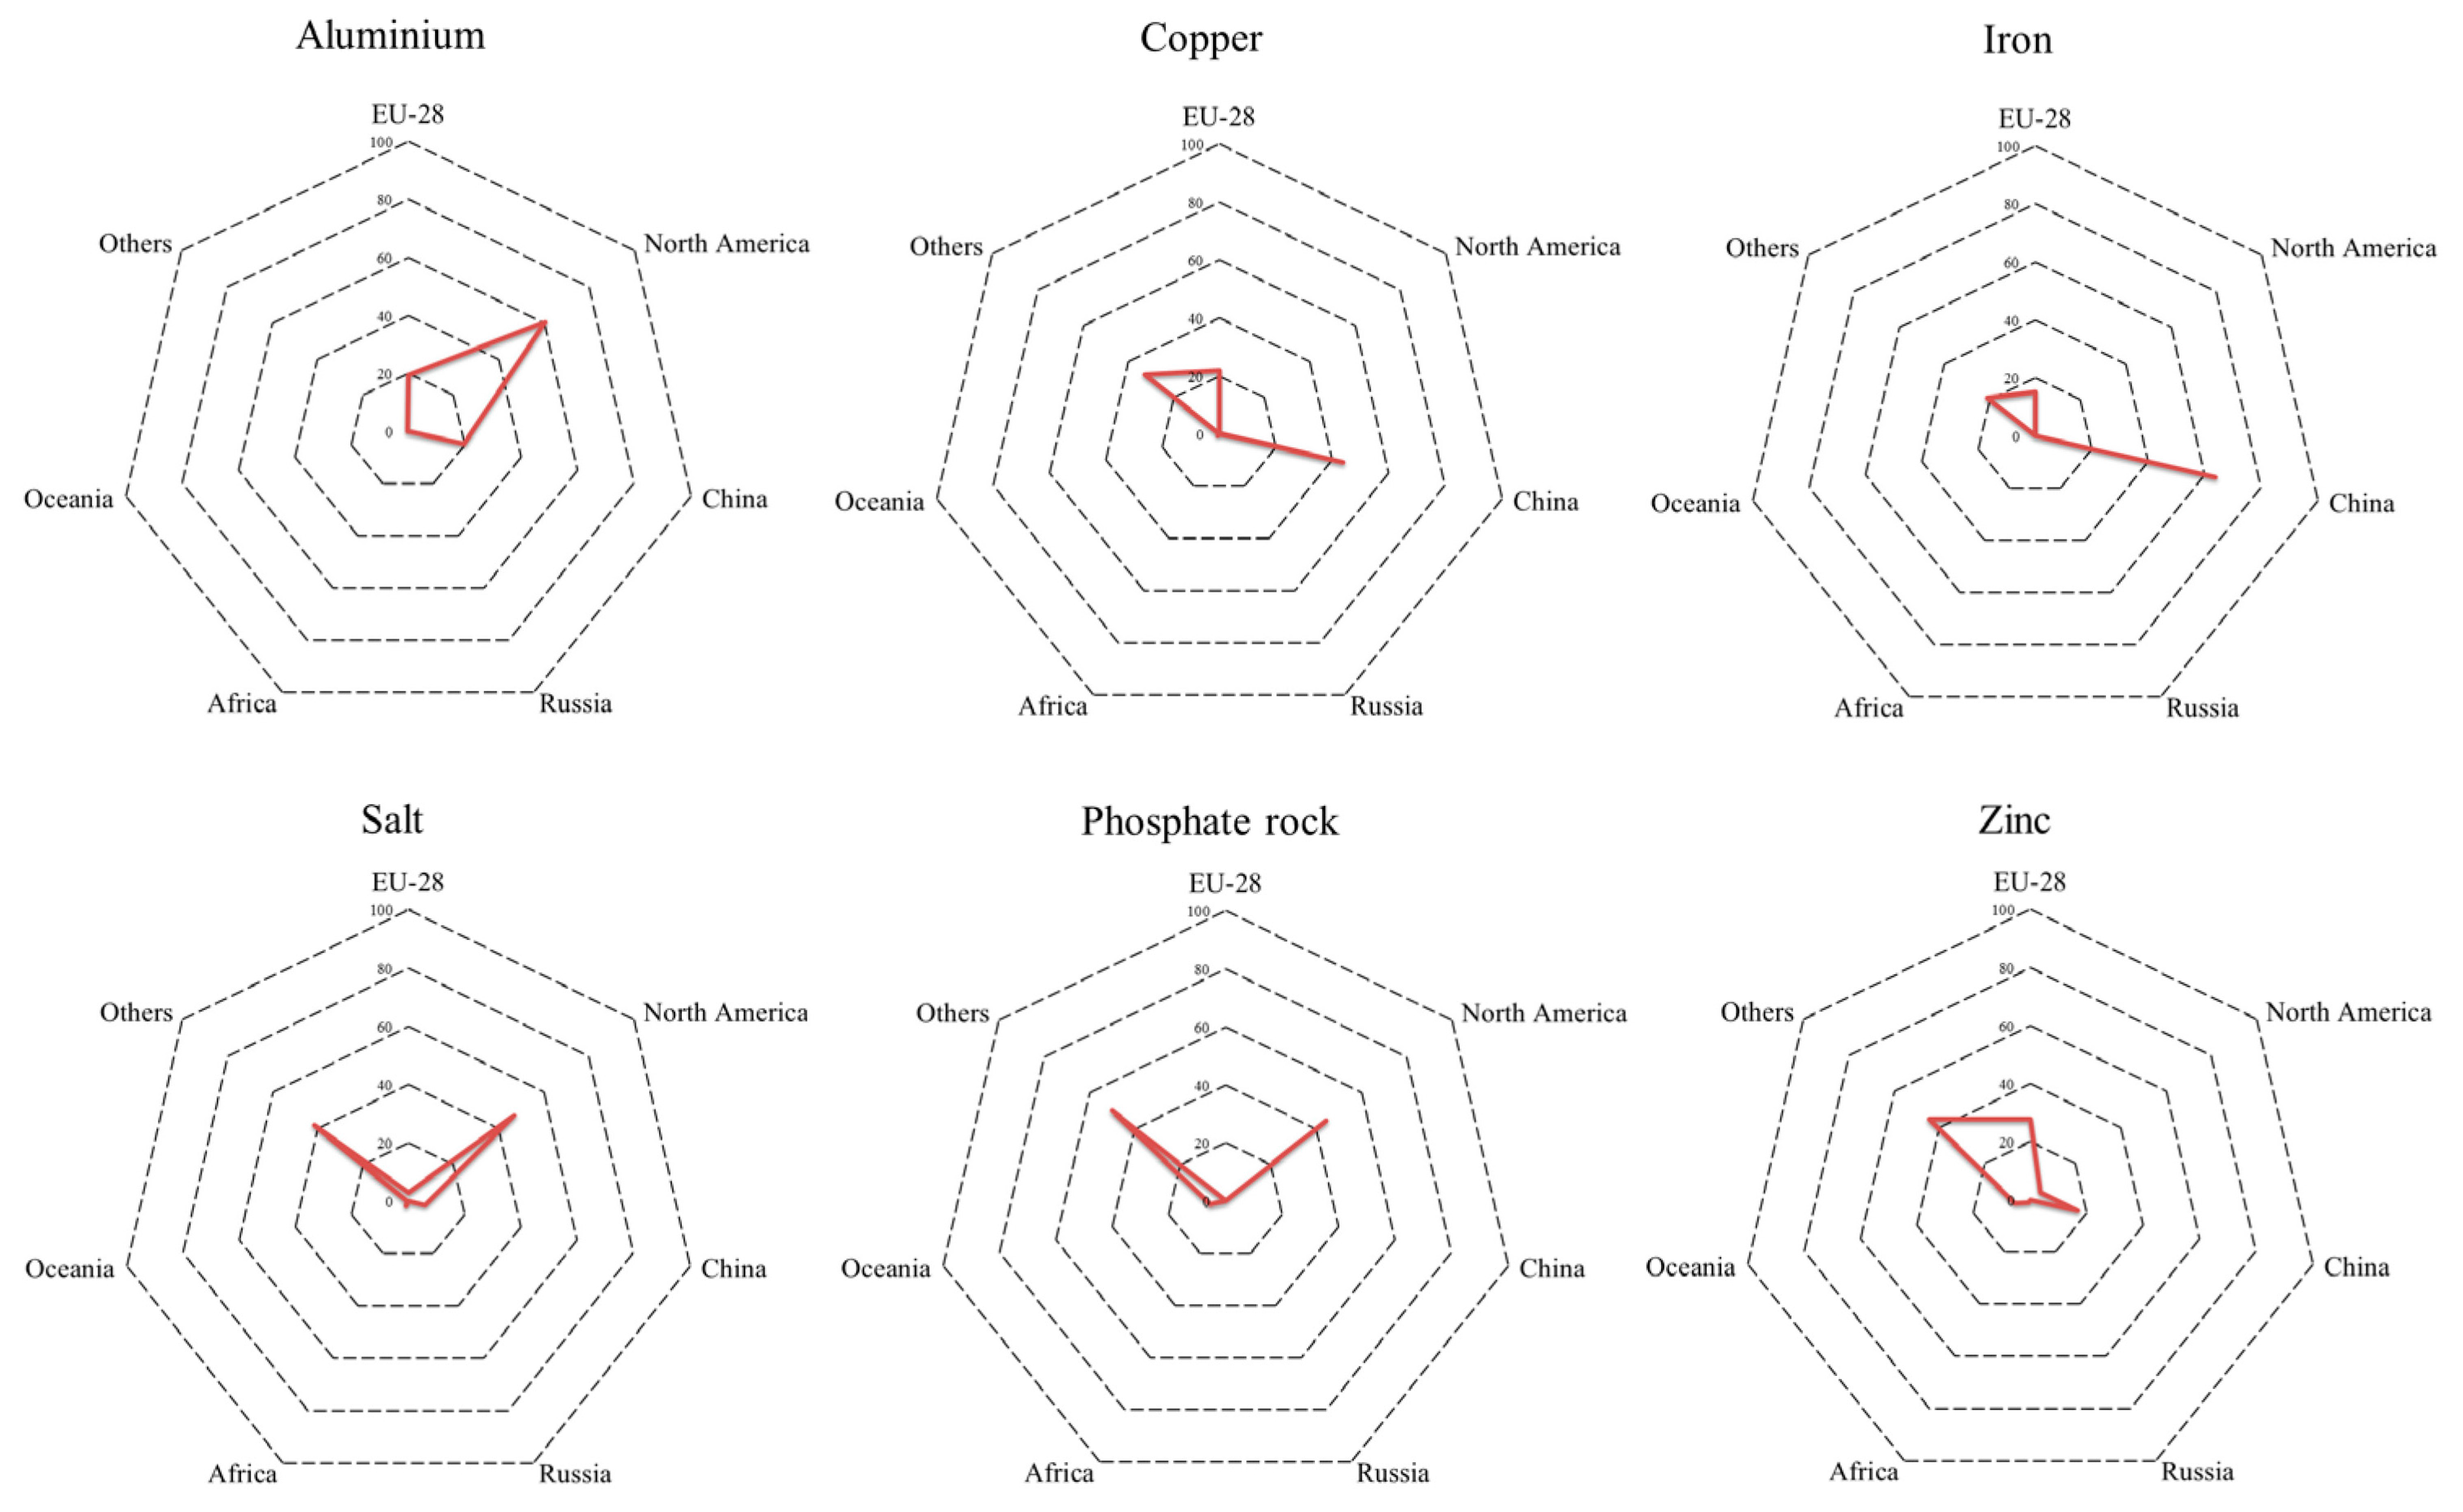
High quality minerals, such as aluminum or gold, were exported mostly to North America (59 and 77%, respectively). The majority of copper produced in LA-20 was exported to China (38%), as well as silver (48%), while most of the zinc exports went to Russia (41%). Additionally, a not negligible 21% of gold went to Europe. More results disaggregated by mineral can be seen in Appendix D.
It can be observed that even using an ERC approach, iron still accounts for the vast majority of the exports as even if the ERC of iron is quite low when compared to other commodities, the extraction figures are so high that it masks other scarcer minerals. For this reason, some elements were removed from Figure 3 so other mineral flows can be seen (Figure 4).
If those results were analyzed only in tonnes, it would seem that LA-20 only exports iron, aluminum, and salt, as these three elements alone represents 95% of the total exports to other countries. Still, between only Chile and Peru, they represented more than one third of the total copper production in the world, Chile alone has 6 of the 10 largest copper mines in the world, while two others are located in Peru and Mexico. Moreover, around 12% of gold is produced in LA-20, with some of the largest gold mines being located in Dominican Republic, Mexico, and Peru.

4. Discussion and Conclusions

Latin America has always played an important role in the production of mineral commodities at international level. In this paper, the production, imports, and exports of 41 fuel and non-fuel minerals of 20 countries has been analyzed. Then, the dependency or self-sufficiency of the region has been assessed, as well as exports by destination. Combining all of these approaches, the main goal was to analyze the impact of the loss of natural stock in the region.
For a proper evaluation of the loss of natural stock, a tonnage assessment alone is not enough, as it would be like adding “apples with oranges” trying to compare one tonne of gold with one tonne of iron, therefore disregarding important aspects of the commodities. One of those aspects is quality, which can be assessed using the exergy replacement cost (ERC), a concept that accounts for the physical characteristics of minerals, when considering their scarcity in the crust of the Earth. Accordingly, a tonne of iron has a significantly lower ERC than a tonne of gold, as the first appears more concentrated and is more easily extracted from the mines.
The ERC concept has made the importance of scarcer minerals for the assessment of mineral trading in Latin America stand up, as the production of these high quality minerals also means a higher loss of natural stock in the region. Additionally, combined with material flows analysis, this approach has enabled us to identify more precisely destinations of high-quality minerals. For instance, from 1995 to 2013 in LA-20, iron production represented 72% of the total production in tonnes, while in Mtoe it only represented 13%, and the contrary was observed for aluminum. Thus, the loss of natural stock of LA-20 was mainly caused by aluminum and not by iron extraction, along with zinc and copper, commodities which also contributed highly to the loss of the natural stock in the region. It was also observed that in 2013 more than half of the mineral production in LA-20 was destined only to exports. Moreover, the loss of natural stock was also due to exports of higher quality minerals, such as gold or silver. China and North America (mainly United States) were key commercial partners for LA-20 in 2013. Routes of exports by destination showed that 32% and 22% of the total exports in ERC terms were destined to these countries, respectively.
The results have vastly shown the importance of quantifying minerals not only in mass (tonnes), but also taking into account their quality through the concept of ERC. Precious metals, like gold and silver, are always masked by other elements in conventional MFA, because of their low values in mass terms. Still, they are even more critical not only from an economic point of view, as gold is closely linked with the monetary market, but also from a scarcity perspective.
Additionally, when analyzing in detail the material trade of Chile, Brazil, and Mexico, another problem related to mineral extraction and statistics was revealed. In some cases, there were negative values of domestic material consumption (domestic extraction + imports − exports) that is caused by illegal and artisanal mining of precious metals. Illegal mining also entails that the burdens and impacts associated to mineral extraction increase even more as in the case of the latter there are no social, legal, or environmental criteria being followed. Alongside environmental problems, such as deforestation, the uncontrolled dumping of hazardous wastes in soils or rivers, can cause health damage. This also evidences that more efforts should be made by the local governments to improve the traceability of extracted minerals. Additionally, LA-20 mining statistics are not always complete or present disaggregated data that can be used to calculate the impacts of the mining sector by metal. There are still other statistics services, such as BGS and USGS, that provide useful data, but improvements should be made towards a more transparent and thorough method of reporting mineral data.
Along with other publications [4,19,20,22,27,28,76], this study intends to raise awareness on mineral production in Latin-American. Currently, the extraction rate of mineral stock continues to increase, as it did to fuel the growth of European countries in the past and powering the booming of China during recent years. This extraction, especially in the case of scarcer minerals, entails a loss that is related to the quality of mineral resources. This loss will presumably increase in the coming future, which raises the question whether income received from mineral exports in Latin America truly compensates the loss of natural mineral stock and the environmental burdens left in the region. It can also be used as a wake-up call to national and local authorities in Latin America to look at mineral resources from a more sovereign position for equal trading in a global market.
For this reason, this study attempts to promote a deeper discussion on the importance of the quality of minerals, incorporating the thermodynamic approach in conventional material flow analysis. This would imply following a new path by going beyond the traditional tonnage perspective.

Acknowledgments

The first author gratefully acknowledges the PhD grant 53, 2016 of Escuela Politécnica Nacional (EPN). Thanks to the Latin American Organization of Energy (OLADE), especially Paola Carrera, for providing access to on-line economic and energy data. We kindly thank the National Secretary of Science and Education of Ecuador (SENESCYT) for the support to publish this paper in an open-access edition. We highly appreciate the comments and suggestions of four anonymous reviewers. Their comments further helped to improve the quality of the manuscript.

Author Contributions

José Luis Palacios was involved in the data collection, data analysis, and paper writing. Guiomar Calvo contributed to the data analysis and elaboration of figures and tables Antonio Valero and Alicia Valero conceived the methodology and supervised the scientific work.

Conflicts of Interest

The authors declare no conflict of interest. The founding sponsors had no role in the design of the study; in the collection, analyses, or interpretation of data; in the writing of the manuscript; or in the decision to publish the results.

Appendix A

Table A1. Exergy replacement cost of non-fuel mineral for LA-20 in GJ per tonne of element. Source: [53].
No.MineralERC (GJ/t)NoMineralERC (GJ/t)
1Aluminium (Gibbsite)62720Mercury (Cinnabar)28,298
2Antimony (Stibnite)47421Molybdenum (Molybdenite)908
3Barite3822Nickel (Garnierite)168
4Beryllium (Beryl)25323Niobium (Ferrocolumbite)4422
5Bismuth (Bismuthinite)48924Platinum Group Metals (PGM)4,491,690
6Cadmium (Greenockite)5,89825Phosphate Rock (Apatite)0.4
7Chromium (Chromite)4.526Potassium (Sylvite)665
8Cobalt (Linnaeite)10,87227REE (Bastnaesite)348
9Copper (Chalcopyrite)29228Sodium (Halite)44.07
10Fluorite18329Selenium2,235,699
11Gold553,25030Silver (Argentite)7371
12Graphite2031Tantalum (Tantalite)482,828
13Gypsum1532Tin (Cassiterite)426
14Iron ore (Hematite)1833Titanium (Ilmenite)4.5
15Lead (Galena)3734Vanadium1055
16Lime2.635Tungsten (Scheelite)7430
17Lithium (Spodumene)54636Zinc (Sphalerite)155
18Magnesite2637Zirconium (Zircon)654
19Manganese (Pyrolusite)16

Appendix B

Table A2. LA-20 mineral balance in 2013 (Unit: million tonnes).
CountryOilNatural GasCoalNon-Fuel MineralsTOTAL
ProductionImportsExportsProductionImportsExportsProductionImportsExportsProductionImportsExportsProductionImportsExports
Argentina28.200.381.9735.609.450.070.071.670.0018.002.430.8971.9013.902.93
Bolivia2.95--15.70-12.60---0.520.000.2019.202.2 × 10−412.80
Brazil101.0019.6019.8020.8012.80-6.8625.00-436.006.43293.00422.7163.83210.20
Chile0.348.84-0.712.87-2.189.270.8924.500.205.8527.7021.206.75
Colombia48.50-32.4013.90-1.3791.90-85.1015.201.482.8 × 10−3169.001.48119.00
Costa Rica---------0.010.004.7 × 10−30.010.004.7 × 10−3
Cuba2.914.81-0.79---3.0 × 10⁻⁶-0.38--4.084.81-
Dominican Republic-1.33--0.87--0.85-0.990.010.160.993.050.16
Ecuador25.30-18.301.21-----7.05-1.4 × 10−533.60-18.30
El Salvador0.50-0.44------0.210.010.680.710.011.11
Guatemala---------0.100.012.5 × 10−40.10-2.5 × 10⁻⁴
Honduras-------0.12-0.08--0.080.12-
Mexico126.00-59.4049.5018.600.1010.207.400.0138.101.5020.60216.7327.5080.14
Nicaragua-0.64-------0.04-2.4 × 10−50.040.642.4 × 10−5
Panama---------0.030.001.4 × 10−40.032.6 × 10−41.4 × 10⁻⁴
Paraguay---------0.070.11-0.070.11-
Peru3.134.170.7313.90-4.690.250.65-25.80-3.3943.104.828.81
Uruguay-1.89--0.04--0.00-1.494.0 × 10−93.8 × 10−61.491.943.8 × 10−6
Venezuela144.000.6196.3020.801.55-1.08-0.8016.2013.603.23182.0015.80100.00

Appendix C

Table A3. LA-20 mineral balance expressed using ERC for 2013 (Unit: Mtoe).
CountryOilNatural GasCoalNon-Fuel MineralsTOTAL
ProductionImportsExportsProductionImportsExportsProductionImportsExportsProductionImportsExportsProductionImportsExports
Argentina31.210.422.1733.518.900.060.051.160.00114.391.4314.9279.1511.9117.16
Bolivia3.26--14.82-11.86---16.750.027.7834.830.0219.63
Brazil111.6421.7121.8619.5712.09-5.1818.92-702.6085.51268.79778.47138.23225.38
Chile0.379.77-0.672.70-1.516.440.6284.971.8744.3287.5320.7844.94
Colombia53.65-35.8113.09-1.2953.30-49.392.821.880.72122.851.8887.21
Costa Rica---------0.011.438.070.011.438.07
Cuba3.225.31-0.74-----1.39--5.355.31-
Dominican Republic-1.47--0.81--0.49-15.160.101.3815.162.891.38
Ecuador28.01-20.251.14-----1.99-0.1831.14-20.43
El Salvador0.55-0.49------0.350.302.680.900.303.17
Guatemala---------0.11--0.11--
Honduras-------0.07-1.06--1.060.07-
Mexico139.21-65.7146.6417.480.095.934.290.00347.075.3347.86235.8727.0047.86
Nicaragua-0.71--------0.13-0.130.130.710.13
Panama---------0.040.0030.030.040.0030.03
Paraguay---------0.030.04-0.030.04-
Peru3.464.610.8113.12-4.420.190.49-67.42-55.1984.195.1060.42
Uruguay-2.090.000.000.04--0.00-0.140.00010.050.142.130.05
Venezuela159.570.68106.5119.581.46-0.75-0.5540.030.00031.36219.942.14108.43

Appendix D

Figure A1. Mineral exports by destination (data expressed in %).
Sustainability 10 00723 g0a1

References

  1. Stanley, J.; Stein, B.H. La Herencia Colonial de América Latina; Siglo Veintiuno: Ciudad de México, México, 1970; ISBN 9682301572. [Google Scholar]
  2. Ferrer, A. De Cristóbal Colón a Internet: América Latina y la Globalización; Fondo de Cultura Económica: Mexico City, Mexico, 2002; ISBN 9681664523. [Google Scholar]
  3. Narins, T. The China Triangle: Latin America’s China Boom and the Fate of the Washington Consensus. AAG Rev. Books 2017, 5, 17–19. [Google Scholar] [CrossRef]
  4. Tanimoto, A.H.; Gabarrell Durany, X.; Villalba, G.; Pires, A.C. Material flow accounting of the copper cycle in Brazil. Resour. Conserv. Recycl. 2010, 55, 20–28. [Google Scholar] [CrossRef]
  5. Jaramillo, P.; Lehmann, S.; Moreno, D. China, Precios de Commodities y Desempeño de América Latina: Algunos Hechos Estilizados. Cuad. Econ. 2009, 46, 67–105. [Google Scholar] [CrossRef]
  6. Rosales, O. América Latina y el Caribe y China: Hacia una Nueva era de Cooperacion Economica; CEPAL: Santiago, Chile, 2015. [Google Scholar]
  7. World Trade Organization (WTO). International Trade Statistics 2015. Special Focus: World Trade Organization: 1995–2014; WTO: Geneva, Switzerland, 2015. [Google Scholar]
  8. Brunner, P.H.; Rechberger, H. Practical Handbook of Material Flow Analysis; CRC Press: Boca Raton, FL, USA, 2004. [Google Scholar]
  9. Allesch, A.; Brunner, P.H. Material flow analysis as a decision support tool forwaste management: A literature review. J. Ind. Ecol. 2015, 19, 753–764. [Google Scholar] [CrossRef]
  10. Giljum, S. Trade, Materials Flows, and Economic Development in the South: The Example of Chile. J. Ind. Ecol. 2008, 8, 241–261. [Google Scholar] [CrossRef]
  11. Organisation for Economic Co-Operation and Development (OECD). Measuring Material Flows and Resource Productivity; OECD: Paris, France, 2008; Volume I. [Google Scholar]
  12. Schaffartzik, A.; Mayer, A.; Gingrich, S.; Eisenmenger, N.; Loy, C.; Krausmann, F. The global metabolic transition: Regional patterns and trends of global material flows, 1950–2010. Glob. Environ. Chang. 2014, 26, 87–97. [Google Scholar] [CrossRef] [PubMed]
  13. Wang, P.-C.; Lee, Y.-M.; Chen, C.-Y. Estimation of Resource Productivity and Efficiency: An Extended Evaluation of Sustainability Related to Material Flow. Sustainability 2014, 6, 6070–6087. [Google Scholar] [CrossRef]
  14. Schaffartzik, A.; Wiedenhofer, D.; Eisenmenger, N. Raw Material Equivalents: The Challenges of Accounting for Sustainability in a Globalized World. Sustainability 2015, 7, 5345–5370. [Google Scholar] [CrossRef]
  15. Vexler, D.; Bertram, M.; Kapur, A.; Spatari, S.; Graedel, T.E. The contemporary Latin American and Caribbean copper cycle: 1 Year stocks and flows. Resour. Conserv. Recycl. 2004, 41, 23–46. [Google Scholar] [CrossRef]
  16. Perez-Rincon, M.A. Colombian international trade from a physical perspective: Towards an ecological “Prebisch thesis”. Ecol. Econ. 2006, 59, 519–529. [Google Scholar] [CrossRef]
  17. Vallejo, M.C. Biophysical structure of the Ecuadorian economy, foreign trade, and policy implications. Ecol. Econ. 2010, 70, 159–169. [Google Scholar] [CrossRef]
  18. Walter, M.; Brun, J.; Pérez-manrique, P.; González-martínez, A.C.; Alier, J.M. Análisis de flujo de materiales de la economía argentina (1970–2009). Tendencias y conflictos extractivos. Ecol. Política 2011, 45, 94–98. [Google Scholar]
  19. United Nations Environment Programme (UNEP). Recent Trends in Material Flows and Resource Productivity in Latin America; UNEP: Panama City, Panama, 2007; p. 2768. [Google Scholar] [CrossRef]
  20. Russi, D.; Gonzalez-Martinez, A.C.; Silva-Macher, J.C.; Giljum, S.; Martínez-Alier, J.; Vallejo, M.C. Material flows in Latin America: A comparative analysis of Chile, Ecuador, Mexico, and Peru, 1980–2000. J. Ind. Ecol. 2008, 12, 704–720. [Google Scholar] [CrossRef]
  21. West, J.; Schandl, H. Material use and material efficiency in latin america and the caribbean. Ecol. Econ. 2013, 94, 19–27. [Google Scholar] [CrossRef]
  22. Giljum, S.; Eisenmenger, N. North-South Trade and the Distribution of Environmental Goods and Burdens: A Biophysical Perspective. J. Environ. Dev. 2004, 13, 73–100. [Google Scholar] [CrossRef]
  23. Giljum, S.; Hubacek, K. International trade, material flows and land use: Developing a physical trade balance for the European Union. Analysis 2001, IR-01-059, 1–66. [Google Scholar]
  24. Leah, T.; del Bene, D.; Alier, J.M. Mapping the frontiers and frontlines of global e nvironmental justice: The EJAtlas. J. Political Ecol. 2015, 22, 255–278. [Google Scholar]
  25. Bottaro, L.; Sola-Alvarez, M. Conflictos Mineros en América Latina: Extracción, Saqueo y Agresión. Estado de Situación en 2016; OCMAL: Buenos Aires, Argentina, 2017. [Google Scholar]
  26. Observatorio de Conflictos Mineros de América Latina (OCMAL). Conflictos Mineros en América Latina. Available online: https://mapa.conflictosmineros.net/ocmal_db-v2/ (accessed on 19 January 2018).
  27. Aitken, D.; Rivera, D.; Godoy-Faúndez, A.; Holzapfel, E. Water Scarcity and the Impact of the Mining and Agricultural Sectors in Chile. Sustainability 2016, 8, 128. [Google Scholar] [CrossRef]
  28. Himley, M. Matthew Global Mining and the Uneasy Neoliberalization of Sustainable Development. Sustainability 2010, 2, 3270–3290. [Google Scholar] [CrossRef]
  29. Valero, A.; Valero, A. Thanatia: The Destiny of the Earth’s Mineral Resources. A Thermodynamic Cradle-to-Cradle Assessment; World Scientific Press: London, UK, 2014. [Google Scholar]
  30. Valero, A.; Valero, A.; Domínguez, A. Exergy Replacement Cost of Mineral Resources. J. Environ. Account. Manag. 2013, 1, 147–158. [Google Scholar] [CrossRef]
  31. Henckens, M.L.C.M.; van Ierland, E.C.; Driessen, P.P.J.; Worrell, E. Mineral resources: Geological scarcity, market price trends, and future generations. Resour. Policy 2016, 49, 102–111. [Google Scholar] [CrossRef]
  32. Torres, C.; Valero, A.; Valero, A. Exergoecology as a tool for ecological modelling. The case of the US food production chain. Ecol. Model. 2013, 255, 21–28. [Google Scholar] [CrossRef]
  33. Calvo, G.; Valero, A.; Carmona, L.; Whiting, K. Physical Assessment of the Mineral Capital of a Nation: The Case of an Importing and an Exporting Country. Resources 2015, 4, 857–870. [Google Scholar] [CrossRef]
  34. Calvo, G.; Valero, A.; Valero, A. Assessing maximum production peak and resource availability of non-fuel mineral resources: Analyzing the in fl uence of extractable global resources. Resour. Conserv. Recycl. 2017, 125, 208–217. [Google Scholar] [CrossRef]
  35. Calvo, G.; Valero, A.; Valero, A. Material flow analysis for Europe: An exergoecological approach. Ecol. Indic. 2016, 60, 603–610. [Google Scholar] [CrossRef]
  36. Gabriel Carmona, L.; Whiting, K.; Valero, A.; Valero, A. Colombian mineral resources: An analysis from a Thermodynamic Second Law perspective. Resour. Policy 2015, 45, 23–28. [Google Scholar] [CrossRef]
  37. Bejan, A.; Tsatsanoris, G.; Moran, M. Thermal Design & Optimization; John Wily & Sons, Inc.: Etobicoke, ON, Canada, 1996. [Google Scholar]
  38. Dincer, I.; Rose, M.A. EXERGY Energy, Environment and Sustainable Development, 2nd ed.; Elsevier: Oxford, UK, 2013. [Google Scholar]
  39. Sato, N. Chemical Energy and Exergy: An Introduction to Chemical Thermodynamics; Elsevier: Oxford, UK, 2005. [Google Scholar]
  40. Valero, A.; Valero, A. What are the clean reserves of fossil fuels? Resour. Conserv. Recycl. 2012, 68, 126–131. [Google Scholar] [CrossRef]
  41. Perrot, P. A to Z of Thermodynamics; Oxford University Press: Oxford, UK, 1998; ISBN 9780198565529. [Google Scholar]
  42. Moran, M.J.; Shapiro, H.N.; Boettner, D.D.; Bailey, M.B. Fundamentals of Engineering Thermodynamics, 7th ed.; John Wiley & Sons: Hoboken, NJ, USA, 2011; ISBN 978-0470495902. [Google Scholar]
  43. Szargut, J. Chemical exergies of the elements. Appl. Energy 1989, 32, 269–286. [Google Scholar] [CrossRef]
  44. Valero, A.; Valero, A. The Exergy Calculator. Online tool available at the Exergoecology Portal. Available online: http://www.exergoecology.com/excalc/index_html/new_calc_exergy (accessed on 19 January 2018).
  45. Valero, A.; Valero, A.; Vieillard, P. The thermodynamic properties of the upper continental crust: Exergy, Gibbs free energy and enthalpy. Energy 2012, 41, 121–127. [Google Scholar] [CrossRef]
  46. Szargut, J.; Ziebik, A.; Stanek, W.; Valero Delgado, A. Towards an international legal reference environment. In Proceedings of the ECOS 2005, Trondheim, Norway, 29 June–3 July 2015; pp. 409–420. [Google Scholar]
  47. Szargut, J.; Ziębik, A.; Stanek, W. Depletion of the non-renewable natural exergy resources as a measure of the ecological cost. Energy Convers. Manag. 2002, 43, 1149–1163. [Google Scholar] [CrossRef]
  48. Ayres, R.U. Energy, Complexity and Wealth Maximization; Springer International Publishing: Berlin, Germany, 2016; ISBN 978-3-319-30545-5. [Google Scholar]
  49. Dewulf, J.; Van Langenhove, H. Exergy. In Renewables-Based Technology; John Wiley & Sons, Ltd.: Chichester, UK, 2006; pp. 111–125. ISBN 9780470022443. [Google Scholar]
  50. Domínguez, A.; Valero, A. GLOBAL GOLD MINING: Is technological learning overcoming the declining in ore grades? J. Environ. Account. Manag. 2013, 1, 85–101. [Google Scholar] [CrossRef]
  51. Cox, D.P.; Singer, D.A. Mineral Deposits Models 1992; U.S. Geological Survey: Denver, CO, USA. Available online: https://pubs.usgs.gov/bul/1693/report.pdf (accessed on 6 March 2018).
  52. Valero, A.; Agudelo, A.; Valero, A. The crepuscular planet. A model for the exhausted atmosphere and hydrosphere. Energy 2011, 36, 3745–3753. [Google Scholar] [CrossRef]
  53. Calvo, G.; Valero, A.; Valero, A. Thermodynamic Approach to Evaluate the Criticality of Raw Materials and Its Application through a Material Flow Analysis in Europe. J. Ind. Ecol. 2017, 0. [Google Scholar] [CrossRef]
  54. Valero, A.; Valero, A. Thanatia: The Destiny of the Earth’s Mineral Resources; World Scientific: Singapore, 2014; ISBN 978-981-4273-93-0. [Google Scholar]
  55. Eurostat Economy-Wide Material Flow Accounts (EW-MFA) Compilation Guide 2013. Available online: http://ec.europa.eu/eurostat/web/environment/methodology (accessed on 6 March 2018).
  56. Departamento Nacional de Produção Mineral do Brasil (DNPM). Sumário Mineral; DNPM: Brasília, Brazil, 2015.
  57. Servicio Nacional de Geología y Minería (SERNAGEOMIN). Anuario de la Minería de Chile 2015; Servicio Nacional de Geología y Minería: Región de Tarapacá, Chile, 2015.
  58. Comisión Chilena del Cobre Anuario de Estadísticas del Cobre y Otros Minerales 1996–2015; COCHILCO: Santiago, Chile, 2015.
  59. Sistema de Información Minero Colombiano (SIMCO) Reportes de Minería. Available online: http://www.simco.gov.co/simco/Estadísticas/Producción/tabid/121/Default.aspx (accessed on 2 November 2016).
  60. Agencia de Regulación y Control Minero de Ecuador (ARCOM). Producción Mineral Reportada 2000–2014; ARCOM: Quito, Ecuador, 2014.
  61. Banco Central del Ecuador (BCE). Sistema de Información Macroeconómica-BCE (Versión BETA); BCE: Quito, Ecuador, 2017; Available online: https://www.bce.fin.ec/index.php/component/k2/item/788 (accessed on 5 December 2017).
  62. Ministerio de Energía y Minas. Perú 2015 Anuario Minero Reporte Estadístico; Ministerio de Energía y Minas: Lima, Perú, 2015.
  63. British Geological Survey (BGS). World Mineral Statistics Data. Available online: https://www.bgs.ac.uk/mineralsuk/statistics/wms.cfc?method=searchWMS (accessed on 20 June 2016).
  64. Comisión Económica para América Latina y el Caribe (CEPAL). Base de Datos Estadísticos de Comercio Exterior (BADECEL). Available online: http://interwp.cepal.org/badecel/index.html (accessed on 20 June 2017).
  65. UN. Statistics Division UN Comtrade. Available online: https://comtrade.un.org/data/ (accessed on 20 June 2017).
  66. United States Geological Survey (USGS). Mineral Commodity Summaries 2013; USGS: Reston, VA, USA, 2013; p. 198.
  67. Carrera, P.; Castillo, T.; López, J.; Rivadeneira, T.; Segura, K. Informe de Estadísticas Energéticas 2015; OLADE: Quito, Ecuador, 2015. [Google Scholar]
  68. United States Geological Survey (USGS). International Minerals Statistics and Information; USGS: Reston, VA, USA, 2017.
  69. Human Rights Watch. A Poisonous Mix Child Labor, Mercury, and Artisanal Gold Mining in Mali; Human Rights Watch: New York, NY, USA, 2011. [Google Scholar]
  70. MMSD. Bolivia Estudio Regional/Nacional sobre Pequeña Mineria y Artesanal. Reporte; MEDMIN Foundation: La Paz, Bolivia, 2003. [Google Scholar]
  71. Telmer, K.; Stapper, D. A Practical Guide Reducing Mercury Use in Artisanal and Small-Scale Gold Mining; UNEP: Nairobi, Kenya, 2012. [Google Scholar]
  72. The Global Initiative against Transnational Organized Crime. Organized Crime and Illegally Mined Gold in Latin America; The Global Initiative: Geneva, Switzerland, 2016. [Google Scholar]
  73. International Copper Study Group (ICSG). The World Copper Factbook 2014; ICSG: Lisbon, Portugal, 2014. [Google Scholar]
  74. Secretaria de Energía de México Sistema de Información Energética. Available online: http://sie.energia.gob.mx/bdiController.do?action=cuadro&cvecua=IE7C01 (accessed on 19 January 2018).
  75. Harper, E.M.; Bertram, M.; Graedel, T.E. The contemporary Latin America and the Caribbean zinc cycle: One year stocks and flows. Resour. Conserv. Recycl. 2006, 47, 82–100. [Google Scholar] [CrossRef]
  76. Schandl, H.; Fischer-kowalski, M.; West, J.; Giljum, S.; Dittrich, M.; Geschke, A.; Lieber, M.; Schaffartzik, A.; Krausmann, F. Global Material Flows and Resource Productivity; UNESCO: France, Paris, 2016; ISBN 9789280735543. [Google Scholar]
Figure 1. Non-fuel mineral production in LA-20 from 1995 to 2013 in mass terms expressed in million tonnes (left) and in exergy terms expressed in Mtoe (right). Only the minerals that can be seen in the figures are shown in the legend.
Sustainability 10 00723 g001
Figure 2. Sankey diagrams for Brazil, Chile, and Mexico for 2013 expressed in million tonnes (upper row) and in Mtoe (lower row) for selected substances.
Sustainability 10 00723 g002
Figure 3. Non-fuel minerals exported by destination in ERC terms (Mtoe) for 2013. Due to the scale, some minerals are not included in the legend.
Sustainability 10 00723 g003
Figure 4. The remaining minerals exported by destination in ERC terms (Mtoe) for 2013. Due to the scale, some minerals are not included in the legend.
Sustainability 10 00723 g004
Table 1. Main exergy replacement costs for the current study in GJ per tonne of element (source: [54]).
Mineral OreERC (GJ/t)
Non-fuel minerals
GoldNative gold553,250
SilverArgentite7371
ZincSphalerite1627
CopperChalcopyrite292
LeadGalena37
LimestoneCalcite3
Phosphate rockFluorapatite0.4
Fuel minerals
Crude Oil 46.3
Coal 24.3–31.6
Natural Gas 39.4
Note: 1 GJ = 2.39 × 10⁻⁸ Mtoe.
Table 2. Comparison between LA-20 and EU-28.
LA-20 (2013 Data)EU-28 (2011 Data)
DE/DMCI/DMCE/DMCDE/DMCI/DMCE/DMC
Non-fuel minerals
Mass1.880.111.000.790.300.09
ERC1.500.160.660.450.940.40
Fossil fuels
Mass1.360.240.590.520.620.13
ERC1.350.220.570.410.760.17
Table 3. Ratios of domestic extraction (DE/DMC), imports (I/DMC), and exports (E/DMC) over domestic material consumption for each country in exergy replacement cost (ERC) terms for fossil fuels and non-fuel minerals in 2013.
CountryDMC (Mtoe)DE/DMCI/DMCE/DMC
Argentina73.901.070.160.23
Bolivia15.222.290.001.29
Brazil669.621.160.210.37
Chile63.371.380.330.71
Colombia37.523.270.052.32
Costa Rica−6.640.00−0.22−1.22
Cuba10.660.500.500.00
Dominican Republic16.670.910.170.08
Ecuador10.712.910.001.91
El Salvador−1.97−0.46−0.15−1.61
Guatemala0.111.000.000.00
Honduras1.130.940.060.00
Mexico148.051.590.180.78
Nicaragua0.710.181.000.18
Panama0.022.160.151.31
Paraguay0.070.430.570.00
Peru28.872.920.182.09
Uruguay2.220.060.960.02
Venezuela113.661.940.020.95
Average LA-2062.311.430.190.62

