Article

Modeling the Effects of Introducing Low Impact Development in a Tropical City: A Case Study from Joinville, Brazil

Unit of Environmental Engineering, University of Innsbruck, 6020 Innsbruck, Austria
*
Author to whom correspondence should be addressed.
Sustainability 2018, 10(3), 728; https://doi.org/10.3390/su10030728
Submission received: 5 February 2018 / Revised: 1 March 2018 / Accepted: 5 March 2018 / Published: 7 March 2018
(This article belongs to the Special Issue Urban Water Management)

Abstract

:
In tropical countries like Brazil, fast and uncontrolled urbanization, together with high rainfall intensities, makes flooding a frequent event. The implementation of decentralized stormwater controls is a promising strategy aiming to reduce surface runoff and pollution through retention, infiltration, filtration, and evapotranspiration of stormwater. Although the application of such controls has increased in the past years in developed countries, they are still not a common approach in developing countries, such as Brazil. In this paper we evaluate to what extend different low impact development (LID) techniques are able to reduce the flood risk in an area of high rainfall intensities in a coastal region of South Brazil. Feasible scenarios of placing LID units throughout the catchment were developed, analyzed with a hydrodynamic solver, and compared against the baseline scenario to evaluate the potential of flood mitigation. Results show that the performance improvements of different LID scenarios are highly dependent on the rainfall events. On average, a total flood volume reduction between 30% and 75% could be achieved for seven LID scenarios. For this case study the best results were obtained when using a combination of central and decentral LID units, namely detention ponds, infiltration trenches, and rain gardens.

1. Introduction

Flooding is the most common environmental hazard worldwide [1]. Due to urbanization, streams and rivers are channelized and straightened, and large surface areas become impermeable, which exacerbate this problem [2,3,4,5]. In Brazil, fast and uncontrolled urbanization, together with increased precipitation rates, makes flooding a frequent event. In urban areas, drainage networks are implemented to collect and divert rainwater in events of precipitation. However, these networks are not always sufficient to collect and discharge all the runoff produced by a heavy rain event, often leading to urban flooding. Traditionally, urban drainage planning focused on the rapid discharge of stormwater runoff through underground infrastructure. From economic and engineering aspects, the capacities of such infrastructure are limited and based on historically-determined design rainfall events [6].
In many cases replacing the existing drainage networks is related to high costs and does not integrate the concept of sustainability [7]. Therefore, decentralized stormwater controls are a promising strategy which offer multiple advantages [8]. From a hydrological perspective, such ‘near-nature’ concepts reduce the runoff volume and the peak flow due to increased infiltration and temporal storage of water at the surface. As a result, these controls provide a higher hydraulic capacity of the stormwater networks which are stressed from increasing urbanization, overburdened infrastructure, and changing weather patterns induced by climate change [9,10,11]. Such ‘near-nature’ concepts can be called green infrastructures (GI), water-sensitive urban design (WSUD), best management practices (BMP), sustainable urban drainage systems (SUDS), low-impact development (LID), among other terminologies, depending on the geographic region and the scale of implementation [12]. LID techniques are small-scale stormwater controls, like green roofs, bioretention cells, infiltration facilities, stormwater ponds, and rainwater harvesting systems, among others. They aim to reduce surface runoff and pollution through retention, infiltration, filtration, and evapotranspiration of stormwater. LIDs address a wider range of objectives than conventional systems, making it a more integrated and sustainable approach in the field of urban drainage and water resource management [13,14,15,16,17].
In developed countries, such decentralized stormwater controls are strongly supported, wherein some countries even demand their application in legislation [18,19]. In such countries, LID has been widely adopted and successfully proven [11]. Socio-economic factors in developing countries make it more difficult to solve problems related to water protection as compared to developed countries [4]. Especially considering a large number of Brazilian cities, increased difficulties due to higher rainfall, insufficient economic means, and the lack of environmental awareness and public acceptance often prevent further development of stormwater controls [2].
Therefore, stormwater management objectives in developing countries with tropical climate regularly differ from those in developed countries. While developed countries usually have an environmental emphasis on stormwater quality [20,21], developing countries still mainly set their focus on flood protection, with Brazil being no exception [4]. Due to high rainfall intensities and the subsequent related urban flood risk, stormwater sewers are usually installed prior to wastewater networks. With the absence of sanitary facilities, domestic wastewater is commonly drained to the stormwater system, leading to high pollutant loads discharged into the receiving waters [22]. Stormwater quality is, therefore, not a priority. Silveira [4], Armitage [23], and Goldenfum et al. [24] addressed the above-mentioned challenges of implementing sustainable urban drainage systems with special focus on developing countries.
Various studies have analyzed the hydrological performance of LIDs in all kinds of climates. Qin et al. [25] investigated the use of three LID techniques (swales, permeable pavements and green roofs) in a catchment in Shenzhen, China, a city that suffers from heavy storms during the typhoon season from June to August. The results showed that all three LID controls responded well to total flood control, but their performance vary significantly depending on the peak flow location. Schmitter et al. [26] developed an integrated urban water cycle model to assess the effects of green roof deployment in Singapore, with results showing positive impacts on flood protection. The climatic conditions of their case study are characterized by two monsoon seasons, with no distinctive dry and wet periods. Son et al. [15] developed and verified a LID-based district unit planning (LID-DP) model in Cheongju City, Republic of Korea, with simulation tests, indicating a runoff reduction among other positive effects on water quality. Weather conditions in Korea are characterized by torrential downpours in high summer (June to August).
Sun et al. [27] evaluated the use of BMP and LIDs in a parking slot in Lenexa, KS, USA obtaining significant stormwater control for small rainfall events, but less control for flood events. With a humid subtropical climate, Lenexa has mild winters and hot, humid summers, with occasional severe thunderstorms. Jackisch et al. [28] investigated the hydrologic performance of a small LID site by monitoring precipitation, discharge, and streamflow in Freiburg, Germany. The results implied that site-level LIDs provide an alternative to conventional stormwater management even for unfavorable conditions, such as the weak performance related to underground storage, prior conditions, storm characteristics, and seasonally-occurring freezing periods. Chaosakul et al. [29] worked on modeling single and multiple LID technologies in a case study of a peri-urban village near Bangkok, Thailand, to preliminary explore LID benefits in terms of stormwater quantity and quality. The combined rain barrel and bioretention cell scenarios offered the greatest control in reducing surface flooding, although implementation costs may prevent the realization in Thailand at present. Bangkok is influenced by the South Asian Monsoon system, having two-year return period storms comparable to a 50-year or 100-year return period storms in Northeastern North America.
The software SWMM (Storm Water Management Model) is often used for hydrodynamic sewer modelling and the analysis of LIDs. Baek et al. [30] proposed a methodology to optimize LIDs in a commercial site in Korea by monitoring the model under intensive stormwater. Six different LID types were analyzed to mitigate the first flush effect. Bacchin et al. [8] introduced an integrated tool using the ArcGIS (Arcmap 10.22) and SWMM platform to analyze the spatial configuration and composition of the urbanized landscape, using the city of Porto Alegre, Brazil as an example. The design of nested networks of green, blue, and grey spaces was applied to the area. Palla et al. [31] simulated the hydrologic effects of implementing green roof at the catchment scale in Genoa, Italy. The modelling of green roof performances was undertaken using SWMM and the results demonstrated that widespread green roof implementation can significantly reduce peak runoff rates. Zischg et al. [17] evaluated the introduction of LIDs as an interaction of ‘gray’ and ‘green/blue’ structures in case study in the city of Kiruna, Sweden. Three planning alternatives were simulated using SWMM and the Info-Gap robustness pathway method was used to evaluate the performance levels at the different stages during the implementation process.
The focus of this paper is to evaluate the effectiveness of LID techniques in an area of high rainfall intensities in Joinville, South Brazil. Different scenarios implementing decentralized stormwater controls throughout the catchment were created and compared against the baseline scenario to evaluate flood mitigation. The performance of the urban drainage systems is assessed through numerical rainfall-runoff simulation with the help of a hydrodynamic modelling software. Although the selected study area is an exceptionally difficult terrain to use LID techniques for flood mitigation objectives, the strategy of LID implementation is still promising, but requires special attention on the design. The high degree of imperviousness, a shallow drainage network with areas of very low slope, tidal influence, and poor infiltration rates of the natural soil contribute to the earlier-described complications regarding drainage in the area. In this work, the decentralized stormwater controls will only be analyzed for flood mitigation. Other positive effects, such as water quality improvements and increased groundwater recharge through infiltration, were not considered for their minor significance in the investigated area.
Table 1 compares the average rainfall in mm per month for some of the above-mentioned cities (rainfall intensity goes from blue—light to red—heavy). Since summer and winter are reversed in some of the cities and others, like Bangkok, have no distinctive seasons, comparing monthly precipitation rates can be confusing. For a better understanding, the monthly rates have been arranged from the lowest to the highest for each city. This shows that rainfall intensities in the city of Joinville during the rainy season are comparable to cities like Shenzhen, Bangkok, or Singapore, which must cope with intense precipitation during monsoon or typhoon seasons.

2. Materials and Methods

2.1. Case Study Area

The case study area is a neighborhood called Boa Vista, located east of the city center of Joinville, Brazil, next to the shore of the estuary. The area covers a total of 356 ha. In the western part lie the steep slopes of the Morro da Boa Vista that reach up to about 200 m. The rest of the area consists of flat plains with altitudes below 10 m above sea level meaning the stormwater system is affected by tides. The lower regions of the area used to be dense mangrove forests that have now given place to the existing settlement [35].
The stormwater drainage system in Boa Vista mostly encompasses circular conduits ranging from 0.4 m to 1.5 m in diameter. Additionally, rectangular open and closed channels with cross-sections up to 1.9 × 2.0 m were applied in a couple of streets. Approximately 25% of the channels have a slope lower than 1‰, which can lead to deposition problems. Additionally, the hydraulic capacity of conduits with slopes as little as these is very limited. In comparison with European standards, typical values for minimum slopes range between 1‰ and 4‰, which are based on calculated minimum shear stress and empirical values to prevent deposition in conduits [36].
Another issue regarding the risk of flooding, is the low installation depth of pipes in flat areas where channels at full capacity have only a small potential of surcharging until flooding is caused. Furthermore, in large parts of the study area only very low conduit slopes are possible, which further increases the risk of urban flooding. The main receiving water body of the stormwater system is the Rio Cachoeira, which runs along the southeast boundary of the catchment area. Due to the proximity of the river’s mouthing and the associated low invert levels of the outfalls, the system is influenced by tidal movements, resulting in backflow during intense rain events that are concurrent to high tide levels.

2.2. Model Development

The dynamic rainfall-runoff simulation model PCSWMM (CHI Water) [37] was used for investigating the scenarios of different LID techniques and placement strategies. PCSWMM is a software based on the U. S. Environmental Protection Agency (EPA) Storm Water Management Model (SWMM) [38]. SWMM is a well-known model used for hydrodynamic approaches [39,40,41] and also allows for a range of different LID controls to be modeled in a simulation to retain and temporarily store stormwater runoff from a site [29,42,43]. They are represented by a combination of vertical layers with properties defined on a per-unit-area basis. This permits generic placement of LIDs of the same design throughout different subcatchments of the study area [44]. The computation works on a time step basis by solving a set of flow continuity equations that describe the change of water content in each layer as the difference between inflows and outflows [45].
For defining the various LID controls that can be selected in SWMM, the user must assign values to numerous design parameters. Due to the growing popularity in LID techniques in recent years, state agencies and other stormwater-related institutions have published design manuals that suggest appropriate parameter ranges for many key parameters [44].
The computer model of the case study area in Boa Vista, Joinville, was created using topographical, pedological, and land use information, as well as data of the existing stormwater system. All data was obtained from the geographic information system (GIS) of the city of Joinville [46]. Based on the orthophoto of the area, four different land uses (forest, grass, exposed soil, and impervious areas) were defined. With this information, together with the hydrologic soil classes, the infiltration capacity for each subcatchment was calculated, according to the National Resources Conservation Service (NRCS) (formerly called the Soil Conservation Service—SCS) Curve Number (CN) method. Figure 1 provides the information of the spatial distribution of soil groups within the case study area. Rossman [44] provides a table with land use related to hydrologic soil group for CN calculation. Table 2 shows the soil groups, their saturated hydraulic conductivities Ks, and their classifications. For this model, the tabulated values reach from 25 (very good infiltration) to 98 (very poor). Notably, the mangrove areas, which constitute most of the lower lying regions, receive in its total area a curve number of 98 regardless of the land uses. This means almost no infiltration occurs in these areas, therefore, they do not belong in any class of the CN table.
Additional parameters, such as the depth of the depression storages, the share of impervious area without LID area, the surface roughness for overland flow (Mannings’s n-value), and the drying time of the soil were chosen according to suggested values from the SWMM manual [44]. The most important simulation parameters applied are listed in Table 3.
Climate and precipitation data were obtained from the city of Joinville. The rain data were obtained from records of the meteorological station 2648014 (RVPSC), which is in close proximity to the study area. Rainfall records from 2007 until 2017 were available and used for continuous simulation. Design storms for single event simulations were derived from Lopes’s rain equation [47]:
i T , d = 1.14 * e 1.5 * ln ( ln d 7.3 ) * ( 75.802 27.068 * ln ( ln ( 1 1 T ) ) 15.622 d
This equation provides the block rain intensity (iT,d) as a function of the chosen rain duration (d) and return period (T). From that, Euler-type II [48] design storms were derived. These rainfall patterns resemble long-term events with an integrated heavy rainfall peak [49]. The precipitation hyetograph (distribution of rainfall over time) can be derived from an intensity-duration-frequency (IDF) curve. The peak intensity is reached at a third of the event’s duration. Note that the maximum interval intensity may not exceed the intensity of a storm with the intervals duration and equal return period. For the exact procedure see Rauch and De Toffol [50]. In the first instance, a flood analysis has been conducted using 15-min block rain events and 180-minute Euler-type II design storms with return periods of 2 and 10 years, respectively. The temporal resolution of the precipitation data was set to five-minute intervals. Figure 2 represents the stormwater system in PCSWMM. Due to the topography, hydraulic performance of the system is limited. Further, the high fraction of impermeable surfaces accelerates the runoff concentration process, thereby exacerbating the flood impacts.
The common procedure of creating a rainfall-runoff model includes the processes of calibration and validation to ensure that simulation results are realistic. For a rainfall-runoff simulation, this requires measurements of input (precipitation) and output data (discharge rate, volume, or water levels) simultaneously to describe their relation in a particular area. Certain parameters (e.g., surface roughness, depression storage) are suited calibration parameters to readjust a simulation model, in order to resemble measured results. Once a model is calibrated, the validation is used to approve the universality of the model under different rainfall conditions. In the case of the present study, it was not possible to conduct these two procedures because real-time measurements of precipitation and discharges were not available. To deliver valuable results despite this restriction, simulation parameters (general and LID-specific) were carefully selected and compared with other studies. The comparison between the baseline scenario and various LID scenarios still enables a qualitative comparison of the different scenarios, even though the exact rainfall-runoff relation was not entirely known in advance.

2.3. Decentralized and Central LID Placement

The implementation of LIDs in SWMM is done in two steps. In the first step, the LID type is chosen and defined in its technical properties by several parameters (e.g., berm heights, layer thickness, hydraulic conductivity, porosity, etc.). In the second step, the implementation and geospatial distribution of LIDs on the subcatchments of the study area is set in the LID usage editor. Here, the LID area and the intercepted runoff fraction from impervious areas are stated. The parameters that define the size and properties of the LID controls used in a simulation can be defined by the user. The SWMM manual (Vol. III) [45] offers some assistance by recommending ranges for most of the parameters, which are based on several LID design manuals.

2.3.1. Sensitivity Analysis

Primarily, individual LID tests were conducted. Therefore, only one LID control of a certain type was used on a subcatchment to study its behavior in detail. All LID controls available in SWMM were investigated, but some were considered unsuitable for the area for different reasons. The options that performed best where rain gardens and infiltration trenches. For these LIDs, the maximum areas used were 5% and 10% of the subcatchment. The devices were designed with underdrains due to low infiltration potential of natural soil. Design parameters (e.g., layer thickness, conductivity, suction head, drain coefficient, etc.) were analyzed in a sensitivity analysis. Regarding the construction area for the stormwater controls, rain gardens could be built on private property, while infiltration trenches may be located mainly on public land, along the streets.
In the following, the procedure of the sensitivity analysis is described. The aim is to determine which LID parameters have the most significant influence on hydraulic sewer network performance. In this process the best parameter combination for each LID-technique is sought with regard to the peak flow reduction. Firstly, various sets of parameters were investigated until they showed reasonable results. Each parameter was changed manually within predefined ranges (minimum, average, maximum) based on several references [27,29,30,45,51].
The effects on the system were observed and the most influencing parameters (causing a peak flow reduction higher than 10%) were chosen for variation in an automated sensitivity analysis. The numerical computing environment MATLAB [52] was used to conduct numerous simulations in PCSWMM. Starting with the initial parameter set, each parameter was changed at a time within the defined range (see column ‘Step’ on Appendix A) until the optimum value was found. At this stage, the limited hydraulic head in some areas of the catchment for LIDs using an underdrain was respected, resulting in two design versions for infiltration trenches and rain gardens (0.5 m and 1.0 m total depth).

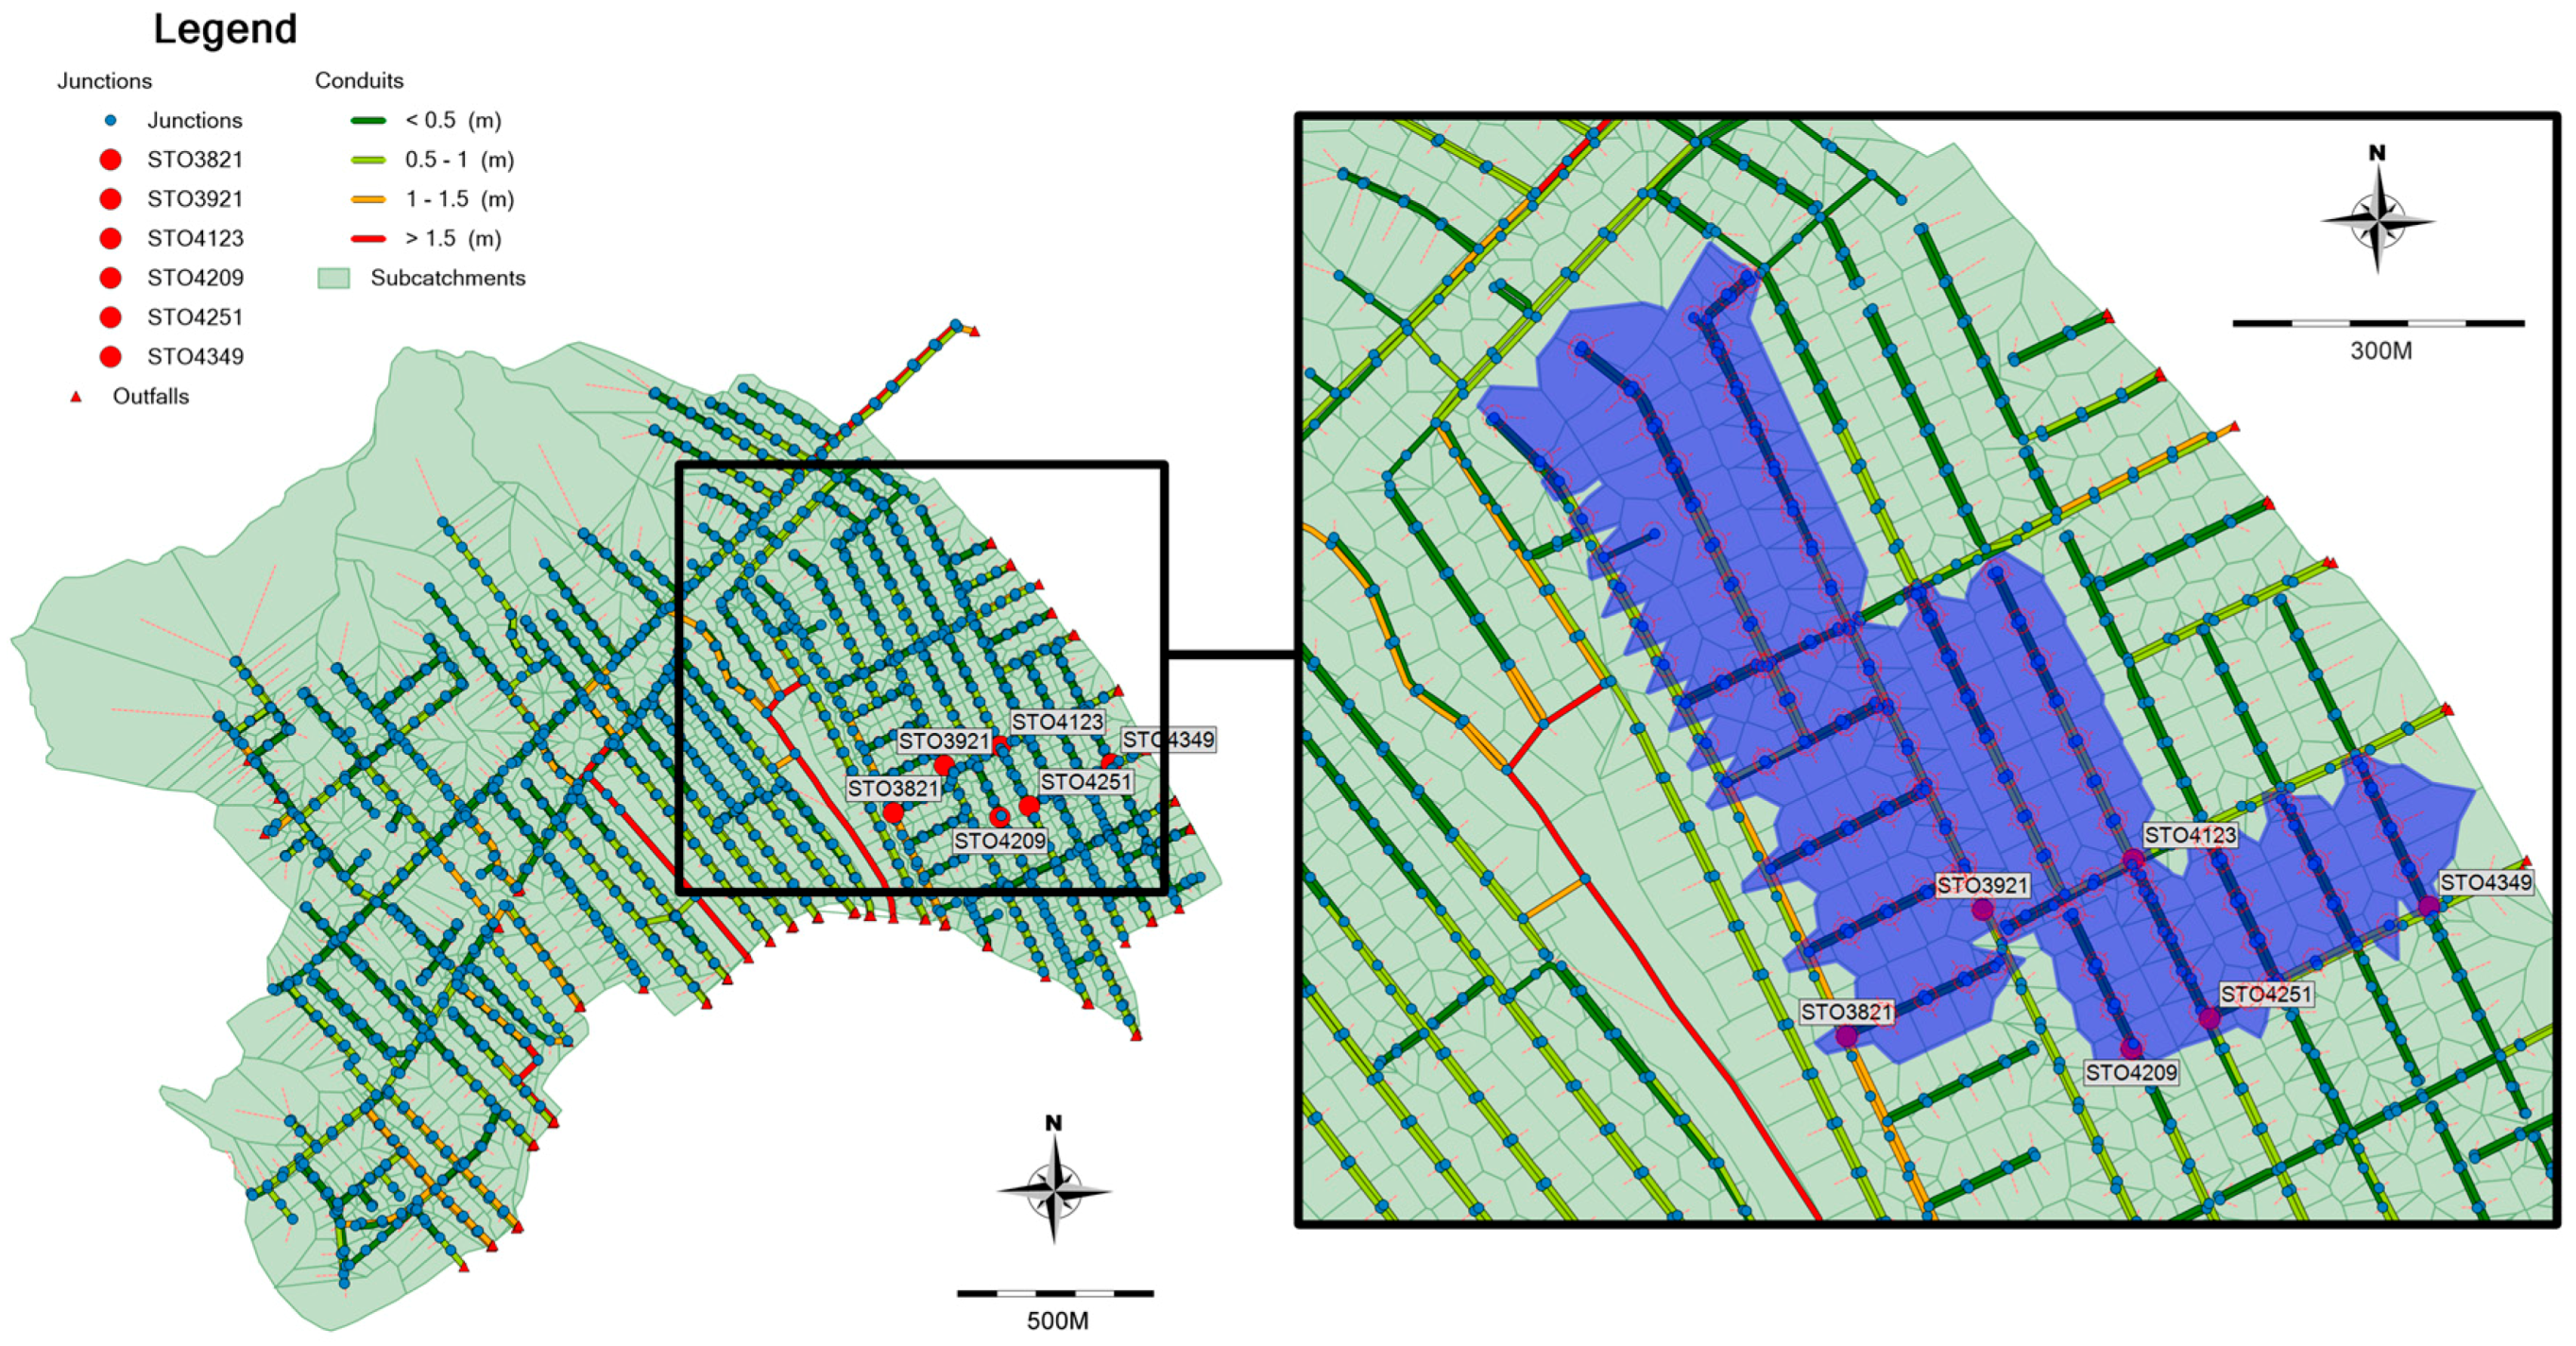
2.3.2. Detention Pond Design

In addition to the implementation of decentralized LIDs (rain gardens and infiltration trenches), the performance of centralized treatment facilities was assessed. Detention ponds that would capture runoff from larger areas were implemented in places with strong flood impacts. For the modelling in PCSWMM, storage units were applied at existing nodes of the drainage network. Due to the poorly-inclined terrain, it was necessary to convey the inflows through pumps into the detention ponds. For the discharge to the downstream drainage network, orifices were used. The locations for detention ponds were chosen manually. The areas with large concentrations of upstream flooded nodes were selected and the nodes that could potentially be converted into a storage were chosen. The placement of the detention ponds was only based on the potential of flood mitigation—practical matters of available space for such measures were not considered in this preliminary examination. For the automated design of the detention ponds, a fixed depth of 2 m was defined. The required area was determined through an iterative process using MATLAB to reach, approximately, a 90% filling level for a design storm event with a return period of 10 years. Additionally, the diameter of the orifices was varied with an automatic script to find a configuration to minimize downstream flooding (which occurred in some cases as a result of the storage unit deployment) and area use.

2.3.3. Scenario Analysis

Based on the individual analysis of decentralized and centralized LID technologies, seven LID scenarios addressing different LID types, LID sizes, and LID combinations were developed and analyzed for their suitability as catchment-wide implementation. Table 4 summarizes the investigated scenarios to determine the effects on the hydraulic performance of the sewer system.
The authors are aware that the modelling configuration applied to the introduced scenarios is a simplification of a realistic facility (e.g., ideal pumps, which immediately transfer any inflow towards the storage, without a capacity limit). However, it is assumed that these issues can be solved in a realistic scenario.
The three most important indicators to assess the flood mitigation performance of the scenarios used for the case study are listed below:
  • Total system flood volume
  • System peak flood rate
  • Number of flooded nodes (>1 m³ flood volume)
A reduction of these three values means an improvement in flood prevention because damages caused by flooding will be reduced.

3. Results

3.1. Design Storms and Continuous Rainfall Analysis

For the evaluation of the selected LID scenarios, the scenarios were simulated using the 10-year design storm they were originally designed for. The two-year event was also evaluated. Additionally, the three strongest rainfall events were extracted from the recorded long-term series, simulated and evaluated. Figure 3 illustrates the rainfall distribution of all five events (the axis have different scaling). Table 5 shows the three real rain events and the two Euler-type II design storms used to evaluate the scenarios. The total flood volume refers to the baseline case scenario where no LIDs are implemented.

3.2. Sensitivity Analysis

Table 6 shows the results for the peak flow reduction of the LID techniques examined during the sensitivity analyses for the Euler-type II design storms (EulerII (T = 10) and (EulerII (T = 2)). Rain gardens reduced the flow rate by 16% and 20%, respectively (design versions with 0.5 m and 1.0 m depth) during the larger storm and 14% and 18% in the two-year event. Infiltration trenches managed to retain even more runoff to reduce the peak. Appendix A shows all LID control parameters in PCSWMM, its values, and the peak flow variations.

3.3. Detention Pond Design

The achievable flood volume reduction when implementing single detention ponds to the specific subcatchments ranged from approximately 3% to 20% in relation to the total flood volume of the entire catchment area during the 10-year design storm event (baseline scenario). Six locations within the catchment were chosen to implement detention ponds (see Figure 4).
With the implementation of the six detention ponds shown in Figure 4, a total flood volume reduction of more than 50% was attained. Although the contributing drainage areas of some of the detention ponds might not appear very large, the influence on the total flood volume of the catchment was considerable (see Table 7).

3.4. Scenario Analysis

Table 8 illustrates the required area for implementation of decentralized LIDs and detention ponds, and the impervious area connected to LIDs and detention ponds. Runoff volumes that are treated by the respective stormwater controls will be shown among the results.

3.4.1. Reduction of Total Flood Volume

Figure 5 lists the percentage reduction of the flood volume in the entire catchment for all scenarios and all rainfall events evaluated. It shows that infiltration trenches perform generally better, compared to rain gardens, when occupying the same area. Only for the event EV09, which has the highest total precipitation amount (91.2 mm), rain gardens were more effective, reducing the flood volume by 25% vs. 23% for the infiltration trench scenario when using 5% of the subcatchment area. When using 10% of the subcatchment area, the flood volume was reduced by 42% and 40%, respectively. The reason for this behavior is a large overflow volume from infiltration trenches that is discharged during generally high utilization of the drainage network capacity, thereby increasing flood impacts. Furthermore, the increase in performance between an area occupation of 5% and 10% is more significant (relatively and absolute) for the rain garden scenarios (30% to 50%) compared to the infiltration trench scenarios (39% to 55%).
The scenarios using detention ponds perform significantly poorer during the event EV09, which can be explained by the overflowing of several ponds. Under realistic conditions, this problem may be solved by implementing an emergency spillway for larger storms, which is able to convey the excess runoff safely to the receiving water. The combined scenario using infiltration trenches shows better performance than the one using rain gardens, which was expected since results in the respective decentralized scenarios were comparable.

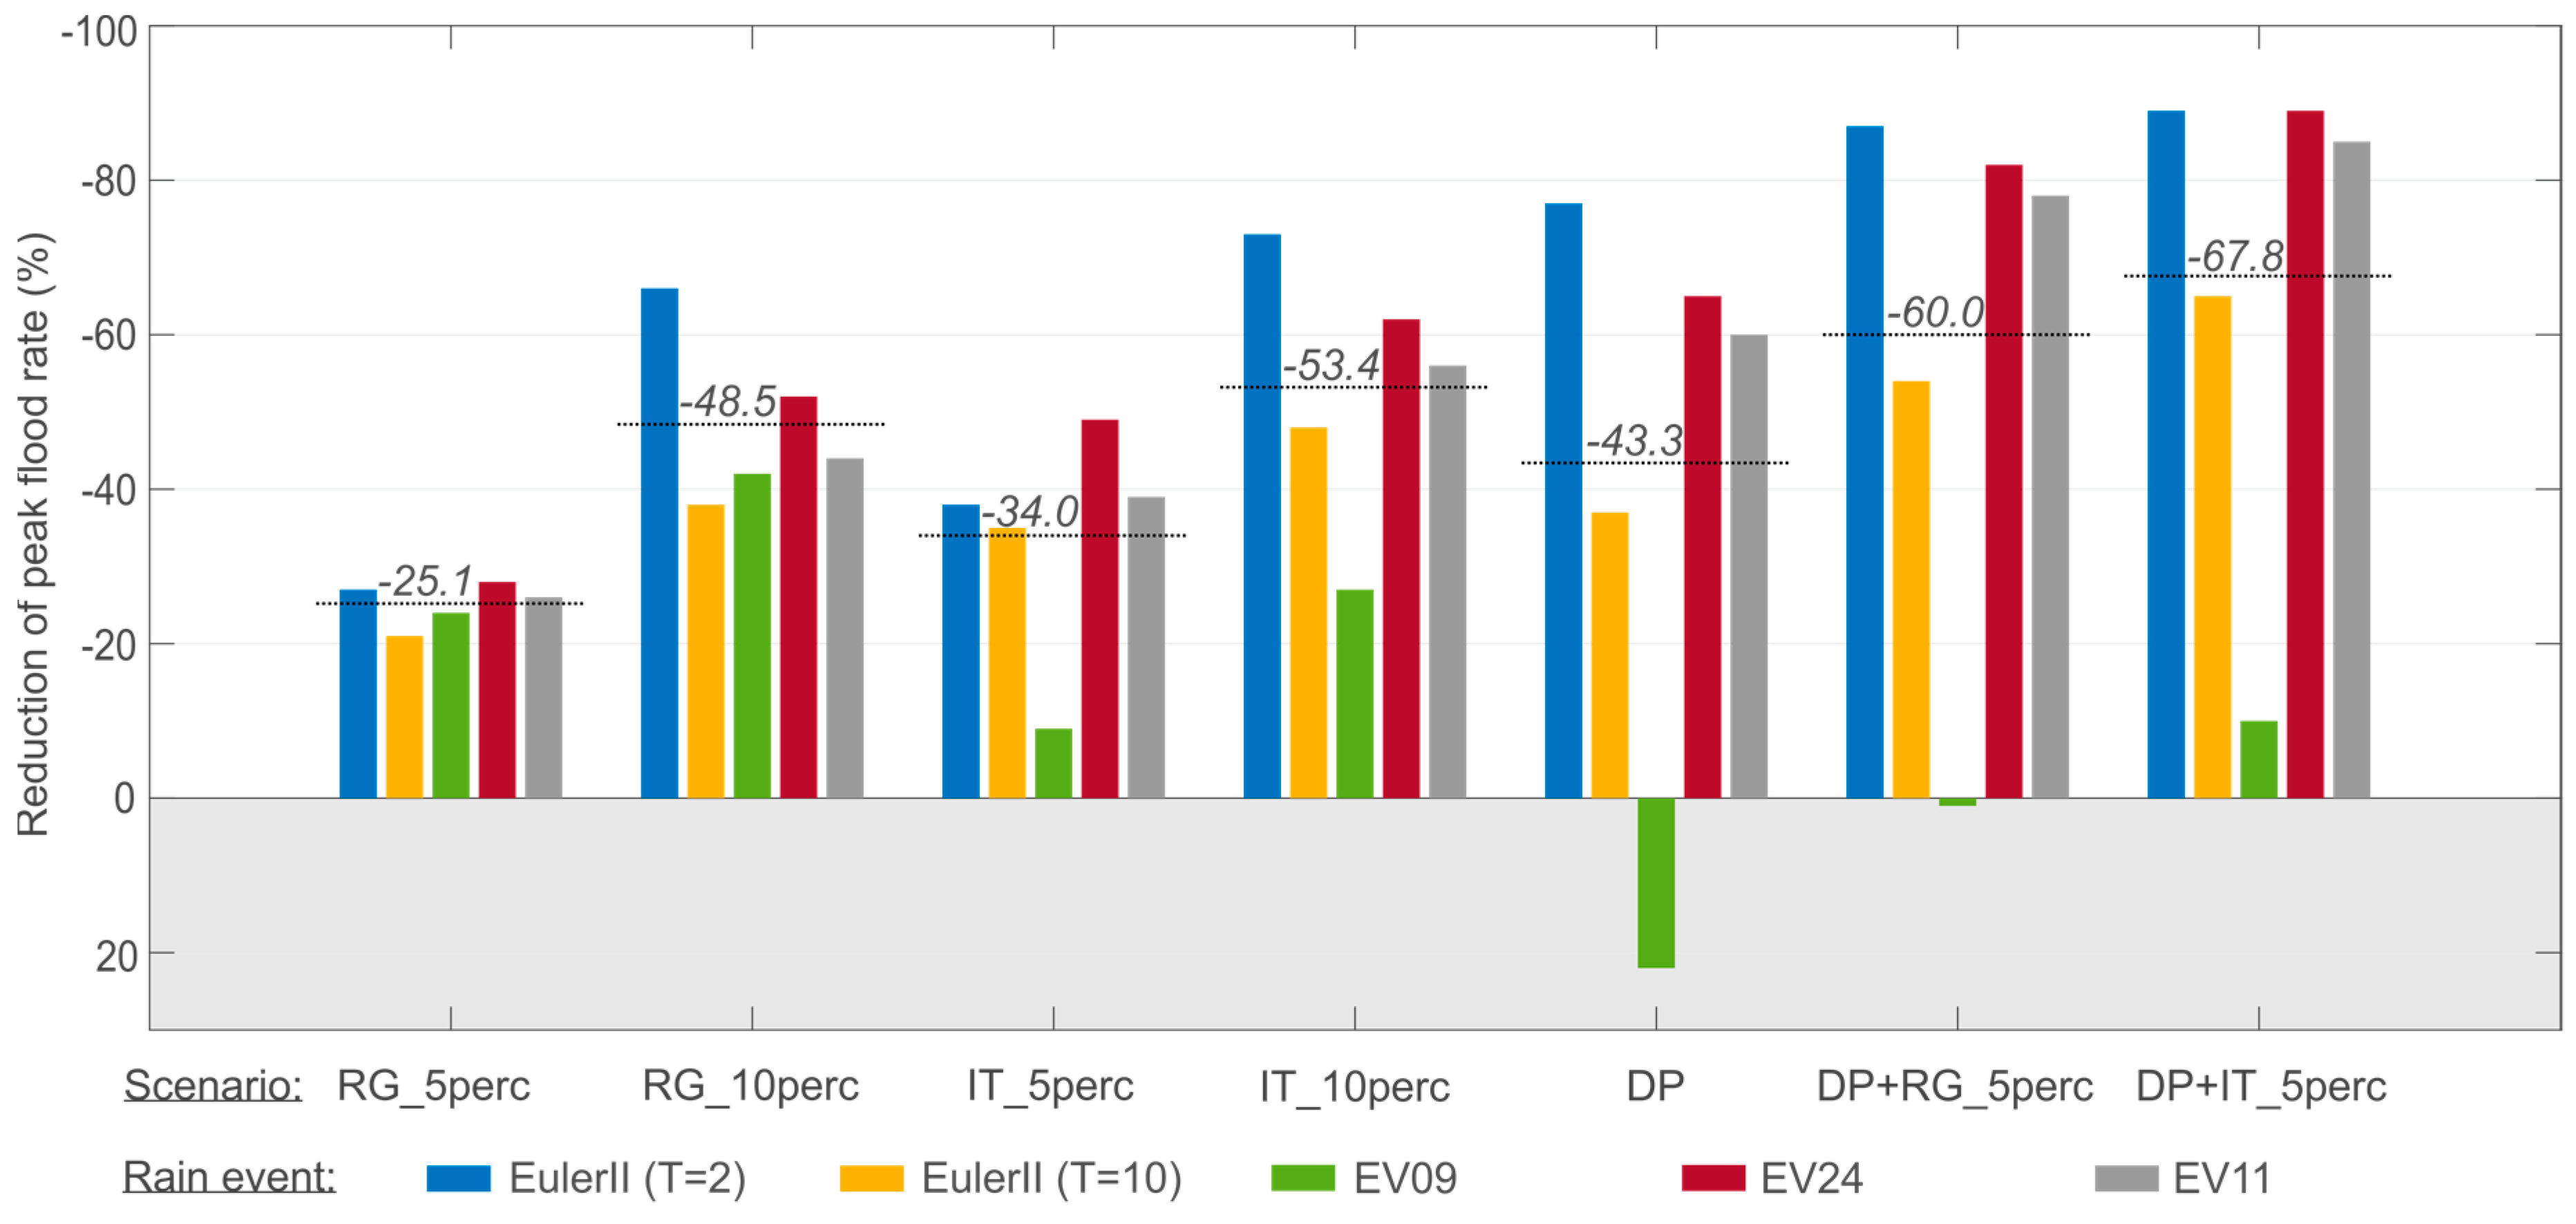
3.4.2. Reduction of the Peak Flood Rate

The reduction of peak flood rates (see Figure 6) delivers a picture much alike the one of flood volume reduction shown in the previous chart. Again, the results in all scenarios apart from the decentralized rain garden scenarios, show a decline in effectiveness for the event EV09 that happens due to the overflowing of decentralized and centralized controls. The influence of this, in the detention pond scenarios, is that large peak-flood rates even exceed those of the baseline scenario, except for the scenario DP+IT_5perc. The difference between the two combined scenarios was identified as different timing of overflowing LIDs and storage units, which superpose in the rain garden scenario in an unfavorable way. Hence, the DP+IT_5perc scenario reduces the peak flood rate by 10%, while the scenario DP+RG_5perc causes an increase of 1%.

3.4.3. Reduction of Flooded Nodes

The reduction of flooded nodes is illustrated in Figure 7. During the EulerII (T = 10), all scenarios show the worst results, compared to the other events. This storm has by far the highest rainfall peak intensity with 171.5 mm/h (EulerII (T = 2): 99.3 mm/h, EV09: 87.6 mm/h, EV24: 128.4 mm/h, EV11: 139.0 mm/h). In all scenarios, the best results are achieved for the EulerII (T = 2) that has the second lowest peak intensity. As for the other performance indicators, the results of the two combined scenarios are quite similar, while in the scenarios using exclusively decentralized controls, the infiltration trench has better performance on average.
It is noteworthy that the application of infiltration trenches on 195 subcatchments, occupying 10% of their area causes quite similar flood mitigation as the scenario in which six detention ponds are deployed. Namely, a reduction of total flood volume by 56% for both scenarios and reductions of flooded nodes by 52% vs. 50%. For the reduction of the peak flood rate, the average results differ somewhat more (53% vs. 43%) which can be explained by outlier event EV09, which causes large storage overflow rates. Assuming the implementation of emergency spillways for the detention ponds to prevent urban flooding, the results could be even closer.
It is difficult to affirm which of the indicators is the most conclusive since it is not clear which damages are associated to a certain flood volume or with a certain peak flood rate of the system. Additionally, the number of flooded nodes does not necessarily explain the flood impacts in a particular catchment, but it is an indicator for the spatial extent of the flooded area. Since no detailed analysis on damages caused was performed, the stated indicators were used to give a general idea about flood mitigation potential of LIDs in the study area.

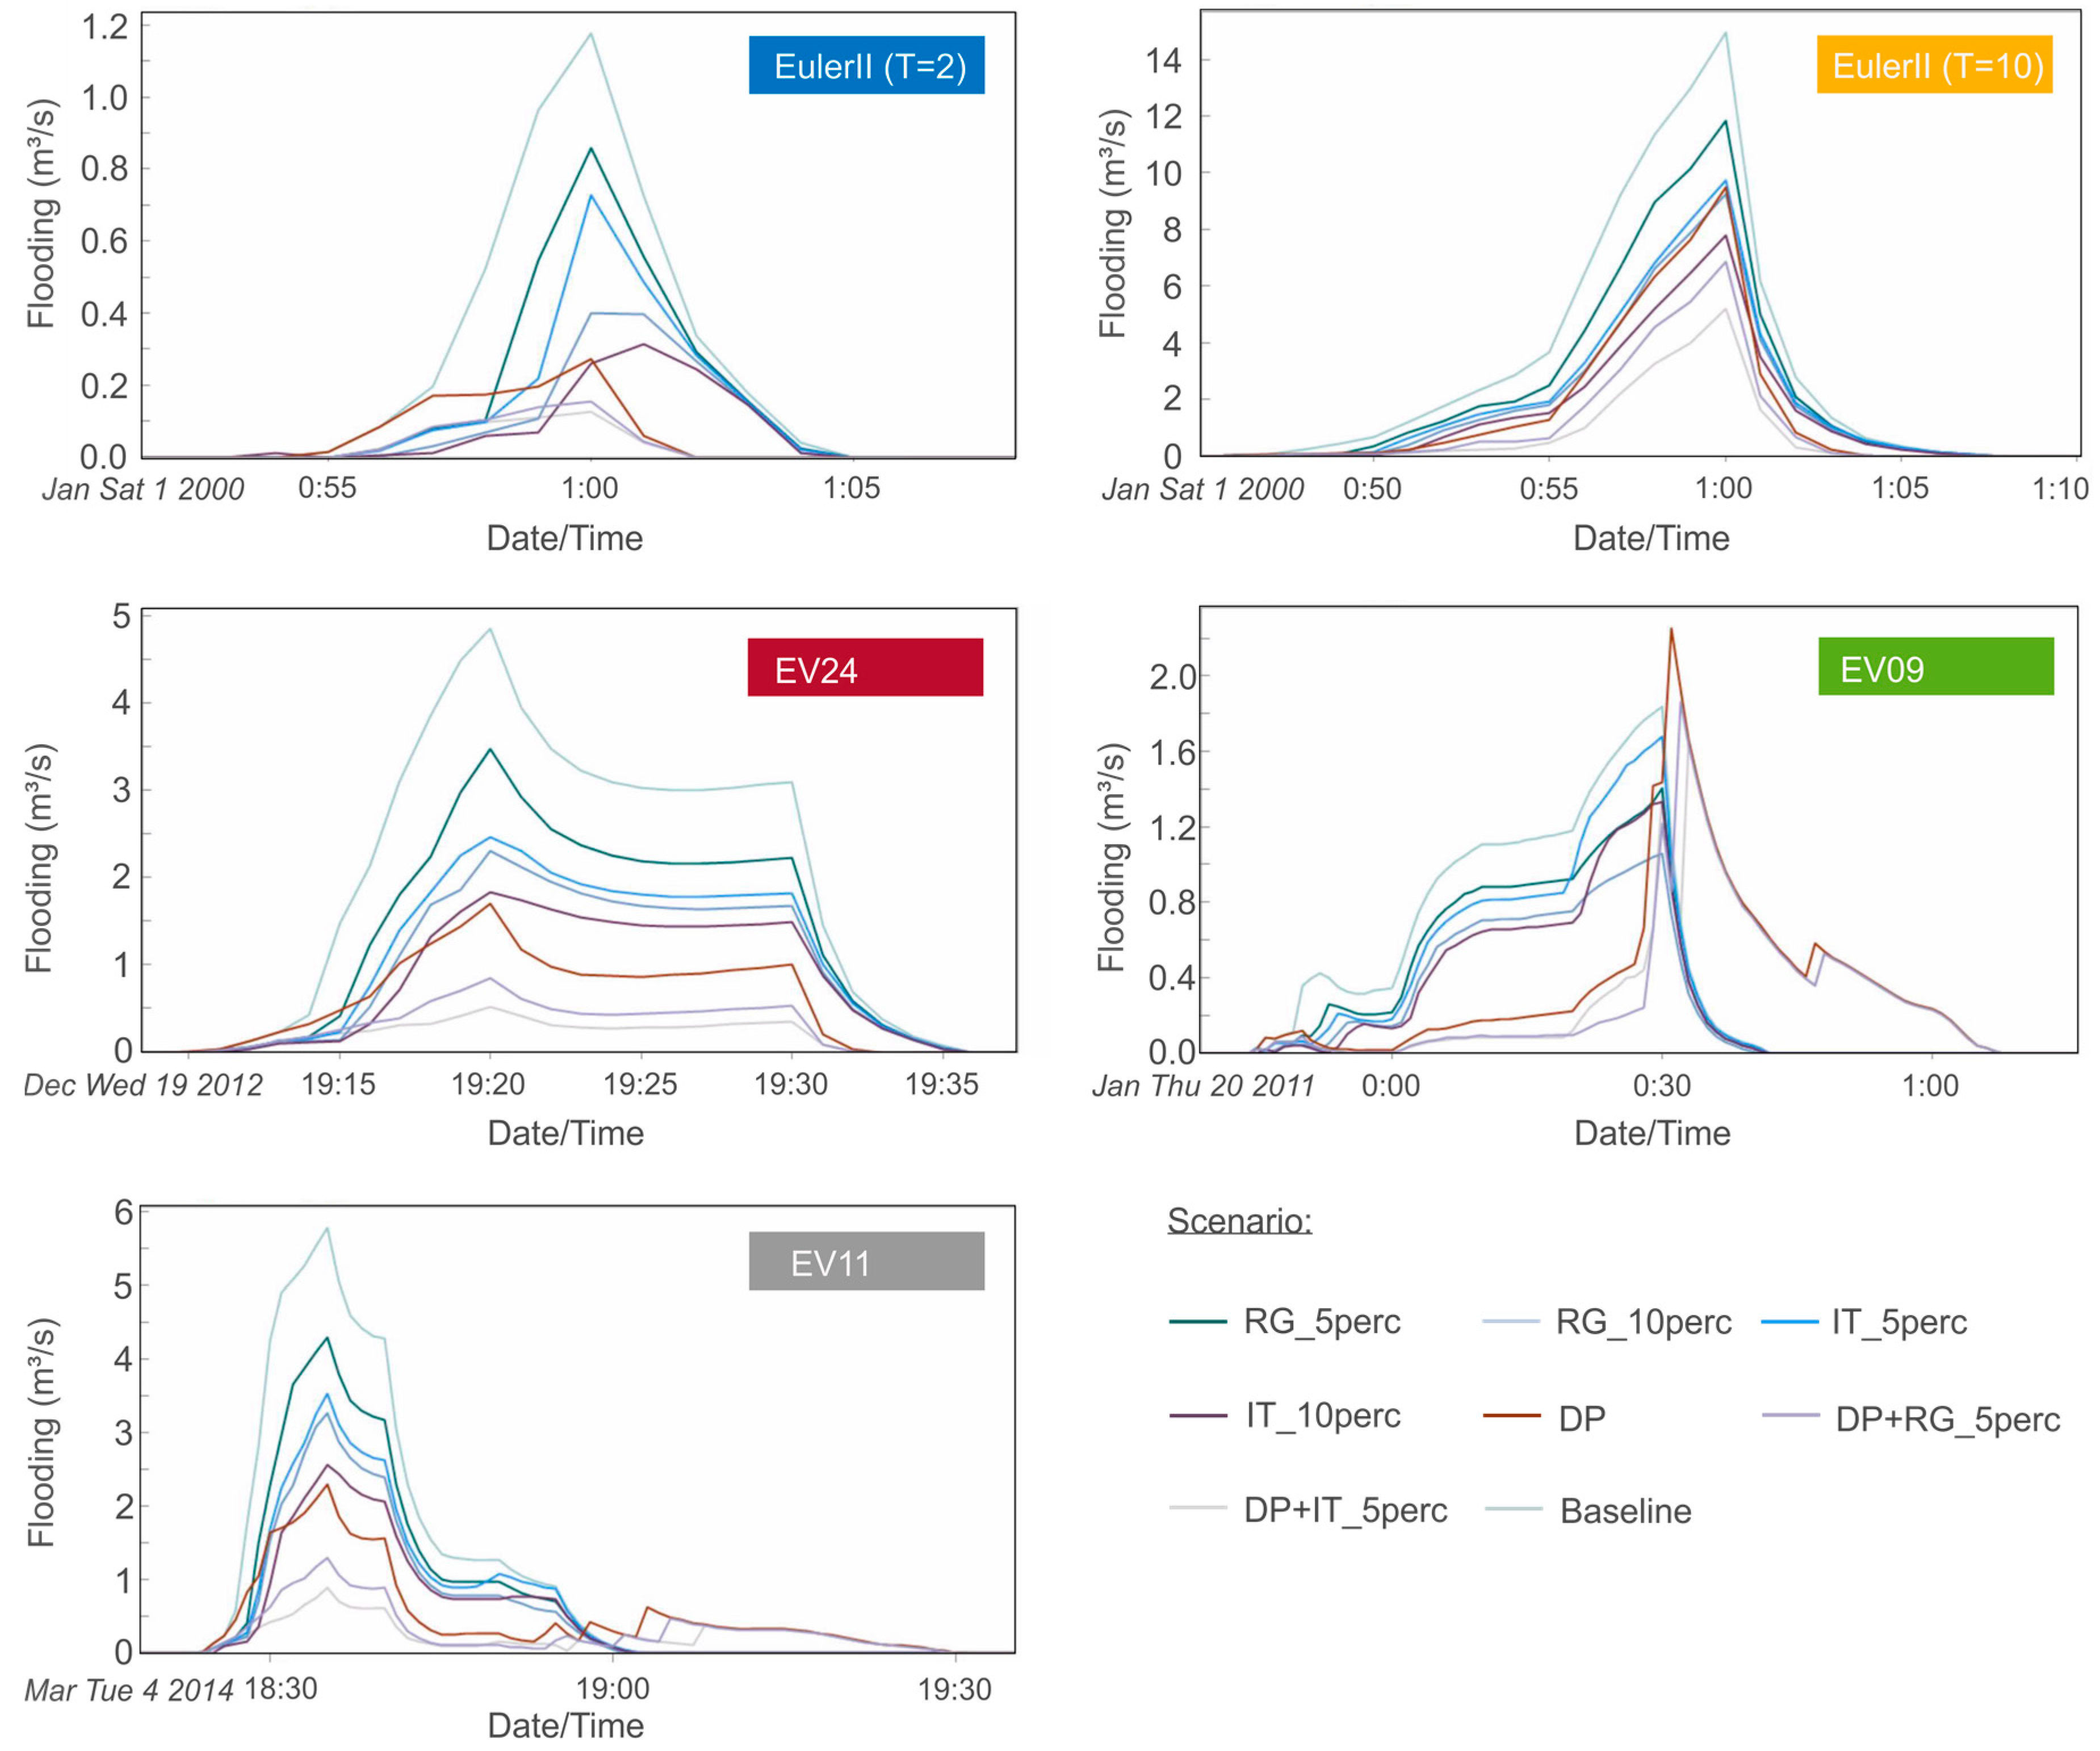
3.4.4. Flooding Hydrographs

Figure 8 illustrate the flooding hydrographs for all five rain events (axis of the hydrographs differ). The flood rates for all seven scenarios plus the baseline were investigated. For the design storms (EulerII (T = 10) and (EulerII (T = 2)), the hydrographs show that all proposed scenarios enable to reduce the peak flooding rate compared to the baseline scenario. The two scenarios using 5% of the subcatchment area for rain gardens (RG_5perc) and infiltration trenches (IT_5perc), are the least effective ones, followed by the scenarios DP, DP+RG_5perc, and DP+IT_5perc as the best option for the area.
The hydrograph for the real rain event EV09 shows an interesting picture with all the detention pond scenarios having a striking peak after the peak of all other scenarios and with flood rates exceeding even the baseline scenario (except DP+IT_5perc). The reason for this is the overflowing of several storage units. Since no emergency overflow device was implemented in the models, the excess will be regarded as the flood volume in SWMM. On this hydrograph it is notable that infiltration trenches perform worse than rain gardens in all three scenarios, which is an exception to the rule, compared with the results of the other events. This can be explained by the higher total precipitation depth of the event, which causes most of the LIDs to overflow.
Both real rain events EV24 and EV11 have similar hydrographs as the design storms, only that EV11 has an increase of the flood rate for the three detention ponds around 19:00h. That is due to the exceeding of the storage volumes resulting in an overflow. In a realistic scenario, this behavior could certainly be prevented by including a flood spillway or by controlling the outflow of the orifices (which has been chosen to be rather small to minimize downstream flooding during peak flows in the drainage network).

4. Conclusions

In this case study, we investigated LID control performance in an area with high precipitation levels and difficult terrain conditions. The general feasibility and effectiveness of LID application in such conditions could be confirmed. Nevertheless, some reservations must be accepted due to the lack of validation data. Apart from that, centralized detention ponds were also applied to the area. The scenarios investigating the combination of a decentral LID unit and detention ponds showed the best results.
In summary, seven scenarios were tested and compared with five different rain events (three real rain events and two Euler-type II design storms):
  • Two scenarios applying rain gardens on 5% and 10% of the subcatchment areas where flooding occurs (RG_5perc and RG_10perc).
  • Two scenarios applying infiltration trenches on 5% and 10% of the subcatchment areas where flooding occurs (IT_5perc and IT_10perc).
  • Three scenarios with detention ponds: one only with detention ponds on the determined locations (DP), one with detention ponds and rain gardens occupying 5% of the subcatchment area (DP+RG_5perc), and the last one with infiltration trenches occupying 5% of the subcatchment area (DP+IT_5perc).
Reduction of total flood volume, reduction of peak flood rate, and reduction of flooded nodes were used as performance indicators, and flooding hydrographs were used to compare the scenarios with the baseline. The results show that the scenarios IT_5perc and IT_10perc have better performance for most of the rain events tested (reaching up to 39,7% and 55,9% reduction for flood volume, respectively) compared to RG_5perc and RG_10perc (29,8% and 50,0% reduction for flood volume, respectively). Both scenarios with LID and detention pond combined were applied showed the best results for all performance indicator, DP+IT_5perc better than DP_RG_5perc. Finally, scenario DP generally performs better than the scenarios RG_5perc, IT_5perc, and RG_10perc, but worse than IT_10perc. As an exception, the scenarios with detention ponds showed worse results than the other scenarios for the rain event EV09 for the peak flood rate reduction analysis, due to the overflow of the devices.
Furthermore, in this study it was shown that the intensity and the pattern of the rainfall have a significant impact on the system performance. Hence, the importance of considering different rainfall distributions when designing a new system. To further improve the efficiency of the LIDs under varying rainfall patterns, a real-time control strategy might be beneficial, which could be a direction for future studies. Considering the difficulties encountered in the case study area, it is probable that LID controls can be applied with success for flood mitigation purposes in areas with enhanced boundary conditions. For instance, other areas of the city of Joinville, since the whole city is affected by high precipitation levels and suffers from floods.
To conclude, LID controls can work as a form of retention and its performance will depend on the storage volume available. Although also related to flood mitigation, the use of LID controls in developed countries is most related to pollution control. Pollution control quantification was neglected here as it is not a priority in the area, though it would occur. In fact, the benefits of such decentralized stormwater controls go far beyond flood mitigation, as an example helping to reduce urban heat islands. Therefore, tropical weather cities, as Joinville, can only profit from such devices.

Acknowledgments

The first author gratefully acknowledges the financial support of CAPES (Coordenação de Aperfeiçoamento de Pessoal de Nível Superior), Ministry of Education, Brazil (BEX-13668-13-7). The authors would also like to thank the Prefecture of Joinville for all the data and material provided for this project and CHI for the disposal of PCSWMM in the University Grant Program. The publication of this work is funded by the Vice Rector for Research of the University of Innsbruck.

Author Contributions

All authors substantially contributed in conceiving and designing the model and realizing this manuscript. Mariana Luiza Rengel Goncalves and Sven Rau prepared the input data and performed the model implementation. Markus Sitzmann and Jonatan Zischg worked on the analysis and presentation of the results. Wolfgang Rauch and Manfred Kleidorfer supervised the entire research. Mariana Luiza Rengel Goncalves wrote the paper. All authors have read and approved the final manuscript.

Conflicts of Interest

The authors declare no conflict of interest.

Appendix A

Table A1. LID-Parameters investigated, optimized and selected for the sensitivity analysis.
LIDLayerParameterInitial ValueMin. ValueMax. ValueStepOptimum ValuePeak Flow at 10-Year Event% Change to BaselineSelected ValuePeak Flow % Change to Baseline at 2-Year Event
Rain garden
(depth = 0.5 m)
Capture Ratio: 3.00
SurfaceBerm height (mm)1501003005015035.11−14.74300
SoilSoil Thickness (mm)1501003005020035.06−14.86200
Conductivity (mm/h)6010140106035.15−14.6460
Suction Head (mm)755105102535.11−14.7425
StorageStorage Thickness (mm)20010030050035.05−14.8950
UnderdrainDrain Coefficient1001205034.41−16.441
(LID usage editor)% Imp−area treated20105052035.15−14.6420
Selected Parameter Set 34.54−16.12 −14.32
Rain garden
(depth = 1.0 m)
Capture Ratio: 3.75
SurfaceBerm height (mm)2001008005031034.96−15.10250
SoilSoil Thickness (mm)4001008005070034.62−15.93700
Conductivity (mm/h)6010140106035.15−14.6460
Suction Head (mm)75510510534.90−15.255
StorageStorage Thickness (mm)400100800504034.72−15.6950
UnderdrainDrain Coefficient1001205034.41−16.441
(LID usage editor)% Imp−area treated20107052533.41−18.8725
Selected Parameter Set 32.92−20.06 −18.50
Infiltration Trench
(depth = 0.5 m)
Capture Ratio: 3.75
StorageVoid ratio (voids/solids)0.60.20.750.050.7535.18−14.570.75
UnderdrainDrain Coefficient30201034.41−16.441
(LID usage editor)% Imp−area treated20107052533.67−18.2460
Selected Parameter Set 33.11−19.60 −17.87
Infiltration Trench
(depth = 0.5 m)
Capture Ratio: 8.99
StorageVoid ratio (voids/solids)0.60.20.750.050.7529.14−29.240.75
UnderdrainDrain Coefficient30201028.12−31.711
(LID usage editor)% Imp−area treated40107056022.97−44.2260
Selected Parameter Set 22.21−46.07 −45.35
Note: Initial value defines the value set to test the other parameters on the sensitivity analysis in a first stage (normally the average); Minimum and Maximum values come from the references; Step defines the variation applied to run the scripts; Optimum value represents the best value found for the respective parameter on the first stage of the sensitivity analysis; Selected value is the final value defined on the second stage of the sensitivity analysis. Selected value varies from optimum value as the model encountered some problems when running all optimum parameters together, therefore they were analyzed again to define its final optimal value; The optimum value found for these parameters was out of the range set for minimum and maximum values from the references. In these cases, the authors decided to use the optimum value found on the sensitivity analysis instead of sticking with the references, which were used as base.

References

  1. Zevenbergen, C.; Cashman, A.; Evelpidou, N.; Pasche, E.; Garvin, S.; Richard, A. Urban Flood Management; CRC Press/Balkema: Leiden, The Netherlands, 2010; ISBN 9780415559447. [Google Scholar]
  2. Tucci, C.E.M. Urban Drainage in Specific Climates—Urban Drainage in Humid Tropics; UNESCO: Paris, France, 2001; Volume I. [Google Scholar]
  3. James, W. Rules for Responsible Modeling, 4th ed.; CHI: Guelph, ON, Canada, 2005; ISBN 0-9683681-5-8. [Google Scholar]
  4. Silveira, A.L.L. Problems of modern urban drainage in developing countries. Water Sci. Technol. 2002, 45, 31–40. [Google Scholar] [PubMed]
  5. Mascarenhas, F.C.B. Flood Prevention and Remediation; WIT Press: Boston, MA, USA, 2011; ISBN 978-1-84564-560-1. [Google Scholar]
  6. Miguez, M.G.; Veról, A.P. Sustainable Drainage Systems in Brazil. In Sustainable Surface Water Management: A Handbook for SUDS; Charlesworth, S.M., Booth, C.A., Eds.; John Wiley & Sons, Ltd.: West Sussex, UK, 2017; pp. 315–327. ISBN 1118897706. [Google Scholar]
  7. Zhou, Q. A Review of Sustainable Urban Drainage Systems Considering the Climate Change and Urbanization Impacts. Water 2014, 6, 976–992. [Google Scholar] [CrossRef]
  8. Bacchin, T.K.; Ashley, R.; Sijmons, D. Green-blue multifunctional infrastructure: An urban landscape system design new approach. In Proceedings of the 13th International Conference on Urban Drainage, Sarawak, Malasya, 7–11 September 2014. [Google Scholar]
  9. Weinstein, N.; Cotting, J.; Nees, D.; Downing, S.; Lee, J.; Tauber, B.; English, A.; Kloss, C.; Glass, C.; Huber, W.C.; et al. Decentralized Stormwater Controls for Urban Retrofit and Combined Sewer Overflow Reduction: Phase II; WERF: Alexandria, Egypt, 2009; ISBN 978-1-84339-353-5/1-84339-353-0. [Google Scholar]
  10. Urich, C.; Bach, P.; Sitzenfrei, R.; Kleidorfer, M.; Rauch, W.; McCarthy, D.T.; Deletic, A.; Rauch, W. Modelling cities and water infrastructure dynamics. Proc. ICE Eng. Sustain. 2013, 166, 301–308. [Google Scholar] [CrossRef]
  11. Eckart, K.; McPhee, Z.; Bolisetti, T. Performance and implementation of low impact development—A review. Sci. Total Environ. 2017, 607, 413–432. [Google Scholar] [CrossRef] [PubMed]
  12. Fletcher, T.D.; Shuster, W.; Hunt, W.F.; Ashley, R.; Butler, D.; Arthur, S.; Trowsdale, S.; Barraud, S.; Semadeni-Davies, A.; Bertrand-Krajewski, J.L.; et al. SUDS, LID, BMPs, WSUD and more—The evolution and application of terminology surrounding urban drainage. Urban Water J. 2015, 12, 525–542. [Google Scholar] [CrossRef]
  13. U.S. EPA. Low Impact Development: A Literature Review; United States Environmental Protection Agency: Washington, DC, USA, 2000.
  14. Field, R.; Tafuri, A.N.; Muthukrishnan, S.; Acquisto, B.A.; Selvakumar, A. The Use of Best Management Practices (BMPs) in Urban Watersheds; DEStech Publications, Inc.: Lancaster, PA, USA, 2005; ISBN 1-932078-46-0. [Google Scholar]
  15. Son, C.; Hyun, K.; Kim, D.; Baek, J.; Ban, Y. Development and Application of a Low Impact Development (LID)-Based District Unit Planning Model. Sustainability 2017, 9, 145. [Google Scholar] [CrossRef]
  16. Wang, X.; Shuster, W.; Pal, C.; Buchberger, S.; Bonta, J.; Avadhanula, K. Low impact development design-integrating suitability analysis and site planning for reduction of post-development stormwater quantity. Sustainability 2010, 2, 2467–2482. [Google Scholar] [CrossRef]
  17. Zischg, J.; Goncalves, M.L.R.; Bacchin, T.K.; Leonhardt, G.; Viklander, M.; Van Timmeren, A.; Rauch, W.; Sitzenfrei, R. Info-Gap robustness pathway method for transitioning of urban drainage systems under deep uncertainties. Water Sci. Technol. 2017, 76, 1272–1281. [Google Scholar] [CrossRef] [PubMed]
  18. Naumann, S.; Davis, M.; Kaphengst, T.; Pieterse, M.; Rayment, M. Design, Implementation and Cost Elements of Green Infrastructure Projects; Final report to the European Commission, DG Environment; Contract No. 070307/2010/577182/ETU/F.1; Ecologic institute and GHK Consulting: Brussels, Belgium, 2011. [Google Scholar]
  19. European Environmen Agency EEA. Green Infrastructure and Territorial Cohesion; European Environmen Agency: Copenhagen, Denmark, 2011; ISBN 9789292132422. [Google Scholar]
  20. Dietz, M.E. Low impact development practices: A review of current research and recommendations for future directions. Water Air Soil Pollut. 2007, 186, 351–363. [Google Scholar] [CrossRef]
  21. Ahiablame, L.M.; Engel, B.A.; Chaubey, I. Effectiveness of low impact development practices: Literature review and suggestions for future research. Water Air Soil Pollut. 2012, 223, 4253–4273. [Google Scholar] [CrossRef]
  22. Goncalves, M.; Kleidorfer, M.; Rauch, W. Case Study on the use of a Combined System as an Intermediate Solution in Brazil—Cost Estimate. Water Environ. J. 2005, 2033, 305–309. [Google Scholar] [CrossRef]
  23. Armitage, N. The Challenges of Sustainable Urban Drainage in Developing Countries. 2011. Available online: http://switchurbanwater.lboro.ac.uk/outputs/pdfs/W2-2_GEN_PAP_Challenges_of_sustainable_urban_drainage_in_developing_countries.pdf (accessed on 5 March 2018).
  24. Goldenfum, J.A.; Tassi, R.; Meller, A.; Daniel, G.; Silveira, A.L. Challenges for the Sustainable Urban Stormwater Management in Developing Countries: From Basic Education to Technical and Institutional Issues; Novatech: Lyon, France, 2007; pp. 357–364. [Google Scholar]
  25. Qin, H.P.; Li, Z.X.; Fu, G. The effects of low impact development on urban flooding under different rainfall characteristics. J. Environ. Manag. 2013, 129, 577–585. [Google Scholar] [CrossRef] [PubMed] [Green Version]
  26. Schmitter, P.; Goedbloed, A.; Galelli, S.; Babovic, V. Effect of Catchment-Scale Green Roof Deployment on Stormwater Generation and Reuse in a Tropical City. J. Water Resour. Plan. Manag. 2016, 5016002. [Google Scholar] [CrossRef]
  27. Sun, Y.; Li, Q.; Liu, L.; Xu, C.; Liu, Z. Hydrological simulation approaches for BMPs and LID practices in highly urbanized area and development of hydrological performance indicator system. Water Sci. Eng. 2014, 7, 143–154. [Google Scholar] [CrossRef]
  28. Jackisch, N.; Weiler, M. The hydrologic outcome of a Low Impact Development (LID) site including superposition with streamflow peaks. Urban Water J. 2017, 14, 143–159. [Google Scholar] [CrossRef]
  29. Chaosakul, T.; Koottatep, T.; Irvine, K.N. Low Impact Development Modeling to Assess Localized Flood Reduction in Thailand. J. Water Manag. Model. 2013, 6062, 337–354. [Google Scholar] [CrossRef]
  30. Baek, S.S.; Choi, D.H.; Jung, J.W.; Lee, H.J.; Lee, H.; Yoon, K.S.; Cho, K.H. Optimizing low impact development (LID) for stormwater runoff treatment in urban area, Korea: Experimental and modeling approach. Water Res. 2015, 86, 122–131. [Google Scholar] [CrossRef] [PubMed]
  31. Palla, A.; Berretta, C.; Lanza, L.G.; La Barbera, P. Modelling Storm Water Control Operated by Green Roofs at the Urban Catchment Scale. Proceddings of the 11th International Conference on Urban Drainage, Edinburgh, UK, 31 August–5 September 2008; pp. 1–10. [Google Scholar]
  32. Climate-data.org Climate Data for Cities Worldwide. Available online: https://de.climate-data.org/ (accessed on 23 February 2018).
  33. FUNDACAO IPPUJ. Joinville Cidade em Dados 2013; Prefeitura Municipal de Joinville: Joinville, Brazil, 2013.
  34. FUNDACAO IPPUJ. Joinville Cidade em Dados 2016; Prefeitura Municipal de Joinville: Joinville, Brazil, 2016.
  35. Maia, B.G.; Klostermann, D.; Ribeiro, J.M.G.; Simm, M.; De Oliveira, T.M.N.; Barros, V.G. Bacias Hidrográficas da Região de Joinville; Prefeitura Municipal de Joinville: Joinville, Brasil, 2013. [Google Scholar]
  36. ÖWAV. RB11—Richtlinien für die Abwassertechnische Berechnung und Dimensionierung von Abwasserkanälen, 2nd ed.; ÖWAV: Vienna, Austria, 2008. [Google Scholar]
  37. CHI PCSWMM. Available online: https://www.pcswmm.com/ (accessed on 21 February 2018).
  38. Gironás, J.; Roesner, L.A.; Rossman, L.A.; Davis, J. A new applications manual for the Storm Water Management Model (SWMM). Environ. Model. Soft. 2010, 25, 813–814. [Google Scholar] [CrossRef]
  39. Ball, J.E. Discussion of “Automatic Calibration of the U.S. EPA SWMM Model for a Large Urban Catchment” by J. Barco, K.M. Wong, and M. K. Stenstrom. J. Hydraul. Eng. 2009, 135, 1108–1110. [Google Scholar] [CrossRef]
  40. Granata, F.; Gargano, R.; de Marinis, G. Support Vector Regression for Rainfall-Runoff Modeling in Urban Drainage: A Comparison with the EPA’s Storm Water Management Model. Water 2016, 8, 69. [Google Scholar] [CrossRef]
  41. Jang, S.; Cho, M.; Yoon, J.; Yoon, Y.; Kim, S.; Kim, G.; Kim, L.; Aksoy, H. Using SWMM as a tool for hydrologic impact assessment. Desalination 2007, 212, 344–356. [Google Scholar] [CrossRef]
  42. Rosa, D.J.; Clausen, J.C.; Dietz, M.E. Calibration and Verification of SWMM for Low Impact Development. J. Am. Water Res. Assoc. 2015, 51, 746–757. [Google Scholar] [CrossRef]
  43. Rossman, L.A. Modeling Low Impact Development Alternatives with SWMM. J. Water Manag. Model. 2010, 6062, 167–182. [Google Scholar] [CrossRef]
  44. Rossman, L. Storm Water Management Model User’s Manual Version 5.1—Manual; EPA/600/R-14/413 (NTIS EPA/600/R-14/413b); US EPA Office of Research and Development: Washington, DC, USA, 2015.
  45. Rossman, L.; Huber, W. Storm Water Management Model Reference Manual Volume III—Water Quality; EPA/600/R-16/093; US EPA Office of Research and Development: Washington, DC, USA, 2016.
  46. De Joinville, P. SIMGeo—Sistema de Informações Municipais Georreferenciadas de Joinville. Available online: https://www.joinville.sc.gov.br/servicos/sistema-de-informacoes-municipais-georreferenciadas-simgeo/ (accessed on 21 November 2017).
  47. Lopes, F.H.Y. Estudo Comparativo Entre Equacoes de Chuvas para o Município de Joinville. Bachelor Thesis, Universidade do Estado de Santa Catarina, Joinville, Brazil, 2006. [Google Scholar]
  48. DWA. ATV Standard A118 E: Hydraulic Dimensioning and Verification of Drainage Systems; DWA: Hennef, Germany, 1999; ISBN 3-924063-49-4. [Google Scholar]
  49. ÖWAV. Leitfaden–Niederschlagsdaten zur Anwendung der ÖWAV-Regelblätter 11 und 19; ÖWAV: Vienna, Austria, 2007. [Google Scholar]
  50. Rauch, W.; Toffol, S. De Vom Zeitbeiwertverfahren zur Hydrodynamischen Simulation—Einführung in die Methodik Einleitung Grundlagen der hydraulischen Berechnung. Entwässerungsverfahren. In Entwässerungsverfahren—Anwendung und Berechnung; ÖWAV: Innsbruck, Austria, 2005; pp. 1–10. [Google Scholar]
  51. CHI Water PSCWMM LID Webinar. Available online: https://support.chiwater.com/79499/low-impact-development-lid. (accessed on 25 February 2017).
  52. Mathworks MATLAB. Available online: https://www.mathworks.com/products/matlab.html (accessed on 20 February 2017).
Figure 1. Spatial distribution of soil groups within the case study area (location: 26°18′ S, 48°49′ W).
Sustainability 10 00728 g001
Figure 2. Representation of the storm drain system in the PCSWMM model (location: 26°18′ S, 48°49′ W).
Sustainability 10 00728 g002
Figure 3. Rainfall distribution of rain events (EulerII (T = 2), EulerII (T = 10), EV24, EV09 and EV11).
Sustainability 10 00728 g003
Figure 4. Deployed detention ponds with their dedicated drainage area (location: 26°18′ S, 48°49′ W).
Sustainability 10 00728 g004
Figure 5. Comparison of flood volume reduction in different storm events.
Sustainability 10 00728 g005
Figure 6. Comparison of peak flood rate reduction in different storm events.
Sustainability 10 00728 g006
Figure 7. Comparison of the reduction of flooded nodes in different storm events.
Sustainability 10 00728 g007
Figure 8. Flooding hydrographs of all analyzed rain events (EulerII (T = 2), EulerII (T = 10), EV24, EV09 and EV11).
Sustainability 10 00728 g008
Table 1. Monthly precipitation rates arranged from lowest to highest [32].
FreiburgLenexaChengjuShenzenBangkokSingaporeJoinville avg.Joinville 2011 *Joinville 2015 *
523025297163774824
5830252981649194111
593629372016693138141
6153474824166110147158
6164487451166121161210
6585509467180126181226
699066162156181134235270
749788229165187143288289
86107144264182195149313324
94120147326191250204341333
97121283329239262212503342
111136285334320298246571345
* Data collected from the early reports “Joinville Cidade em Dados (Joinville City Data)” [33,34].
Table 2. Soil groups classification.
Soil GroupKsClassification
cm/smm/h
Yellow Acrisol1.34 × 10–44.824 B
Haplic Cambisol1.35 × 10–4 4.860B
Flubic Cambisol2.87 × 10–4 10.332A
Umbric Fluvisol9.50 × 10–53.420C
Table 3. Simulation parameters applied to the model.
Parameter/Simulation OptionsDescriptionValueSource
Infiltration ModelDefines how infiltration into the upper soil zone of a subcatchment is modeledCurve Number(defined by user)
Routing MethodMethod of flow routing in conveyance systemDynamic Wave(defined by user)
Reporting Time StepTime step for reporting computed results1 (min)(defined by user)
(Wet Weather) Runoff Time StepTime step for surface runoff during wet periods1 (min)SWMM User Manual (typical value) [44]
Routing Time StepRouting time step for flows through the conveyance system5 (s)SWMM User Manual (typical value for dynamic wave routing) [44]
Climatology and Rain Gauges
Block RainRainfall with constant intensity of different durations and return periods(various)Based on area specific rain equation [47]
Euler-type II Design StormsDesign storms of different durations and return periods with Euler-type II distribution(various)Based on area specific rain equation [47]
Single (real) EventsSelected events from recorded rainfall continuum data for Joinville(various)Obtained from the city of Joinville
Subcatchments
N ImpervSurface roughness (Manning’s n) for overland flow of impervious portion of a subcatchment0.012 (s/m1/3)SWMM User Manual, Appendix A6 [44]
N PervSurface roughness (Manning’s n) for overland flow of pervious portion of a subcatchment0.15 (s/m1/3)SWMM User Manual, Appendix A6 [44]
Dstore ImpervDepression storage depth of impervious portion of the subcatchment1.9 (mm)SWMM User Manual, Appendix A5 [44]
Dstore PervDepression storage depth of pervious portion of the subcatchment6.24 (mm)SWMM User Manual, Appendix A5 [44]
Zero ImpervFraction of the impervious area without depression storage25 (%)SWMM User Manual (typical value) [44]
Drying TimeTime, it takes to completely dry a saturated soil (CN-model-Parameter)7 (days)SWMM User Manual, Appendix C: Range from 2 to 14 days [44]
Table 4. Investigated scenarios at catchment level for all rain events.
ScenarioAbbreviationDescription
Rain gardenRG_5percRain garden deployment on every subcatchment where flooding occurs using 5% of the subcatchment area. The designated impervious area is based on the results of the sensitivity analysis.
RG_10percRain garden deployment on every subcatchment where flooding occurs using 10% of the subcatchment area. The designated impervious area is based on the results of the sensitivity analysis.
Infiltration TrenchIT_5percInfiltration Trench deployment on every subcatchment where flooding occurs using 5% of the subcatchment area. The designated impervious area is based on the results of the sensitivity analysis.
IT_10percInfiltration Trench deployment on every subcatchment where flooding occurs using 10% of the subcatchment area. The designated impervious area is based on the results of the sensitivity analysis.
Detention PondDPDetention ponds are placed, at selected locations in the catchment.
Detention Pond + Rain GardenDP+RG_percDetention ponds are placed, at selected locations in the catchment. Additionally, rain gardens are placed at subcatchment were flooding still occurs (occupying 5% of the subcatchment area).
Detention Pond + Infiltration TrenchDP+IT_5percDetention ponds are placed, at selected locations in the catchment. Additionally, infiltration trenches are placed at subcatchment were flooding still occurs (occupying 5% of the subcatchment area).
Table 5. Selected rain events for LID-scenario evaluation.
EventDate of OccurrenceInterval (min)Maximum Intensity (mm/h)Total Rainfall (mm)Total Flood Volume (m³)
EV0919 January 20111087.691.22613
EV2419 December 201210128.462.43322
EV114 March 20145139.080.94876
EulerII (T = 2)-599.348.0254
EulerII (T = 10)-5171.582.84774
Table 6. Results of peak flow reduction when implementing LIDs after the sensitivity analysis.
LID-TypePeak Flow at 10-Year Event (lps)% Difference to BaselinePeak Flow at 2-Year Event (lps)% Difference to Baseline
Rain Garden (depth = 0.5 m)34.54–16.12%19.27–14.32%
Rain Garden (depth = 1.0 m)32.92–20.06%18.33–18.50%
Infiltration Trench (depth = 0.5 m)33.11–19.60%18.47–17.87%
Infiltration Trench (depth = 1.0 m)22.21–46.07%12.29–45.35%
Table 7. System flood volume reduction with the implementation of storages.
Node to Convert into StorageArea Occupation (m2)Impervious Area Drained (m2)Storage Volume (m3)Max. Storage Occupation (%)System Flood Volume (mL)Reduction (%) 1
STO4123125025,214250081%3.843−19.50%
STO3821184559,834369090%3.355−10.22%
STO392154025,802108083%3.05−6.39%
STO434972020,647144090%2.896−3.23%
STO4209225617745089%2.643−5.30%
STO4251270575154089%2.351−6.12%
−50.75%
1 System Flood Volume in Base Case Scenario (10-year design storm event): 4.774 mL.
Table 8. Deployment details of LIDs and detention ponds.
ScenarioNumber of LIDs DeployedTotal LID Area (m2)Imp. Area Treated by LIDs (m2)Number of Detention PondsArea of Detention Ponds (m2)Volume of Detention Ponds (m3)Impervious Area Connected to Storages (m2)
RG_5perc19517,07058,2670000
RG_10perc19534,139115,9220000
IT_5perc19517,070118,4720000
IT_10perc19534,139165,4890000
DP000648509700143,425
DP+RG_5perc13813,44745,996648509700143,425
DP+IT_5perc13813,44795,118648509700143,425

