A Probabilistic Alternative Approach to Optimal Project Profitability Based on the Value-at-Risk


Graduate Institute of Ferrous Technology & Graduate School of Engineering Mastership, Pohang University of Science and Technology, 77, Cheongam-ro, Nam-gu, Pohang-si, Gyeongsangbuk-do 37673, Korea
*
Author to whom correspondence should be addressed.
Sustainability 2018, 10(3), 747; https://doi.org/10.3390/su10030747
Submission received: 4 February 2018
/
Revised: 2 March 2018
/
Accepted: 4 March 2018
/
Published: 8 March 2018
(This article belongs to the Special Issue Circular Economy, Ethical Funds, and Engineering Projects)
Abstract
:This paper focuses on an investment decision-making process for sustainable development based on the profitability impact factors for overseas projects. Investors prefer to use the discounted cash-flow method. Although this method is simple and straightforward, its critical weakness is its inability to reflect the factor volatility associated with the project evaluation. To overcome this weakness, the Value-at-Risk method is used to apply the volatility of the profitability impact factors, thereby reflecting the risks and establishing decision-making criteria for risk-averse investors. Risk-averse investors can lose relatively acceptable investment opportunities to risk-neutral or risk-amenable investors due to strict investment decision-making criteria. To overcome this problem, critical factors are selected through a Monte Carlo simulation and a sensitivity analysis, and solutions to the critical-factor problems are then found by using the Theory of Inventive Problem Solving and a business version of the Project Definition Rating Index. This study examines the process of recovering investment opportunities with projects that are investment feasible and that have been rejected when applying the criterion of the Value-at-Risk method. To do this, a probabilistic alternative approach is taken. To validate this methodology, the proposed framework for an improved decision-making process is demonstrated using two actual overseas projects of a Korean steel-making company.

1. Introduction
Since 2005, Korean steel-making companies have been attempting to establish overseas steel plant projects (SPPs). The experience of Korean steel-making companies in overseas SPPs is relatively low, whereas their experience in domestic SPPs is extensive. Korean steel-making companies have suffered numerous difficulties due to the uncertainty and risks of overseas SPPs [1]. Stakeholders are consistently exposed to risks when managing a project at any stage in the engineering, construction, procurement, or sustainment life-cycles [2,3,4,5]. The risks can lead to project failure [6]. Risk management of the project can be achieved through the economical application of resources to identify, assess, and prioritize risks as well as minimize, monitor, and control the likelihood or impact of unfortunate events, while maximizing the realization of opportunity [7]. The purpose of risk management is to ensure that uncertainties do not cause deviation from the project goals. Therefore, for sustainable project development, investors need to be aware of and deal with the risks associated with a project.
In particular, investors dealing with projects for sustainable development should be careful when making investment decisions. Investors have traditionally used the discounted cash flow (DCF) method to make decisions when investing in projects and it is widely used because it is simple to use and understand. The value of the DCF method is based on the cash flow of the investment project. In this paper, the factors affecting cash flow are defined as profitability impact factors. The disadvantage of the DCF method is that it does not reflect risk, and so, it has difficulties in recognizing, preventing, and overcoming the risks of the project. A way to reflect these risks is the Value-at-Risk (VaR) method which can be applied as an improved project-profitability indicator to estimate the future uncertainty risks. The VaR method, introduced in the late 1980s by major financial institutions, is one of the risk-measurement methods that can be used to quantitatively predict the amount of loss due to risk. While the input factors used in the DCF method have fixed values, the input factors used in the VaR method have variable values depending on the risks. Although the VaR method has the advantage of reflecting the risk, its disadvantage is that the decision criterion is conservative due to excessive recognition of the risk, which often leads to loss of an investment opportunity for investors. In previous studies, the VaR method for various projects has been applied to evaluate the risk by reflecting the project [8,9,10,11]. For sustainable development, investors need to select good investment opportunities that are less risky and more profitable for their projects. Therefore, this paper proposes a method to support investors’ through a probabilistic alternative approach that takes advantage of the VaR method. VaR has been used in previous studies to analyze risk factors through sensitivity analysis to select risk priorities [12,13,14]. This paper proposes a probabilistic approach to compare and analyze alternatives using the Theory of Inventive Problem Solving (TRIZ or TIPS) and the business version of the Project Definition Rating Index (PDRI) as a differentiating method from previous studies. Unlike previous studies, this method is not limited to presenting only alternatives, it also presents new input factors that reflect the risks and helps determine whether various alternatives are actually applicable for sustainable project development.
The objective of this paper is to propose an alternative approach for the optimization of project profitability through a quantitative evaluation of the various risks using the profitability indicators of sustainable investments. The contribution of this paper is the proposal of an alternative business perspective that can quantitatively analyze the project risk factors and improve the project value from a sustainability perspective in project development. This paper is organized as follows: Section 2 discusses the need for research from an investigation of the relevant literature; Section 3 introduces the project evaluation methodology for traditional decision-making processes and for improved decision-making processes; Section 4 identifies the factors that affect project value in terms of risk management and a method is suggested for quantitatively analyzing risk factors using a proposed probabilistic alternative approach employing TRIZ and PDRI; Section 5 validates this paper through a case study of two actual steel plant projects, and finally, a conclusion summarizes the paper and discusses limitations and future plans.
2. Related Work
A major indicator of project profitability is the results from the DCF method, which is a well-established valuation method for steel-plant projects (SPPs), for which cash flows are used [15]. The DCF method measures the future cash flows of a project from which the gains are converted into the present value (PV) [16]. The DCF method is typically represented by the net present value (NPV) and the internal rate of return (IRR), which are useful in the assessment of a reasonable value in terms of the difference between the present value and the future cash flow value [15]. However, SPPs can be inaccurately assessed when using traditional evaluation methods due to the large size of a project, its long-term operation period, the risk characteristics according to the uncertainty of the contract complexity, varying degrees of management flexibility, and the financial structure [15,17,18,19].
While making investment decisions for overseas SPP projects, investors analyze the project profitability according to the impact of various risks and they should estimate the realistic losses from the risks to ensure the sustainability of the development and their investments. This means that the NPV and IRR output variables must be calculated under uncertain input variables that vary within a certain range and shift with the occurrence of hazardous events; it is then possible to obtain NPV and IRR probability distributions [20]. In the VaR method, two risk definitions are applicable: the potential-loss degree of the asset portfolio and the potential-profit standard deviation [21]. Risk can be understood as the potential-loss amount. The VaR is defined as the maximum amount of loss reserves in the time horizon of the portfolio at a given confidence level. The confidence level is defined by each company according to its standards and its financial condition [22]. The main purpose of the VaR is the quantification of the potential losses under normal market conditions [23]. Here, it is essential to pay attention to the term “normal.” Fundamentally, the VaR does not make use of unusual market circumstances, such as the Great Depression of 1929 or the financial crisis of 2008. Therefore, to establish a risk-prevention plan with project-profitability forecasting, investors should focus on normal market conditions as well as abnormal conditions, as well as on the fluctuations in extreme situations.
Ye et al. [8] considered the VaR value as the NPV and carried out an infrastructure-project investment evaluation for which an NPV at-risk method was utilized. Habibi et al. [9] dealt with the conditional VaR of a cash-flow stream in the presence of an exchange-rate risk. Caron et al. [10] used the VaR to obtain an improvement in balancing the overall portfolio of power-plant projects for a company operating in the engineering and contracting industry. These studies attempted to consider the risk variability by using the NPV at-risk method from the perspective of the investor, the creditor, and the project constructor. The limitation of these studies, however, is their sole use of the NPV as a project-evaluation index derived from a Monte Carlo simulation. Monte Carlo simulations can be further utilized for the evaluation of potential risks with a sensitivity analysis, and Gatti et al. [12] used Monte Carlo simulations to calculate the VaR estimates for project-financing transactions, whereby suggestions were made regarding the ways that important issues can be discussed in the development of a model for the improvement of the project value.
Value engineering (VE) is used as an alternative approach in the engineering phase of a project. Miles [24] technically analyzed various cases using VE as a problem-solving system. Lbusuki [25] suggested the correct systematic approach of VE and a target-costing method for cost management. These studies mainly focus on approaches that improve the technical aspects of products. To increase the effectiveness of the VE practice, TRIZ can be applied at VE idea-gathering meetings [26]. The versatility of TRIZ means that it can be applied to business issues as well as the technical aspects of projects [27]. The TRIZ technique is used in this paper to solve the problem of major risk factors that are derived from an analysis of a Monte Carlo simulation.
TRIZ techniques are used in various disciplines and fields. Kim and Cochran [28] reviewed a number of TRIZ concepts from the perspective of the axiomatic-design framework. Yamashina et al. [29] proposed an effective integration of TRIZ and quality-function deployment, enabling technological innovations for the effectiveness and systematic operability of new products. John and Harrison [30] identified ways in which TRIZ tools and methodologies could be used to innovate the environment and then presented a way TRIZ could be applied as a sustainable design tool for specific purposes. Ilevbare et al. [31] moved away from the traditional TRIZ literature by exploring the challenges that are associated with the acquisition and application procedures for TRIZ beginners based on their practical experience as well as the benefits that are associated with the attainment of TRIZ knowledge. Souchkov [32] provided a brief overview of the manner in which TRIZ can benefit the business world, whereby business and management innovations are improved and implemented. This study evaluates project risks through the application of the business version of the PDRI, which is widely used by project managers of SPPs, and TRIZ-based solutions are proposed for which a project-risk evaluation result is employed.
3. Project-Evaluation Methodology
The methodology of this study consists of two tasks. The first task is to assess risk applied project evaluation. The second task is to select alternatives for optimal profitability by applying a probabilistic alternative approach to risk in project evaluation. The overall methodology framework of this paper is shown in Figure 1.
3.1. Traditional Decision-Making Process for the DCF Model
Project evaluation is based on a cash-flow model. Essentially, the cash-flow model defines the pro forma income-statement elements and the discount-rate elements as profitability impact factors. Figure 2 shows an example of a pro forma income statement.
To assess the project value, a reasonable cash-flow model that reflects the profitability impact factors that are the input variables of the DCF method should be established. This paper defines the following 15 profitability impact factors, (1) capital expenditure; (2) material cost; (3) labor cost; (4) net working capital; (5) overhead cost; (6) sale price; (7) production; (8) exchange rate; (9) corporate tax rate; (10) debt-to-equity ratio; (11) risk-free interest rate; (12) market risk premium; (13) beta; (14) cost of debt (COD) before tax; and (15) country risk. Further, this paper introduces the necessary calculation formulas. A capital cost that represents the weighted average cost of capital (WACC) is relevant here; it consists of the cost of equity (COE), the COD, the debt-to-capital ratio (DCratio), and the corporate tax rate (TAX). In this case, the COE is derived using the capital-asset pricing model [33]. The risk-free interest rate (Rfree), market risk premium, and beta also need to be considered. The cost of debt refers to the borrowing of the interest rate in project financing.
COE = Rfree + beta × (market risk premium − Rfree),
WACC = (1 − DCratio) × COE + DCratio × COD × (1 − TAX),
To calculate the project profitability, it is essential to obtain a discount rate which is an index of the project risks, as follows:
Discount rate = WACC + Country risk premium,
The project cash flow is divided into the construction-period component and the business-period component, and each part constitutes the cash inflows and outflows that are associated with the 15 profitability impact factors presented above.
Through the DCF method, a project is assessed using the NPV and the IRR. Further, the profitability of these two indicators is verified using the cash flow, as follows:
where t is the year of the project period, N is the total project period, CFt is the cash flow of the year, and r is the discount rate.
where r is derived using a trial-and-error method.
IRR = r value when the NPV = 0,
3.2. Improved Decision-Making Process for the VaR Model
During the planning stage of projects, investors consider the various risks. However, if traditional economic evaluation criteria such as the NPV and the IRR are being used, the investors are then at risk of overlooking the volatility of the project uncertainty risks [34]; therefore, it is necessary to consider the change in profitability according to the fluctuation of the risks. By developing a sophisticated probabilistic model of the future cash flows, investors can determine the project investment based on risk-based decision criteria. In this study, an improved DCF method is used, to which the profitability impact factors that reflect the project risks are applied. The improved DCF method is called VaR-based NPV at Risk (NPVaR) and is based on a cash-flow model [8]. The main difference between the traditional DCF method and the NPVaR method is the determination of whether each of the profitability impact factors accurately reflect the risks of the project. A Monte Carlo simulation shows the way that this distribution can be calculated for a given project, and how it can comprehensively measure the business risks of the project [10]. In fact, a Monte Carlo simulation can be easily applied to explain numerous types of practical assumptions regarding the probability distributions of the profitability impact factors of the cash-flow model. The probability distribution for each profitability impact factor of the NPVaR method is determined based on a number of literature researches [15,35,36].
In this paper, VaR refers to the NPV for the maximum loss that may occur during a relatively long operation period of a project, whereas the general VaR, which is used in financial sectors, refers to the amount of loss for a relatively short period of time. The NPVaR method is applied to the VaR in terms of the NPV as it applies a discount rate on the cash flow of the project during the project period. As shown in Figure 3, NPVα is defined as the NPV corresponding to the significance level of α; that is, it refers to the minimum NPV at the (1 − α) confidence level [8].
Figure 3 shows two definitions of simple profitability forecasting for which the volatility of the risks is considered. These definitions will be used as the decision-making criteria in the following section. First, the expected NPV (NPVexp) is defined as the mean NPV of a probability distribution. The NPVexp is a level of profitability that can occur under normal circumstances. The second definition is the NPVα, the lower cumulative α% NPV of the probability distribution. The NPVα is a level of profitability that can occur under severe circumstances. Therefore, if the investors decide on whether to execute a project using the NPVaR, they will be able to receive assistance during the decision-making process by identifying the maximum number of losses that might occur during the operation period of the project. If the NPV, which does not consider the risk volatility, is not used as a traditional decision-making tool, the project profit may be less than the expected NPV, or a loss might result due to the unknown risks of an actual project. To prevent the uncertainty risks, this paper presents decision-making criteria that are determined by the nature of the investors according to the risk circumstances and in consideration of the risk volatility.
4. Probabilistic Alternative Approach
In terms of project evaluation, the NPVaR is presented as the decision-making criteria; although previous studies have been limited to the VaR decision-making process [8,10,20,35,36]. The authors of this current study noticed that the decision-making criterion for project investment is more conservative as it reflects the profitability impact factors of the project risks. When the investment is approved in the VaR process, the distinction from previous studies is not evident. The focus of this paper, however, is the actions that investors can take when their investment is rejected in the VaR process, which are discussed below.
First, in this study, the major risk factors are recognized based on previous studies of the many risks that arise for investors who are dealing with overseas construction projects, as well as on the database of a steel-making company. The major risk factors can be tabulated according to their associations with the profitability impact factors, as follows. A database of overseas constructions should be set and analyzed to identify the relevance between the associated major risk factors and the profitability impact factors. The analysis of the project profitability, for which the Monte Carlo simulation was employed, is a sensitivity analysis that finds the most influential factor among the profitability impact factors. Second, the business version of the PDRI, which is based on major risk factors, is helpful in determining the alternatives for achieving the optimal project profitability. The success regarding the optimal profitability requires identification of the most influential factors, analysis of the problems that are associated with the risks, and a TRIZ-based derivation of the optimal solution.
4.1. Identification of Overseas-Project Risk Factors
In this paper, the proposed method is used for the data analysis to make relationships between the profitability impact factors and the associated major risk factors, and the risk factors of overseas investment projects are determined based on the literature references that are associated with the overseas construction cases that are discussed in the remainder of this paper. The methods that have been widely used to evaluate the success of projects are the PDRI [37] and the front-end loading (FEL) index [38]. This study also includes an additional nine references in which other overseas and domestic plant projects have been assessed. It is advantageous that a variety of the risks that can occur in overseas construction-project cases can be recognized. Table 1 shows 66 overseas construction-project risk factors that are related to the contents of the literature references.
As shown in Table 1, the risk factors of overseas construction projects are largely classified into internal and external risk factors. The external risk factors are related to the project-investment environment and the internal risk factors are related to the managerial regulations of the project itself. For the classification, the risk factors have been organized into categories that are based on the literature references. The classification considers most of the risk factors, while also considering the investors during the investment-decision step.
When they are utilized in real-life projects, the major risk factors can be added and subtracted depending on the nature of the project. Additionally, it is more effective to build a database of risk factors so that investors can document a company’s overseas experiences. In this study, a business version of the PDRI is analyzed based on the 66 previously mentioned risk factors to find the associated risk factors according to the profitability impact factors, as shown in Table 2.
The level of risk associated with overseas projects is greater than that of domestic projects. Therefore, as the role of the investors is the planning of projects and the provision of project investments, it is important for the investors to recognize and respond to such risks in advance. Also, it is essential to set the cash-flow model to predict the project profitability; and to reflect the cash-flow model for each of these risks, it is important to analyze the relationship between the profitability impact factors and the risk factors in advance. This study defines the major factors that affect the project profitability according to 15 factors based on the pro forma income statement shown in Figure 2 of the risk factors of overseas projects, as shown in Table 2. The relationships between the profitability impact factors and the associated risk factors is linked to the references on overseas projects [48,49,50,51]; furthermore, these relationships are utilized in the problem-solving of this paper.
This paper presents a method which is applicable to an increase in the NPVα, which is an important indicator of investment decisions based on the relationships between the profitability factors and the associated major risk factors. It is important to identify the major contributors among the profitability impact factors; to find these factors, the use of a sensitivity analysis is recommended. A sensitivity analysis refers to the impact on the input variables in terms of the value of the results [52]. In a profitability-forecasting model that utilizes the NPVaR through an analysis of the major profitability impact factors affecting the NPVα, the investors may establish a risk-prevention plan; if the investors can analyze the critical profitability impact factors influencing the NPV and manage the volatility of the controllable risk factors, the probability of the retention of the NPVexp, the initial expected project profit, will be further increased.
4.2. Developing Alternatives and the Alternative Selection Process
In order to develop alternatives, the major risk factors are first identified by recognizing the risks given in Table 1 and assessing the priorities of these risks. The most vulnerable risk factor can be selected by analyzing the relationship between the profitability impact factors and the associated major risk factors given in Table 2 and then checking the pre-assessed PDRI scores. The most vulnerable risk factors are used in the idea meetings to discover alternatives to TRIZ. In this study, additional project evaluation is performed using probabilistic alternatives as the input factors in order to select an optimal alternative. The schematic process of this methodology is shown in Figure 4.
4.2.1. Business-Version of PDRI
As shown in Figure 4, the investors first determined the weight of each risk factor of the project. This activity is an early part of the process of creating the business-version PDRI on a project-by-project basis. The major risk factors are identified in Table 2 using the most influential profitability impact factors given in the previous section. The list of 66 elements of the business-version PDRI was originally identified and categorized according to 10 references [37,38,39,40,41,42,43,44,45,46,47]. The elements were weighted in order of importance using the inputs from 15 experienced project managers and estimators who each have between 10 and 20 years of experience. An example of the business version of PDRI is presented in Appendix A. These employees used the TRIZ to seek out alternatives to overcome the most vulnerable risk factors that were applied for the weighted evaluation table.
4.2.2. TRIZ
The TRIZ offers a systematic approach to gain an understanding and definition of difficult problems. Difficult problems typically require unique solutions, and the TRIZ offers a variety of strategies and tools to facilitate the formulation of creative solutions. One of the earliest theory-based discoveries of large-scale projects is that most of the problems that require creative solutions typically reflect a need to overcome the dilemma or the tradeoff between two contradictory factors. A key goal of the TRIZ-based analysis is the systematic application of strategies and tools to find superior solutions that overcome the need to enact tradeoffs or compromises between the two contradictory elements. Twelve TRIZ principles are introduced in this current study to find alternatives, as shown in Appendix B.
4.2.3. Probabilistic Alternative Selection
The profitability impact factor of alternatives based on TRIZ is first transformed into probabilistic values through a literature review and the company’s internal database. Based on the previously derived alternatives, the probability-distribution fit is used to formulate probability distributions. The transformed probabilistic values are used as the input variables to perform the Monte Carlo simulation using the VaR method. Among the found alternatives, the alternative with the largest NPVα is salient to solve the risk problem. The largest NPVα is the optimal project value.
5. Case Study
The leading Korean steel-making company, P, encountered many difficulties during their participation in three overseas projects. The Indonesian Krakatau project (Project K) of 2009, experienced difficulties such as a sales decrease due to a change in the local-market conditions and high steep-price volatility in the local market. The Brazilian Companhia Siderúrgica do Pecém project (Project C) of 2011, was hindered by difficulties such as a construction delay due to local-union strikes, an increase in the investment cost that was caused by inflation and political issues, and local policing and environmental issues. The current statuses of these projects considering the corresponding difficulties are as follows. A long-term demand in the market had not been established for Project K, so the sale price slowly decreased while profitability was even worse. In Project C, the investment cost became much larger than expected due to the frequent design changes and decreased workability. Overseas SPPs can pose serious risks and various detrimental environmental conditions in accordance with the investment uncertainties in the target countries. Investors should be more cautious in terms of investment decisions, as the risks of overseas SPPs are greater than those of local projects.
In this section, first, the profitability of two projects is analyzed with the traditional DCF-based decision-making process. Second, the profitability of the projects with the improved decision-making process is analyzed based on the NPVaR method. The difference between the two results is then analyzed and discussed. Finally, the selection of alternatives for the optimal profitability of the two projects is validated through a probabilistic alternative comparison of the major risk factors derived from the improved decision process.
5.1. Traditional DCF-Based Decision-Making Process
The case models for Project K (Indonesia, 2009) and Project C (Brazil, 2011) are shown in Table 3, based on the profitability impact factors that were formulated from the pro forma financial-statement and the discount-rate elements. Values that are as close to the real values as possible serve as the basis for the modelling of both cases. The profitability impact factors are estimated based on the company’s financial and accounting disclosure documents that are stored in the Republic of Korea (ROK)’s electronic disclosure system. The cash-flow data for Project K and Project C, are presented in Table 4 and Table 5, respectively.
Table 4 shows the spending of the capital expenditure (CAPEX) from equity to debt; the CAPEX sequence uses the debt after the spending from the equity. Loan repayment is a method of fully amortizing loans, and it starts five years after the beginning of the operation period. The principal is repaid evenly during the remaining operation period. It is assumed here that the entirety of the CAPEX is a depreciable asset and is amortized on a straight-line basis calculation throughout the operation period. All products are sold out every year, thereby negating the need for a goods inventory. The net working capital is a plant-operation cost that is addressed one year prior to the start of the operation period and is then recovered in the final year of the operation period. This cost is used in the additional equity because debt is strictly defined by a term sheet for the CAPEX calculation.
Table 6 shows the calculation results of four of the profitability indicators, including the NPV and the IRR, using two cash-flow tables.
All profitability indices are excellent and indicate that the implementation of the two projects should be approved. Both projects show NPVs that are greater than zero and IRRs that are greater than the discount rate (Project K is 8.677% and Project C is 8.273%), which is the minimum acceptable rate of return (MARR). Traditionally, investors would not hesitate in making the decision to invest in these projects. In practice, however, each of the profitability impact factors has a risk volatility. These profitability indices are prone to change depending on the potential economic situations. In the next section, the investment decision-making process is described using a new profitability index that reflects the risk variation.
5.2. Improved Decision-Making Process Based on the NPVaR Method
This case study is also based on the cash-flow model in Table 3. In traditional methods, the profitability impact factors are all fixed. If the profitability impact factors of each project are variable due to uncertainty risks, the decision-making results regarding the investment can be varied. In the improved decision-making process, the probability distribution of each profitability impact factor is set, as shown in Table 7, and these can be applied to a Monte Carlo simulation to forecast the project profitability considering the risk volatility.
A probability-distribution fitting produces probability distributions that are used for the fitting of a set of data that has been accumulated for more than 10 years with respect to the variable profitability impact factors. The probability distributions that present a similar fit are assumed to lead to an excellent profitability estimation. A variety of probability distributions can be produced, some of which can be adapted more easily to the gathered data than others, depending on the characteristics of the profitability impact factors [53]. A probability-distribution fitting and Monte Carlo simulation are presented in this study, using the commercial statistical software @Risk for Excel Version 6.3.1 (Palisade Corporation, Ithaca, NY, USA).
A Monte Carlo simulation is presented here by using the cash-flow data from Table 4 and Table 5 and the probability distributions of the major profitability impact factors of Project K (Indonesia, 2009) and Project C (Brazil, 2011) from Table 7. The number of simulation repetitions is set to 10,000 to ensure the reliability of the simulation using the @Risk software. The derived simulation results are as close to reality as possible, and it is assumed that the investors are risk-averse. Two of the NPV probability distributions of the two projects were derived from the Monte Carlo simulation, as shown in Table 7. The detailed simulation results are also given in Table 8.
In the DCF methods, the two profitability indices are the NPV and the IRR, as can be seen in Table 6. Usually, the two investment cases would be approved where the NPV is larger than zero and the IRR is larger than the discount rate (MARR). The two projects are ideally set up to receive investments. However, according to the improved method, both projects are rejected. This investor attribute means that the decision-making criterion is based on the decision criterion NPVα > 0. The significance level that serves as the reference for the estimation of the NPVα is typically set at 5% (confidence level of 95%) [8,10]. Because the NPV0.05 values of these projects, which represent the profitability index of the improved decision-making method, are negative, the risk-averse investors would reject both projects based on the decision criterion (NPV0.05 > 0). Therefore such investors might miss suitable investment opportunities compared to relatively risk-neutral or risk-amenable investors. To resolve this problem, a method is suggested for enabling investors to find probabilistic alternatives to the risks for target projects.
5.3. Probabilisic Alternative Approach for Optimal Profitability
In this section, a method is proposed for the optimal increase of the NPV0.05. First, it is important to find the major contributors among the profitability impact factors, as this will identify the most influential profitability impact factor. To find this factor, investors should use a sensitivity analysis, which investigates the impact of the input variables on the results [52]. In a profitability-forecasting model that utilizes the NPVaR method, through an analysis of the major profitability impact factors affecting the NPV0.05, risk-prevention alternatives can be identified. Thus, if investors can find the critical profitability impact factor that has the most influence on the NPV through a sensitivity analysis, they can connect the associated risks, as shown in Table 2, by using a backward tracing method to seek the requisite solutions.
In Table 9, the most influential profitability impact factors are the sale price and the CAPEX in Project K and Project C, respectively. This paper utilizes the risk information in Table 1 and Table 2 to find solutions to reduce the risk-factor volatility by using the business-version PDRI and the proposed TRIZ problem-solving method [27,54].
As shown in Table 10, in Project K, the sale price has five associated risk factors that are weighted in advance by overseas SPPs experts. According to this method, the risk factor “G. Market Condition” is the most influential factor, while the risk factor “G1. Volatility of market demand” is the most vulnerable PDRI score. In Project C, the CAPEX has eight associated risk factors that are also weighted. The risk factor “I. Project Organization” is the most influential factor, while the risk factor “I3. Ability of contractor” is the most vulnerable PDRI score.
The three hypothetical alternatives that are presented for each project were identified through a process of long discussion. The alternatives were derived from the application of the TRIZ method. Further, the probability distribution of each alternative is weighted with the assumption of the situation of each alternative, where it is assumed that the alternatives only affect the corresponding risk factor, and the probability distribution of each alternative can be found by using the distribution fit. The Monte Carlo simulation derived the best alternative using the NPV0.05, for which a 10,000-time repetition was performed for each alternative. The simulation results are shown in Table 11.
In Project K, the sale price decreased due to the provision of discounts to the long-term off-takers. In Project C, the CAPEX increased because the EPC Lump-Sum Turnkey contract method transfers the construction risks to a contractor who then spends more capital. Viewed through the DCF indicators such as the NPV and the IRR, the results calculated for both projects worsened because of the cost of the risk hedges; however, an alternative in each project is the positive NPV0.05 in Table 10, whereby the decision criterion is fulfilled. Eventually, both projects could be approved by the investors according to the selected alternatives. Rather than looking for ways to overcome the uncertainty risks by listing the risk items when the risks are being resolved, it is preferable for the investors to quantify the weighted risk items for each project in advance and find the solutions using the TRIZ method.
The two cases in this study are projects currently in progress. Project K was completed in December 2013 and has been operating for three years; however, the company has experienced financial difficulties for three consecutive years. As the number of fixed sale points is low, the selling prices of the products are continuously falling. Project C was completed in June 2016 and has been operating for six months. Unlike the CAPEX of 3800 MUSD that was expected at the feasibility-study stage, the final CAPEX is 4500 MUSD, which is an increase of 18.42%. Although the investors decided to approve both projects based on traditional decision-making methods, the final results of these projects still need to be monitored, since the interim results are not promising. To prepare for this situation, the improved method recommended in this study provides an additional opportunity to protect the projects against the related risks. The effectiveness of the proposed method was verified by reviewing the actual project results from two overseas SPPs, thereby allowing for a comparison of the results from the traditional and improved methods. However, this study is limited because the solutions that are provided by the alternative approach cannot be verified with respect to the two presented cases.
6. Conclusions
Korean steel-making companies need a new decision-making process for selecting profitable projects that result in successful overseas investments for sustainable development. In traditional decision-making process, it is difficult to reflect risks, and improved decision-making processes have thus been proposed in several studies. The improved decision-making process used in this paper is the NPVaR method, for which the investment decision-making criteria regarding overseas SPPs are derived according to a project-profitability estimation. Unlike the traditional decision-making process, the improved method reflect the risks of the profitability impact factors that affect SPP projects and this supports better decision-making by Korean steel-making companies. In particular, if the prospective investment project is rejected after the initial decision-making process, the subsequent actions that the investors should take are described in this study. Notably, he “probabilistic alternative approach” described in this study is not covered in detail in other studies and it is a significant contribution. This approach entails financial arbitrage so that decision makers can be presented with several choices to avoid risky situations. Further, this approach can be extended to the field of options-valuation research.
However, this study has two limitations. First, the methodology of this paper considers only the macro business elements to evaluate the project value and does not consider the micro technical aspects. Technical project evaluation is made primarily on the basis of practical experience and engineering knowledge. Technical project evaluation is different from business project evaluation because it is difficult to appreciate its value. The proposed methodology does not describe the technical aspects of the project, so the results may be less realistic. To overcome this problem, this study proposed that the project be evaluated based solely on a cash flow model. Therefore, future research needs to present a model for evaluation of micro-technology in project value evaluation. Second, it is assumed in this study that the selected alternative influences only one input variable of the probabilistic alternative. However, it is more realistic to consider that selected alternatives can affect various profitability impact factors in a project. A simple methodology is assumed in this study and simulation is performed to verify the effectiveness of the probabilistic alternative approach. In the future, the authors propose analyzing the various effects of profitability impact factors by thoroughly analyzing the alternatives.
Acknowledgments
This work was supported by the Technology Innovation Program (10077606, To Develop an Intelligent Integrated Management Support System for Engineering Project) funded by the Ministry of Trade, Industry & Energy (MOTIE, Korea).
Author Contributions
Yonggu Kim developed the concept and drafted the manuscript. Eul-Bum Lee revised the manuscript and supervised the overall work. All authors read and approved the final manuscript.
Conflicts of Interest
The authors declare no conflicts of interest.
Appendix A
Business version of PDRI
| Category Element | Definition Level | Score | |||||||
| 0 | 1 | 2 | 3 | 4 | 5 | ||||
| A. | Credibility of Local Government | ||||||||
| A1. | Local administrative procedures and practices | ||||||||
| A2. | Maturity of legal system | ||||||||
| A3. | Consistent local policy | ||||||||
| Category Total | 0 | ||||||||
| B. | Economic Stability | ||||||||
| B1. | Economic condition of employer | ||||||||
| B2. | Economic condition of local country | ||||||||
| Category Total | 0 | ||||||||
| C. | Local Social & Cultural Characteristics | ||||||||
| C1. | Local social stability | ||||||||
| C2. | Local labor situation | ||||||||
| C3. | Cultural traits | ||||||||
| C4. | Local reactions of project | ||||||||
| Category Total | 0 | ||||||||
| D. | Geographical conditions | ||||||||
| D1. | Climate feature | ||||||||
| D2. | Soil condition | ||||||||
| D3. | Distance from Korea | ||||||||
| Category Total | 0 | ||||||||
| E. | Legal Standard | ||||||||
| E1. | Local standards of design | ||||||||
| E2. | Licensing standards | ||||||||
| E3. | Tariff standards | ||||||||
| E4. | Environmental regulations | ||||||||
| E5. | Repatriation of profits procedure | ||||||||
| E6. | Local content requirement | ||||||||
| Category Total | 0 | ||||||||
| F. | Status of infrastructure | ||||||||
| F1. | Local infra and utility level | ||||||||
| F2. | Difficulty of infra and utilities use contracts | ||||||||
| F3. | Future additional expansion possibilities | ||||||||
| Category Total | 0 | ||||||||
| G. | Market conditions | ||||||||
| G1. | Volatility of market demand | ||||||||
| G2. | Local competitors Status | ||||||||
| G3. | Local market share | ||||||||
| G4. | Exchange rate fluctuations | ||||||||
| G5. | Inflation fluctuations | ||||||||
| G6. | Interest rate fluctuations | ||||||||
| Category Total | 0 | ||||||||
| H. | Financing Plan | ||||||||
| H1. | Additional potential projects in progress | ||||||||
| H2. | Cash flow stability | ||||||||
| H3. | Debt equity ratio | ||||||||
| Category Total | 0 | ||||||||
| I. | Project Organization | ||||||||
| I1. | Considering joint venture | ||||||||
| I2. | Ability of employer | ||||||||
| I3. | Ability of contractor | ||||||||
| I4. | Ability of local companies | ||||||||
| Category Total | 0 | ||||||||
| J. | Contract Condition | ||||||||
| J1. | Similar experiences | ||||||||
| J2. | Liquidated damages | ||||||||
| J3. | Contract terms changeability | ||||||||
| J4. | Unclear contract terms | ||||||||
| J5. | Steel purchase conditions | ||||||||
| J6. | Force majeure | ||||||||
| Category Total | 0 | ||||||||
| K. | Scope of Work | ||||||||
| K1. | Characteristics of product | ||||||||
| K2. | Construction schedule | ||||||||
| Category Total | 0 | ||||||||
| L. | Expenses | ||||||||
| L1. | Initial investment | ||||||||
| L2. | Operation costs | ||||||||
| L3. | Reasonable Contingencies | ||||||||
| Category Total | 0 | ||||||||
| M. | Process & Technology | ||||||||
| M1. | Conformity of new process | ||||||||
| M2. | Level of applied technology | ||||||||
| Category Total | 0 | ||||||||
| N. | Engineering Period | ||||||||
| N1. | Layout planning | ||||||||
| N2. | Constructability/Complexity | ||||||||
| N3. | Design for Scalability | ||||||||
| N4. | Major equipment selection | ||||||||
| N5. | Timeliness of design | ||||||||
| N6. | Value engineering | ||||||||
| Category Total | 0 | ||||||||
| O. | Health, Safety & Environment | ||||||||
| O1. | Work safety management | ||||||||
| O2. | Construction safety facilities | ||||||||
| O3. | Pollution prevention Plan | ||||||||
| Category Total | 0 | ||||||||
| P. | Procurements | ||||||||
| P1. | Personnel procurement plan | ||||||||
| P2. | Equipment procurement | ||||||||
| Category Total | 0 | ||||||||
| Q. | Construction Period | ||||||||
| Q1. | Suitable working method | ||||||||
| Q2. | Equip./Material transport | ||||||||
| Q3. | Local company collaboration | ||||||||
| Q4. | Local materials quality | ||||||||
| Q1. | Security & Safety | ||||||||
| Q2. | Commissioning & Acquisition requirements | ||||||||
| Category Total | 0 | ||||||||
| R. | Completion Requirements | ||||||||
| R1. | Document Management | ||||||||
| R2. | Performance requirements | ||||||||
| Category Total | 0 | ||||||||
| Total Score | 0 | ||||||||
Appendix B
12 TRIZ Principles for alternatives
Principle 1: Combination–Separation
Part of an object or process step is combined to form a uniform object or process. Separate uniform objects or uniform processes to form independent parts or phases.
Principle 2: Symmetry–Asymmetry
Change the symmetrical shape or property to an asymmetrical shape or property or change the asymmetrical shape or property to a symmetrical shape or property.
Principle 3: Homogeneity–Diversity
Change from a homogeneous structure, system or environment to a complex structure, another system, or environment. Reduce the variety of structures, systems, or environments.
Principle 4: Expansion–Reduction
Increase or decrease the number of functions in the system or process. Increase or decrease the amount, duration, cost, speed, or other attribute of the process.
Principle 5: Mobility–Immovability (Dynamic–Static)
The fixed part of the system or environment is movable, and vice versa.
Principle 6: Consumption–Regeneration
Elements that are consumed by a system or process are regenerated within the same system or process. The consumed and accomplished elements are removed or modified in other applications.
Principle 7: Standardization–Specialization
Use more standardized processes, procedures, methods, and products. Take advantage of special processes, products, or methods.
Principle 8: Action–Reaction
Action–Reaction boosts the effect you desire. Acquire the opposite effect and amplify.
Principle 9: Continuous Action–Interrupted Action
Critical processes must be performed without interruption or idle time. They should be carried out on a constant load and constantly monitored. Hinder continuous action; prepare to pause in a continuous process.
Principle 10: Partial Action–Excessive Action
Use surplus or excessive action to achieve maximum or optimum effect. Protect sensitive areas from undesired behavior. Focus on the essential tasks to achieve maximum or optimal results. Strengthen your activity in areas that yield optimal results.
Principle 11: Direct Action–Indirect Action
Replace indirect action with direct action immediately. Or replace direct action with indirect action immediately.
Principle 12: Preliminary Action–Preliminary Counteraction
Take the necessary action (in whole or in part) and take precautions to achieve a more powerful effect. Perform any reaction or preventive action in advance to avoid undesirable effects.
References
- Kyeong-Chan, K. The reorganization of global steel industry and the implications for POSCO. SERI Q. 2009, 2, 78. [Google Scholar]
- Bal, M.; Bryde, D.; Fearon, D.; Ochieng, E. Stakeholder Engagement: Achieving Sustainability in the Construction Sector. Sustainability 2013, 5, 695–710. [Google Scholar] [CrossRef]
- Jillella, S.; Matan, A.; Newman, P. Participatory Sustainability Approach to Value Capture-Based Urban Rail Financing in India through Deliberated Stakeholder Engagement. Sustainability 2015, 7, 8091–8115. [Google Scholar] [CrossRef]
- Liang, X.; Yu, T.; Guo, L. Understanding Stakeholders’ Influence on Project Success with a New SNA Method: A Case Study of the Green Retrofit in China. Sustainability 2017, 9, 1927. [Google Scholar] [CrossRef]
- Tseng, Y.-C.; Lee, Y.-M.; Liao, S.-J. An Integrated Assessment Framework of Offshore Wind Power Projects Applying Equator Principles and Social Life Cycle Assessment. Sustainability 2017, 9, 1822. [Google Scholar] [CrossRef]
- Risk Management–Principles and Guidelines; ISO 31000: 2009; International Organization for Standardization: Geneva, Switzerland, 2009.
- Hubbard, D.W. The Failure of Risk Management: Why it’s Broken and How to Fix it; John Wiley & Sons: Hoboken, NJ, USA, 2009. [Google Scholar]
- Ye, S.; Tiong, R.L.K. NPV-at-Risk Method in Infrastructure Project Investment Evaluation. J. Construct. Eng. Manag. 2000, 126, 227–233. [Google Scholar] [CrossRef]
- Habibi, H.; Habibi, R. Applications of Simulation-Based Methods in Finance: The Use of ModelRisk Software. J. Adv. Stud. Financ. 2016, 7, 82. [Google Scholar]
- Caron, F.; Fumagalli, M.; Rigamonti, A. Engineering and contracting projects: A value at risk based approach to portfolio balancing. Int. J. Proj. Manag. 2007, 25, 569–578. [Google Scholar] [CrossRef]
- Shi, J.; Wang, Y.; Fu, R.; Zhang, J. Operating Strategy for Local-Area Energy Systems Integration Considering Uncertainty of Supply-Side and Demand-Side under Conditional Value-At-Risk Assessment. Sustainability 2017, 9, 1655. [Google Scholar] [CrossRef]
- Gatti, S.; Rigamonti, A.; Saita, F.; Senati, M. Measuring Value-at-Risk in Project Finance Transactions. European Financial Manag. 2007, 13, 135–158. [Google Scholar] [CrossRef]
- Zhang, C.; Pu, Z.; Zhou, Q. Sustainable Energy Consumption in Northeast Asia: A Case from China’s Fuel Oil Futures Market. Sustainability 2018, 10, 261. [Google Scholar] [CrossRef]
- Zhu, L.; Ren, X.; Lee, C.; Zhang, Y. Coordination Contracts in a Dual-Channel Supply Chain with a Risk-Averse Retailer. Sustainability 2017, 9, 2148. [Google Scholar] [CrossRef]
- Kim, Y.; Shin, K.; Ahn, J.; Lee, E.-B. Probabilistic Cash Flow-Based Optimal Investment Timing Using Two-Color Rainbow Options Valuation for Economic Sustainability Appraisement. Sustainability 2017, 9, 1781. [Google Scholar] [CrossRef]
- Damodaran, A. Investment Valuation: Tools and Techniques for Determining the Value of any Asset; John Wiley & Sons: Hoboken, NJ, USA, 2012; Volume 666. [Google Scholar]
- Hacura, A.; Jadamus-Hacura, M.; Kocot, A. Risk analysis in investment appraisal based on the Monte Carlo simulation technique. Eur. Phys. J. B Condens. Matter Complex Syst. 2001, 20, 551–553. [Google Scholar] [CrossRef]
- Rezaie, K.; Amalnik, M.S.; Gereie, A.; Ostadi, B.; Shakhseniaee, M. Using extended Monte Carlo simulation method for the improvement of risk management: Consideration of relationships between uncertainties. Appl. Math. Comput. 2007, 190, 1492–1501. [Google Scholar] [CrossRef]
- Suslick, S.B.; Schiozer, D.; Rodriguez, M.R. Uncertainty and risk analysis in petroleum exploration and production. Terrae 2009, 6, 2009. [Google Scholar]
- Liu, J.; Jin, F.; Xie, Q.; Skitmore, M. Improving risk assessment in financial feasibility of international engineering projects: A risk driver perspective. Int. J. Proj. Manag. 2017, 35, 204–211. [Google Scholar] [CrossRef]
- Dempster, M.A.H. Risk Management: Value at Risk and Beyond; Cambridge University Press: Cambridge, UK, 2002. [Google Scholar]
- Hull, J.C. Options, Futures, and Other Derivatives, 8th ed.; Pearson Education: New York, NY, USA, 2012. [Google Scholar]
- Jorion, P. Value at Risk; McGraw-Hill: New York, NY, USA, 1997. [Google Scholar]
- Miles, L.D. Techniques of Value Analysis and Engineering; Miles Value Foundation: Portland, OR, USA, 2015. [Google Scholar]
- Ibusuki, U.; Kaminski, P.C. Product development process with focus on value engineering and target-costing: A case study in an automotive company. Int. J. Prod. Econ. 2007, 105, 459–474. [Google Scholar] [CrossRef]
- Mao, X.; Zhang, X.; AbouRizk, S.M. Enhancing value engineering process by incorporating inventive problem-solving techniques. J. Construct. Eng. Manag. 2009, 135, 416–424. [Google Scholar] [CrossRef]
- Ruchti, B.; Livotov, P. TRIZ-based innovation principles and a process for problem solving in business and management. TRIZ J. 2001, 1, 677–687. [Google Scholar]
- Kim, Y.-S.; Cochran, D.S. Reviewing TRIZ from the perspective of axiomatic design. J. Eng. Des. 2000, 11, 79–94. [Google Scholar] [CrossRef]
- Yamashina, H.; Ito, T.; Kawada, H. Innovative product development process by integrating QFD and TRIZ. Int. J. Prod. Res. 2002, 40, 1031–1050. [Google Scholar] [CrossRef]
- Jones, E.; Harrison, D. Investigating the use of TRIZ in Eco-innovation. TRIZ J. 2000. Available online: https://www.researchgate.net/profile/David_Harrison10/publication/49401085_Investigating_the_use_of_TRIZ_in_eco-innovation/links/54bccdbb0cf253b50e2d6200/investating-the-use-of-TRIZ-in-eco-innovation.pdf (accessed on 19 January 2015).
- Ilevbare, I.M.; Probert, D.; Phaal, R. A review of TRIZ, and its benefits and challenges in practice. Technovation 2013, 33, 30–37. [Google Scholar] [CrossRef]
- Souchkov, V. Breakthrough thinking with TRIZ for business and management: An overview. ICG Train. Consult. 2007, pp. 3–12. Available online: http://scinnovation.cn/wp-content/uploads/soft/100910/BreakthroughThinkingwithTRIZforBusinessandManagementAnOverview.pdf (accessed on 19 March 2007).
- Bodie, Z.; Kane, A.; Marcus, A.J. Investments, 10e; McGraw-Hill Education: New York, NY, USA, 2014. [Google Scholar]
- Trigeorgis, L. Real Options: Managerial Flexibility and Strategy in Resource Allocation; MIT Press: Cambridge, MA, USA, 1996. [Google Scholar]
- Wibowo, A.; Kochendörfer, B. Financial risk analysis of project finance in Indonesian toll roads. J. Constr. Eng. Manag. 2005, 131, 963–972. [Google Scholar] [CrossRef]
- Yun, S.; Han, S.H.; Kim, H.; Ock, J.H. Capital structure optimization for build–operate–transfer (BOT) projects using a stochastic and multi-objective approach. Can. J. Civ. Eng. 2009, 36, 777–790. [Google Scholar] [CrossRef]
- Bingham, E.; Gibson, G.E., Jr. Infrastructure Project Scope Definition Using Project Definition Rating Index. J. Manag. Eng. 2016, 32, 04016037. [Google Scholar] [CrossRef]
- Sindhu, J.R.N. Investigating the Effect of Front-End Planning in Fast-Track Delivery Systems for Industrial Projects; Texas A&M University: College Station, TX, USA, 2016. [Google Scholar]
- Yildiz, A.E.; Dikmen, I.; Birgonul, M.T.; Ercoskun, K.; Alten, S. A knowledge-based risk mapping tool for cost estimation of international construction projects. Autom. Constr. 2014, 43, 144–155. [Google Scholar] [CrossRef]
- Deng, X.; Low, S.P.; Li, Q.; Zhao, X. Developing competitive advantages in political risk management for international construction enterprises. J. Constr. Eng. Manag. 2014, 140, 04014040. [Google Scholar] [CrossRef]
- Lee, N.; Schaufelberger, J.E. Risk management strategies for privatized infrastructure projects: Study of the build–operate–transfer approach in east Asia and the Pacific. J. Manag. Eng. 2013, 30, 05014001. [Google Scholar] [CrossRef]
- Zhao, X.; Hwang, B.-G.; Yu, G.S. Identifying the critical risks in underground rail international construction joint ventures: Case study of Singapore. Int. J. Proj. Manag. 2013, 31, 554–566. [Google Scholar] [CrossRef]
- Subramanyan, H.; Sawant, P.H.; Bhatt, V. Construction project risk assessment: Development of model based on investigation of opinion of construction project experts from India. J. Constr. Eng. Manag. 2012, 138, 409–421. [Google Scholar] [CrossRef]
- Cheng, M.-Y.; Tsai, H.-C.; Chuang, K.-H. Supporting international entry decisions for construction firms using fuzzy preference relations and cumulative prospect theory. Expert Syst. Appl. 2011, 38, 15151–15158. [Google Scholar] [CrossRef]
- Han, S.H.; Kim, D.Y.; Kim, H. Predicting profit performance for selecting candidate international construction projects. J. Constr. Eng. Manag. 2007, 133, 425–436. [Google Scholar] [CrossRef]
- Ozorhon, B.; Dikmen, I.; Birgonul, M.T. Case-based reasoning model for international market selection. J. Constr. Eng. Manag. 2006, 132, 940–948. [Google Scholar] [CrossRef]
- Wang, S.Q.; Tiong, R.L.; Ting, S.; Ashley, D. Evaluation and management of political risks in China’s BOT projects. J. Constr. Eng. Manag. 2000, 126, 242–250. [Google Scholar] [CrossRef]
- Zou, P.X.; Zhang, G.; Wang, J. Understanding the key risks in construction projects in China. Int. J. Proj. Manag. 2007, 25, 601–614. [Google Scholar] [CrossRef]
- Kim, D.Y.; Han, S.H.; Kim, H.; Park, H. Structuring the prediction model of project performance for international construction projects: A comparative analysis. Expert Syst. Appl. 2009, 36, 1961–1971. [Google Scholar] [CrossRef]
- Chen, H.L.; Chen, C.-I.; Liu, C.-H.; Wei, N.-C. Estimating a project’s profitability: A longitudinal approach. Int. J. Proj. Manag. 2013, 31, 400–410. [Google Scholar] [CrossRef]
- Qazi, A.; Quigley, J.; Dickson, A.; Kirytopoulos, K. Project Complexity and Risk Management (ProCRiM): Towards modelling project complexity driven risk paths in construction projects. Int. J. Proj. Manag. 2016, 34, 1183–1198. [Google Scholar] [CrossRef]
- Saltelli, A.; Chan, K.; Scott, E.M. Sensitivity Analysis; Wiley: New York, NY, USA, 2000; Volume 1. [Google Scholar]
- Ritzema, H. Drainage Principles and Applications; International Institute for Land Reclamation and Improvement (ILRI): Wageningen, The Netherlands, 1994. [Google Scholar]
- Altshuller, G.; Shulyak, L.; Rodman, S. 40 Principles: TRIZ keys to Innovation; Technical Innovation Center, Inc.: Worcester, MA, USA, 2002; Volume 1. [Google Scholar]
Figure 1.
Overall project evaluation framework.

Figure 2.
Example of a pro forma income statement.

Figure 3.
Probability distribution of the net present value (NPV).

Figure 4.
Flow diagram for alternative development and alternative selection.


Table 1.
List of the risk factors for overseas construction projects based on the related literature.
Table 1.
List of the risk factors for overseas construction projects based on the related literature.
| Classification of Risk Factors | Literature List | |||||||||||||
|---|---|---|---|---|---|---|---|---|---|---|---|---|---|---|
| L1 | * L2 | L3 | Risk Factor | ① [37] | ② [38] | ③ [39] | ④ [40] | ⑤ [41] | ⑥ [42] | ⑦ [43] | ⑧ [44] | ⑨ [45] | ⑩ [46] | ⑪ [47] |
| External Risk Factors | A. | A1. | Local administrative procedures and practices | √ | √ | √ | √ | √ | √ | |||||
| A2. | Maturity of legal system | √ | √ | √ | ||||||||||
| A3. | Consistent local policy | √ | √ | √ | √ | √ | √ | √ | √ | |||||
| B. | B1. | Economic condition of employer | √ | √ | ||||||||||
| B2. | Economic condition of local country | √ | √ | √ | √ | |||||||||
| C. | C1. | Local social stability | √ | √ | ||||||||||
| C2. | Local labor situation | √ | √ | √ | √ | |||||||||
| C3. | Cultural traits | √ | √ | √ | √ | √ | ||||||||
| C4. | Local reactions toward project | √ | √ | √ | ||||||||||
| D. | D1. | Climate feature | √ | √ | √ | |||||||||
| D2. | Soil condition | √ | √ | √ | √ | √ | ||||||||
| D3. | Distance from Republic of Korea | √ | ||||||||||||
| E. | E1. | Local standards of design | √ | √ | √ | |||||||||
| E2. | Licensing standards | √ | √ | |||||||||||
| E3. | Tariff standards | √ | √ | |||||||||||
| E4. | Environmental regulations | √ | √ | √ | √ | |||||||||
| E5. | Profit-repatriation procedure | √ | √ | √ | √ | √ | ||||||||
| E6. | Local-content requirement | √ | ||||||||||||
| F. | F1. | Local infra and utility levels | √ | √ | √ | √ | √ | |||||||
| F2. | Difficulty of infra- and utility-use contracts | √ | ||||||||||||
| F3. | Future additional expansion possibilities | √ | ||||||||||||
| G. | G1. | Volatility of market demand | √ | √ | √ | √ | √ | √ | ||||||
| G2. | Local-competitor statuses | √ | √ | |||||||||||
| G3. | Local market share | √ | √ | |||||||||||
| G4. | Exchange-rate fluctuations | √ | √ | √ | √ | |||||||||
| G5. | Inflation fluctuations | √ | √ | √ | √ | √ | ||||||||
| G6. | Interest-rate fluctuations | √ | √ | |||||||||||
| H. | H1. | Additional potential projects in progress | √ | |||||||||||
| H2. | Cash-flow stability | √ | √ | √ | ||||||||||
| H3. | Debt–equity ratio | √ | √ | |||||||||||
| Internal Risk Factors | I. | I1. | Joint-venture consideration | √ | √ | √ | √ | √ | ||||||
| I2. | Ability of employer | √ | √ | √ | √ | √ | √ | |||||||
| I3. | Ability of contractor | √ | √ | √ | √ | √ | √ | |||||||
| I4. | Ability of local companies | √ | √ | √ | √ | √ | √ | √ | ||||||
| J. | J1. | Similar experiences | √ | √ | √ | √ | √ | |||||||
| J2. | Liquidated damages | √ | √ | |||||||||||
| J3. | Contract-terms changeability | √ | ||||||||||||
| J4. | Unclear contract terms | √ | √ | √ | √ | |||||||||
| J5. | Steel-purchase conditions | √ | ||||||||||||
| J6. | Force majeure | √ | √ | √ | √ | √ | ||||||||
| K. | K1. | Product characteristics | √ | √ | √ | √ | √ | √ | ||||||
| K2. | Construction schedule | √ | √ | √ | √ | |||||||||
| L. | L1. | Initial investment | √ | √ | ||||||||||
| L2. | Operation costs | √ | ||||||||||||
| L3. | Reasonable contingencies | √ | √ | |||||||||||
| M. | M1. | Conformity of new process | √ | |||||||||||
| M2. | Level of applied technology | √ | √ | √ | ||||||||||
| N. | N1. | Layout planning | √ | √ | ||||||||||
| N2. | Constructability/Complexity | √ | √ | |||||||||||
| N3. | Design for scalability | √ | ||||||||||||
| N4. | Major-equipment selection | √ | √ | √ | ||||||||||
| N5. | Timeliness of design | √ | ||||||||||||
| N6. | Value engineering | √ | ||||||||||||
| O. | O1. | Work-safety management | √ | √ | √ | |||||||||
| O2. | Construction-safety facilities | √ | ||||||||||||
| O3. | Pollution-prevention plan | √ | √ | √ | ||||||||||
| P. | P1. | Personnel-procurement plan | √ | √ | √ | √ | √ | √ | √ | √ | ||||
| P2. | Equipment procurement | √ | √ | √ | √ | √ | √ | √ | ||||||
| Q. | Q1. | Suitable working method | √ | √ | √ | |||||||||
| Q2. | Equip./Material transport | √ | ||||||||||||
| Q3. | Local-company collaboration | √ | ||||||||||||
| Q4. | Local-material quality | √ | √ | √ | √ | |||||||||
| Q5. | Security & Safety | √ | ||||||||||||
| Q6. | Commissioning & Acquisition requirements | √ | ||||||||||||
| R. | R1. | Document management | √ | |||||||||||
| R2. | Performance requirements | √ | √ | |||||||||||
* A. Credibility of Local Government, B. Economic Stability, C. Local Social & Cultural Characteristics, D. Geographical conditions, E. Legal Standard, F. Status of infrastructure, G. Market conditions, H. Financing Plan, I. Project Organization, J. Contract Condition, K. Scope of Work, L. Expenses, M. Process & Technology, N. Engineering Period, O. Health, Safety, & Environment, P. Procurements, Q. Construction Period, R. Completion Requirements.
Table 2.
Relationships between the profitability impact factors and the associated major risk factors.
Table 2.
Relationships between the profitability impact factors and the associated major risk factors.
| Profitability Impact Factors | Associated Major Risk Factors | |||||||||
|---|---|---|---|---|---|---|---|---|---|---|
| External Risk Factors | Internal Risk Factors | |||||||||
| Capital Expenditure | C. | D. | F. | I. | J. | L. | N. | Q. | ||
| Material cost | G. | J. | L. | M. | N. | |||||
| Labor cost | C. | L. | O. | P. | ||||||
| Net working capital | L. | M. | ||||||||
| Overhead cost | L. | M. | ||||||||
| Sale price | B. | E. | G. | J. | K. | |||||
| Production | B. | G. | K. | R. | ||||||
| Exchange rate | G. | |||||||||
| Corporate tax rate | A. | B. | C. | E. | ||||||
| Debt/(equity + debt) | H. | |||||||||
| Cost of equity | ||||||||||
| Risk-free interest rate | H. | |||||||||
| Market risk premium | B. | I. | J. | |||||||
| Beta | B. | |||||||||
| Cost of debt | H. | I. | J. | |||||||
| Country risk | A. | B. | C. | |||||||
A. Credibility of Local Government, B. Economic Stability, C. Local Social & Cultural Characteristics, D. Geographical conditions, E. Legal Standard, F. Status of infrastructure, G. Market conditions, H. Financing Plan, I. Project Organization, J. Contract Condition, K. Scope of Work, L. Expenses, M. Process & Technology, N. Engineering Period, O. Health, Safety & Environment, P. Procurements, Q. Construction Period, R. Completion Requirements.
Table 3.
Case information for a cash-flow model.
| Profitability Impact Factors | Unit | Project K (Indonesia, 2009) | Project C (Brazil, 2011) |
|---|---|---|---|
| Construction/Operation period | Year | 3/15 | 4/20 |
| * Capital expenditure | Million USD | 3000 | 3800 |
| Material cost | Million USD per year | 480 | 460 |
| Labor cost | Million USD per year | 300 | 280 |
| Net working capital | Million USD per year | 40 | 30 |
| Overhead cost | Million USD per year | 50 | 30 |
| Sale price | Million USD/Million tons | 680 | 640 |
| Production | Million USD per year | 3 | 3 |
| Revenue | Million USD per year | 2040 | 1920 |
| Exchange rate | KRW/USD | 1065.92 | 1122.10 |
| Corporate-tax rate | % | 28 | 34 |
| Debt-to-equity ratio | 1.5 (60%/40%) | 1.0 (50%/50%) | |
| Cost of equity | % | 7.758 | 6.901 |
| Risk-free interest rate | % | 4.341 | 3.691 |
| Market risk premium | % | 7.392 | 7.219 |
| Beta | 1.12 | 0.91 | |
| Cost of debt after tax | % | 3.622 | 2.845 |
| Cost of debt before tax | % | 5.031 | 4.311 |
| WACC | % | 5.277 | 4.873 |
| Country risk premium | % | 3.400 | 3.400 |
| Discount rate | % | 8.677 | 8.273 |
* Capital Expenditure (CAPEX) is amortized on a straight-line basis calculation.
Table 4.
Cash-flow data sheet for Project K (Indonesia, 2009).
| Period | Construction | Operation | ||||||||
|---|---|---|---|---|---|---|---|---|---|---|
| Year | 1 | 2 | 3 | 4 | 5 | … | 15 | 16 | 17 | 18 |
| Cash outflow | *(1000) | *(1000) | *(1040) | *(40) | *(40) | … | *(40) | *(40) | *(40) | - |
| Capital Expenditure | *(1000) | *(1000) | *(1000) | - | - | … | - | - | - | - |
| Net working capital | - | - | *(40) | *(40) | *(40) | … | *(40) | *(40) | *(40) | - |
| Cash Inflow | - | - | - | *718 | *718 | … | *628 | *634 | *641 | *647 |
| Profit after tax | - | - | - | *622 | *622 | … | *572 | *578 | *585 | *591 |
| Depreciation saving | - | - | - | *56 | *56 | … | *56 | *56 | *56 | *56 |
| Net cash flow | *(1000) | *(1000) | *(1040) | *678 | *678 | … | *588 | *594 | *601 | *647 |
* Unit: Million USD.
Table 5.
Cash-flow data sheet for Project C (Brazil, 2011).
| Period | Construction | Operation | ||||||||
|---|---|---|---|---|---|---|---|---|---|---|
| Year | 1 | 2 | 3 | 4 | 5 | … | 21 | 22 | 23 | 24 |
| Cash outflow | *(950) | *(950) | *(950) | *(980) | *(30) | … | *(30) | *(30) | *(30) | - |
| Capital Expenditure | *(950) | *(950) | *(950) | *(950) | - | … | - | - | - | - |
| Net working capital | - | - | - | *(30) | *(30) | … | *(30) | *(30) | *(30) | - |
| Cash Inflow | - | - | - | - | *644 | … | *600 | *604 | *607 | *611 |
| Profit after tax | - | - | - | - | *580 | … | *536 | *539 | *543 | *546 |
| Depreciation saving | - | - | - | *64 | … | *64 | *64 | *64 | *64 | |
| Net cash flow | *(950) | *(950) | *(950) | *(950) | *614 | … | *570 | *574 | *577 | *611 |
* Unit: Million USD.
Table 6.
Profitability-calculation results.
| Profitability Indicators | Project K (Indonesia, 2009) | Project C (Brazil, 2011) |
|---|---|---|
| NPV (Million USD/Billion KRW) | 1432/1525 | 901/1011 |
| IRR (%) | 15.25% | 11.08% |
| Decision Making Result | Investment approval | Investment approval |
Table 7.
Probability-distribution-fitting results for major profitability impact factors.
| Profitability Impact Factors | Unit | Project K (Indonesia, 2009) | Project C (Brazil, 2011) | |||
|---|---|---|---|---|---|---|
| Probability Distribution | Variation | Probability Distribution | Variation | |||
| Capital expenditure | Million USD | Triangular | Min: 2900 Mode: 3000 Max: 3200 | Triangle | Min: 3600 Mode: 3800 Max: 4600 | |
| Material cost | Million USD/Year | Triangular | Min: 470 Mode: 490 Max: 530 | Triangle | Min: 440 Mode: 460 Max: 490 | |
| Labor cost | Million USD/Year | Uniform | Min: 280 Max: 310 | Uniform | Min: 260 Max: 290 | |
| Net working capital | Million USD/Year | Uniform | Min: 30 Max: 50 | Uniform | Min: 25 Max: 35 | |
| Overhead cost | Million USD/Year | Uniform | Min: 40 Max: 60 | Uniform | Min: 25 Max: 35 | |
| Sale price | Million USD/Million tons | Exponential | β: 26.7 Min: 620 Mean: 680 | Triangle | Min: 600 Mode: 630 Max: 650 | |
| Production | Million USD/Year | Uniform | Min: 2.8 Max: 3.1 | Uniform | Min: 2.95 Max: 3.1 | |
| Exchange rate | KRW/USD | Beta | α1: 1.1427, α2: 3.4881 Min: 755.75 Max: 1973.80 | Normal | μ: 1122.10 σ: 175.92 | |
| Corporate tax rate | % | Triangular | Min: 25 Mode: 28 Max: 30 | Uniform | Min: 34 Max: 34 | |
| Debt/(equity + debt) | Uniform | Min: 0.55 Max: 0.70 | Uniform | Min: 0.45 Max: 0.60 | ||
| Cost of equity | Risk-free interest rate | % | Uniform | Min: 1.0783 Max: 5.8217 | Uniform | Min: 0.9135 Max: 5.1265 |
| Market risk premium | % | Triangular | Min: 5.6759 Mode: 5.6759 Max: 10.4031 | Uniform | Min: 5.2502 Max: 8.8857 | |
| Beta | Uniform | Min: 1.07 Max: 1.17 | Uniform | Min: 0.89 Max: 0.91 | ||
| Cost of debt before tax | % | Uniform | Min: 2.90 Max: 6.70 | Triangular | Min: 3.128 Mode: 3.128 Max: 6.106 | |
| Country risk | % | Uniform | Min: 2.4 Max: 4.4 | Uniform | Min: 3.0 Max: 3.8 | |
Table 8.
Simulation summary statistics for the net present value (NPV).
| Item | Project K (Indonesia, 2009) | Project C (Brazil, 2011) |
|---|---|---|
| Probability Distributions of the Net Present Value (NPV) | 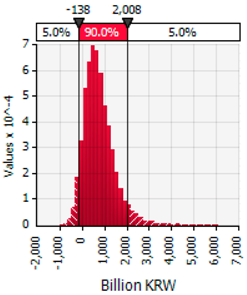 | 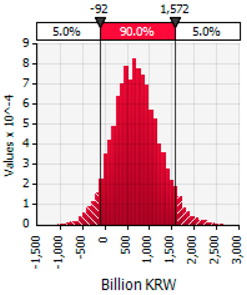 |
| Minimum | *(1030) | *(1047) |
| Maximum | *6139 | *2665 |
| Mean | *764 | *704 |
| Std. Dev. | *673 | *506 |
| NPV0.05 | *(138) | *(92) |
| Decision-making Result | Investment rejection | Investment rejection |
* Unit: Billion KRW.
Table 9.
Sensitivity analysis of the net present value (NVP) for the two projects.
| Project K (Indonesia, 2009) | Project C (Brazil, 2011) |
|---|---|
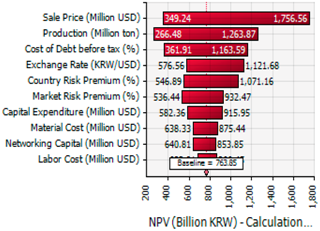 | 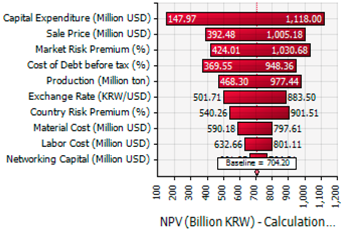 |
Table 10.
Most vulnerable risk-factor selection.
| Project K | Weighted Relation between Major Profitability Impact Factors & Risk Factors | 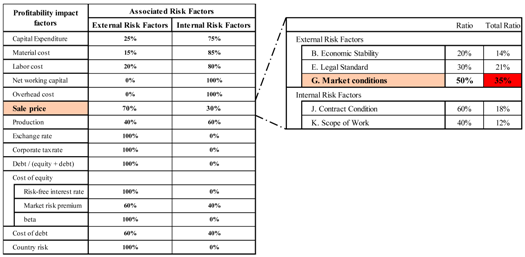 |
| Business-Version PDRI | 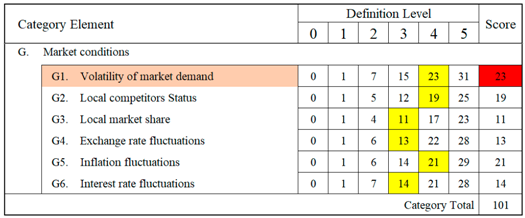 | |
| Project C | Weighted Relation between Major Profitability Impact Factors & Risk Factors |  |
| Business-Version PDRI | 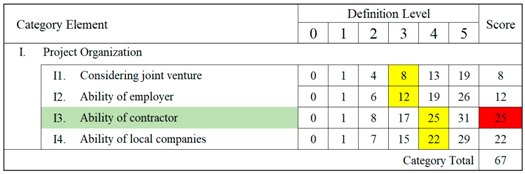 |
Table 11.
Investment decisions for the net present value (NPV0.05) for the identification of the alternatives from an improved process.
Table 11.
Investment decisions for the net present value (NPV0.05) for the identification of the alternatives from an improved process.
| Risk Factor | TRIZ Method | Probability Distribution | Variation | NPV0.05 (Billion KRW) | Proposed Decision Making |
|---|---|---|---|---|---|
| Alternative Solution | |||||
| G1. Volatility of Market Demand (Project K) | 9. Continuous action—Interrupted action | Uniform | Min: 630 Max: 630 | (204) | Rejection |
| → Planning associated downstream project | |||||
| 11. Direct action—Indirect action → Ensuring local buyers | Exponential | β: 26.7 Min: 626.2 Mean: 686.8 | (40) | Rejection | |
| 12. Preliminary action—Preliminary counteraction → Ensuring long-term off-takers √ | Triangular | Min: 626 Mode: 656 Max: 676 | 65 | Approval | |
| I3. Ability of Contractor (Project C) | 3. Homogeneity—Diversity → Ordering EPC Lump-sum Turnkey √ | Triangular | Min: 3900 Mode: 4000 Max: 4200 | 26 | Approval |
| 4. Expansion—Reduction → Utilizing competitive bid techniques | Triangular | Min: 3400 Mode: 3400 Max: 4800 | (147) | Rejection | |
| 7. Standardization—Specialization → Collaboration-capable local companies | Triangular | Min: 3500 Mode: 3600 Max: 4700 | (126) | Rejection |
© 2018 by the authors. Licensee MDPI, Basel, Switzerland. This article is an open access article distributed under the terms and conditions of the Creative Commons Attribution (CC BY) license (http://creativecommons.org/licenses/by/4.0/).
Share and Cite
MDPI and ACS Style
Kim, Y.; Lee, E.-B. A Probabilistic Alternative Approach to Optimal Project Profitability Based on the Value-at-Risk. Sustainability 2018, 10, 747. https://doi.org/10.3390/su10030747
AMA Style
Kim Y, Lee E-B. A Probabilistic Alternative Approach to Optimal Project Profitability Based on the Value-at-Risk. Sustainability. 2018; 10(3):747. https://doi.org/10.3390/su10030747
Chicago/Turabian StyleKim, Yonggu, and Eul-Bum Lee. 2018. "A Probabilistic Alternative Approach to Optimal Project Profitability Based on the Value-at-Risk" Sustainability 10, no. 3: 747. https://doi.org/10.3390/su10030747
Note that from the first issue of 2016, this journal uses article numbers instead of page numbers. See further details here.