Estimation of Leakage Ratio Using Principal Component Analysis and Artificial Neural Network in Water Distribution Systems


Department of Civil & Environmental Engineering, Incheon National University, Incheon 22012, Korea
*
Author to whom correspondence should be addressed.
Sustainability 2018, 10(3), 750; https://doi.org/10.3390/su10030750
Submission received: 2 February 2018
/
Revised: 4 March 2018
/
Accepted: 5 March 2018
/
Published: 9 March 2018
(This article belongs to the Special Issue Urban Water Management)
Abstract
:Leaks in a water distribution network (WDS) constitute losses of water supply caused by pipeline failure, operational loss, and physical factors. This has raised the need for studies on the factors affecting the leakage ratio and estimation of leakage volume in a water supply system. In this study, principal component analysis (PCA) and artificial neural network (ANN) were used to estimate the volume of water leakage in a WDS. For the study, six main effective parameters were selected and standardized data obtained through the Z-score method. The PCA-ANN model was devised and the leakage ratio was estimated. An accuracy assessment was performed to compare the measured leakage ratio to that of the simulated model. The results showed that the PCA-ANN method was more accurate for estimating the leakage ratio than a single ANN simulation. In addition, the estimation results differed according to the number of neurons in the ANN model’s hidden layers. In this study, an ANN with multiple hidden layers was found to be the best method for estimating the leakage ratio with 12–12 neurons. This suggested approaches to improve the accuracy of leakage ratio estimation, as well as a scientific approach toward the sustainable management of water distribution systems.
1. Introduction
Analysis of water supply is a required procedure for assessing the capacity and operating plan of facilities used in water distribution systems, such as a water purification plant, reservoir, pumping station, and water intake pipe [1].
The study on water supply networks put priority on the analysis of the pipe network, improvement of reliability, diagnosis of pipe network technology, and evaluation of aging equipment and facilities for optimum water distribution. In the case of water distribution networks, continuous and stable supply is required with a reasonable distribution and timely fluctuating demand under appropriate pressure [2]
To respond to an accident such as the destruction of water pipes, a facility needs high stability to minimize damage to water users. To improve the reliability of a water distribution system, researchers have studied the durability of the pipe network and structural improvement [3,4,5,6,7]. The technical development of a water supply network requires comprehensive assessment technology for water quality modeling [8].
Standardization of indicators, survey methods, and procedures for pipe network diagnosis are increasingly important in system design, operation, and maintenance [9]. A new plan for systematic maintenance analyzed the impact of pipe damage on the entire network in determining priority in water pipe improvement and waterworks maintenance [10,11]. Though projects to improve aging waterworks are being implemented, no improvements have been made due to evaluation by the empirical data-based assessment system.
The leakage water ratio, that is the ratio between water loss and water entering the network (tap water produced at a water purification plant), including physical water losses from leakage, pipe failure, and accidents in the pipe network. Leakage of the tap water supply is a factor deteriorating waterworks management and holds the greatest influence over the non-revenue water (NRW) ratio.
The maintenance project for a water supply network to manage leakage focuses on rehabilitation and replacement of old water pipes using methods to evaluate such pipes, but the evaluation of how the main parameters affected water distribution systems was not applied. Therefore, factors affecting leaks should be identified and analyzed when making decisions on the priority of projects for the maintenance of water supply networks.
Scientific and systematic approaches are needed that consider economic factors such as water quality and pressure and the costs of facility improvement, energy, and maintenance. Crucial to these processes is identification of the physical and operational factors that affect leaks in a water network and provide a methodology for leak reduction [12].
Winarni (2009) found a performance indicator for facility management in water supply systems by comparing the infrastructure leakage index (ILI) [13,14]. Efforts to reduce leaks and commercial losses cost money, especially if large pipe sections need replacement. Nevertheless, studies have shown that efforts toward conservation and NRW reduction can provide water at half to a third of the cost of water production [15]. A variety of studies have also focused on the effective parameters of a water distribution network [16,17,18].
An artificial neural network (ANN) is a model that learns the causal relationship between independent and dependent variables and estimates dependent variables through statistical learning algorithms. Sufficient data for independent variables constitute the optimal statistical learning algorithm used to describe dependent variables of ANN but the algorithm is difficult to use if training data are insufficient. Due to the lack of learning data for estimating leakage of water networks, the number of case studies on leak estimation using ANN remain few.
In this study, the leakage ratio for the leakage quantity forecast of a DMA (District Metered Area) was estimated through principal component analysis (PCA) and ANN. To estimate the leakage ratio using an ANN and the main factors in the selected water distribution network through previous research, the ANN devised a model for predicting the leakage ratio.
Predictability analysis of leakage ratio forecasting by ANN was conducted for promoting sustainable water management. In addition, it is important to selecting a priority pipe network improvement project of water supply systems among various district metered area using developed methodology.
Data were improved through data standardization (Z-score) and PCA to improve the prediction accuracy of the ANN model. The hidden layers of the ANN used were divided into single and multi. The procedure of the study is shown in Figure 1.
2. Theoretical Background
An ANN was used as a statistical analysis method to find correlations between leading factors in a water distribution system. The Z-score and PCA were further utilized as methods to use the data for statistical analysis.
In addition, accuracy assessment was performed to compare the simulation results obtained through ANN and measured data. Chapter 2 covers the theories of the statistical methods used.
2.1. ANN for Leakage Ratio Estimation
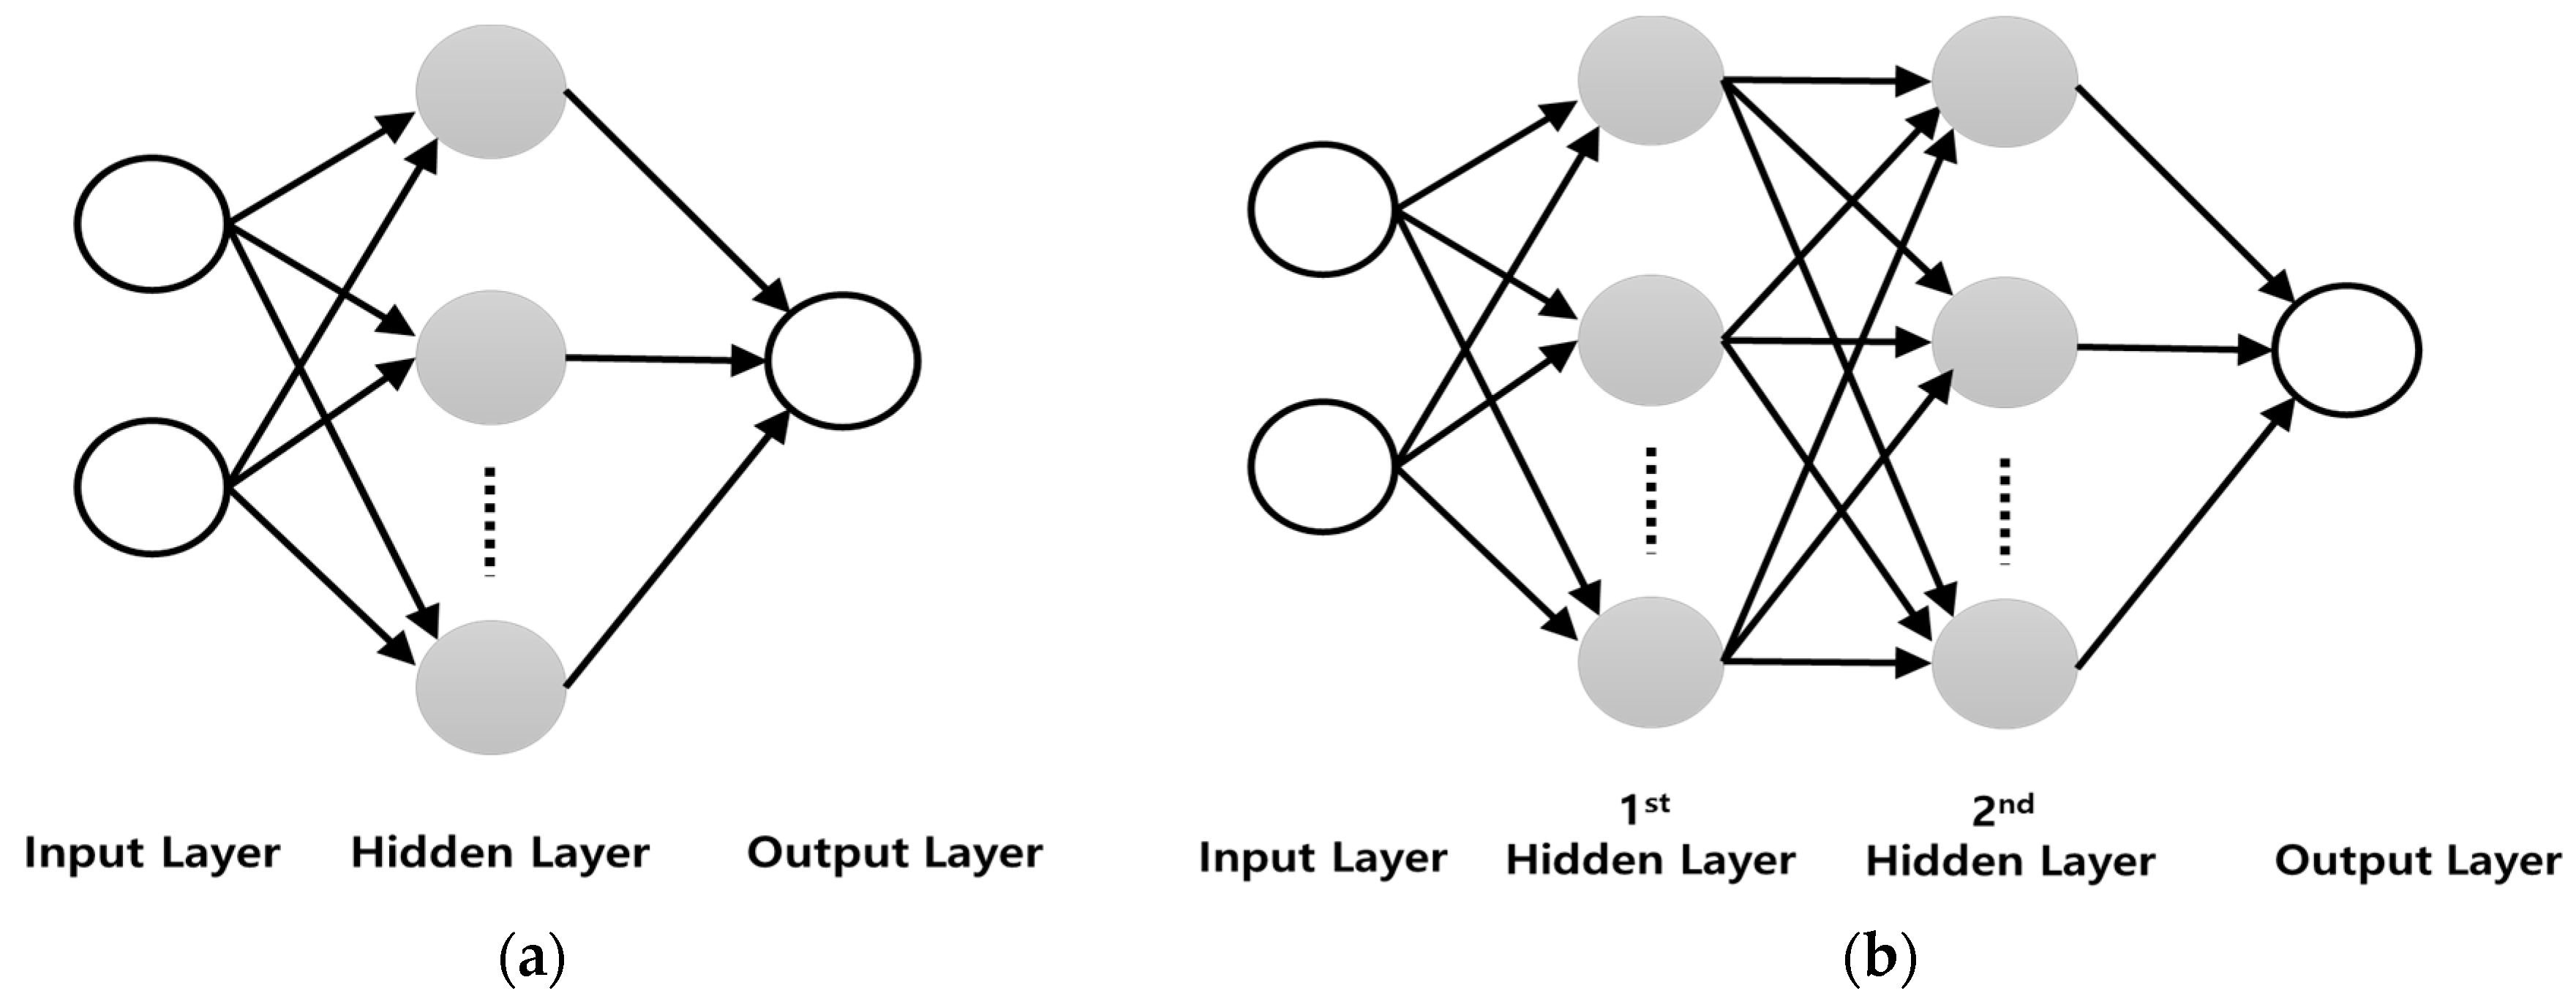
The analysis procedure of the ANN consists of the input, hidden, and output layers as shown in Figure 2, and learning and output are done through the back-propagation algorithm.
According to Haykin, a neural network is a massively parallel distributed processor with a natural propensity for storing experiential knowledge and making it available for use. It resembles the human brain in two aspects: knowledge is acquired by the network through a learning process and inter-neuron connection strengths (known as synaptic weights) are used to store knowledge. The ANN procedure used is a feed-forward network type with input, hidden, and output layers as shown in Figure 2 [19].
Neurons in the input layer simply act as a buffer. Those in other layers are interconnected by means of weights. The neurons in the hidden and output layers comprise the activation function, or a sigmoidal activation function when used here. The input for each neuron in the hidden layer is the sum of the weighted input signal . (, in which is the interconnecting weight between the neuron in the hidden layer and neuron in the input layer. The output from the neuron is given by Equation (1) [20].
Learning by the error propagation algorithm compares the calculated value of all directions of the neural network with the target value for learning, and adjusts the connection strength (weighing factor) so that the square sum of the errors is minimized. This is performed until the error meets a certain value, and when the iteration is finished, the final value is calculated as output.
2.2. Data Transformation through PCA
PCA is mathematically defined as an orthogonal linear transformation that converts data into a new coordinate system, so that the greatest variance by the data’s projection lies on the first coordinate (called the first principal component), the second greatest variance on the second coordinate and so on.
Consider the data matrix X with a column-wise zero empirical mean (the sample mean of each column has been shifted to zero); each of the n rows represents a different repetition of the experiment, and each of the p columns is a kind of feature. Mathematically, the transformation is defined by a set of p-dimensional vectors of weights or loadings that map each row vector of X to a new vector of principal component scores , given by Equation (2) [20].
tk(i) = x(i)·w(k),
for i = 1, …, n k = 1, …, m
So that the individual variables of t considered over the data set successively inherit the maximum possible variance from x, each loading vector w is constrained to be a unit vector.
2.3. Data Standardization Using Z-Score
The Z-score method can be used to distinguish the difference and distribution of the data used when conducting result analysis. The mean and standard deviation are used to determine how far the data deviate from the average when standard deviation is taken as a unit, and the method of z-calculation is shown in Equation (3) [21].
where, is the mean of the population and σ is standard deviation of the population.
For parameters of a water distribution systems, the number of units used and the range of values vary according to the DMA scale. The Z-score thus has the advantage of unifying the ranges of the parameters used and facilitating the comparison between them. This also serves as a statistical procedure required before performing PCA.
2.4. Accuracy Assessment for Selecting Optimal ANN Model
To evaluate the accuracy of the leakage ratio using the ANN developed in this study, an error ratio analysis was performed to evaluate the difference between the measured and simulated values. Accuracy assessment can be estimated by comparing the measured value with that generated by the simulation.
The mean absolute error (MAE), mean square error (MSE), and BIAS were used to evaluate the bias of the estimation results, as well as the prediction method using the G-value. The calculation method of each equation is shown in Equations (4)–(7).
where, is the estimated value at and is the mean value of total usage data
If MAE and MSE are smaller, the estimated value indicates high accuracy. If the BIAS is close to zero, the estimation result is less biased. A G-value of 100 is a perfect estimation. If the G-value is negative, this means lower reliability than using the average of data values as a predictor [22].
3. Selection of Test Area and Leakage Ratio Parameters
In this study, data on each DMA were required for the calculation of the leakage ratio using an ANN in a water distribution system. The test area where sufficient data were available was selected in Incheon, one of Korea’s five largest cities.
Jo, et al. (2016) collected 135 sets of DMA data from Incheon and proposed an NRW ratio estimation formula using multiple regression analysis [12]. In this study, PCA-ANN was applied to Incheon, a city that has a relatively well-established system and statistical analysis.
Additional DMA data were collected so that 164 sets of DMA data were used for ANN and basic statistical analysis. The leakage ratio was calculated from the total supply amount excluding revenue water and unbilled authorized consumption.
The survey studied the status of water supply, waterworks facilities, and operating status, as well as the water supply index of the Incheon Waterworks Maintenance Plan established in 2015 [23,24].
3.1. Status of Waterworks in Test Area
The test bed for this study was the administrative area of Incheon. The data were surveyed on the area’s status, waterworks facilities, and their operating state, as well as the water supply indicators of basic plans for the Incheon waterworks. In addition, data on water pipe network analysis and model simulation results were collected [23,24].
Incheon has a water user of 2,851,491 and a water supply ratio of 98.3%. The daily water supply per person is 343 L per capita per day (LPCD), and the water supply area has nine districts. The city has 24 reservoirs, 68 pumping stations, and water supply pipe spanning 3634 km from reservoir to water supply tap [24].
3.2. Selection of Leakage Effective Parameters
After analysis of the technical diagnosis results of Incheon’s water supply network that was established in 2015, the leakage amount of a DMA was found to be a factor having great influence over the deterioration of the pipeline [25]
Factors influencing leakage included water supply quantity, pipe length, average pipe diameter, frequency of leaks, district characteristics, pipe network configuration, and water pressure [12].
The demand energy ratio represents the ratio of the energy supply required for demand for water quantity and the appropriate hydraulic energy required for customer service. The higher the demand energy ratio, the higher the supply pressure, so leaks in the pipe network were likely to increase [12,20].
As for water supply data from DMAs in Incheon, the main parameters selected included the pipe deterioration ratio, water supply quantity and pipe length extension per demand junction, mean pipe diameter, the number of leaks, and the demand energy ratio. The selected six parameters were factors influencing the leakage ratio, which was selected by statistical analysis as a major effective parameter of a water supply system [12,20].
Data from 164 DMAs were used in all 367 DMAs of Incheon except for those unconstructed or unmeasured or those with unblocked or unsteady operations.
4. Leakage Ratio Estimation Using PCA-ANN
4.1. Construction of Simulation Model
Table 1 shows the ANN simulation classification using standardized data generated by the Z-score method. Simulation cases were classified into three categories based on principal component analysis (PCA), the number of hidden layers in ANNs, and the number of neurons in hidden layers.
This simulation case was selected because the accuracy of leakage ratio estimation was different according to the comparison of estimation accuracy with PCA, the number of hidden layers, and that of neurons used in the hidden layer.
Simulation cases were determined with the number of neurons based on research showing that an ANN presented optimal simulation results with fewer than twice the independent variables proposed by Heaton (2005) [26]. The simulation was constructed with six neurons equal to the number of independent variables used in the condition and 12 neurons corresponding to twice the number of independent variables used in the condition.
In the two hidden layers, the number of neurons in the first hidden layer was set to six and 12, and the same number of neurons was applied to the second.
When using the principal components, a simulation case was classified into the condition using the six principal components generated through PCA and four principal components showing an eigenvalue of 85%.
In constructing an ANN model, 80% of total data are learned and 20% verified to simulate the constructed neural network. The hyperbolic tangent function is used for the activation function and the conjugate gradient method is used as the optimization algorithm. The minimum variation of the learning error is 0.0001, and the minimum relative variation of the learning error is 0.001. The results are repeatedly calculated until the error is minimized.
4.2. Results of Leakage Ratio Simulation Using ANN
4.2.1. Z-Score Analysis
Standardized data through the Z-score were produced to examine the suitability of statistical analysis of the data as a preliminary analysis for estimating the leakage ratio through PCA-ANN. A standardized analysis using factor data from 164 DMAs was performed. The outlier was removed by the Z-score. The Z-score results of all parameters are shown in Figure 3.
The analysis showed that the Z-score of the factors analyzed in 10 DMAs was more than ±3. The number of DMAs failing to satisfy the Z-score was three for pipe length per demand junction, one for average pipe diameter, two for water supply quantity per demand junction, two for the demand water ratio, and one for the leakage ratio.
Data exceeding the Z-score’s specific range were considered abnormal values in the statistical analysis and could affect the analysis results. Therefore, the simulation cases in Table 1 were performed by removing the values exceeding the reference value by the Z-score.
4.2.2. Principal Component Analysis
Principal component analysis (PCA) was performed using selected DMA data for the deteriorated pipe ratio, water supply quantity and pipe length per demand junction, mean pipe diameter, the number of leaks, and the demand energy ratio as the main parameters of a water distribution system.
Table 2 shows the PCA results. Component 1, the most generated, showed 38.8% of the six parameters and Component 2 showed 22.6%. Both components accounted for 61.5% of all factors and Components 1–4 had an overall eigenvalue of 87.7%.
Table 3 shows the weighting coefficients showing the relationship between the six principal components and the six used parameters. Component 1 has a positive relationship with pipe length and water supply quantity per demand junction. It has a negative relationship with the deteriorated pipe ratio and the number of leaks.
Component 2 has the closest relationship to the mean pipe diameter. Component 3 has a high positive relationship with the demand energy ratio and a negative relationship with other parameters. Components 5–6 are less relevant than Components 1 to 4, and their eigenvalues are relatively low.
4.2.3. ANN Simulation Results
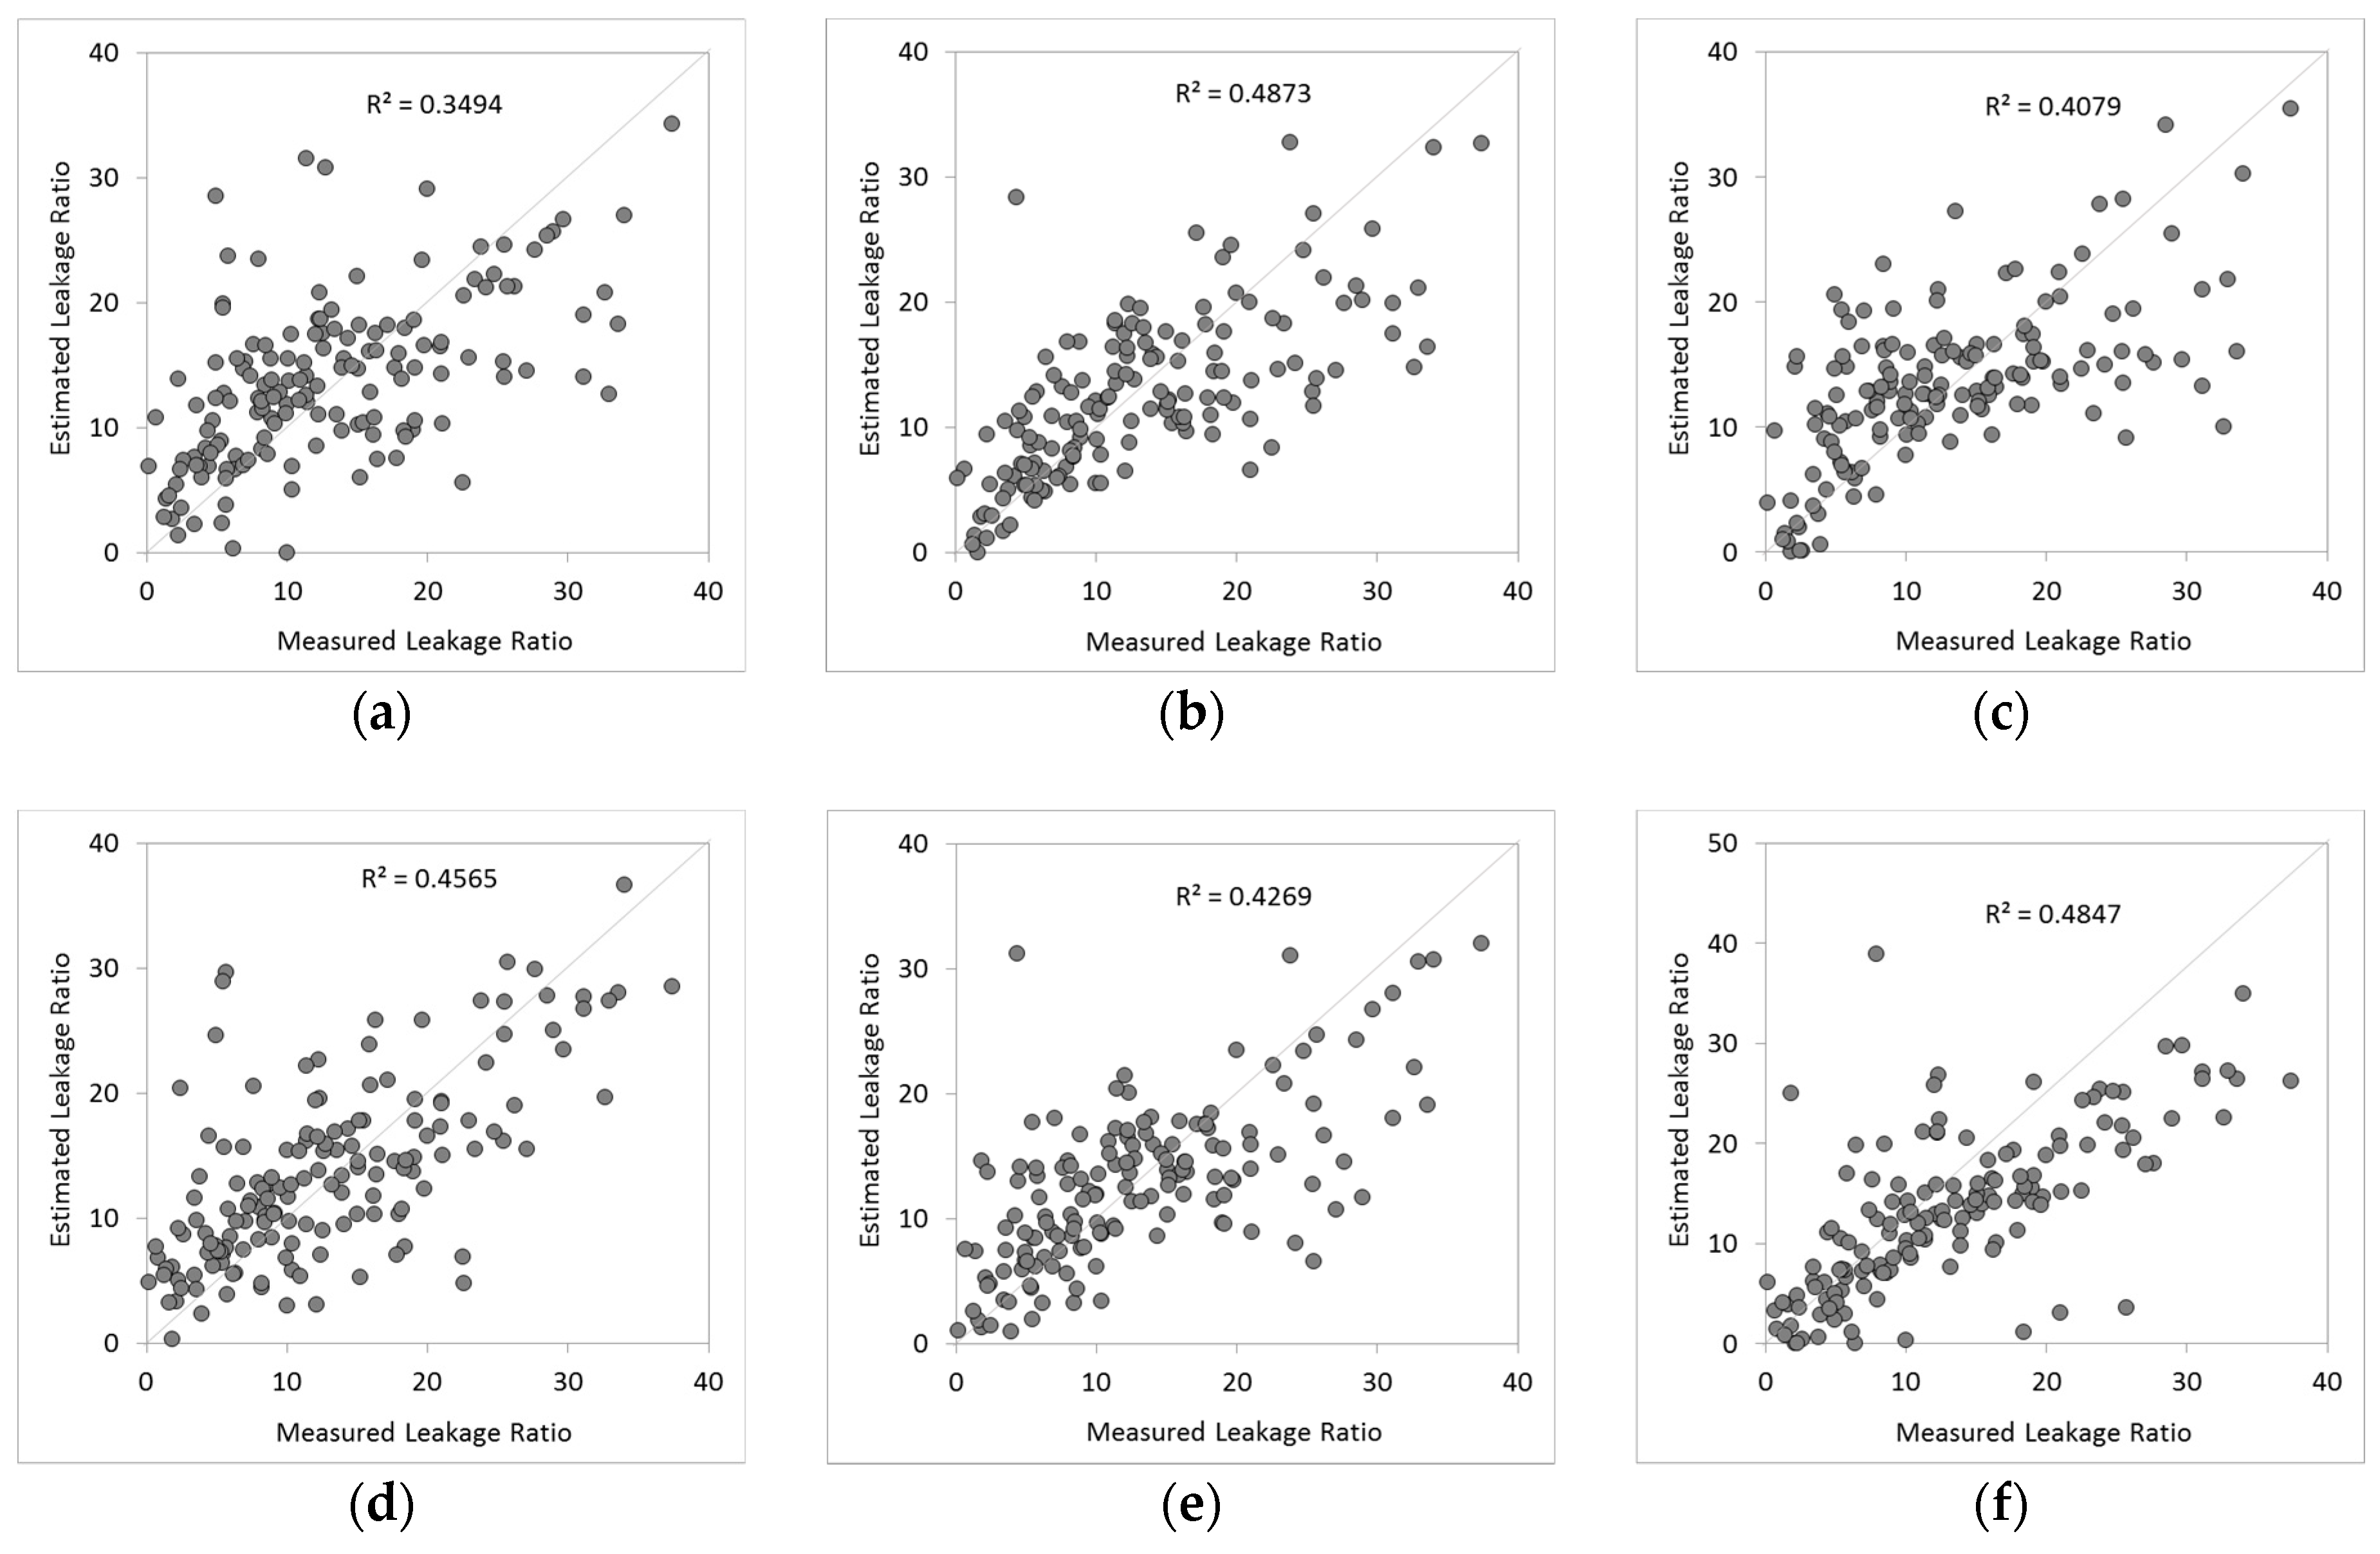
The results of the simulated leakage ratio for Case 1 were compared with the measured leakage ratio. Figure 4 has graphs comparing the leakage ratio between measured and simulated values using original parameters. The result of estimating the leakage ratio through the ANN using the original data of the six parameters were analyzed using the determination coefficient , in which the measured leakage ratio was on the x axis and the simulated leakage ratio by ANN on the y axis.
Figure 4a,b show that the number of neurons under the condition of a single hidden layer of an ANN is 6 and 12. Based on correlation coefficient analysis, 12 neurons (Case 1-1-2) converged relatively well on the y = x graph than six (Case 1-1-1). Figure 4c–f show the condition in which two hidden layers were used in an ANN, and the number of neurons was 6-6, 6-12, 12-6, and 12-12 (hidden layer 1–hidden layer 2).
Under the condition in which multi-hidden layers were used, the determination coefficient was the highest at 0.49 when 12 neurons were used in each of the first and second hidden layers. This indicates that the condition with 12 neurons in each hidden layer was similar to the predicted leakage ratio.
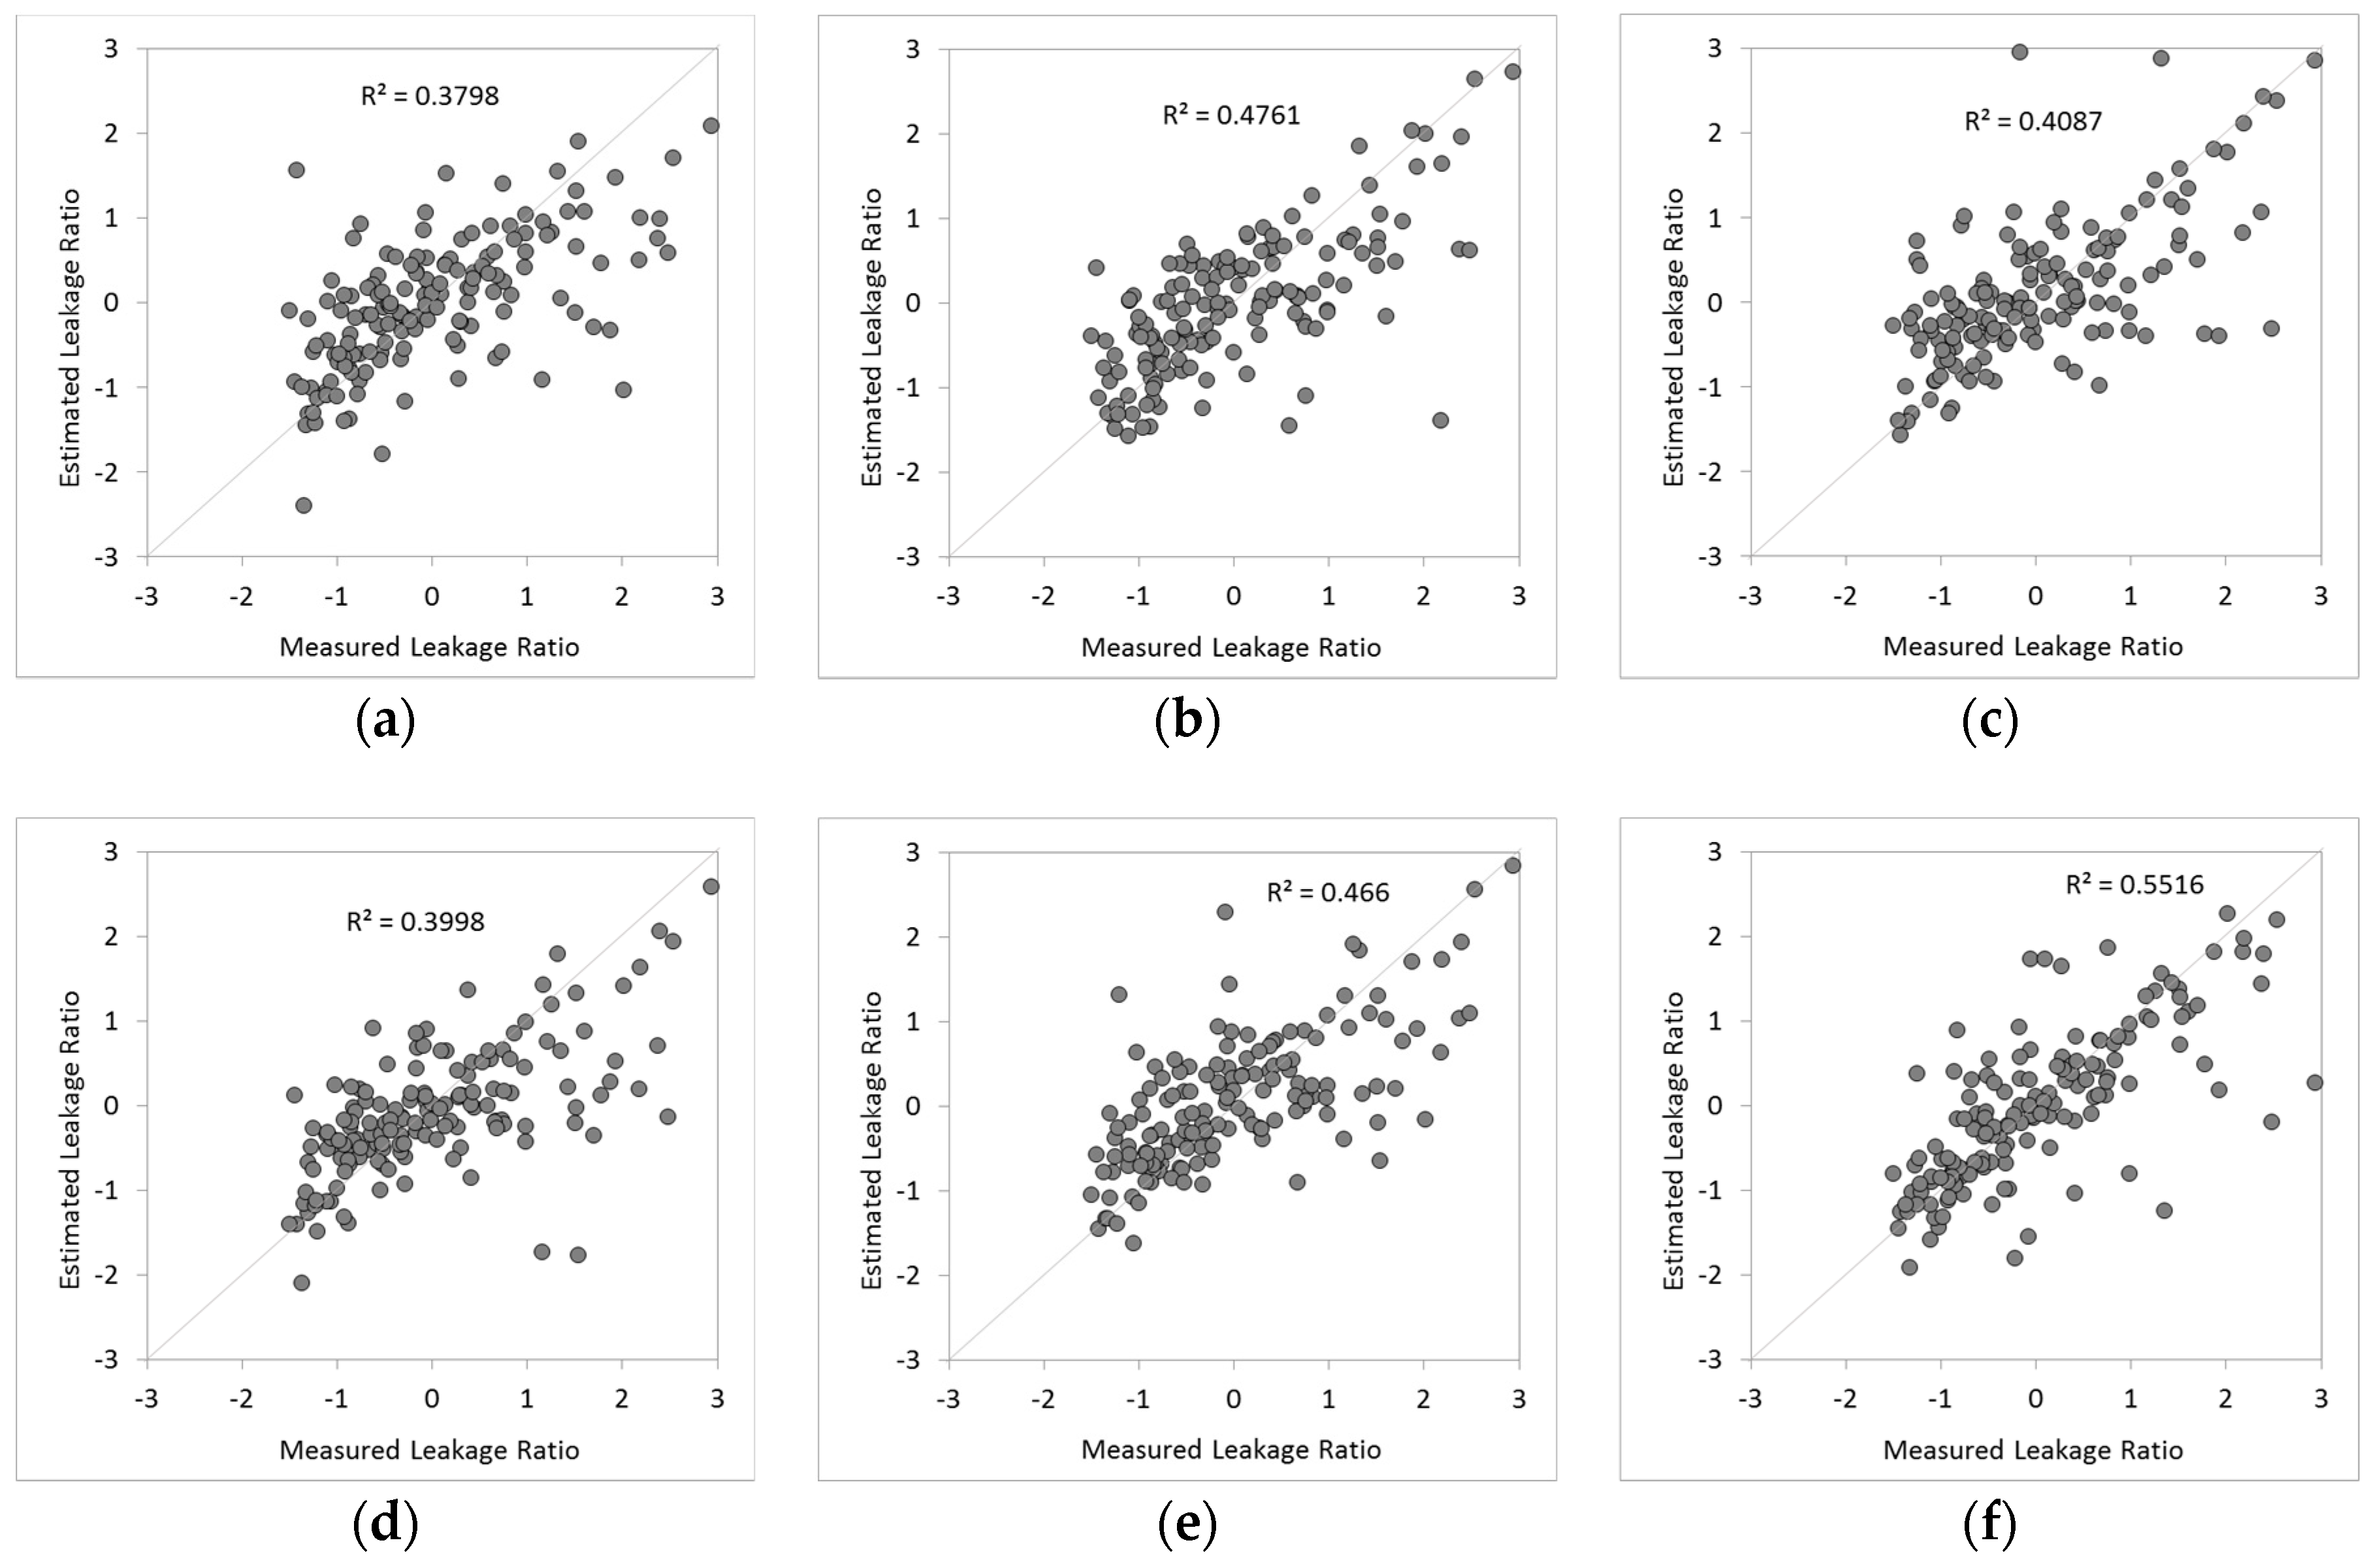
Figure 5 shows the results of the comparison of the simulated and measured leakage ratios calculated by ANN using six principal components.
Figure 5a,b show the number of hidden neurons in six and 12 neurons on a single hidden layer of the ANN model. Because of the determination coefficient, 12 neurons (Case 2-1-2) converged relatively better on the y = x graph rather than six (Case 2-1-1) saw the same results as Case 1. The difference was insignificant compared to the case of original data usage.
Figure 5c–f show the results of the leakage ratio using 6-6, 6-12, 12-6, and 12-12 neurons in multi-hidden layers of the ANN model. In the multi-hidden layers, the determination coefficient was the highest at 0.55 when 12 neurons were used in the first and second hidden layers. The conclusion was that the condition using multi-hidden layers predicted the leakage ratio more accurately than that using a single hidden layer.
Figure 6 shows the results of the comparison of the simulated and measured leakage ratios calculated by ANN using four principal components.
Figure 6a,b show that the number of neurons in the hidden layer is six and 12 on the single hidden layer of the ANN model. In all the experimental cases, 12 neurons, or twice the number of independent variables used in the ANN model, reflect the measured leakage ratio better than six.
Figure 6c–f show the condition in which multi-hidden layers were used in ANN with the neurons of 6-6, 6-12, 12-6, 12-12 (hidden layer 1–hidden layer 2). Under the condition in which multi-hidden layers were used, the determination coefficient was the highest at 0.43 when six neurons were used in the first hidden layer and 12 in the second; this is a different result than in cases using the original data and six principal components.
4.2.4. Accuracy Assessment of ANN Simulation
The most reliable case for estimating the test area’s leakage ratio was selected using PCA-ANN. Accuracy assessment was determined by using the mean absolute error (MAE), mean squared error (MSE), BIAS, and G-value (goodness of prediction) for the measured leakage ratio and ANN simulation results. Table 4 shows the accuracy assessment results for all simulation cases.
If the calculated value of the MAE and MSE is small, this means that the estimated value is correct to the measured value. When using the original data, the measured leakage ratio and the most accurate simulation results were obtained when 12 neurons were used in a single hidden layer (Case 1-1-2). In addition, the best result close to 100 in the G value was found in Case 1-1-2 among Case 1 simulations. On the other hand, for BIAS, which shows bias of the data, the estimation results were not found to be biased in Case 1-2-4, in which 12 neurons were used in the first and second hidden layers in the multiple layer case.
When using the six principal components via PCA, the most accurate simulation results were obtained when 12 neurons were used in the first and second hidden layers 1 and 2 in multiple layer case (Case 2-2-4). In addition, the best result close to 100 in the G-value was found in Case 2-2-4. On the other hand, for PBIAS, which shows bias of the data, the principal component was used and a zero value appeared in the single layer condition (Case 2-1-1) using six neurons. In Case 2-2-4, the BIAS value was 0.02 and considered to have nearly no bias. Case 2-2-4 was also selected as the most accurate model in comparison with Cases 1and 3.
Based on the results of using four principal components, the measured leakage ratio and the most accurate simulation results were obtained when using six neurons in the first hidden layer and 12 in the second (Case 3-2-2). When more than 12 neurons were used, the G-value was found to exceed 40, but the overall accuracy was lower than that of Case 2, which saw six principal components used. Compared with Case 1, which used the original data, accuracy was relatively low in a small number of cases using neurons.
5. Conclusions
This study estimated the leakage ratio using PCA-ANN. For this purpose, data on effective parameters of the leakage ratio were collected. Data conversion was performed for statistical analysis through the Z-score and an ANN model was devised. The model used to estimate the optimal leakage ratio was selected through accuracy assessment. The study’s conclusions are as follows.
Use of the principal components calculated from PCA was found to improve the accuracy of leakage ratio estimation more than through an ANN model using general observation data. Using all the components calculated by PCA improved the accuracy of leakage ratio estimation.
The ANN used in the study was divided into single and multi-hidden layers. The accuracy of leakage ratio estimation was found to be higher when using multi-hidden layers instead of the single hidden layer in the case using principal components. Yet when the leakage ratio was estimated using the original data, the accuracy was high when one hidden layer was used. Since estimation accuracy depends on the number of hidden layers, the number of hidden layers considering the test area and simulation conditions should be decided according to the factors used in a test area.
This study used six main parameters of water distribution systems to estimate the leakage ratio. The number of neurons in the ANN’s hidden layer was set to one and two times the independent variables used. The accuracy of leakage ratio estimation was higher if the number of neurons was twice that of the independent variables used. The conclusion was that leakage ratio estimation by ANN simulation proved that accurate predictions can be made using double neurons as independent variables.
The six main parameters proposed in previous research were applied to leakage ratio estimation, then the resulting determination coefficient was found to exceed 0.5. Incheon has yet to fully establish the construction of DMAs because of the city’s high ratio of deteriorated pipes and low level of DMA construction compared to a newly developed city. Therefore, accurate predictions of the leakage ratio are expected to rise when the PCA-ANN model is selected for use by an area with a well-run water distribution network.
This study proposes a methodology for predicting the leakage ratio using PCA-ANN, and is expected to prove useful for finding the causes of leaks and damage in pipe networks and prioritizing the tasks for optimal operation and management of water distribution systems.
Author Contributions
Dongwoo Jang performed the data analysis and modeling simulation. Gyewoon Choi contributed suggestion of methodologies and examines the paper. Hyoseon Park performed English proofreading and analyzed the results.
Conflicts of Interest
The authors declare no conflict of interest.
References
- Choi, G.W.; Jang, Y.G.; Lee, S.W. Effect of Estimation Method of Demand Water on the Analysis of Water Distribution System. In Proceedings of the Korea Water Resources Association Conference, Jeju, Korea, 18–19 May 2006; pp. 1425–1430. [Google Scholar]
- Jun, H.D.; Park, M.J.; Kim, J.H.; Lee, H.G. Development of a Method to Reduce Damages by Pipe Failures. J. Korean Soc. Hazard Mitig. 2008, 8, 31–36. (In Korean) [Google Scholar]
- Kim, S.W. Development of Optimal Decision-Making System for Rehabilitation of Water Distribution Systems Divided by Small Division. Master’s Thesis, Korea University, Seoul, Korea, 2004. (In Korean). [Google Scholar]
- Gonalves, F.V.; Ramos, H.M.; Reis, L.F. Hybrid Energy System Evaluation in Water Supply System Energy Production: Neural Network Approach. Int. J. Energy Environ. 2010, 1, 21–30. [Google Scholar]
- Koo, D.J. Management of Water Distribution Pipe Networks Using BFS Algorithms. Master’s Thesis, Chonnam National University, Gwangju, Korea, 2006. (In Korean). [Google Scholar]
- Surendran, S.; Tanyimboh, T.T.; Tabeshb, M. Peaking Demand Factor-based Reliability Analysis of Water Distribution Systems. Adv. Eng. Softw. 2005, 36, 789–796. [Google Scholar] [CrossRef]
- Kim, S.H.; Jun, H.D.; Baek, C.W.; Kim, J.H. Research for Improvement of Water Distribution System Reliability. In Proceedings of the KSCE 2007 Conference & Civil Expo, Daegu, Korea, 10–12 October 2007; pp. 1397–1400. (In Korean). [Google Scholar]
- Park, H.Y. Suggestions for Scientific Management of Pipe Network. KSCE J. Civ. Eng. 2008, 56, 77–82. (In Korean) [Google Scholar]
- Woo, H.M. Development Plans for Distribution Network Improvement in Waterworks System. Water for Future. Korea Water Resour. Assoc. 2008, 41, 16–23. (In Korean) [Google Scholar]
- Park, S.W.; Kim, T.Y.; Lim, K.Y.; Jun, H.D. Fuzzy Techniques to Establish Improvement Priorities of Water Pipes. J. Korea Water Resour. Assoc. 2011, 44, 903–913. (In Korean) [Google Scholar] [CrossRef]
- Park, Y.S. A Study on Long Term Replacement and Maintenance Plan for Multi-Region Water Pipelines Considering Economics. Master’s Thesis, Seoul National University, Seoul, Korea, 2014. (In Korean). [Google Scholar]
- Jo, H.G.; Choi, G.W.; Jang, D.W. Development of the Non-revenue Water Analysis Equation through the Statistical Analysis of Main Parameter in Waterworks System in Incheon City. Crisisonomy 2016, 12, 63–75. (In Korean) [Google Scholar] [CrossRef]
- Winarni, W. Infrastructure Leakage Index (ILI) as Water Losses Indicator. Civ. Eng. Dimens. 2009, 11, 126–134. [Google Scholar]
- Shilehwa, C.M. Factors Influencing Water Supply’s Non Revenue Water: A Case of Webuye Water Supply Scheme. Master’s Thesis, University of Nairobi, Nairobi, Kenya, 2013. [Google Scholar]
- Wyatt, A.S. Non-Revenue Water: Financial Model for Optimal Management in Developing Countries; RTI Press: Amman, Jordan, 2010. [Google Scholar]
- Alegre, H.; Hirner, W.; Baptista, J.M.; Parena, R. Performance Indicators for Water Supply Services; IWA Publishing: London, UK, 2000. [Google Scholar]
- Lambert, A.O.; Brown, T.G.; Takizawa, M.; Weimer, D. A Review of Performance Indicators for Real Losses from Water Supply Systems. J. Water Supply Res. Technol. 1999, 48, 227–237. [Google Scholar]
- Shinde, V.R.; Hirayama, N.; Mugita, A.; Itoh, S. Revising the Existing Performance Indicator System for Small Water Supply Utilities in Japan. Urban Water J. 2013, 10, 377–393. [Google Scholar] [CrossRef]
- Haykin, S. Neural Networks: A Comprehensive Foundation; Macmillan: New York, NY, USA, 1994. [Google Scholar]
- Jang, D.W. Estimation of Non-Revenue Water Ratio Using PCA and ANN in Water Distribution Systems. Ph.D. Thesis, Incheon National University, Incheon, Korea, 2017. [Google Scholar]
- Kreyszig, E. Advanced Engineering Mathematics, 4th ed.; John Wiley & Sons Inc.: Hoboken, NJ, USA, 1979. [Google Scholar]
- Kim, D.H.; Ryu, D.W.; Choi, Y.M.; Lee, W.J. Application of Kriging and Inverse Distance Weighting Method for the Estimation of Geo-Layer of Songdo Area in Incheon. J. Korean Geotech. Soc. 2010, 26, 5–19. (In Korean) [Google Scholar]
- Waterworks Headquarters Incheon Metropolitan City. Technical Diagnostics Report for Re-Establish Basic Plan of Waterworks Maintenance Incheon Water Distribution Network; Incheon Metropolitan City: Incheon, Korea, 2015. (In Korean)
- Waterworks Headquarters Incheon Metropolitan City. Waterworks Status; Incheon Metropolitan City: Incheon, Korea, 2015. (In Korean)
- Jo, H.G. Study on Influence Factors of Non-Revenue Water for Sustainable Management of Water Distribution Networks. Ph.D. Thesis, Incheon National University, Incheon, Korea, 2017. (In Korean). [Google Scholar]
- Heaton, J.T. Introduction to Neural Networks with Java; Heaton Research Inc.: St. Louis, MO, USA, 2005. [Google Scholar]
Figure 1.
Research flowchart for leakage ratio estimation using PCA-ANN.

Figure 2.
Schematic Diagram of Multilayer Feed-Forward Neural Network: (a) Single hidden layer (b) Multi-hidden layer [19].
Figure 2.
Schematic Diagram of Multilayer Feed-Forward Neural Network: (a) Single hidden layer (b) Multi-hidden layer [19].

Figure 3.
Data conversion by Z-score in each metered district of Incheon.

Figure 4.
ANN simulation results using original parameters: (a) Case 1-1-1; (b) Case 1-1-2; (c) Case 1-2-1; (d) Case 1-2-2; (e) Case 1-2-3; (f) Case 1-2-4.
Figure 4.
ANN simulation results using original parameters: (a) Case 1-1-1; (b) Case 1-1-2; (c) Case 1-2-1; (d) Case 1-2-2; (e) Case 1-2-3; (f) Case 1-2-4.

Figure 5.
ANN simulation results using 6 PCA components: (a) Case 2-1-1; (b) Case 2-1-2; (c) Case 2-2-1; (d) Case 2-2-2; (e) Case 2-2-3; (f) Case 2-2-4.
Figure 5.
ANN simulation results using 6 PCA components: (a) Case 2-1-1; (b) Case 2-1-2; (c) Case 2-2-1; (d) Case 2-2-2; (e) Case 2-2-3; (f) Case 2-2-4.

Figure 6.
ANN simulation results using 4 PCA components: (a) Case 3-1-1; (b) Case 3-1-2; (c) Case 3-2-1; (d) Case 3-2-2; (e) Case 3-2-3; (f) Case 3-2-4.
Figure 6.
ANN simulation results using 4 PCA components: (a) Case 3-1-1; (b) Case 3-1-2; (c) Case 3-2-1; (d) Case 3-2-2; (e) Case 3-2-3; (f) Case 3-2-4.


Table 1.
Modeling simulation cases.
| Classification | Hidden Layer | No. of Neurons | Modeling Case |
|---|---|---|---|
| Original data usage case with 6 input parameters | Single layer | 6 | Case 1-1-1 |
| 12 | Case 1-1-2 | ||
| Multiple layer | 12 (6 and 6) | Case 1-2-1 | |
| 18 (6 and 12) | Case 1-2-2 | ||
| 18 (12 and 6) | Case 1-2-3 | ||
| 24 (12 and 12) | Case 1-2-4 | ||
| PCA data usage case with 6 input parameters | Single layer | 6 | Case 2-1-1 |
| 12 | Case 2-1-2 | ||
| Multiple layer | 12 (6 and 6) | Case 2-2-1 | |
| 18 (6 and 12) | Case 2-2-2 | ||
| 18 (12 and 6) | Case 2-2-3 | ||
| 24 (12 and 12) | Case 2-2-4 | ||
| PCA data usage case with 4 input parameters | Single layer | 6 | Case 3-1-1 |
| 12 | Case 3-1-2 | ||
| Multiple layer | 12 (6 and 6) | Case 3-2-1 | |
| 18 (6 and 12) | Case 3-2-2 | ||
| 18 (12 and 6) | Case 3-2-3 | ||
| 24 (12 and 12) | Case 3-2-4 |
Table 2.
Results of principal component analysis (PCA).
| Component | Initial Eigenvalues | ||
|---|---|---|---|
| Total | Variance (%) | Cumulative (%) | |
| 1 | 2.332 | 38.868 | 38.9 |
| 2 | 1.359 | 22.643 | 61.5 |
| 3 | 0.885 | 14.747 | 76.3 |
| 4 | 0.685 | 11.413 | 87.7 |
| 5 | 0.471 | 7.846 | 95.6 |
| 6 | 0.269 | 4.483 | 100.0 |
Table 3.
Weight coefficient of each principal component.
| Classification | Principal Component | |||||
|---|---|---|---|---|---|---|
| 1 | 2 | 3 | 4 | 5 | 6 | |
| Mean pipe diameter | 0.126 | 0.795 | −0.229 | −0.534 | 0.032 | 0.116 |
| Pipe length per junction | 0.809 | 0.222 | −0.019 | 0.420 | 0.109 | 0.328 |
| Water supply quantity per junction | 0.795 | 0.426 | −0.082 | 0.191 | −0.007 | −0.379 |
| Deteriorated pipe ratio | −0.649 | 0.451 | −0.226 | 0.346 | −0.452 | 0.032 |
| Demand energy ratio | −0.261 | 0.464 | 0.844 | 0.051 | 0.038 | −0.006 |
| No. of leaks | −0.736 | 0.278 | −0.249 | 0.254 | 0.502 | −0.055 |
Table 4.
Results of accuracy assessment by ANN simulation.
| Classification | Hidden Layer | No. of Neurons | Modeling Case | MAE | MSE | PBIAS | G-Value | Optimal Model |
|---|---|---|---|---|---|---|---|---|
| 6 original data | Single layer | 6 | 1-1-1 | 5.352 | 49.685 | −0.82 | 29.1 | |
| 12 | 1-1-2 | 4.542 | 37.498 | 0.66 | 46.5 | O | ||
| Multiple layer | 12 (6:6) | 1-2-1 | 4.852 | 42.818 | −0.55 | 38.9 | ||
| 18 (6:12) | 1-2-2 | 4.886 | 41.645 | −0.87 | 40.6 | |||
| 18 (12:6) | 1-2-3 | 4.587 | 41.588 | 0.17 | 40.7 | |||
| 24 (12:12) | 1-2-4 | 4.238 | 42.770 | 0.11 | 39.0 | |||
| 6 PCA data | Single layer | 6 | 2-1-1 | 0.575 | 0.641 | −0.00 | 35.5 | |
| 12 | 2-1-2 | 0.553 | 0.553 | 0.02 | 44.3 | |||
| Multiple layer | 12 (6:6) | 2-2-1 | 0.569 | 0.635 | −0.11 | 36.0 | ||
| 18 (6:12) | 2-2-2 | 0.555 | 0.615 | 0.08 | 38.1 | |||
| 18 (12:6) | 2-2-3 | 0.545 | 0.549 | −0.07 | 44.7 | |||
| 24 (12:12) | 2-2-4 | 0.448 | 0.473 | 0.02 | 52.4 | O | ||
| 4 PCA data | Single layer | 6 | 3-1-1 | 0.676 | 0.730 | 0.00 | 26.5 | |
| 12 | 3-1-2 | 0.612 | 0.756 | 0.02 | 23.9 | |||
| Multiple layer | 12 (6:6) | 3-2-1 | 0.651 | 0.776 | 0.07 | 21.9 | ||
| 18 (6:12) | 3-2-2 | 0.595 | 0.568 | −0.00 | 42.9 | O | ||
| 18 (12:6) | 3-2-3 | 0.553 | 0.618 | −0.01 | 37.8 | |||
| 24 (12:12) | 3-2-4 | 0.580 | 0.596 | −0.05 | 40.0 |
© 2018 by the authors. Licensee MDPI, Basel, Switzerland. This article is an open access article distributed under the terms and conditions of the Creative Commons Attribution (CC BY) license (http://creativecommons.org/licenses/by/4.0/).
Share and Cite
MDPI and ACS Style
Jang, D.; Park, H.; Choi, G. Estimation of Leakage Ratio Using Principal Component Analysis and Artificial Neural Network in Water Distribution Systems. Sustainability 2018, 10, 750. https://doi.org/10.3390/su10030750
AMA Style
Jang D, Park H, Choi G. Estimation of Leakage Ratio Using Principal Component Analysis and Artificial Neural Network in Water Distribution Systems. Sustainability. 2018; 10(3):750. https://doi.org/10.3390/su10030750
Chicago/Turabian StyleJang, Dongwoo, Hyoseon Park, and Gyewoon Choi. 2018. "Estimation of Leakage Ratio Using Principal Component Analysis and Artificial Neural Network in Water Distribution Systems" Sustainability 10, no. 3: 750. https://doi.org/10.3390/su10030750
Note that from the first issue of 2016, this journal uses article numbers instead of page numbers. See further details here.