Article

Effects of Diatomite–Limestone Powder Ratio on Mechanical and Anti-Deformation Properties of Sustainable Sand Asphalt Composite

1
Transportation, Jilin University, Changchun 130025, China
2
Jilin Communications Polytechnic, Changchun 130012, China
3
Jiangxi Research Institute of Transportation, Nanchang 330200, China
*
Author to whom correspondence should be addressed.
Sustainability 2018, 10(3), 808; https://doi.org/10.3390/su10030808
Submission received: 16 February 2018 / Revised: 9 March 2018 / Accepted: 12 March 2018 / Published: 14 March 2018

Abstract

:
Diatomite has gained more and more interest as a new resource, since it has potential as a favorable alternative to mineral filler in the construction of asphalt pavement compared with ordinary limestone powder. In this paper, the mechanical and anti-deformation properties of sand asphalt composites with various proportions of diatomite were investigated by a uniaxial compression failure test, a uniaxial compression repeated creep test, and a low-temperature splitting test in order to determine the optimal replacement content of ordinary limestone powder. Five groups of sand asphalts with various volume ratios of diatomite to limestone (0:1, 0.25:0.75, 0.5:0.5, 0.75:0.25, and 1:0) were determined by the simplex-lattice mixture design (SLD) method. The results reveal that the compression strength, anti-deformation properties, and low-temperature crack resistance of sand asphalts are improved through the use of diatomite. Furthermore, the optimal ratio (0.327:0.673) of limestone to diatomite is determined by the SLD method, according to secant modulus and creep strain results.

1. Introduction

In recent years, the exhaustion of non-renewable energy and environment pollution has caused many problems for people; people urgently need to find new resources to replace traditional resources. Mineral filler is an important component of asphalt pavement; however, the massive use of mineral fillers gradually reduces the rock resources, and the production of mineral fillers has adverse effects on the environment.
Diatomite has received great attention with the aim of reducing the consumption of natural resources and decreasing the environmental pollution caused by asphalt pavement. Diatomite is a sedimentary rock that is white or light yellow in color, and is composed of fossilized skeletons of diatoms. These are single-celled algae-like plants, which accumulate in marine or lacustrine environments. Diatomite is a widely used mineral material due to its low cost and abundant storage; there are over 300 million tons of reserves in China [1]. Diatomite has been utilized to improve the properties of asphalt and mixture as an inorganic modifier for several years [2,3,4,5,6,7,8,9,10], because it possesses high absorptive capacity and stability. Kietzman et al. [2] firstly studied the performance of diatomite-modified asphalt concrete, and discovered that the high temperature deformation resistance of asphalt mixture was improved. Tan et al. [3,4] indicated that a diatomite-modified mixture had improved the low-temperature performance compared with a control mixture, whereas the critical bending and compressive strain energy densities of the modified mixture exceeded the control mixture density. Guo et al. [5] studied the properties of a diatomite-glass fiber modified mixture, and indicated that diatomite had a significant effect on the stiffness modulus of the asphalt mixture; the compound modified mixture also had an improved traveling performance compared with the control mixture. Cong et al. [6,7] investigated the properties of diatomite-modified asphalt, and observed that the high temperature and rheological properties were improved by the addition of diatomite, while the low-temperature property was not significantly affected. The aging resistance of diatomite-modified asphalt was significantly improved as the diatomite content increased. Cheng et al. [8,9] also indicated that the addition of diatomite improved the impact resistance of the mineral powder asphalt mastic, while also weakening its temperature susceptibility. Furthermore, Cheng et al. [10] suggested that the specific surface area was the most influential factor of mineral fillers on the properties of asphalt mastic in comparison with density, particle size distribution, and hydrophilic coefficient, and diatomite asphalt mastic performed better than limestone asphalt mastic, hydrated lime asphalt mastic, and fly-ash asphalt mastic. It could be concluded from the aforementioned studies that diatomite was potentially a beneficial filler in the construction of asphalt pavements.
The aforementioned research studies mainly investigated the effects of diatomite on performances of asphalts or mixtures. In contrast, an asphalt mixture could be considered a multi-level spatial lattice structure, according to mortar theory [11,12]. In this case, coarse aggregate was dispersed in a sand asphalt matrix in order to form an asphalt concrete system. Fine aggregate was dispersed in an asphalt mastic matrix to form an asphalt mortar system, whereas mineral filler was dispersed in an asphalt matrix to form an asphalt mastic system. As the asphalt concrete matrix was dispersed, sand asphalt properties significantly affected the asphalt concrete performance. In many studies, the asphalt mixture was simplified into three phases, including sand asphalt, a coarse aggregate skeleton, and air voids [13,14]. Bai et al. [15] investigated the long-term and short-term creep performances of sand asphalt and modified the cross model, which presented an improved prediction accuracy. The characteristics of sand asphalt were simpler compared with asphalt concrete, since the skeleton structure absence was developed during compaction in asphalt concrete. It would be easy to describe the rheological property of sand asphalt, because the friction among stones and the stability of a stiff skeleton could be ignored. Besides, the rheological properties of sand asphalt significantly affect the rutting resistance of asphalt concrete [15]. Therefore, the study was a meaningful attempt to investigate the effect of diatomite on the mechanical properties of sand asphalt, and determine the optimal diatomite content as an alternative mineral additive based on these mechanical properties. This can also provide a reference for the application of a diatomite-modified asphalt mixture.
Currently, high numbers of mixture designs and statistical methods have been developed for relationship design and examination among mixture properties, and corresponding influential factors [16]. A standard mixture design method such as a simplex-lattice mixture design (SLD) has been widely used in mixture designs, and the effects of influential factors on the desired responses are evaluated [16,17,18,19]. SLD is a space-filling design that creates a triangular grid of runs, and the sum of all proportions must be equal to one [17]. This is a method that combines mathematical theory, statistical analysis, and experimental design, which is commonly utilized to optimize the proportion of various components in a mixture [16,17,18,19]. Therefore, SLD was used to obtain the optimal content of diatomite in this study.
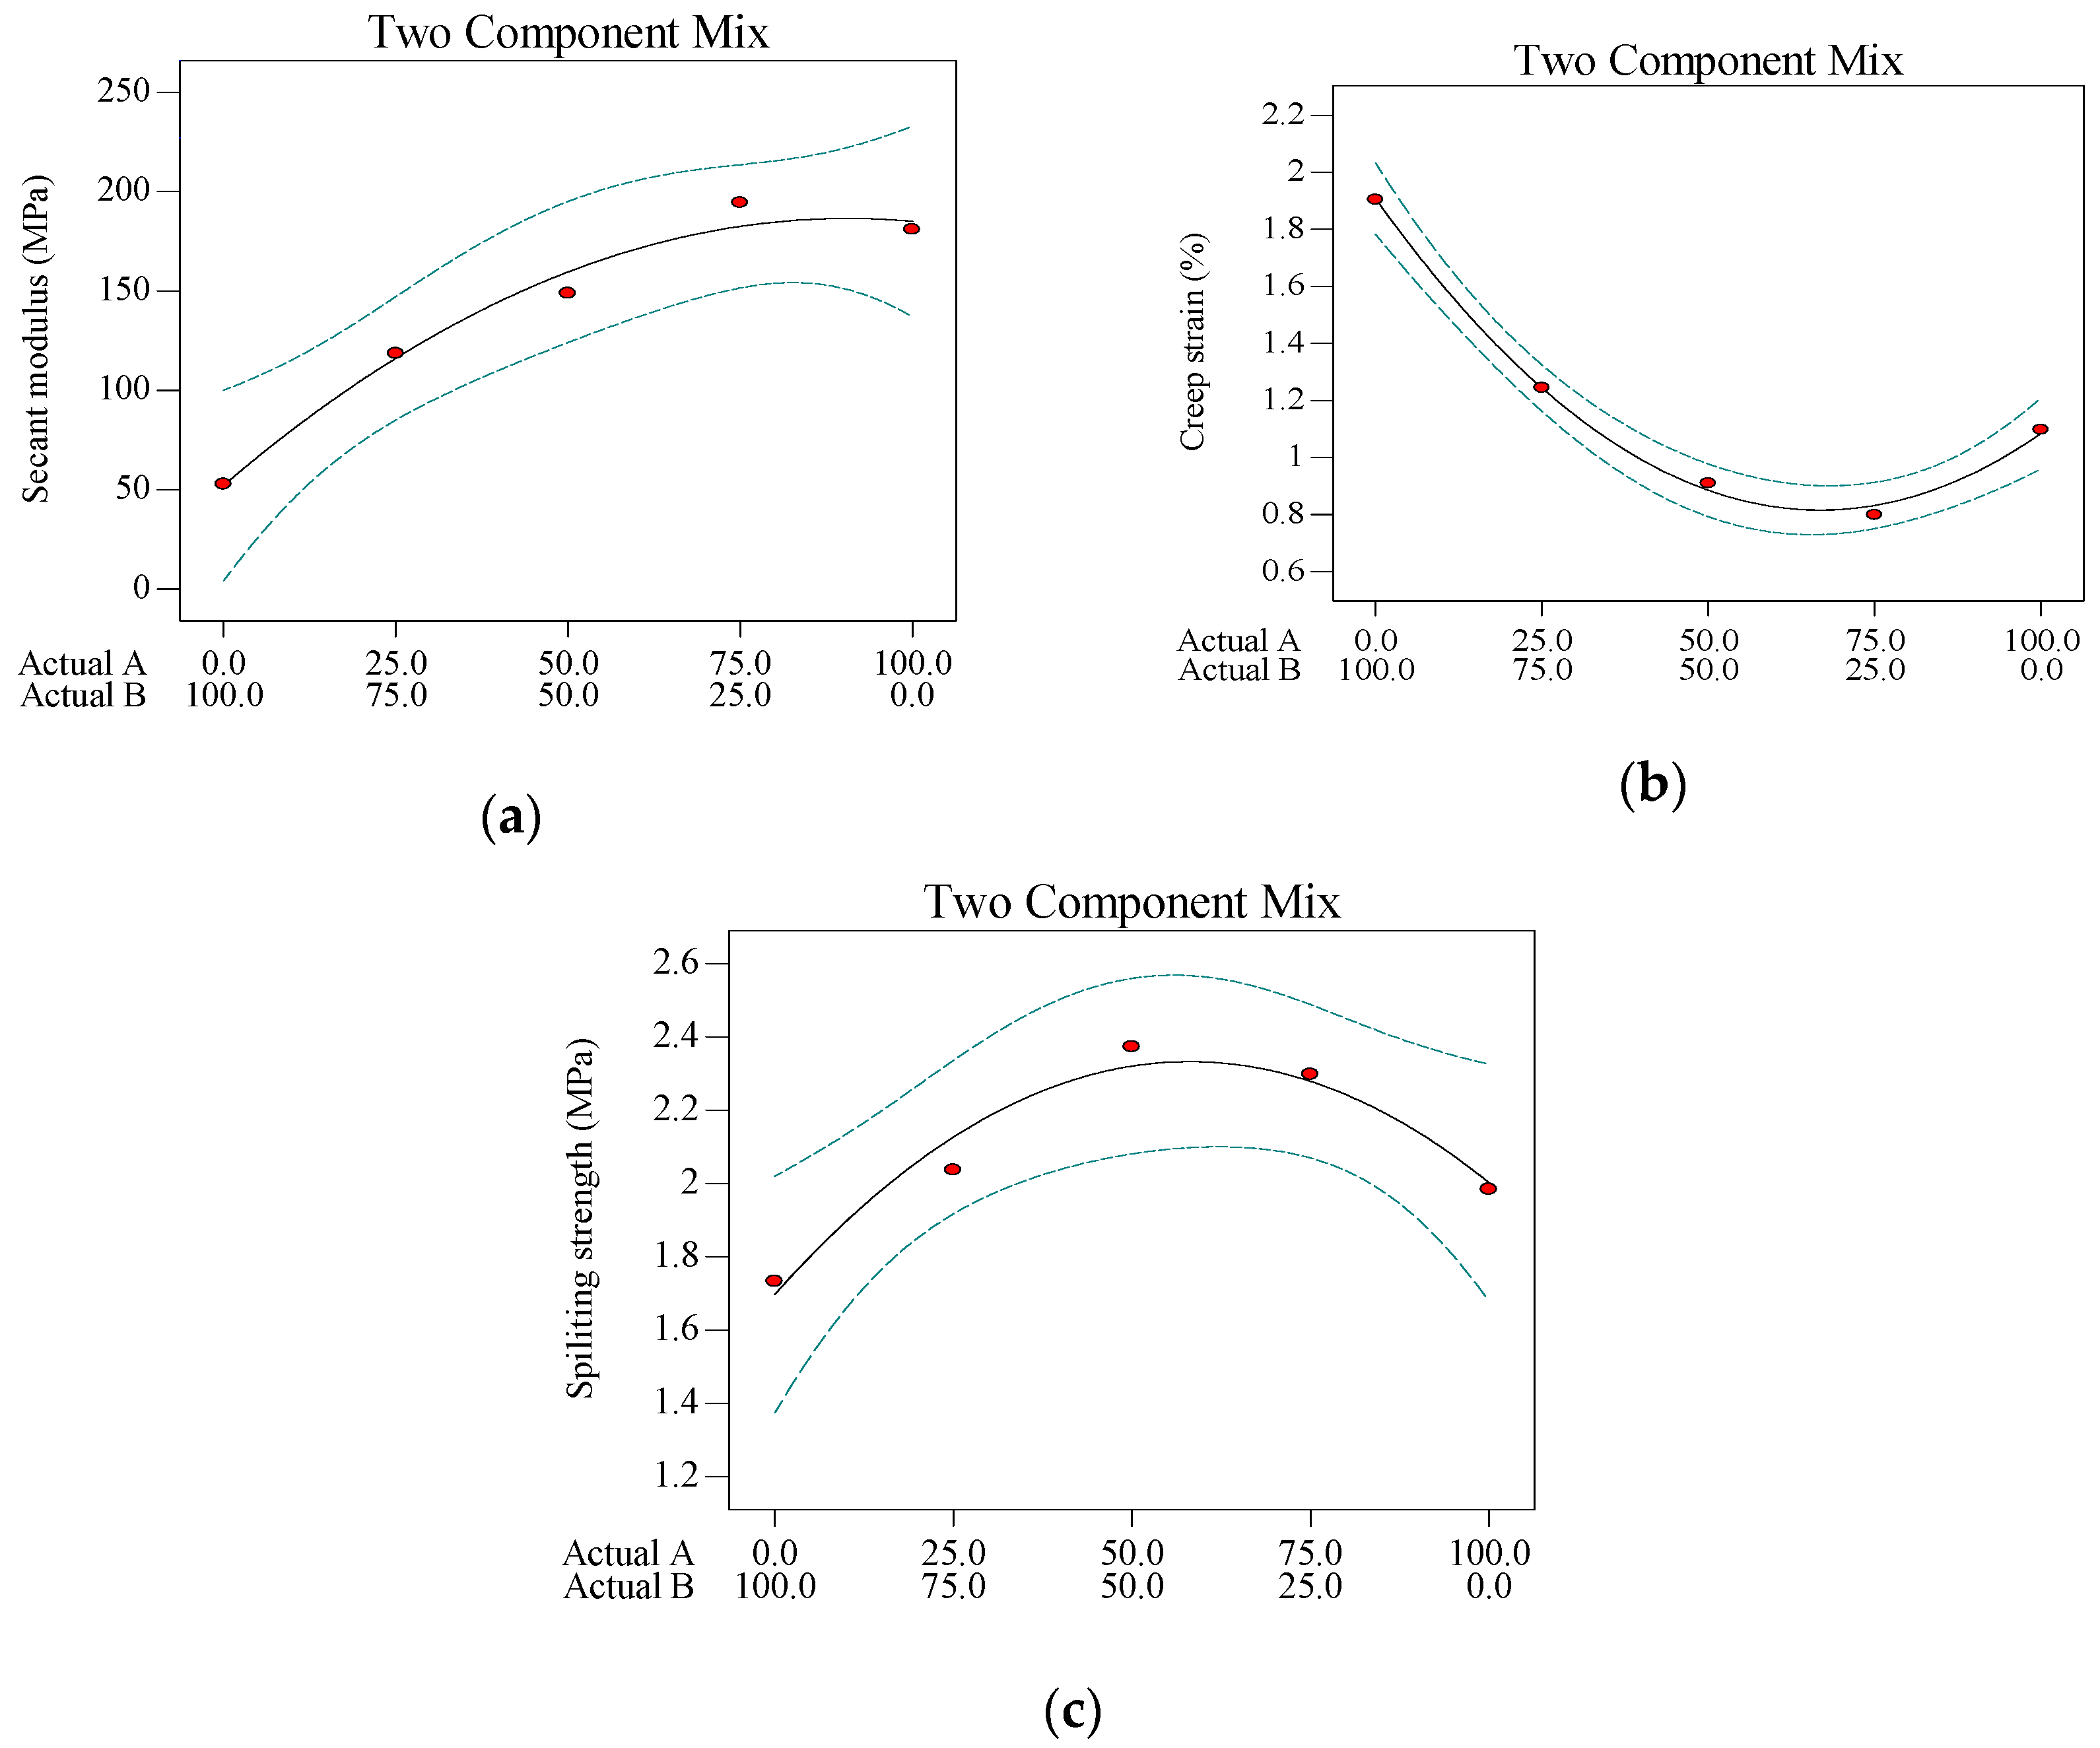
The aim of this study was to investigate the effects of diatomite on the mechanical and anti-deformation properties of sand asphalt, as well as the optimal diatomite content determination as an alternative mineral additive based on these properties. The SLD method was employed in the proportion design of ordinary limestone powder and diatomite as filler in sand asphalt. Consequently, the mechanical and rheological properties of sand asphalts were tested by a uniaxial compression failure test, a uniaxial compression static creep test, and a low-temperature splitting test. The optimal diatomite content was finally determined by an optimization analysis based on the SLD method, in which secant modulus, creep strain, and splitting strength were selected as response parameters.

2. Experimental

2.1. Raw Materials

The asphalt that was used in this paper was produced by Panjin Petrochemical Industry, Liaoning Province of China. The basic properties of the used asphalt are given in Table 1. Diatomite was the calcined product from Jilin Province. The utilized mineral powder was limestone powder, which was an ordinary filler used in the construction of asphalt pavement. The basic properties of diatomite and limestone are presented in 
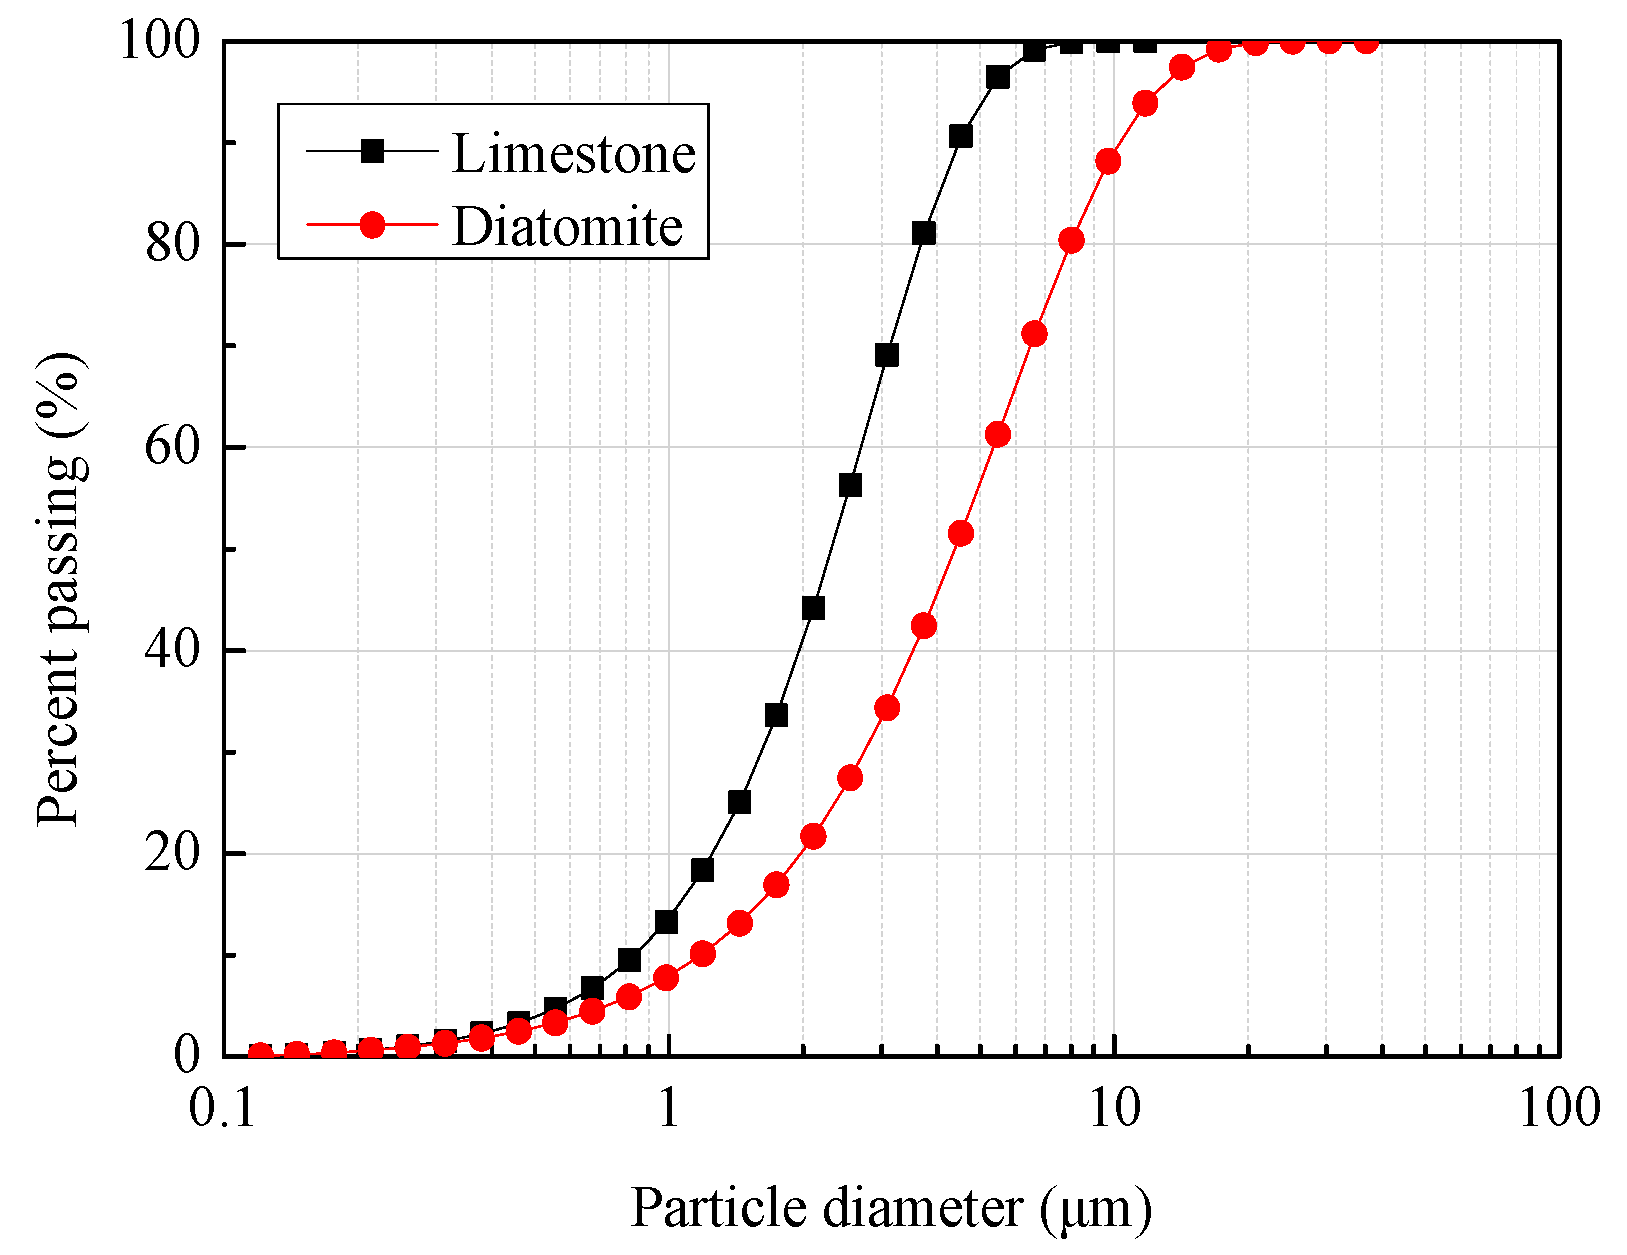
Table 2. The particle size distributions of diatomite and limestone were measured, and are presented in Figure 1 [10]. In accordance with mortar theory, an asphalt mixture is a multi-stage spatial network gel structure of the dispersed system. The sand asphalt is a dispersion of fine aggregate dispersed in asphalt mastic. It is generally considered that aggregates smaller than 2.36 mm in the asphalt mixture are fine aggregates. A fine aggregate (below 2.36 mm in diameter) that was selected to prepare sand asphalt was crushed from basalt, which was obtained from a local stone factory in Jilin Province. The corresponding apparent densities of fine aggregates at various diameters are listed in Table 3.

2.2. Experimental Design

The sand asphalt that was used in this paper consisted of asphalt, filler, and fine aggregates, which was the matrix of the asphalt mixtures in the coarse aggregate-sand asphalt dispersal system [11,
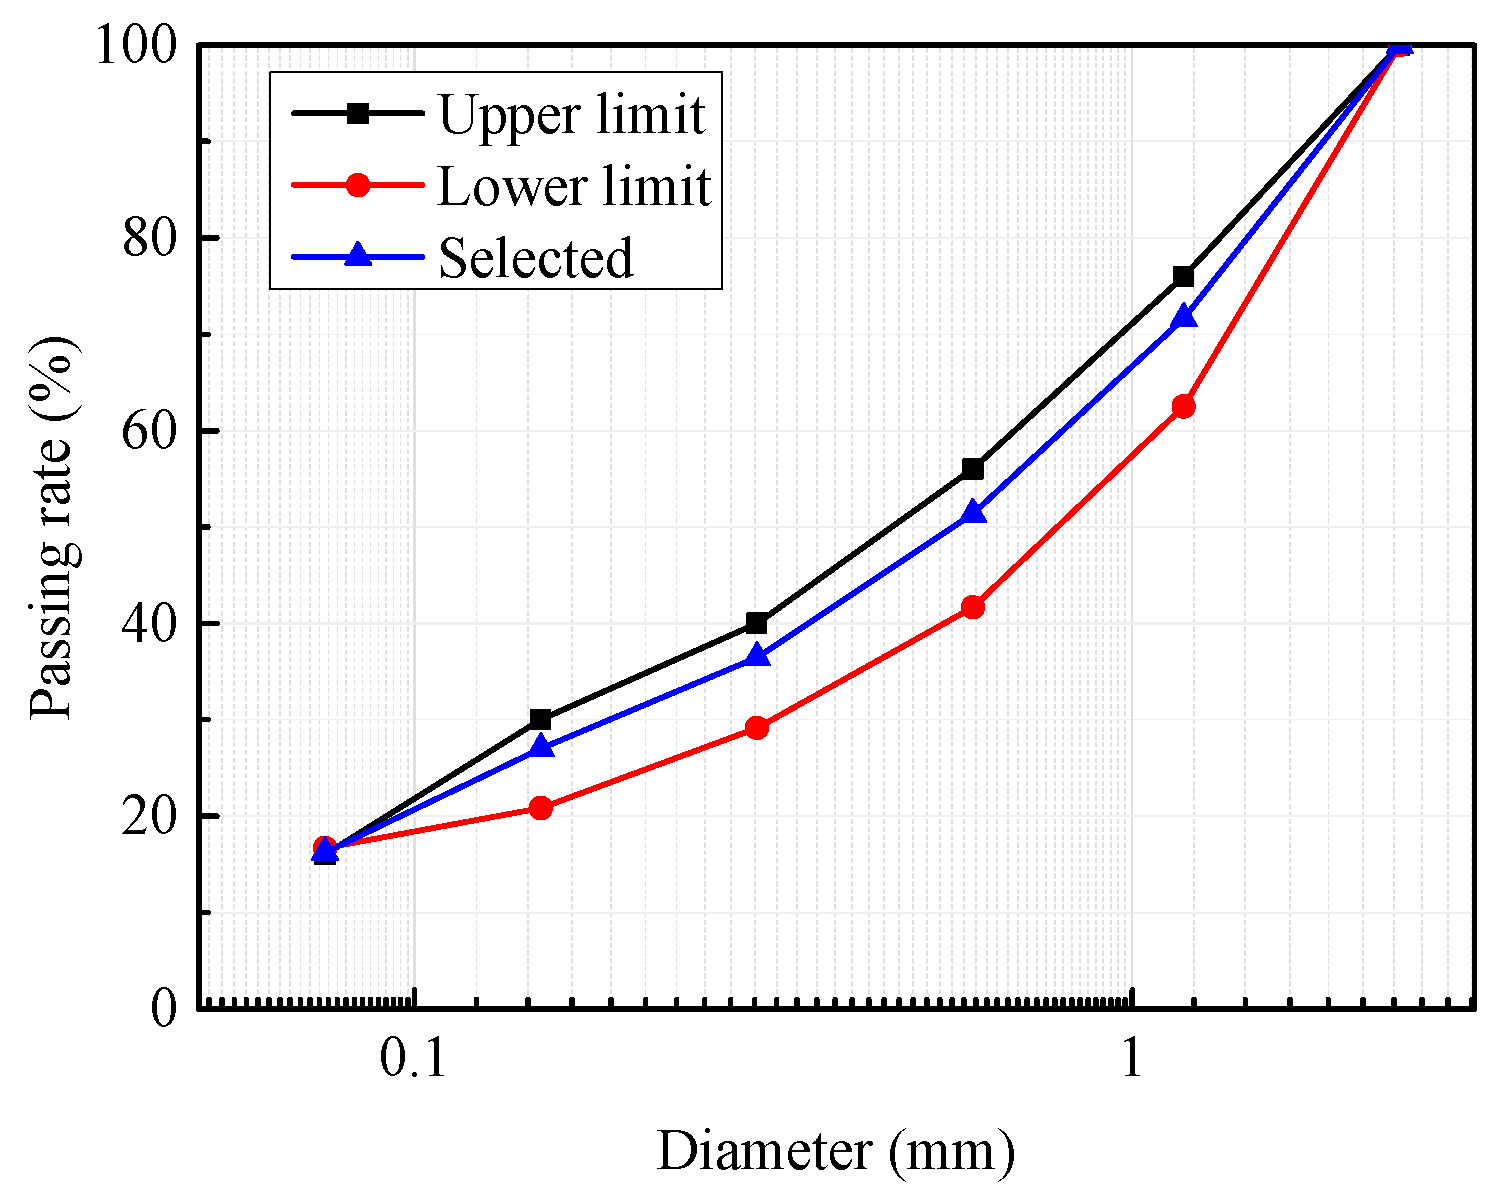
12]. The gradation of the sand asphalt was similar to the typical dense gradation of asphalt concrete AC-13, according to the Chinese specification (JTG F40-2004) [20], except that the coarse aggregates beyond 2.36 mm in diameter were removed. The selected gradation is presented in Figure 2.
This paper focused on the effects that diatomite has as an alternative filler on the mechanical and anti-deformation properties of sand asphalt. Moreover, the optimal alternative concentration of diatomite was determined. The viscosity and complex modulus of the asphalt mastic increased non-linearly as the filler volume concentration increased [21,22]. Therefore, filler volume concentration was ensured to be constant in sand asphalt preparation in order to remove its effects on the mechanical and anti-deformation properties of sand asphalt. Furthermore, it was considered that the differences between the mechanical and anti-deformation properties in diatomite sand asphalt and limestone sand asphalt were caused by the differences in the properties of diatomite and limestone. The SLD method was adopted to design the proportion of limestone and diatomite using Design-Expert software. The design results and corresponding mass fractions of limestone and diatomite in sand asphalt are listed in Table 4. The ratio of filler to aggregate was 16.2% by weight, according to sand asphalt gradation. The mass fraction was the mass ratio of limestone or diatomite to the total mass of aggregates. Five groups of sand asphalts were named AM-0, AM-25, AM-50, AM-75, and AM-100, which corresponded to the volume ratio of the diatomite-entire filler ratio of 0%, 25%, 50%, 75%, and 100% by volume, respectively.
The optimal asphalt content was determined according to Chinese Standards Specification (JTG F40-2004) [20]. Asphalt binders were assumed to be uniformly dispersed in sand asphalt. Also, the asphalt content changed linearly with the specific surface area of aggregates. Subsequently, the optimal asphalt content, Pa, could be calculated as follows:
P a = ρ a × S A × D A × 0.1 ,
S A = ( P i × F A i ) ,
where Pa is the optimal asphalt content, %; ρ a is the asphalt density, kg/m3; SA is the specific surface area of the aggregates, m2/kg; DA is the asphalt binder thickness, m; Pi is the passing rate of the aggregates at various diameters, %; and F A i is the surface area coefficient of the aggregates at various diameters, which was suggested from Table 5, according to Chinese Standards Specification (JTG F40-2004) [20].
Therefore, the SA of sand asphalt was calculated to be 14.34 m2/kg, based on the data in Figure 2 and Table 5. Researchers suggested that an average film thickness between 8–15 μm would provide an acceptable pavement performance [23]. Besides, Kandhal and Chakraborty (1996) [24] recommended the use of an average film thickness ranging from 9 μm to 10 μm for specimens compacted at 8% in air voids, with consideration of the tensile strength and resilient modulus for hot mix asphalt (HMA). Therefore, an average film thickness of 10 μm was selected to calculate the optimal asphalt content. Then, Pa could be calculated by Equations (1) and (2), and the result was 15%.

2.3. Preparation of Sand Asphalt

Sand asphalts with various contents of diatomite were prepared through the static pressure method (JTG F40-2004 2004). Two sizes of sand asphalts, φ50 × 50 mm and φ101 × 63.5 mm, were prepared. The sand asphalt preparation processes are listed as follows:
Firstly, asphalt was heated in the oven at 170 °C. Also, fillers (diatomite and limestone) and fine aggregates were heated in the oven at 180 °C until the material temperature became stable.
Secondly, fine aggregate, filler, and asphalt were poured into the mixing pot in steps. The mixing temperature was set to be 170 °C; fine aggregates were mixed in the mixing pot for 90 s; then, asphalt was poured into the mixing pot and mixed for 90 s; and finally, filler was poured into the mixing pot and mixed for 180 s.
Thirdly, the right weight of mixes was calculated, and the mixes were placed in the mold.
Finally, mixes were compacted with a jack at a pressure of 3 kilopascals for 3 min. A sample of the sand asphalt could be released when the mold was cooled down to room temperature.

2.4. Testing Methods

2.4.1. Uniaxial Compression Failure Test

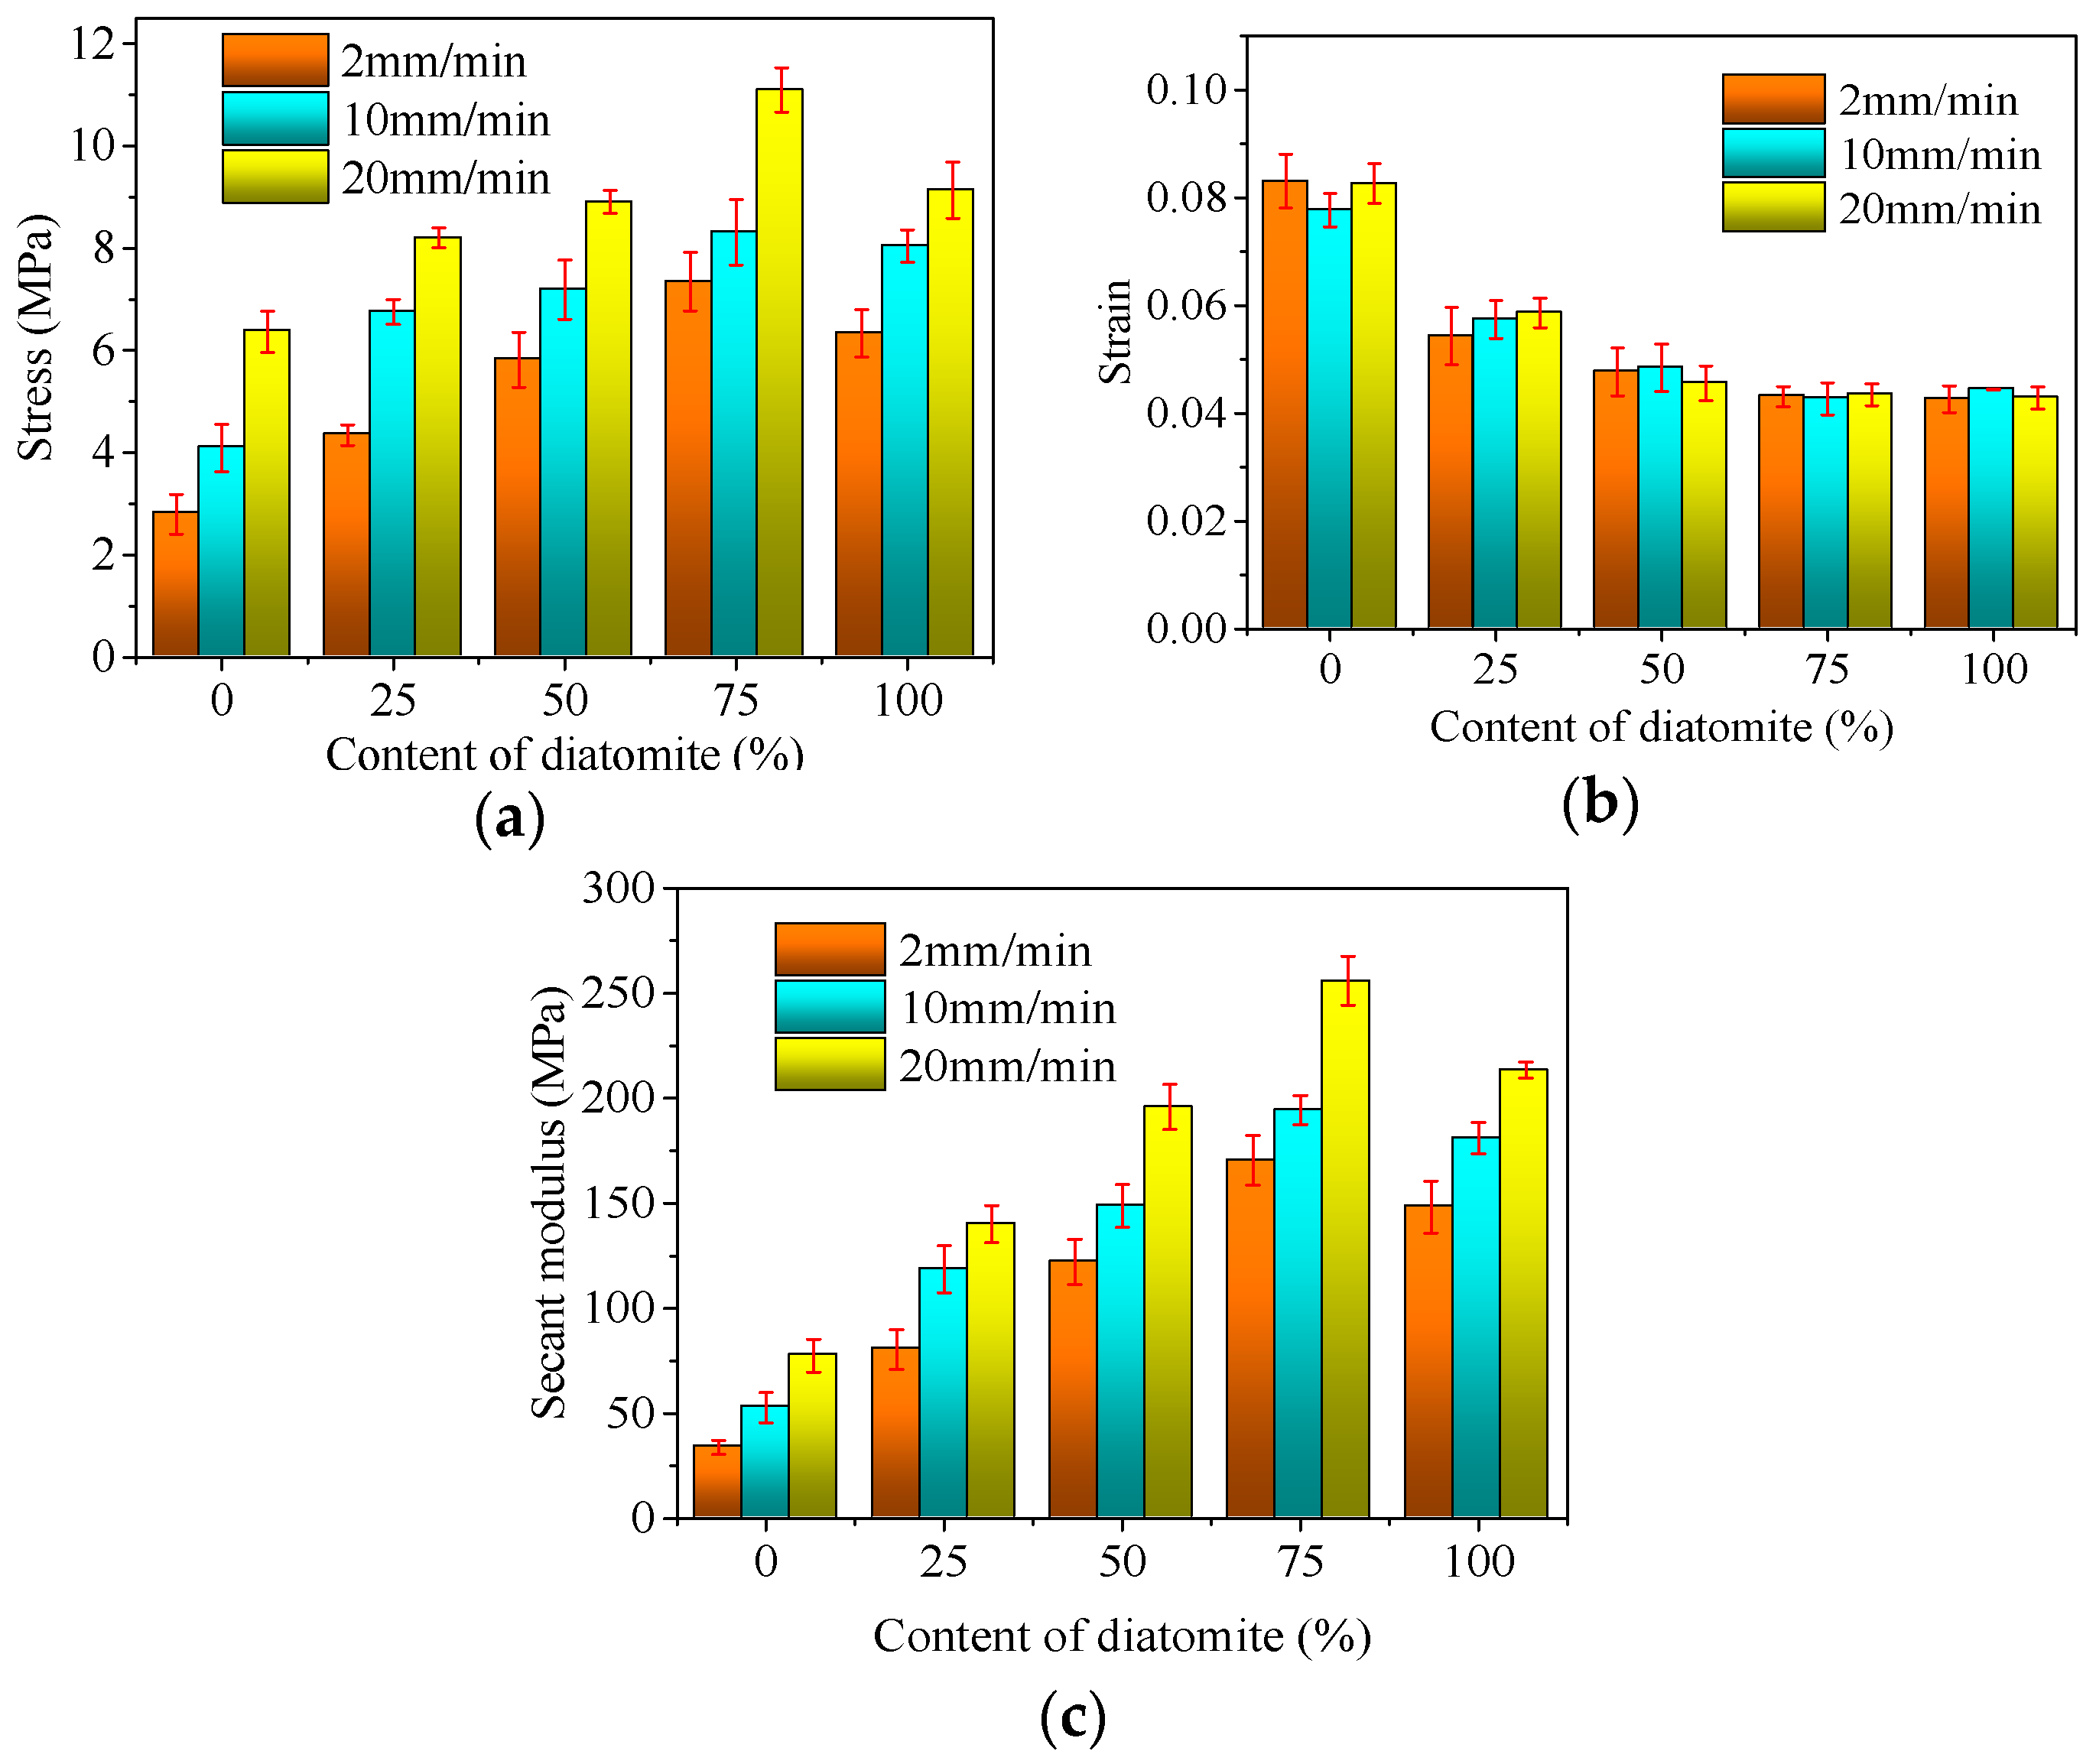
The uniaxial compression failure test is widely used to evaluate the stress-strain relationship and compression strength of asphalt concrete under a constant loading rate [
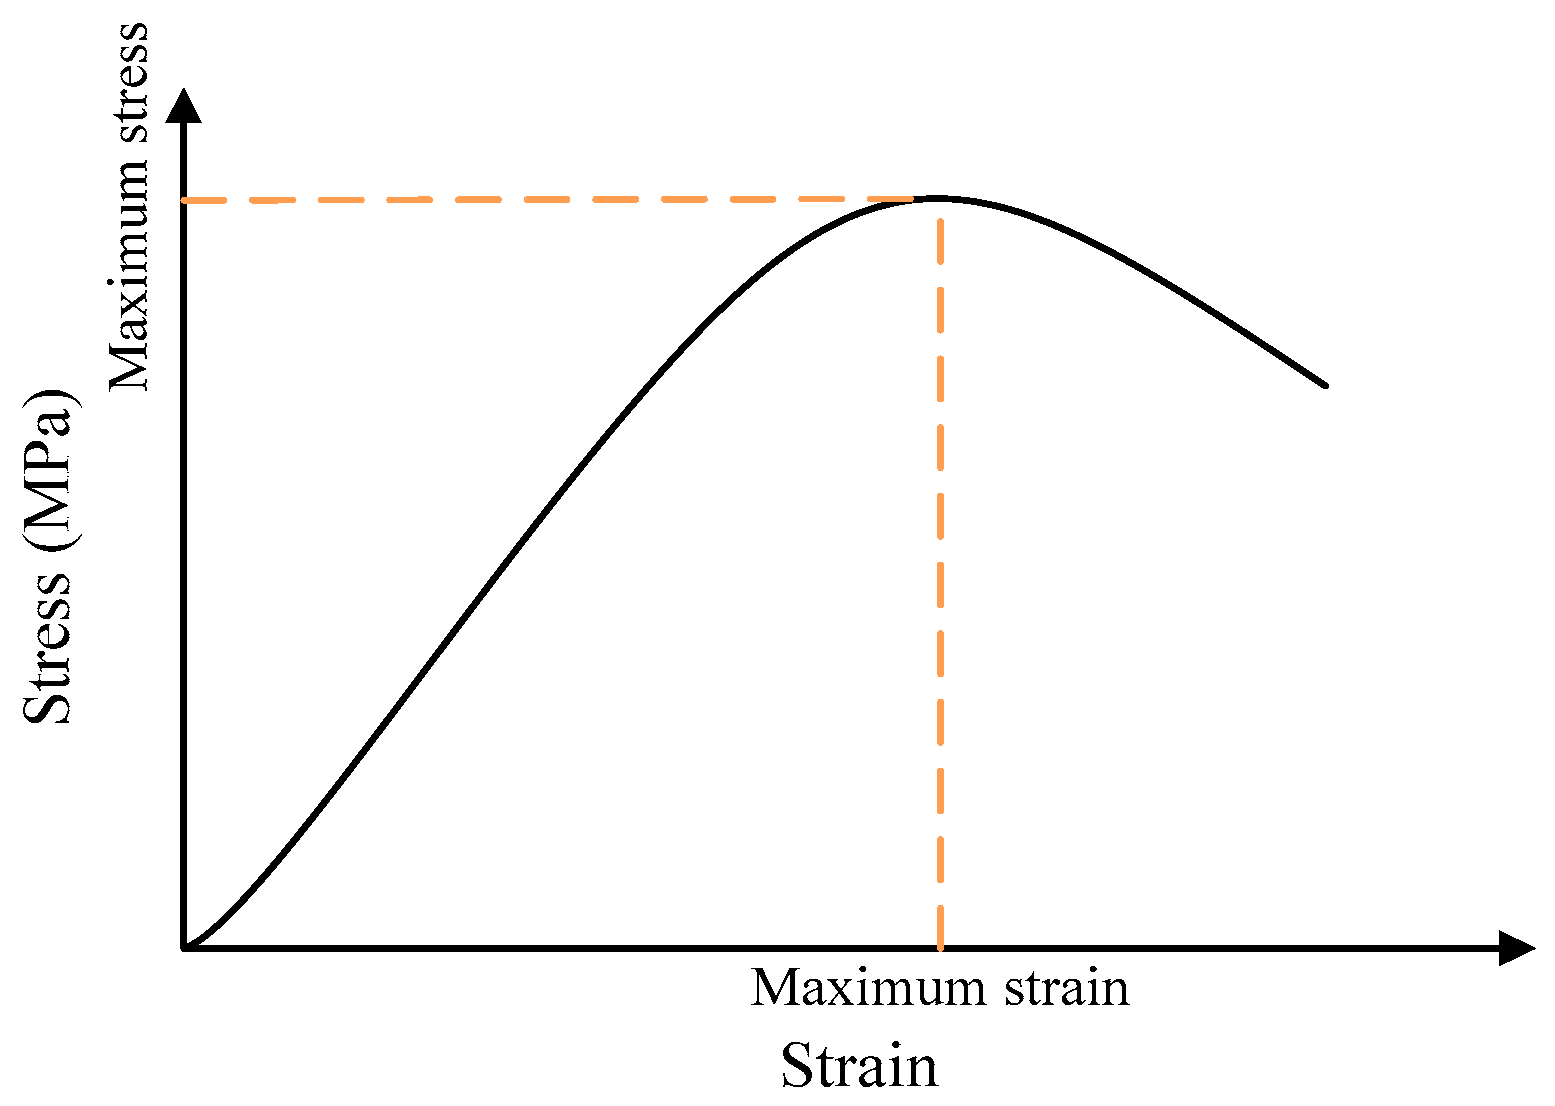
5], which is conducted through servo-hydraulic test systems. The sample was placed at the center of a base steel plate and compressed by a pressure plate. Testing temperature was room temperature (21 °C ± 1 °C), and loading rates were 2 mm/min, 10 mm/min, and 20 mm/min. Each sand asphalt group was tested with four specimens. There were three replicates for each group of samples, and the mean value was calculated to represent the mechanical property of sand asphalt. A stress–strain curve could be obtained by this test, and the typical curve is shown in Figure 3. The maximum stress (namely, compression failure stress), maximum strain (namely, the strain corresponding to the maximum stress), and the secant modulus (namely, the ratio of the compression strength to the corresponding strain) were selected for further comparative analysis.

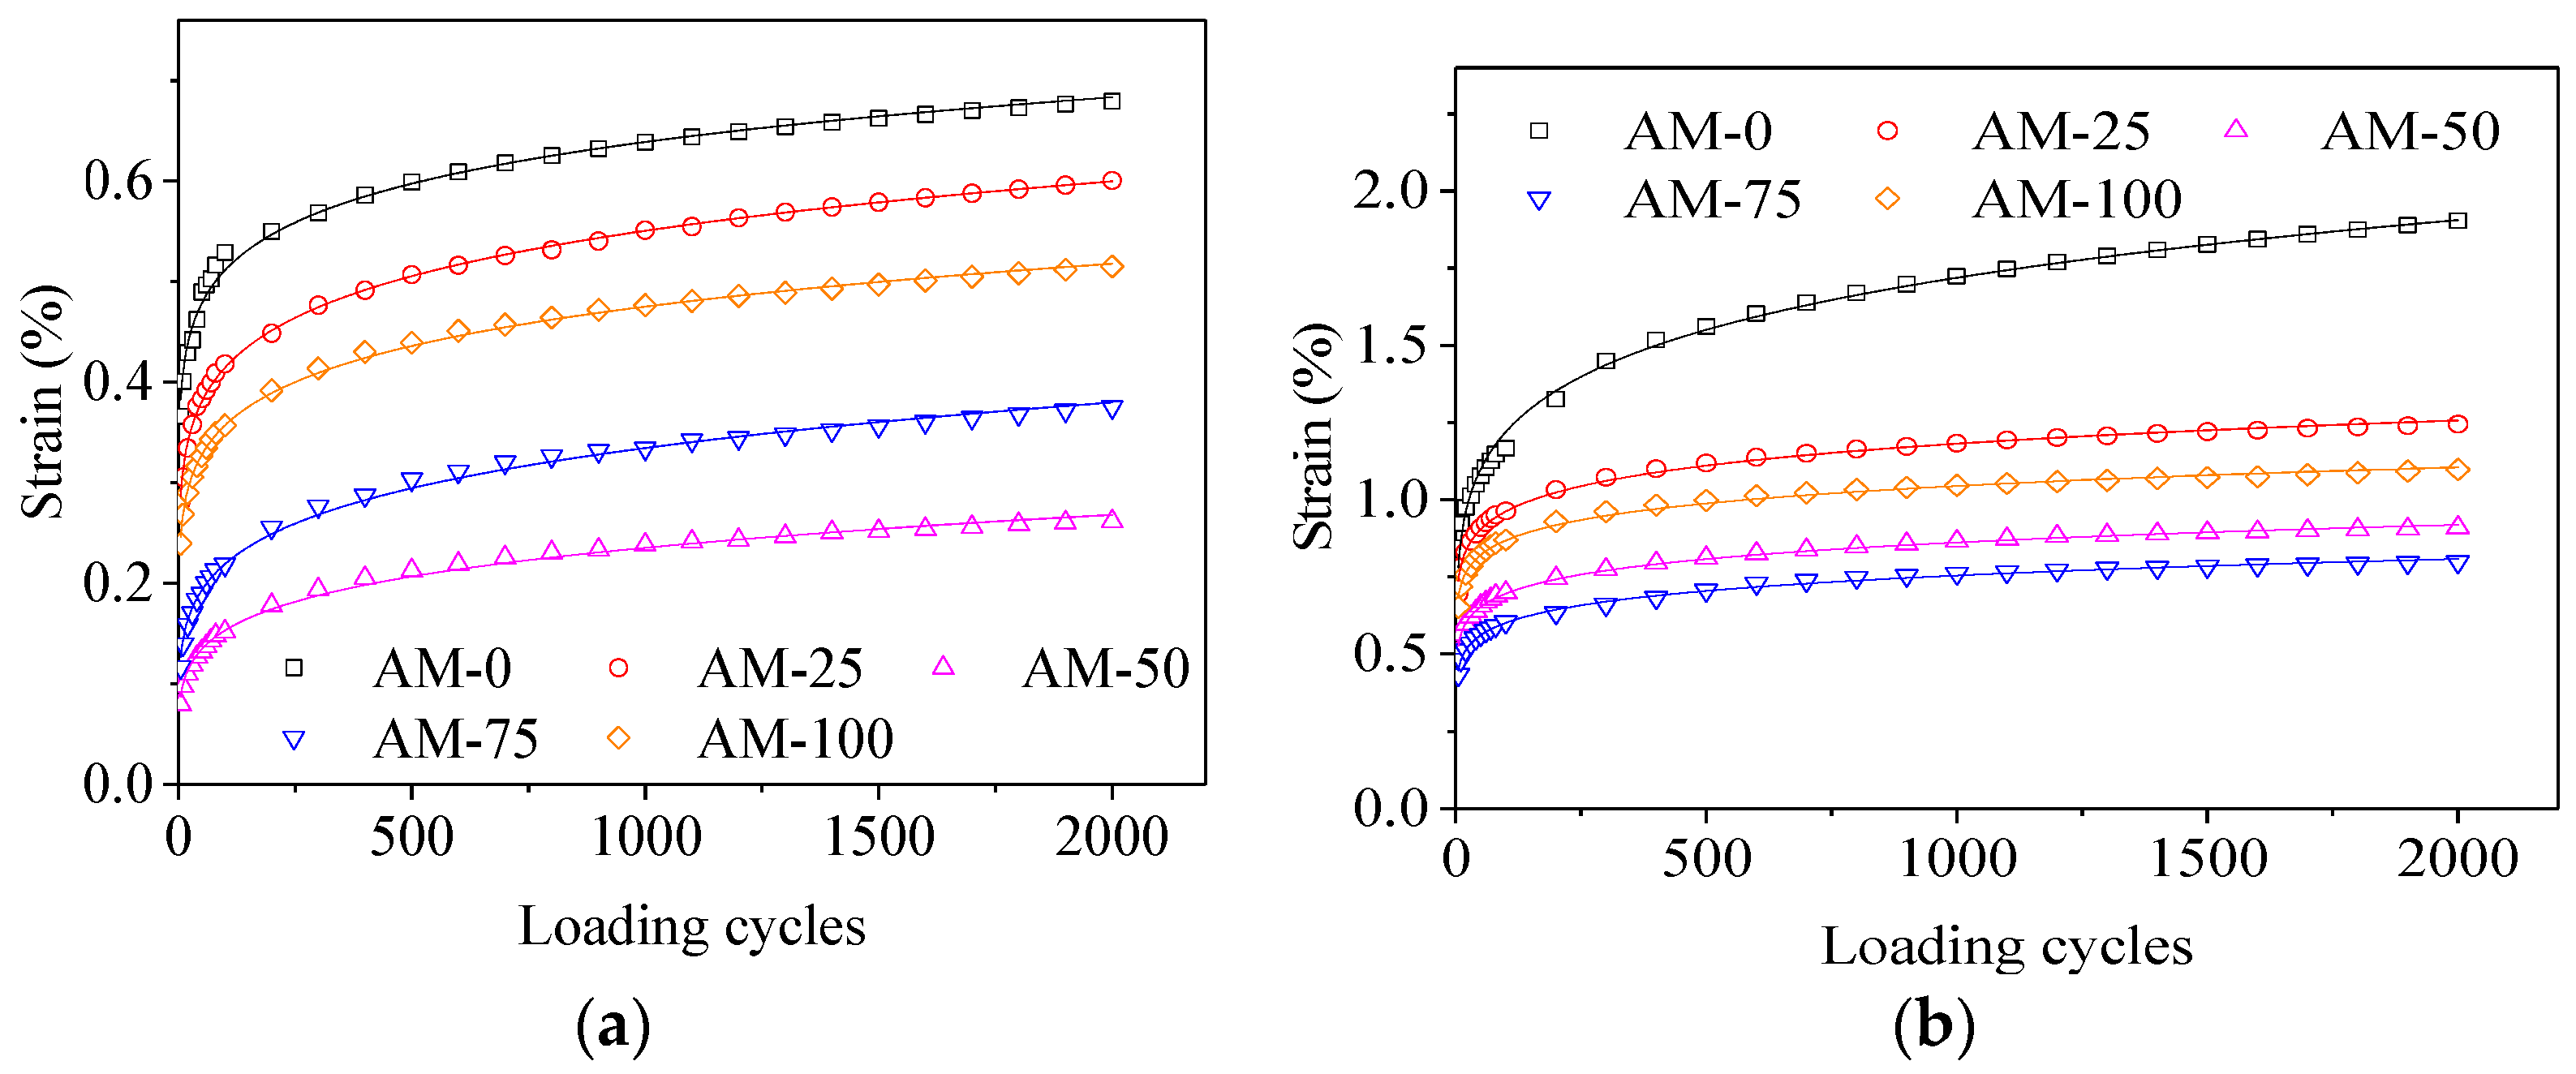
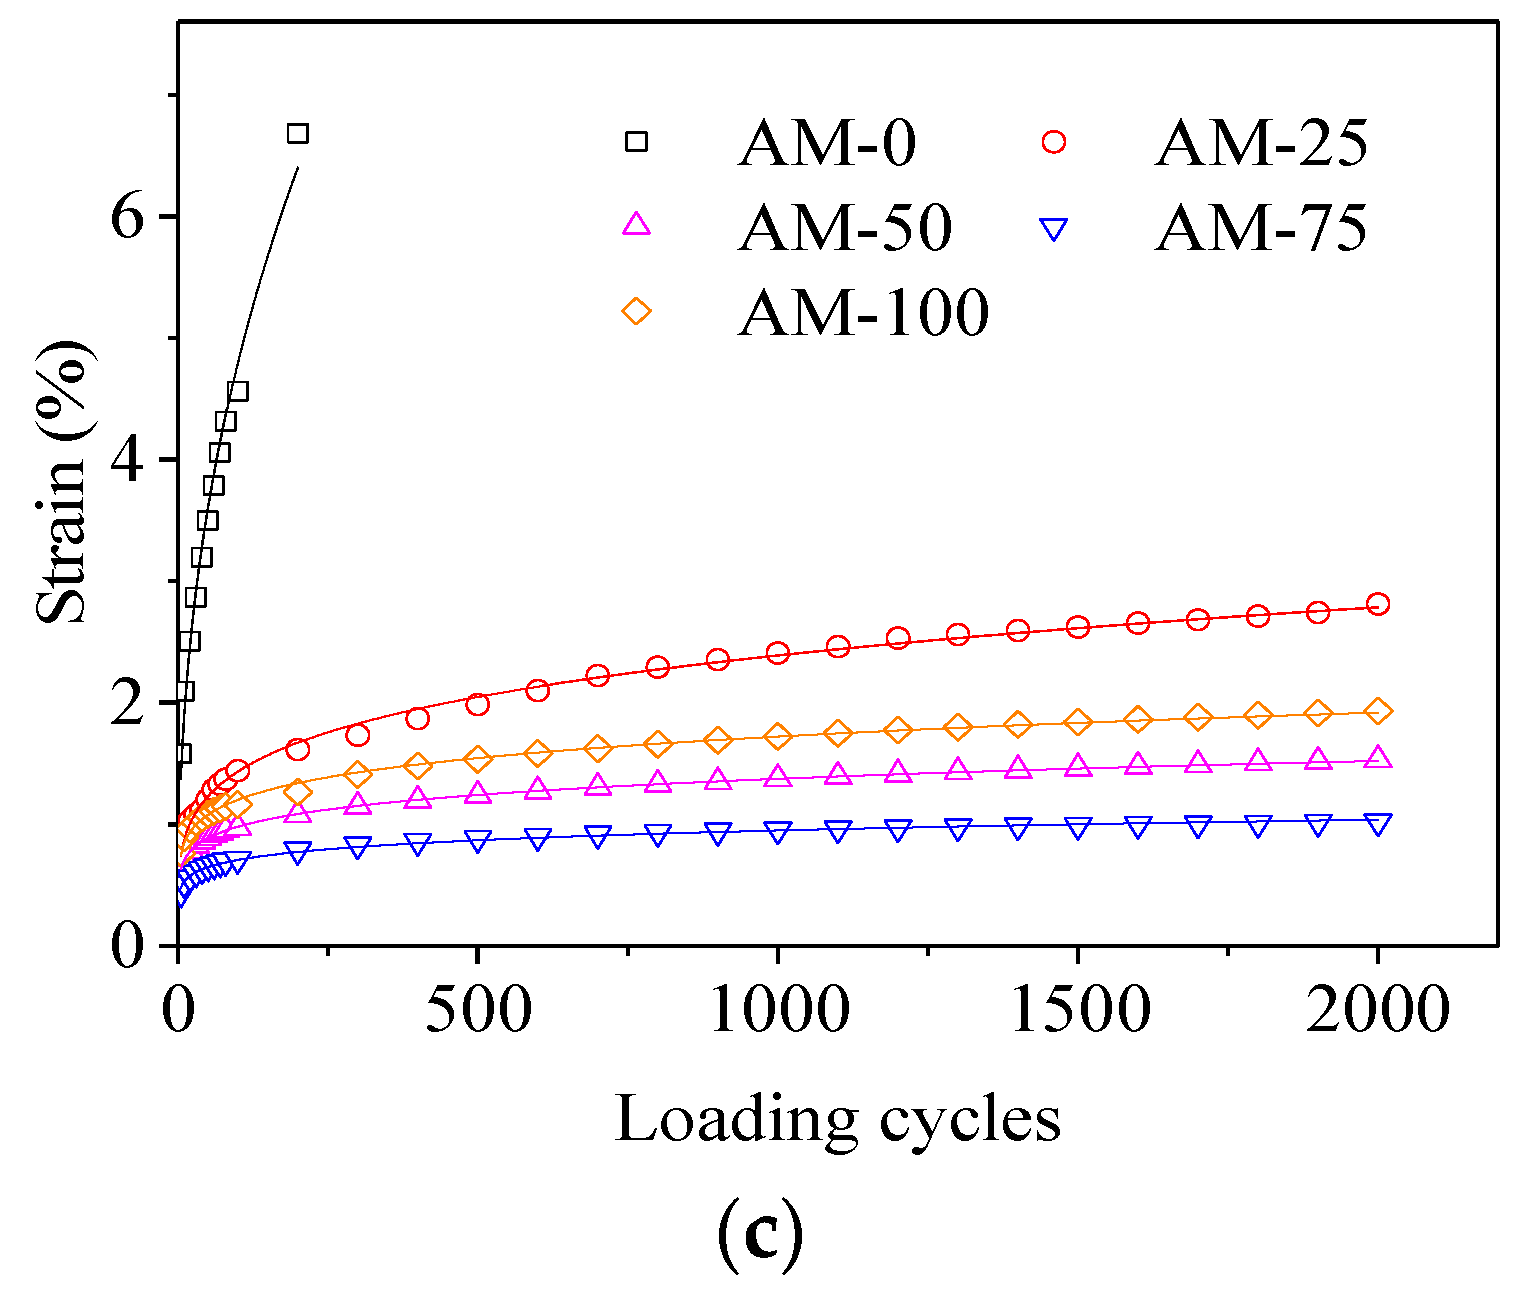
2.4.2. Uniaxial Compression Repeated Creep-Recovery Test

The creep test is an important test method to investigate the deformation property of asphalt concrete [15,
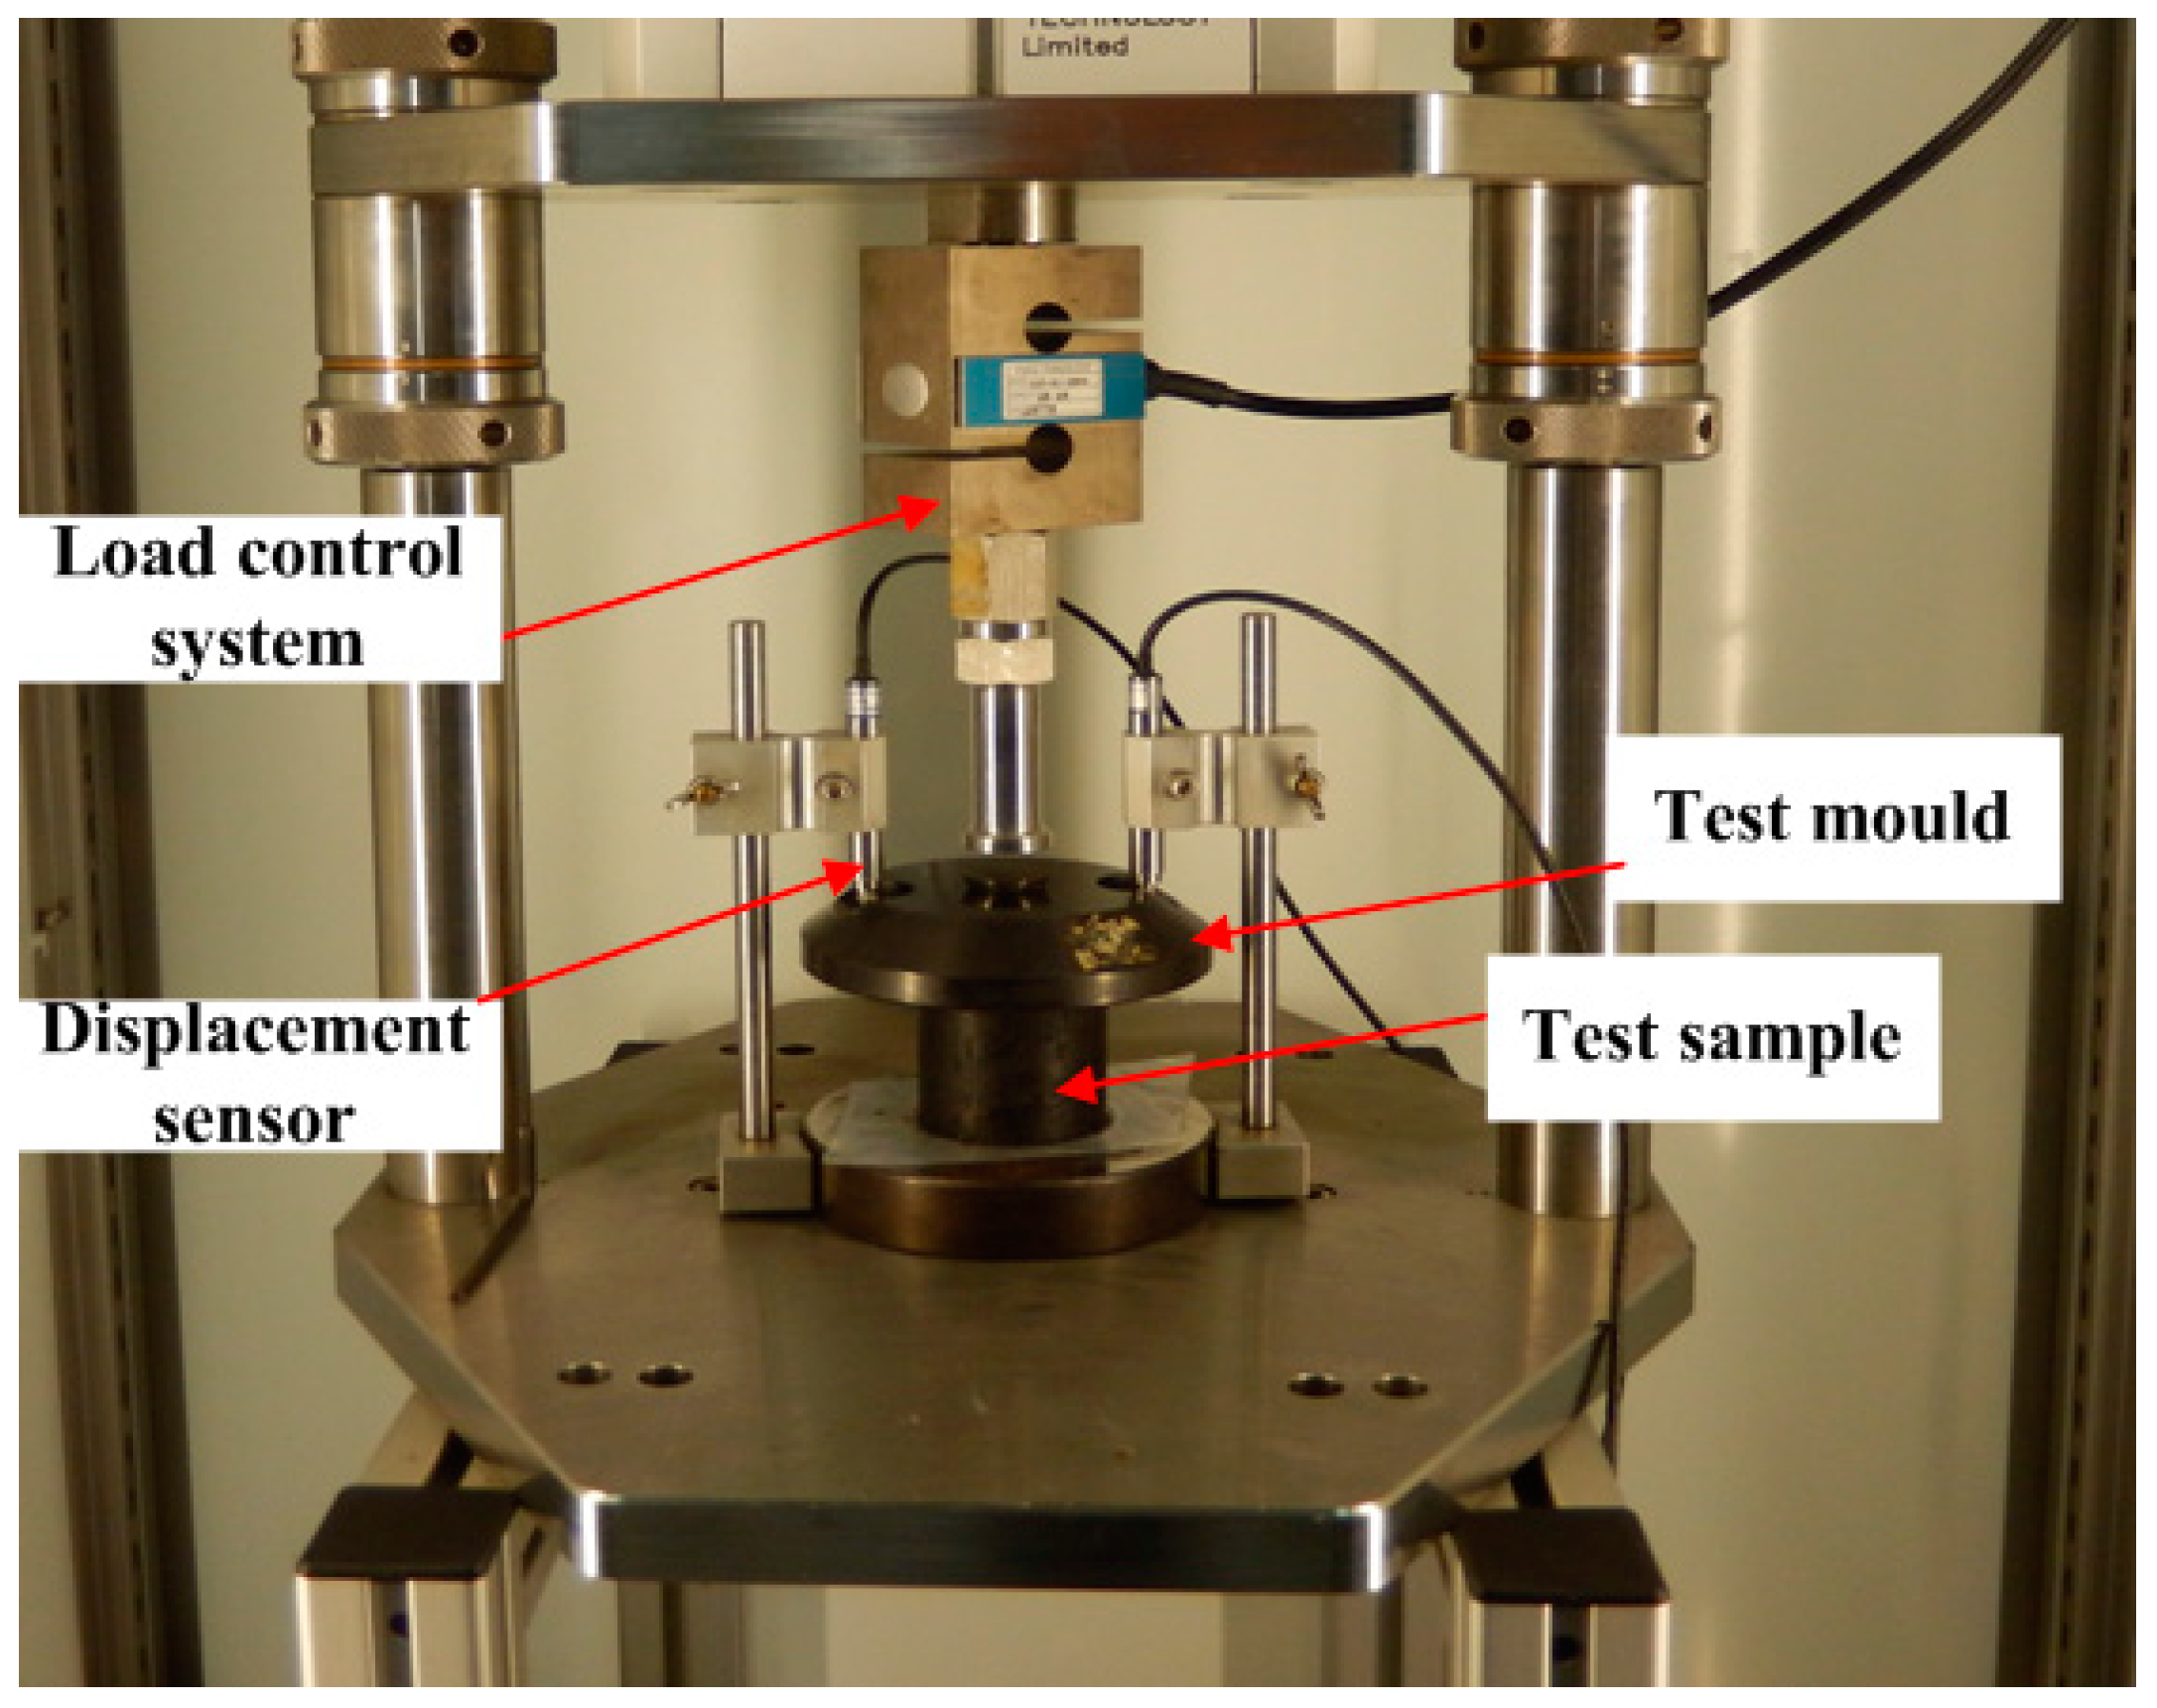
25]. It can be used to reflect the viscoelastic property of asphalt materials. A uniaxial compression repeated creep-recovery test was conducted under cyclic loading-recovery with a servo-pneumatic universal testing machine (NU-14, Cooper Technologies Ltd., UK), and the test temperature was 30 °C. Loading was applied with a servo-pneumatic system, and deformation was recorded by two LVDTs (linear variable differential transformers), as shown in Figure 4. Three stress levels, namely 0.12 MPa, 0.36 MPa, and 0.72 MPa, were conducted in this experiment. At the same stress level, each sand asphalt group was tested with four specimens; the result is the average of four data. Both the loading and recovery times were 1 s. The number of loading cycles was set to be 2000 for all of the samples, which meant that the cumulative creep duration and the recovery duration were 2000 s. A strain-cyclical numbers curve could be obtained after each test.

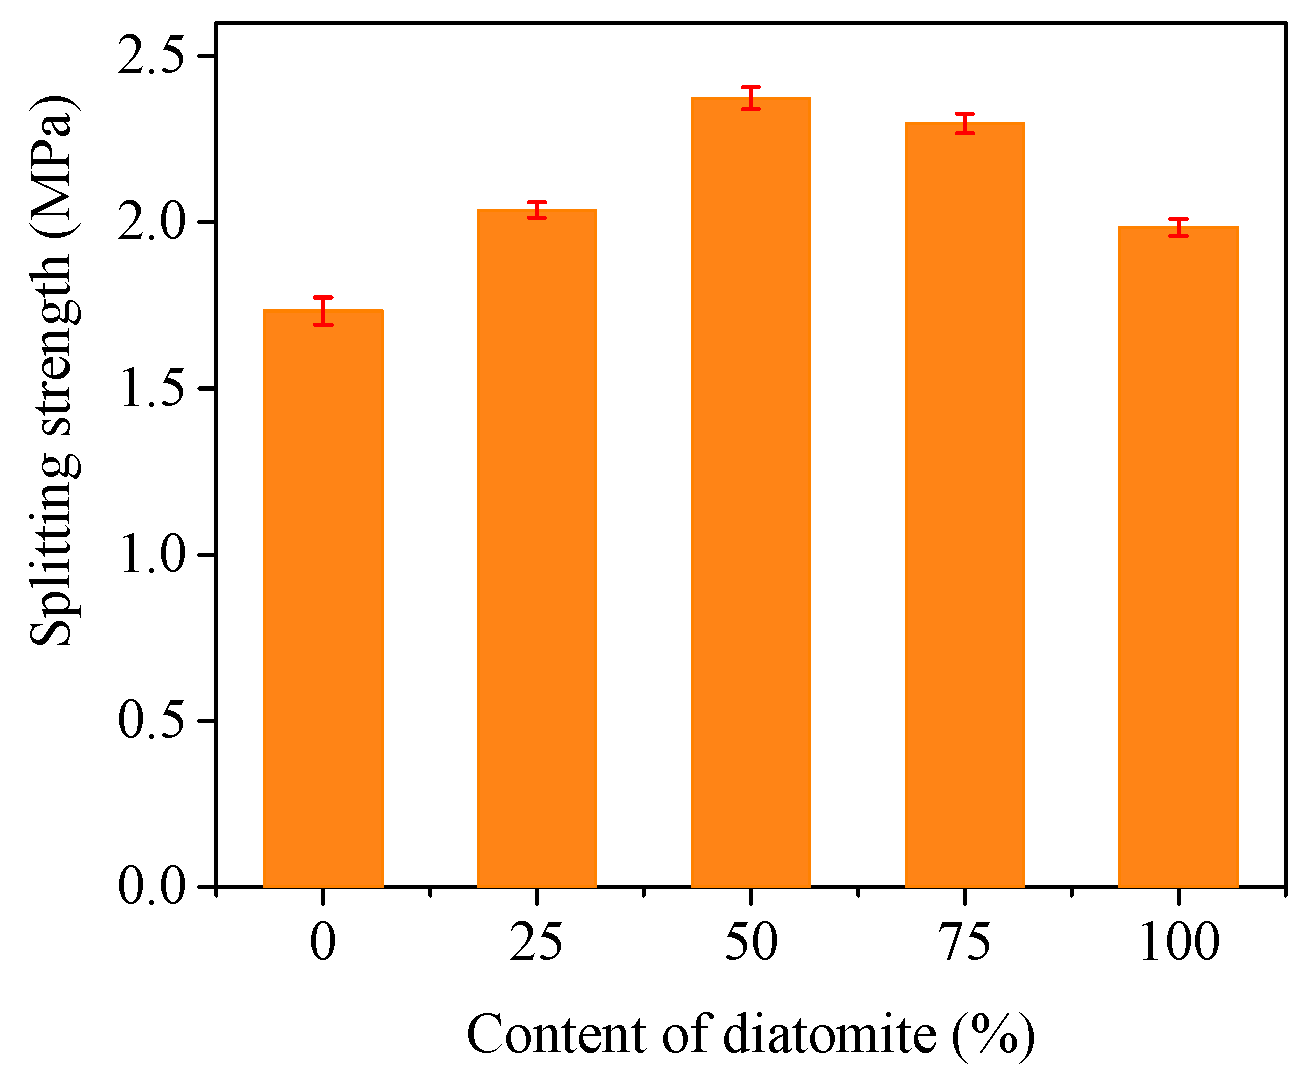
2.4.3. Low-Temperature Splitting Test

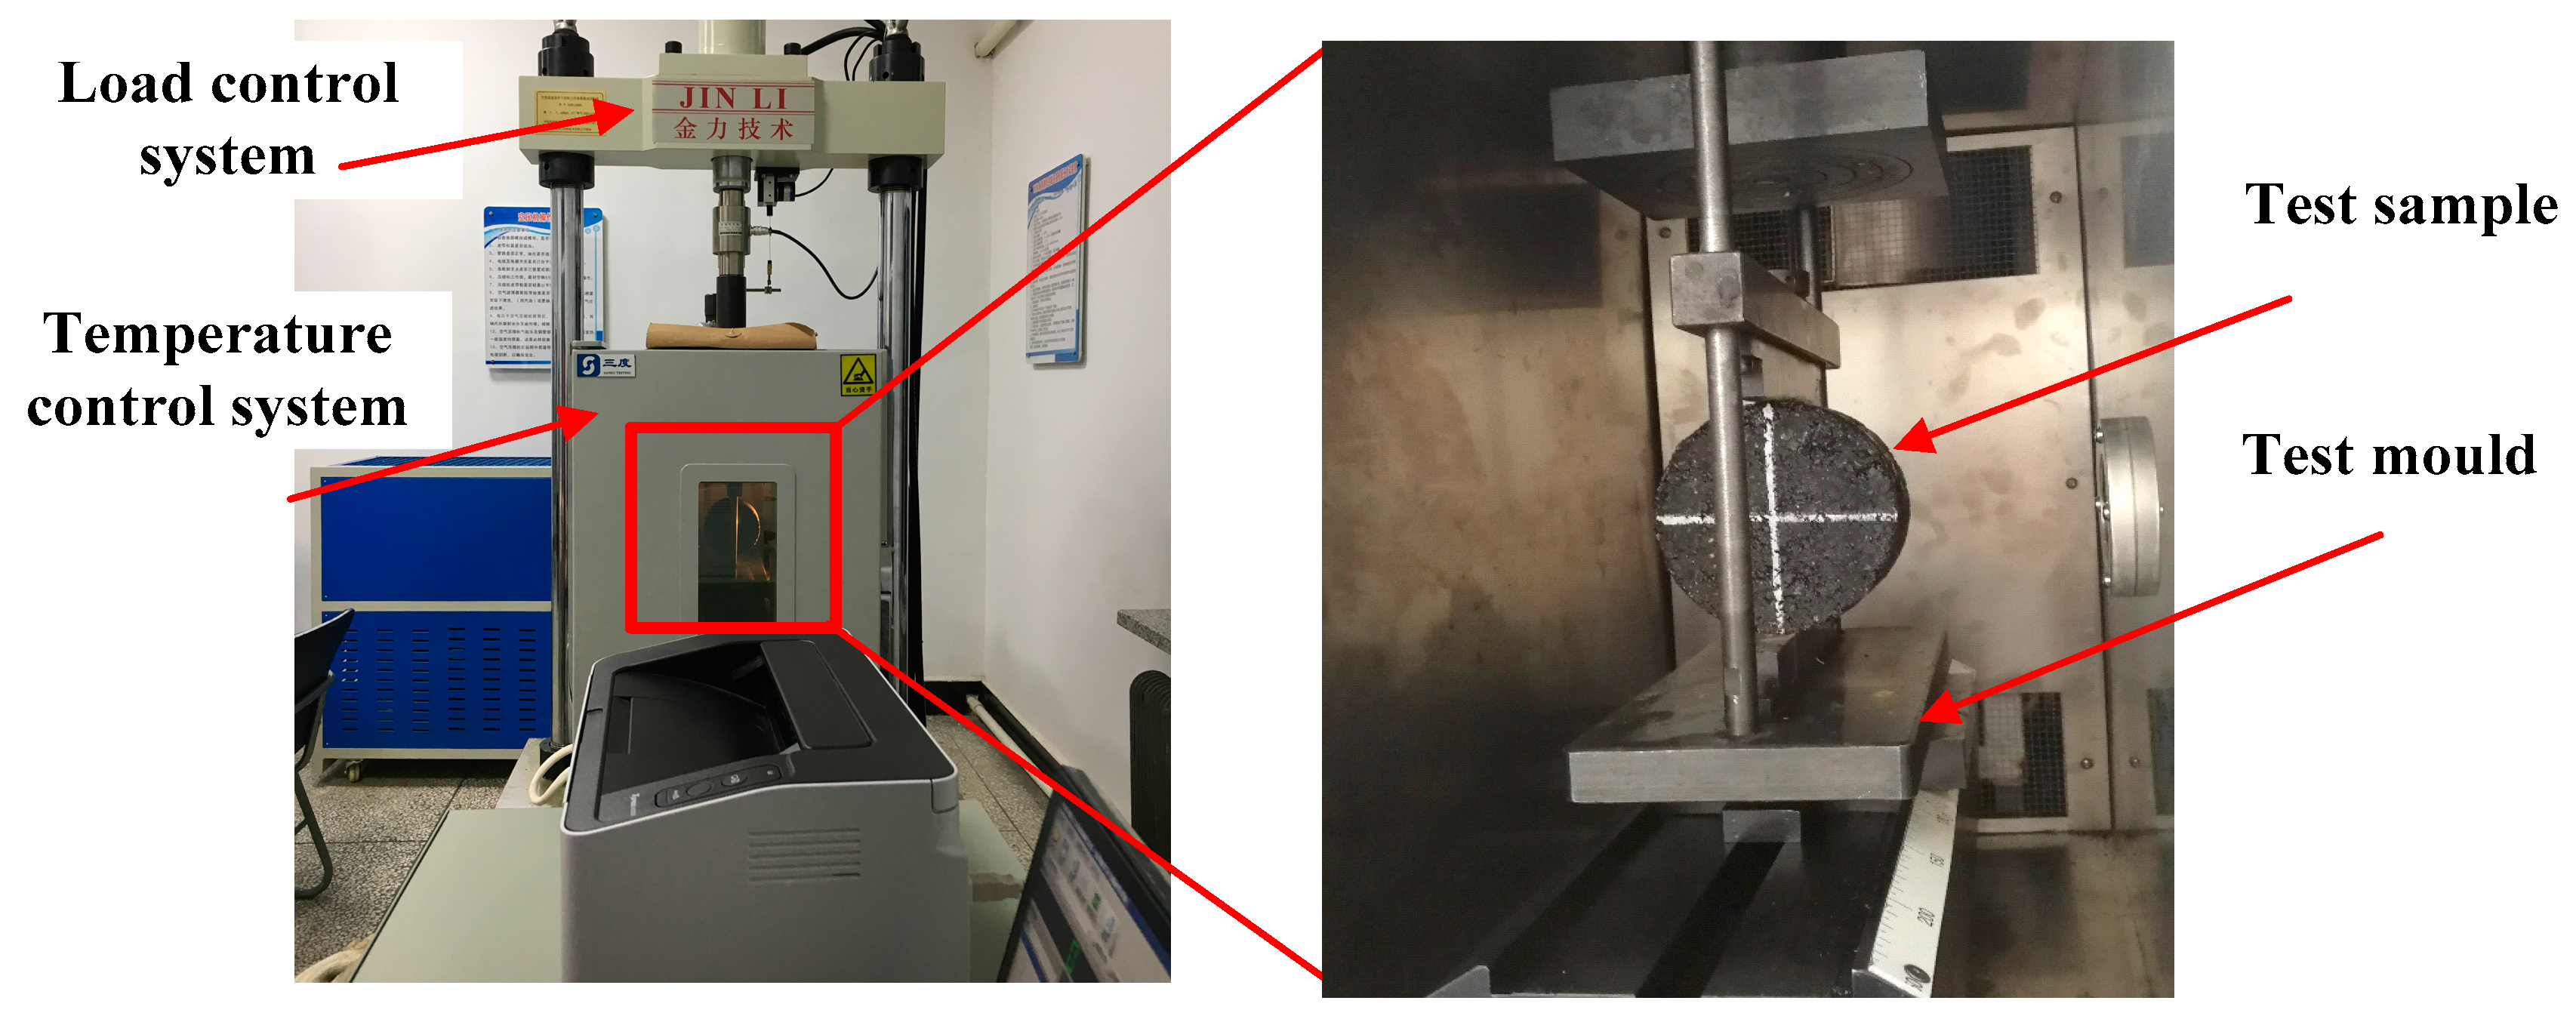
A low-temperature splitting test is a relatively simple method to evaluate the low-temperature performance of an asphalt mixture. In this experiment, the low-temperature splitting test was used to investigate the indirect tensile failure property of sand asphalt. The splitting strength RT was used to reflect the mechanical properties of sand asphalt, which could be calculated using Equation (3), according to Chinese Standard Specification (JTG E20-2011 2011) [26]. The test temperature was −10 °C, and the loading rate was 1 mm/min. The test specimen was a cylinder with a diameter of 100 mm and a height of 63.5 ± 2 mm, with four test specimens for each test. A material mechanical testing machine was used to conduct the test, as shown in Figure 5.
R T = 0.006287 P T h
where RT is the indirect tensile strength, MPa; PT is the indirect tensile failure load, N; and h is the specimen height, mm.

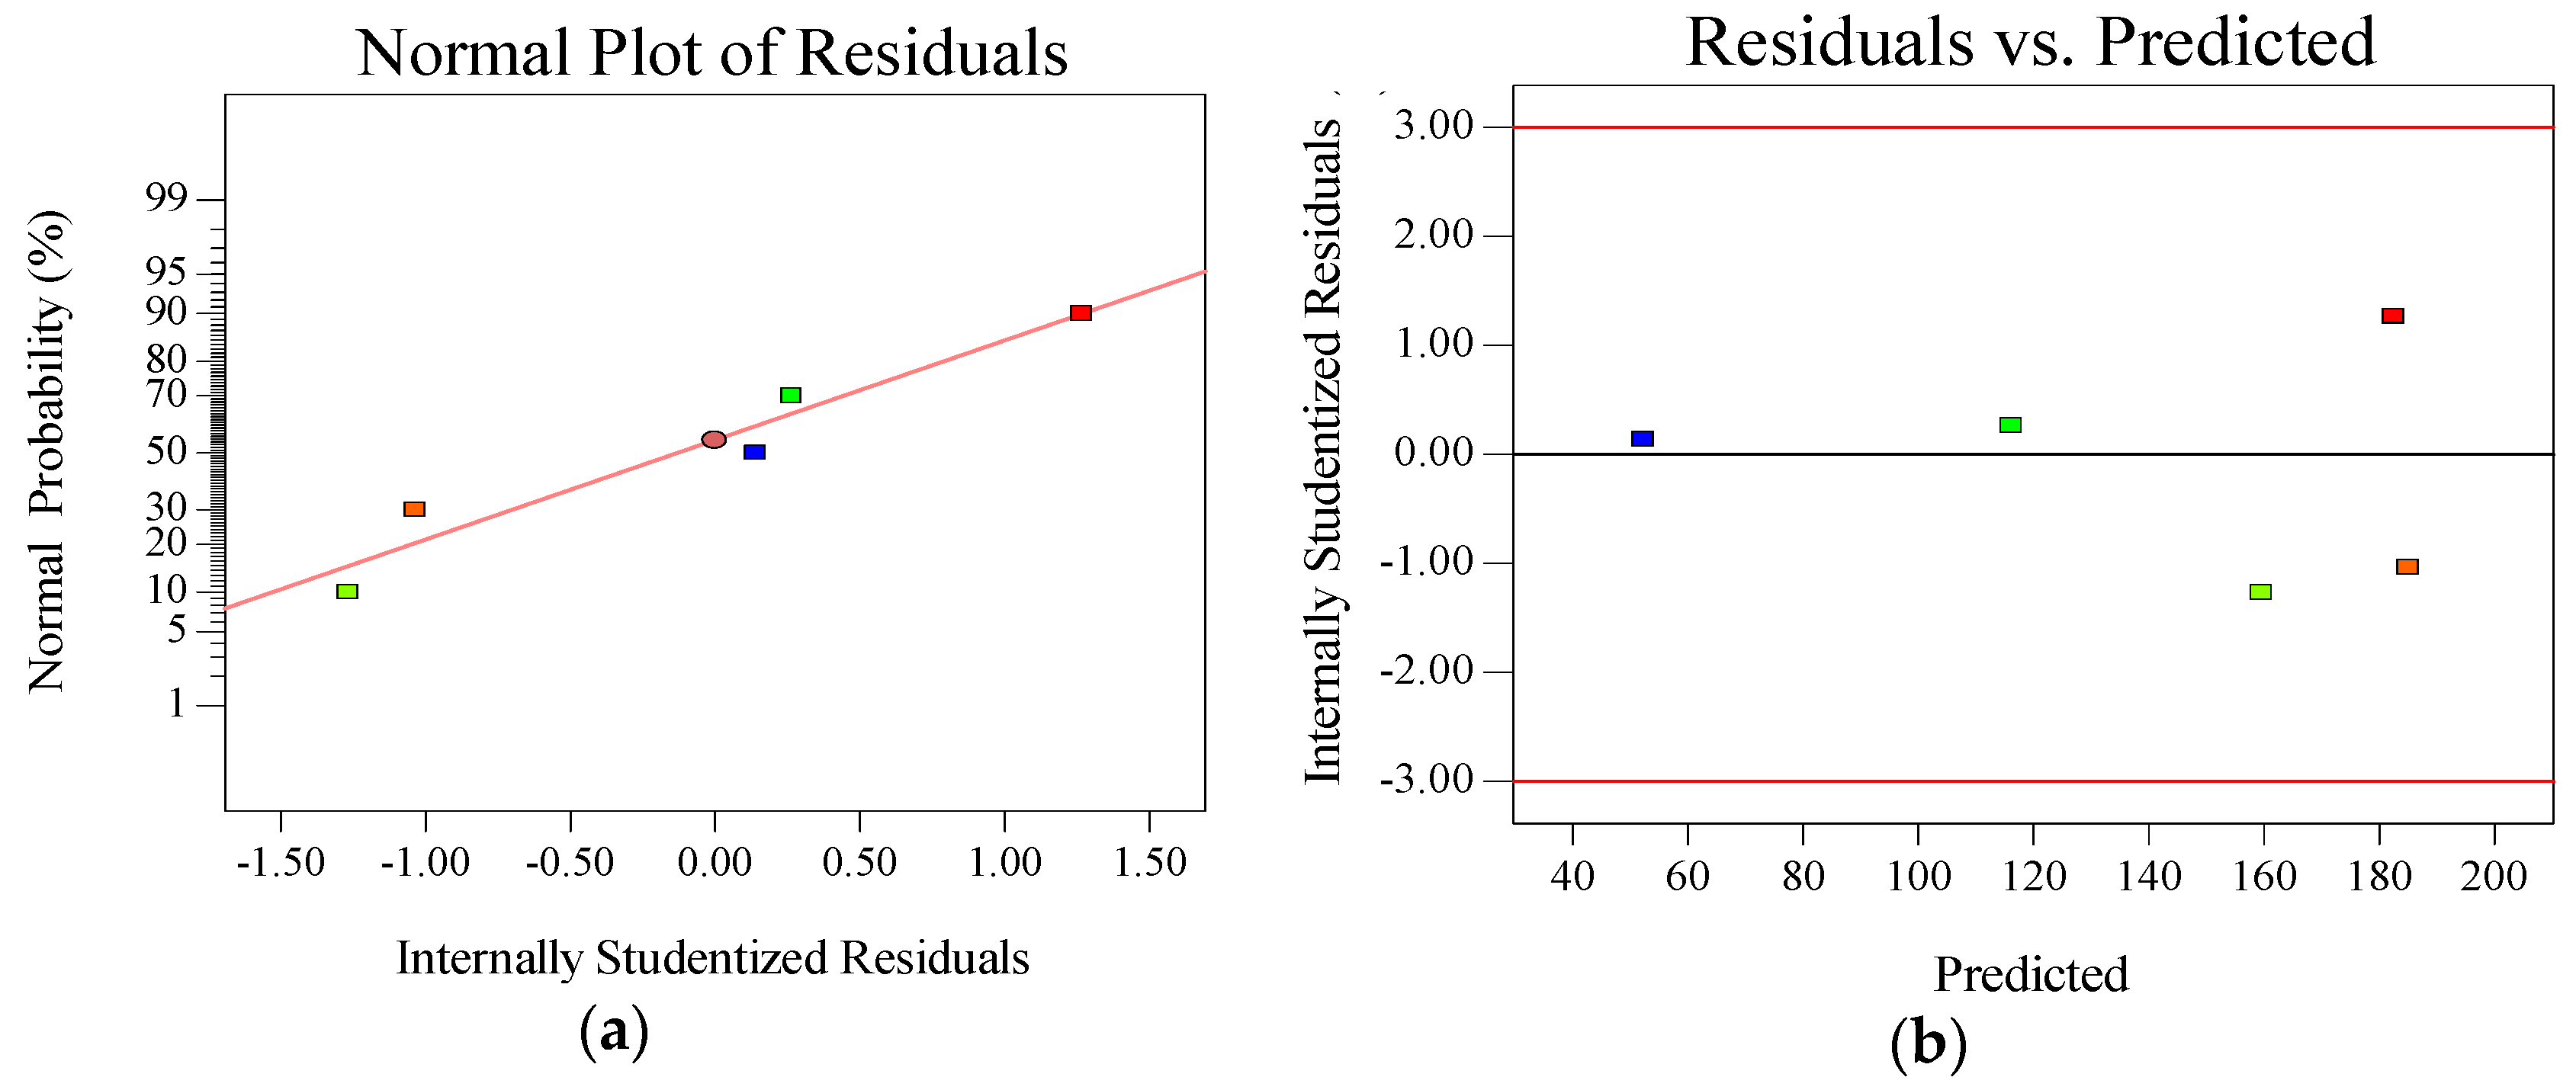
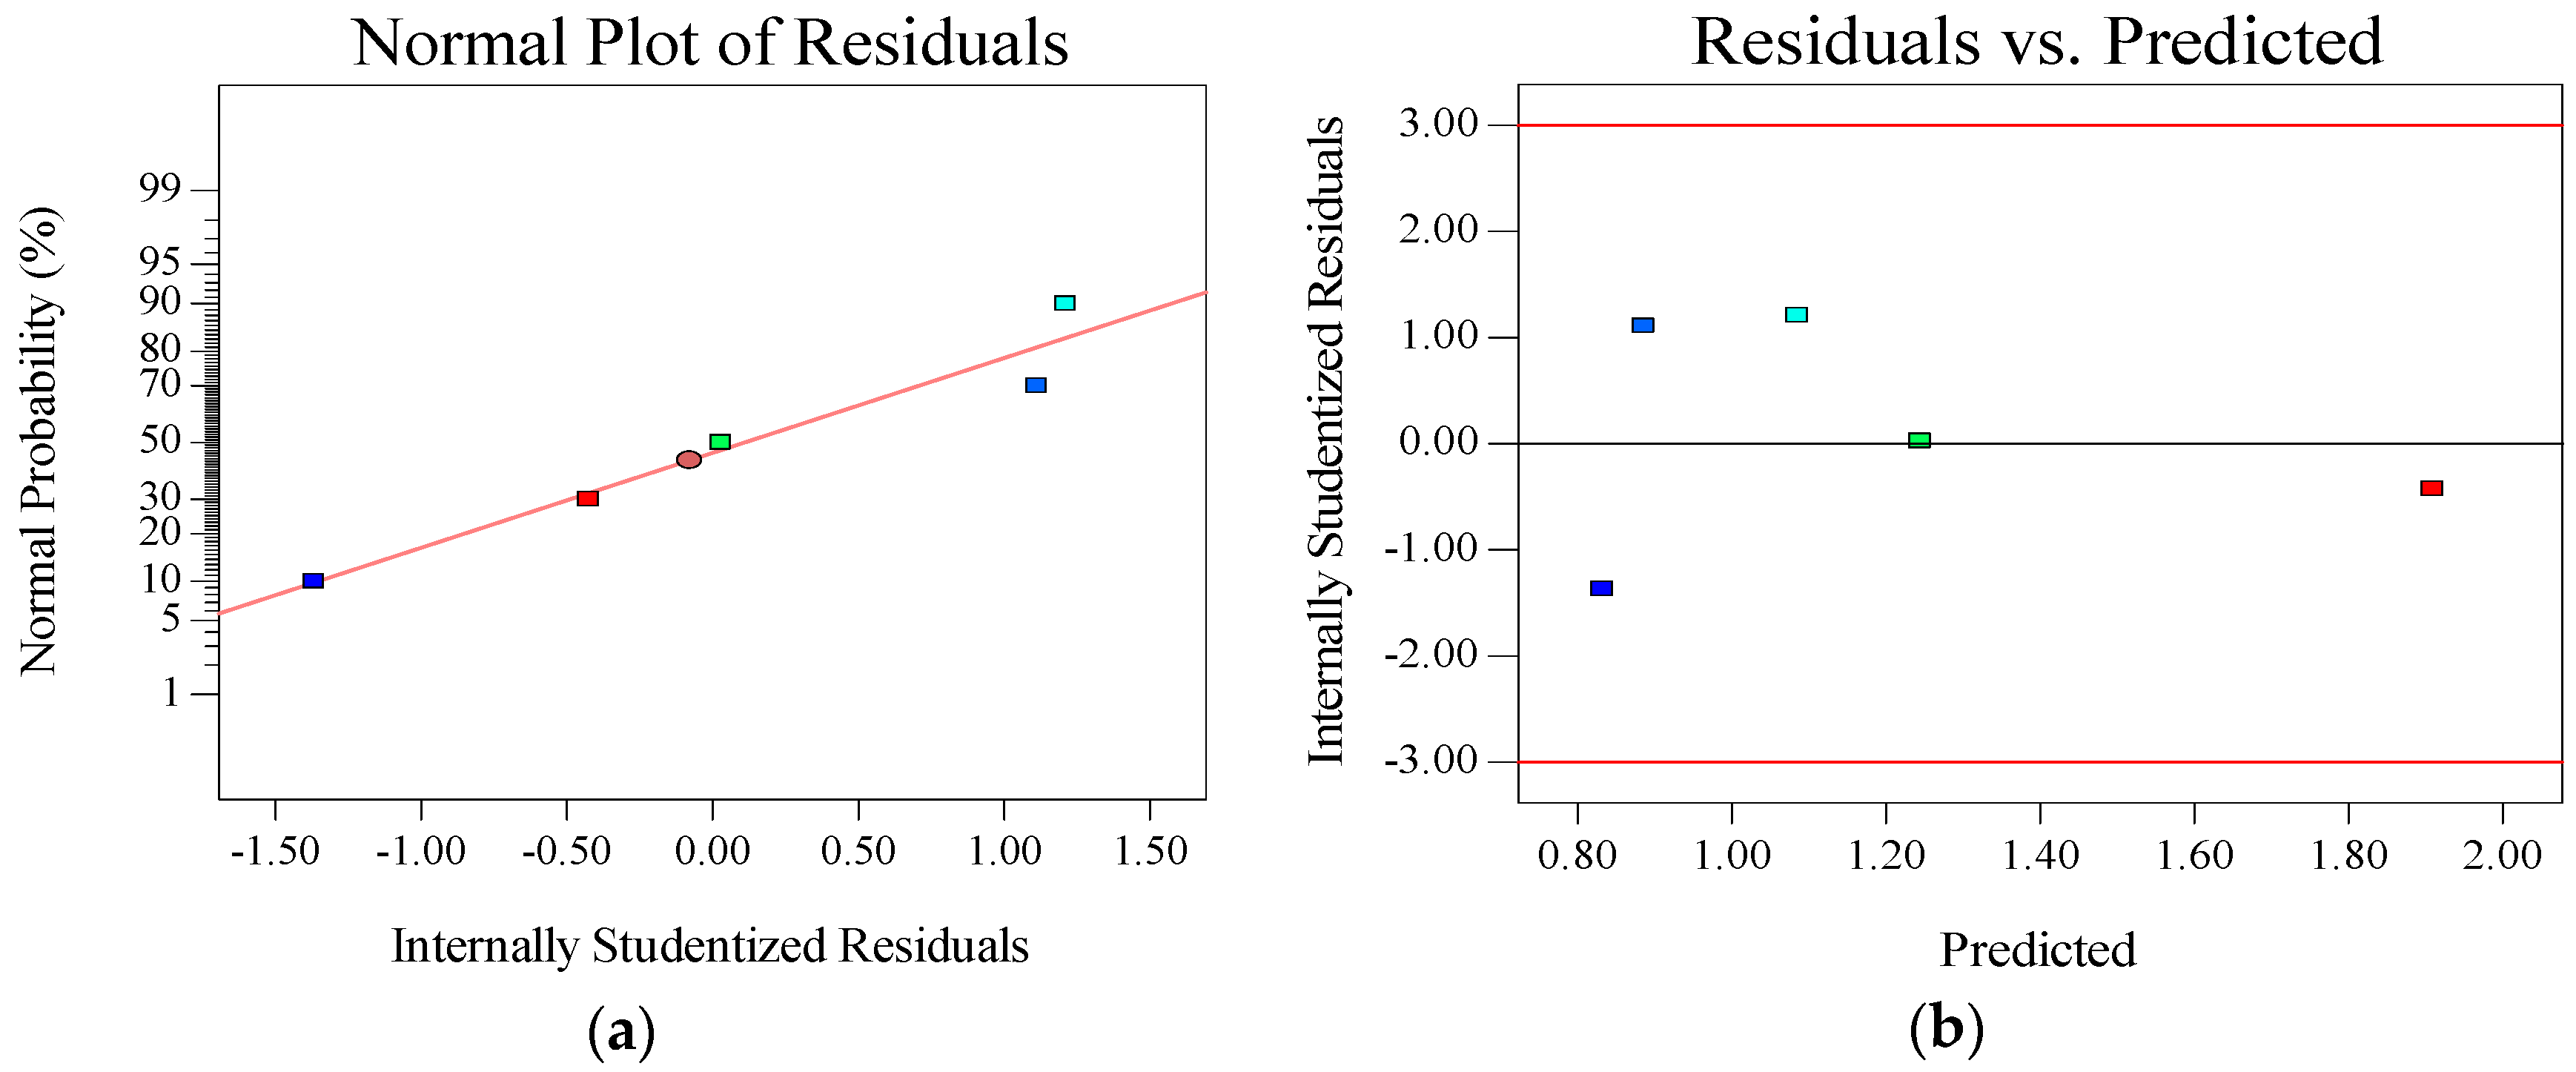
2.5. Optimization Based on SLD

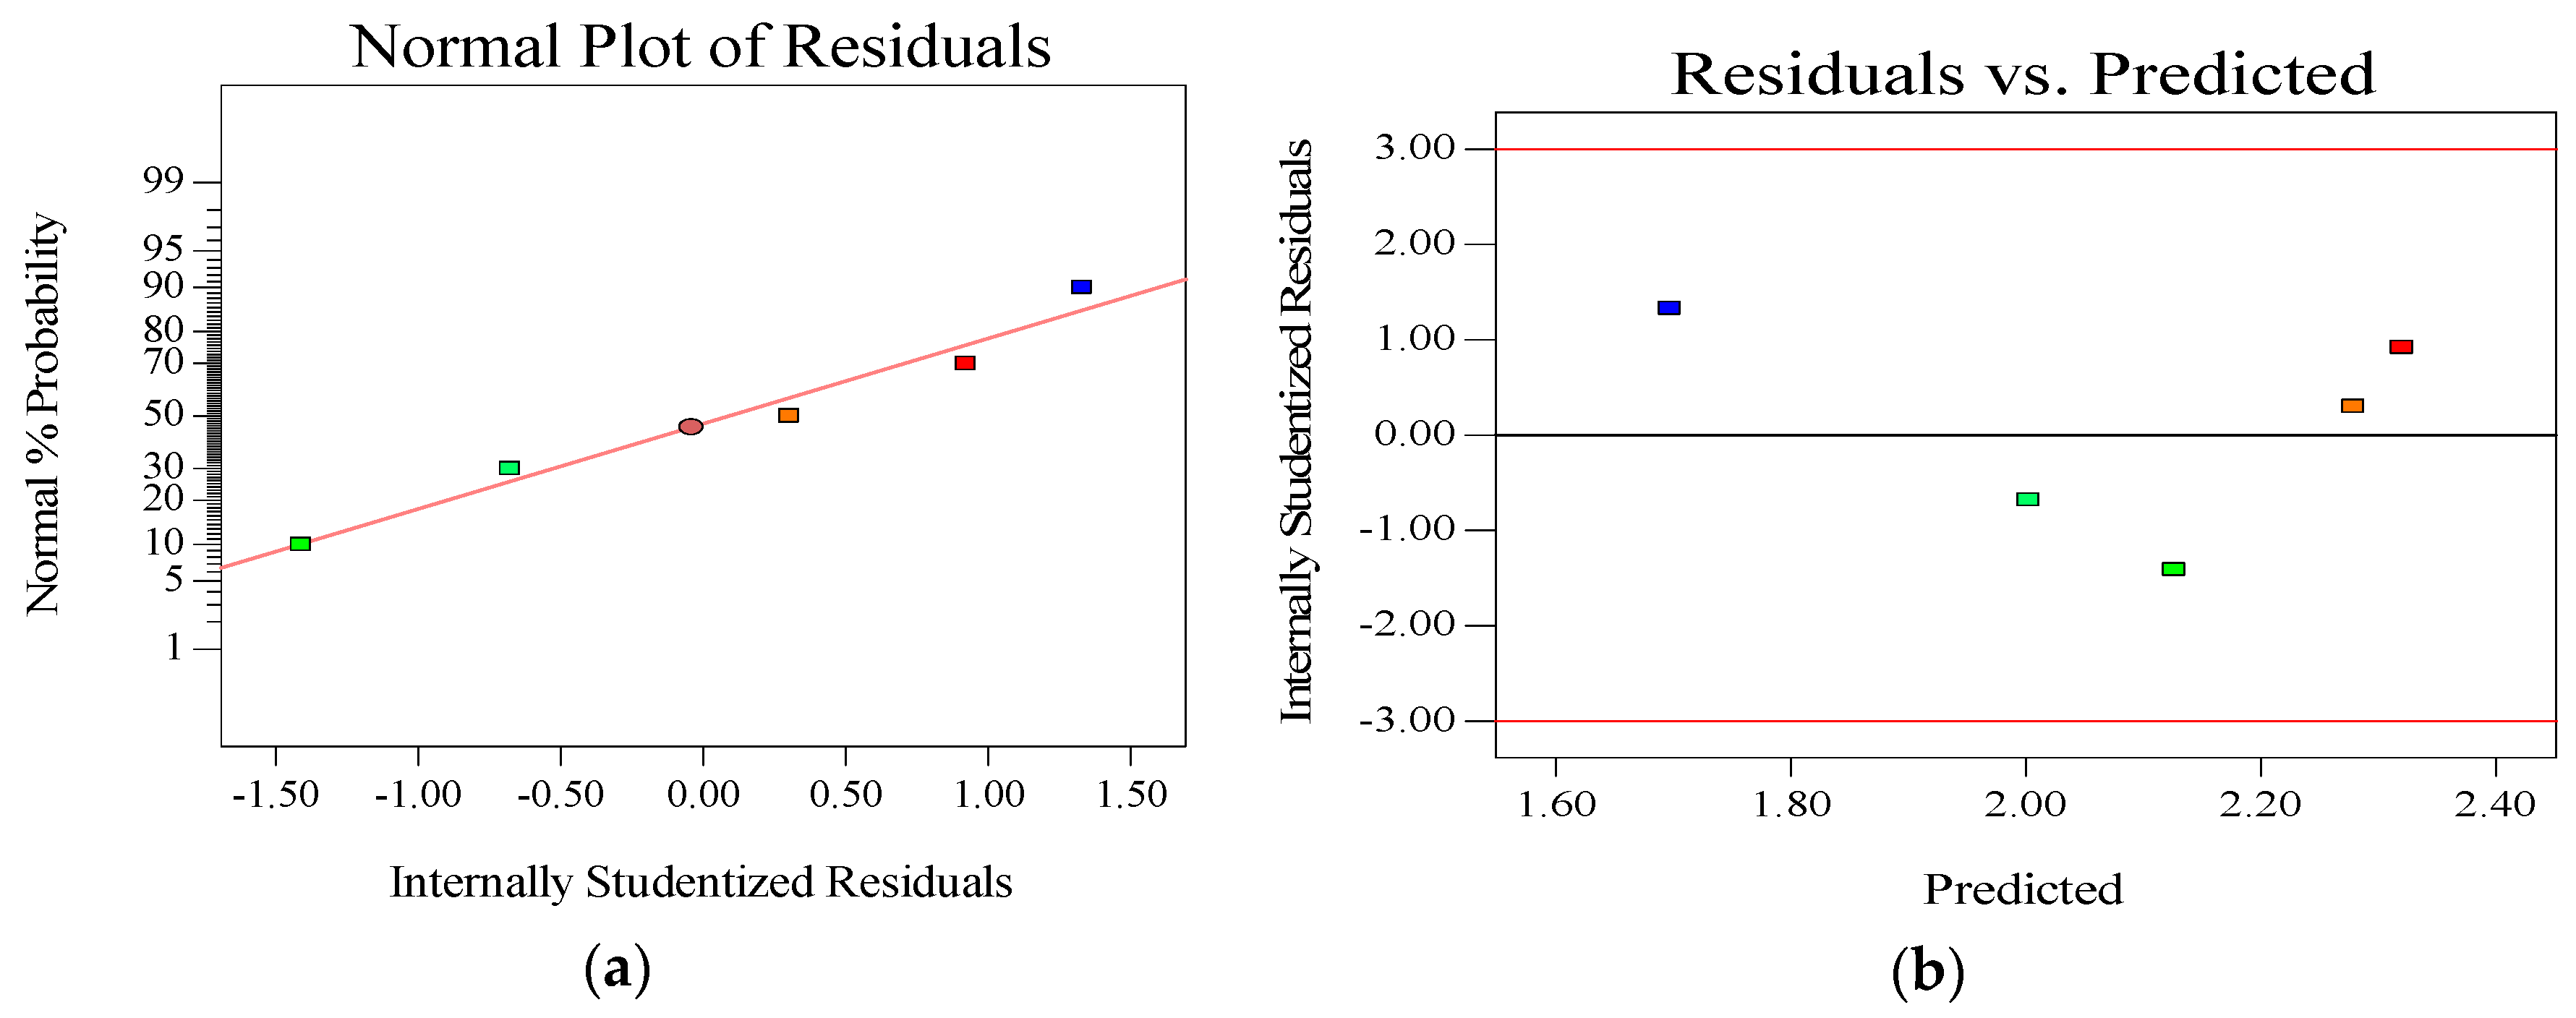
In this experiment, analysis of variance (ANOVA) and multiple regression based on SLD were used to evaluate the effects of the volume fraction of diatomite (A) and the volume fraction of limestone (B) on the mechanical and deformation properties of sand asphalt. In ANOVA, a p-value is used to test the statistical hypothesis. A significance level of 5% was selected, which meant that the p-value was equal to 0.05. The p-values below 0.05 indicated a statistical significance of factors. The general regression model was expressed in terms of a polynomial, which is shown in Equation (4) [16]:
Y = a 1 A + a 2 B + a 12 A B ,
where Y is an estimated response including secant modulus, creep strain, and repeated creep strain; A is the volume content of the diatomite; B is the volume content of the limestone; and a1, a2, and a12 are the constant coefficients for the linear and non-linear terms that were calculated from the experimental results through ANOVA. Both the direction and magnitude of the constant coefficient indicated the effect and impact of each term on the response [16].
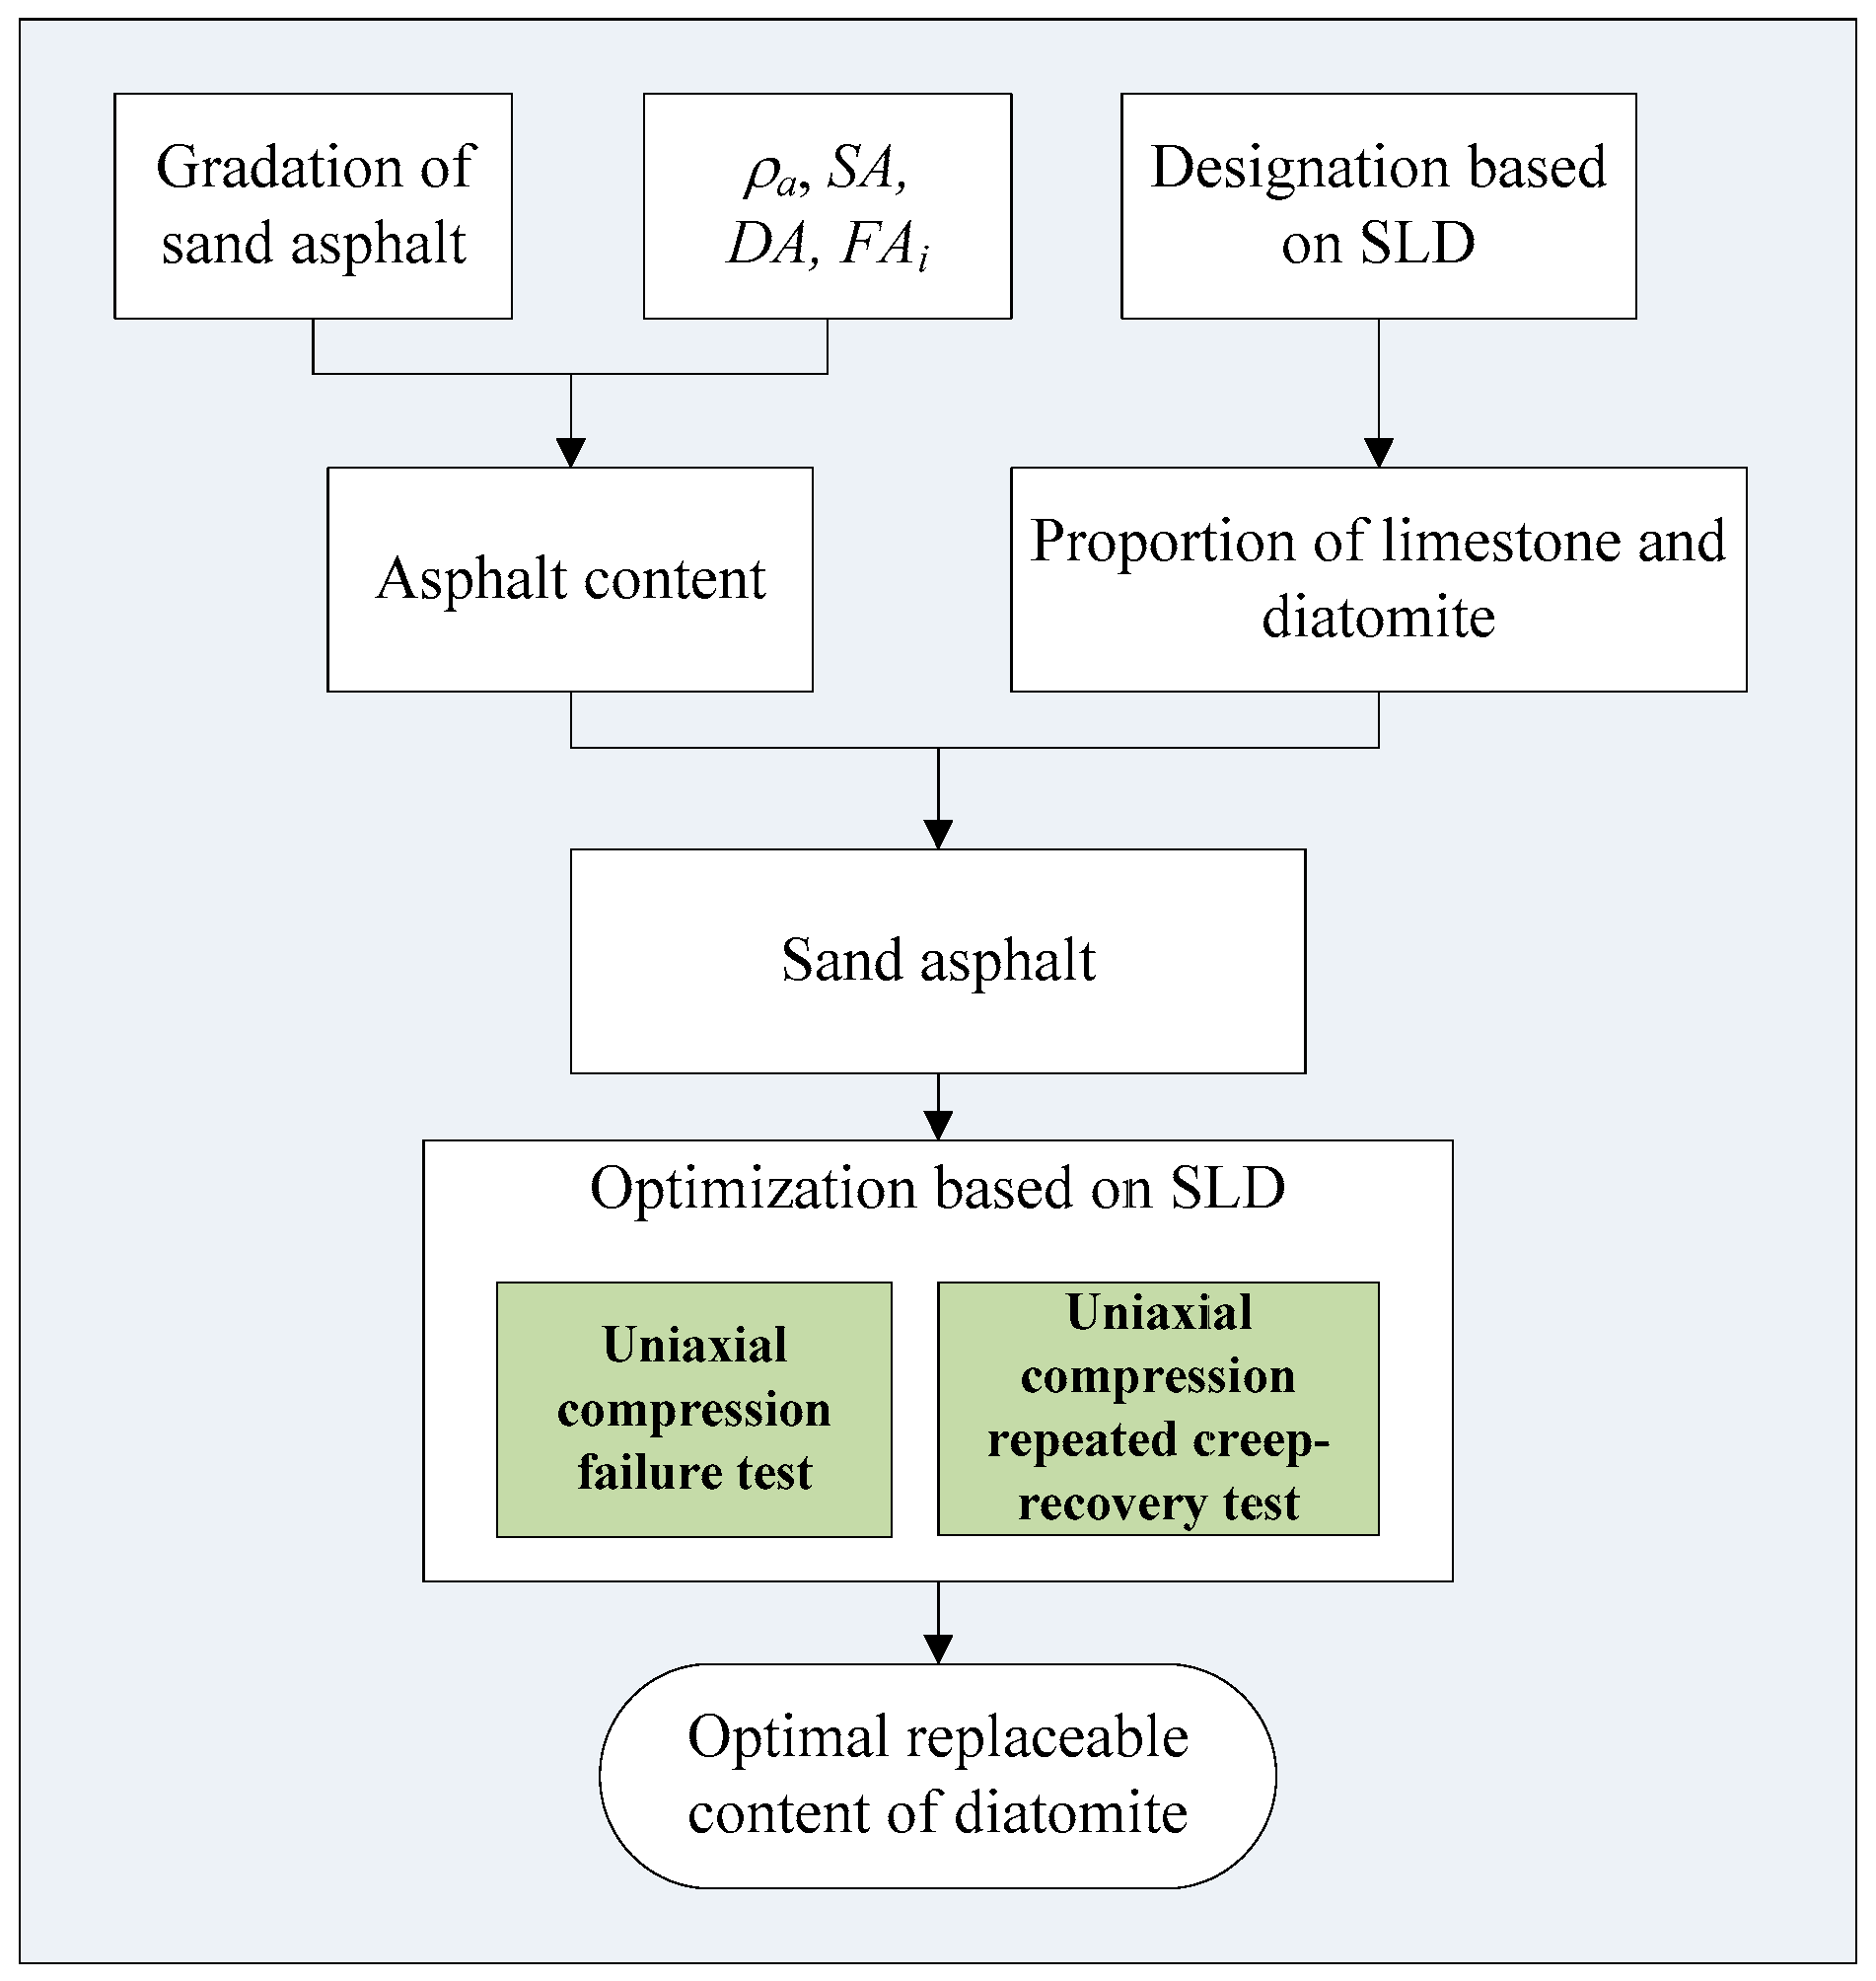
The entire procedure that was used to determine the optimal diatomite content as an alternative mineral additive based on mechanical properties is shown in Figure 6. The optimization procedure is listed as follows:
Firstly, the content of diatomite and limestone were selected as mixture components, and the corresponding low limit and high limit were set.
Secondly, designation results were obtained by the Design-Expert software, according to the SLD method.
Thirdly, sand asphalts were prepared according to the designation results, and mechanical tests were performed in order to get response indexes.
Finally, optimization was performed by the Design-Expert software according to the contents of diatomite and limestone, and the corresponding mechanical test results, by which the optimal diatomite content was obtained.

3. Results and Discussion

3.1. Uniaxial Compression Failure Test

The uniaxial compression failure test was employed to evaluate the mechanical properties of sand asphalt under a constant loading rate, which was conducted under a displacement control mode. All five groups of sand asphalts were tested at room temperature (21 ± 1 °C), and three loading rates (2 mm/min, 10 mm/min, and 20 mm/min) were applied on the samples. Failure stress, failure strain, and the corresponding secant modulus of sand asphalts were calculated. The results are shown in Figure 7.
As can be observed from Figure 6, the failure stress and secant modulus of the sand asphalts increased as the diatomite content increased, whereas the failure strain decreased as the diatomite content increased. Also, the extreme points were at approximately 75% diatomite content, from three parameters. The failure stresses of AM-75 were 2.63, 2.03, and 1.74 times higher than AM-0, corresponding to loading rates of 2 mm/min, 10 mm/min, and 20 mm/min, respectively. The failure strength of sand asphalt significantly improved through the addition of diatomite. The failure strain ratios of AM-75 to AM-0 were 0.52, 0.55, and 0.53, corresponding to loading rates of 2 mm/min, 10 mm/min, and 20 mm/min, respectively. The deformation ability under loading appeared to decrease with the addition of diatomite. In contrast, loadings of AM-75 and AM-0 were different when samples were damaged, which resulted in low deformation. Therefore, the secant modulus was a significantly reliable parameter to evaluate the deformation coordination ability of the sand asphalt. As shown in Figure 6c, the secant modulus ratios of AM-75 to AM-0 were 5.03, 3.68, and 3.31, corresponding to the loading rates of 2 mm/min, 10 mm/min, and 20 mm/min, respectively. The secant modulus apparently increased through the replacement of diatomite, which indicated that the deformation coordination abilities of sand asphalts were improved by diatomite. In previous studies, it was demonstrated that the diatomite asphalt mastic that was presented improved high and medium temperature performances compared with the limestone asphalt mastic [10]. The softening point, viscosity, and complex modulus of the asphalt mastics effectively increased through the addition of diatomite [9,10]. Consequently, the failure strength and secant modulus of the sand asphalts were improved through the replacement of diatomite.
It could be observed that the failure stress and secant modulus were apparently affected by the loading rates, as seen in Figure 6. The higher the loading rate, the higher the failure stress and secant modulus. In contrast, the failure strains of sand asphalts were not evidently affected by the loading rate. This was consistent with the results obtained by Wu et al. [27] and Cai et al. [28].

3.2. Uniaxial Compression Repeated Creep-Recovery Test

The uniaxial compression repeated creep-recovery test was employed in order to evaluate the deformation resistance of the sand asphalt under constant stress. This test is widely used to analyze the permanent deformation property of asphalt concrete for corresponding simplicity [15]. All five groups of sand asphalts were tested at 30 °C, and three stress levels (0.12 MPa, 0.36 MPa, and 0.72 MPa) were applied on the samples. The samples were placed in a temperature controller for a four-hour prior to test to ensure that all of the samples would reach the test temperature. The results are shown in Figure 8.
As shown in Figure 8, the creep strains of AM-0 were the highest among the five groups, whereas the creep strains of AM-75 were the lowest under stress levels of 0.36 MPa and 0.72 MPa. Besides, the creep stains of the five groups arranged from the highest to the lowest were AM-0, AM-25, AM-100, AM-75, and AM-50 under the stress level of 0.12 MPa. It appeared that the creep strain decreased firstly, and consequently increased as the diatomite content increased. Furthermore, the optimal replacement content of diatomite was approximately 0.75. This mainly occurred because the addition of diatomite improved the adhesive force between the asphalt binder and the aggregate through enhancing the deformation resistance of the sand asphalt [10]. In contrast, the asphalt content was constant for the five different sand asphalts. Diatoms skeletons are honeycomb silica structures that give diatomite useful characteristics, such as high absorptive capacity and a big surface area [29]; so, the higher the diatomite amount, the higher the amount of adsorbed asphalt. Therefore, the effective asphalt binder in the sand asphalt was insufficient when the content of diatomite was too high, which resulted in the creep strain increments of sand asphalt. It could also be observed that the creep strains significantly increased as the stress level increased, as shown in Figure 7. The creep strain of AM-0 was too high to be measured with the test system subsequent to 200 loading cycles under the stress of 0.72 MPa, which was probably because AM-0 was damaged under the stress level at 30 °C. The curves of the creep strain versus the loading cycles could be described quite well by a power function. The function is shown in Equation (5), and the corresponding regression results are listed in Table 6.
ε c = a × N b ,
where εc is the creep strain; N represents the loading cycles; and a and b are constant coefficients.
As presented in Table 6, all of the R2 exceeded 0.98, which revealed that the regressions were successful. The creep performance of the asphalt/mixture could be divided into three stages. In the first stage, the creep rate decreased as the loading cycles increased, and relatively high deformation occurred during a low number of loading cycles. In the second stage, the creep rate was retained at a constant, and the permanent deformation increased linearly as the loading cycles increased. Lastly, in the final stage, the creep rate increased as the loading cycles increased, and deformation was accelerated and increasing prior to the occurrence of complete failure [30]. The results in Figure 7 revealed that the first and second stages were obtained, whereas the final stage did not occur in these tests. Therefore, the first and second stages of the creep performance of the sand asphalt could be well described with a power law.

3.3. Low-Temperature Splitting Test

The low-temperature splitting test was used to evaluate the low-temperature stability of the sand asphalt under a constant loading rate of 1 mm/min. The test temperature was −10 ± 1 °C. The splitting strength RT was used to reflect the mechanical properties of the sand asphalt, which could be calculated according to Equation (3). The results are shown in Figure 9.
It can be seen from Figure 9 that the splitting strength of the sand asphalts showed a parabolic growth trend as the diatomite content increased. The extreme point was at approximately 50% diatomite content. The splitting strength of AM-50 was 1.37 times higher than AM-0. The tensile failure process could be indirectly simulated by a low-temperature splitting test; this is an indirect process that reflects the low-temperature crack resistance property of the asphalt mixture. The higher the splitting strength, the better the low-temperature crack resistance. Therefore, the low-temperature crack resistance could be improved by the addition of diatomite. This improvement is mostly because the adhesion of diatomite asphalt mastic is significantly higher than that of limestone asphalt mastic [9,10]. However, the asphalt content was constant for all of the groups of sand asphalt, while the asphalt absorption of diatomite is much higher than that of limestone. The free asphalt is insufficient when too much limestone is replaced by diatomite, which results in the decreasing of the splitting strength of the sand asphalt when the addition of diatomite exceeded the optimum content.

3.4. Optimal Replaceable Content of Diatomite Based on SLD

The results of the uniaxial compression failure, the uniaxial compression repeated creep-recovery tests, and the low-temperature splitting test demonstrated that the sand asphalt’s mechanical and rheological properties were improved by the addition of diatomite. In contrast, the enhancement effects of diatomite on the performances of sand asphalt differed as the content varied. Therefore, it was essential to obtain the optimal content of diatomite as an alternative mineral additive. For this purpose, a multiple regression analysis based on SLD was carried out. The secant modulus under a loading rate of 10 mm/min, the creep strain under a stress level of 0.36 MPa, and the splitting strength at −10 °C were selected as the response parameters to perform the optimization analysis. The SLD response values are presented in Table 7.
The SLD analysis processes are as follows. Firstly, ANOVA was employed to analyze the volume fraction ratio significance of limestone to diatomite on the secant modulus, creep strain, and splitting strength, respectively. Secondly, a regression model of single response was established with the volume fraction of limestone and diatomite as an independent variable. Finally, optimization was carried out in terms of three response parameters: ANOVA for secant modulus, creep strain, and splitting strength. These parameters are shown in Table 8, Table 9 and Table 10, respectively.
The p-value displayed the probability of the mechanical and deformation properties of the sand asphalt being affected by its main composition during the sample preparation. The terms, which had p-values below 0.05, presented a significant effect on the mechanical and deformation properties of the sand asphalt. The results of ANOVA indicated that all three models were significant. Besides, the content of diatomite (A) and the content of limestone (B) were the most significant factors affecting the secant modulus and creep strain. In the case of the creep strain, independent components and a two-level interaction of components (AB) were the significant factors. To verify the ANOVA, plots of the normal probability of residuals, and the residuals versus the predicted value for the secant modulus, creep strain, and splitting strength were generated and are shown in Figure 10, Figure 11, Figure 12 and Figure 13, respectively. The normal probability plots for all of the parameters presented straight lines, which indicated a normal distribution of errors. The internally studentized residuals were between −2 and 2, which meant that the residuals were fulfilling requirements, and had no pattern. The validations demonstrated that the ANOVA analyses were successful [16]. The final mathematical models that were associated with the responses in terms of their actual factors are presented in Equations (6)–(8). The results of the secant modulus, creep strain, and splitting strength could be predicted when the contents of diatomite and limestone were definite, according to Equations (6)–(8), respectively.
Secant   modulus = 185.04 A + 52.24 B + 163.66 A B ,
Creep   strain = 1.08 A + 1.91 B 2.45 A B
Spliting   strength = 2.00 A + 1.70 B + 1.88 A B
As shown in Figure 13, the secant modulus and splitting strength increased parabolically as the diatomite content increased, whilst the creep strain decreased parabolically with as the diatomite content increased. These models well described the variation trends of the secant modulus, creep strain, and splitting strength that were obtained from the respective uniaxial compression failure test, the uniaxial compression repeated creep-recovery test, and the low-temperature splitting test.
The volume fraction ratio optimization of limestone to diatomite was performed based on three response parameters, considering that the higher the secant modulus and splitting strength is, the better the performance of the sand asphalt. The goals of the secant modulus and splitting strength were set to a maximum. In contrast, the lower the creep strain, the better the anti-deformation property of the sand asphalt. Thus, the creep strain goal was set to a minimum. The importance factors of the secant modulus, creep strain, and splitting strength were set to be the same. The optimal volume fraction ratio of diatomite to limestone powder was 0.673:0.327, and the desirability was 0.709. In order to validate the optimal results, the sand asphalt was prepared according to the obtained volume fraction ratio. The secant modulus, creep strain, and splitting strength were tested with the same conditions as described in Section 2.4. The predicted and experimental values are listed in Table 11.
As presented in Table 11, the relative errors of both responses were below 5%, which indicated that the optimization was reliable. Therefore, the optimum volume fraction ratio of limestone powder to diatomite used in this study was 0.327:0.673.

3.5. Cost Analysis

In order to study the application and popularization of diatomite, the researchers did a cost analysis of diatomite. Limestone powder is about 280 ¥/t, whereas diatomite is about 1350 ¥/t in Jilin Province of China. AC-13 is used as an object for the economic analysis. Usually, the limestone powder is 6% of the mineral mixture by weight; the optimum volume fraction ratio of limestone powder to diatomite used in this study was 0.327:0.673. After the use of diatomite, the cost of the AC-13 asphalt mixture increased 13% due to the addition of diatomite. However, the secant modulus and the splitting strength of sand asphalt increased by 150% and 30%, respectively; also, the creep strains of the sand asphalt greatly reduced at the same time. From the analysis results, the increments of road performance were higher than cost, and maintenance cost would decrease in later period, so diatomite has a wide prospect in road application.

4. Conclusions

The effects of diatomite content on the mechanical and deformation properties of sand asphalt were studied in this paper. The following conclusions were obtained:
(1)
Secant modulus was quite a reliable parameter compared with failure strength and failure strain, which could be used to evaluate the ability of coordinate deformation of sand asphalt. The secant moduli apparently increased by the replacement of diatomite, which indicated that diatomite improved the deformation coordination abilities of sand asphalt. Besides, the failure stress and secant modulus were apparently affected by loading rates.
(2)
Creep strain decreased at first, and then consequently increased as the alternative content of diatomite increased, whereas the optimal replace content of diatomite was approximately at 0.75 diatomite content, according to the uniaxial compression repeated creep-recovery test results. The creep strains significantly increased as the stress level increased. Furthermore, the curves of the creep strain versus the loading cycles could be described quite well by a power function.
(3)
The low-temperature crack resistance of the sand asphalt could be improved by the addition of diatomite, according to the results of the low-temperature splitting test. Furthermore, the maximum point of splitting strength was at approximately 50% diatomite content.
(4)
The volume fraction ratio optimization of limestone to diatomite was performed based on the results of the secant modulus, creep strain, and splitting strength. The optimum ratio obtained was 0.327:0.673, according to simplex-lattice mixture design (SLD) analysis results.
In summary, it was beneficial to apply diatomite to asphalt pavement construction in order to improve its corresponding anti-deformation performance. In order to evaluate the application of diatomite quite systematically, as well as provide implementation guidance regarding the construction of asphalt pavement, performances of diatomite asphalt mixture will be studied in the future.

Acknowledgments

The authors express their appreciation for the financial supports of the National Natural Science Foundation of China under Grant Nos. 51678271, 51508150 and 51408258, Science Technology Development Program of Jilin Province (20160204008SF) and Transportation Science & Technology Project of Jilin Province (2015-1-13). The authors declare that there no conflict of interests regarding the publication of this paper.

Author Contributions

Yongchun Cheng, Chunfeng Zhu conceived and designed the experiments; Jinglin Tao, Di Yu and Bo Xiao performed the experiments and involved in results discussions.; Yubo Jiao and Chunfeng Zhu analyzed the data; Chunfeng Zhu wrote the paper.

Conflicts of Interest

The authors declare no conflict of interest.

References

  1. Liu, H.B.; Fu, L.X.; Jiao, Y.B.; Tao, J.L.; Wang, X.Q. Short-term aging effect on properties of sustainable pavement asphalts modified by waste rubber and diatomite. Sustainability 2017, 9, 996. [Google Scholar]
  2. Davar, A.; Tanzadeh, J.; Fadaee, O. Experimental evaluation of the basalt fibers and diatomite powder compound on enhanced fatigue life and tensile strength of hot mix asphalt at low temperatures. Constr. Build. Mater. 2017, 153, 238–246. [Google Scholar] [CrossRef]
  3. Tan, Y.Q.; Shan, L.Y.; Fang, J.; Zhang, X.Y. Anti-cracking mechanism of diatomite asphalt and diatomite asphalt mixture at low temperature. J. Southeast Univ. 2009, 25, 74–78. [Google Scholar]
  4. Tan, Y.Q.; Zhang, L.; Zhang, X.Y. Investigation of low-temperature properties of diatomite-modified asphalt mixtures. Constr. Build. Mater. 2012, 36, 787–795. [Google Scholar]
  5. Guo, Q.; Li, L.; Cheng, Y.; Jiao, Y.; Xu, C. Laboratory evaluation on performance of diatomite and glass fiber compound modified asphalt mixture. Mater. Des. 2015, 66, 51–59. [Google Scholar] [CrossRef]
  6. Cong, P.; Chen, S.; Chen, H. Effects of diatomite on the properties of asphalt binder. Constr. Build. Mater. 2012, 30, 495–499. [Google Scholar] [CrossRef]
  7. Cong, P.; Liu, N.; Tian, Y.; Zhang, Y. Effects of long-term aging on the properties of asphalt binder containing diatoms. Constr. Build. Mater. 2016, 123, 534–540. [Google Scholar] [CrossRef]
  8. Cheng, Y.C.; Ma, H.L.; Zhang, P.; Tao, J.L.; Huang, J.P. Experimental study of physical and mechanical properties of asphalt mortars with different fillers. J. Jilin Univ. Eng. Technol. 2014, 6, 1628–1632. (In Chinese) [Google Scholar]
  9. Cheng, Y.; Tao, J.; Jiao, Y.; Guo, Q.; Li, C. Influence of diatomite and mineral powder on thermal oxidative ageing properties of asphalt. Adv. Mater. Sci. Eng. 2015, 2015, 947834. [Google Scholar] [CrossRef]
  10. Cheng, Y.; Tao, J.; Jiao, Y.; Tan, G.; Guo, Q.; Wang, S. Influence of the properties of filler on high and medium temperature performances of asphalt mastic. Constr. Build. Mater. 2016, 118, 268–275. [Google Scholar] [CrossRef]
  11. Csanyi, L.H.; Fung, H.P. Mortar Theory for Use of Ungraded Aggregates in Bituminous Mixes; Highway Research Board: Washington, DC, USA, 1955. [Google Scholar]
  12. Qiu, H.; Tan, X.; Shi, S.; Zhang, H. Influence of filler–bitumen ratio on performance of modified asphalt mortar by additive. J. Mod. Transp. 2013, 21, 40–46. [Google Scholar] [CrossRef]
  13. Yin, A.; Yang, X.; Gao, H.; Zhu, H. Tensile fracture simulation of random heterogeneous asphalt mixture with cohesive crack model. Eng. Fract. Mech. 2012, 92, 40–55. [Google Scholar] [CrossRef]
  14. You, Z.; Adhikari, S.; Dai, Q. Three-dimensional discrete element models for asphalt mixtures. J. Eng. Mech. ASCE 2008, 134, 1053–1063. [Google Scholar] [CrossRef]
  15. Bai, F.; Yang, X.; Yin, A.; Zeng, G. Modified Cross model for predicting long-term creep behavior of sand asphalt. Constr. Build. Mater. 2014, 65, 43–50. [Google Scholar] [CrossRef]
  16. Sungsuk, P.; Chayaporn, S.; Sunphorka, S.; Kuchonthara, P.; Piumsomboon, P.; Chalermsinsuwan, B. Prediction of pyrolysis kinetic parameters from biomass constituents based on simplex-lattice mixture design. Chin. J. Chem. Eng. 2016, 24, 535–542. [Google Scholar] [CrossRef]
  17. Karaman, S.; Yilmaz, M.T.; Kayacier, A. Simplex lattice mixture design approach on the rheological behavior of glucomannan based salep-honey drink mixtures: An optimization study based on the sensory properties. Food Hydrocoll. 2011, 25, 1319–1326. [Google Scholar] [CrossRef]
  18. El-Dahmy, R.M.; Elsayed, I.; Elshafeey, A.H.; El Gawad, N.A.A.; El-Gazayerly, O.N. Optimization of long circulating mixed polymeric micelles containing vinpocetine using simple lattice mixture design, in vitro and in vivo characterization. Int. J. Pharm. 2014, 477, 39–46. [Google Scholar] [CrossRef] [PubMed]
  19. Parejiya, P.B.; Patel, R.C.; Mehta, D.M.; Shelat, P.K.; Barot, B.S. Quick dissolving films of nebivolol hydrochloride: Formulation and optimization by a simplex lattice design. J. Pharm. Investig. 2013, 43, 343–351. [Google Scholar] [CrossRef]
  20. Technical Specifications for Construction of Highway Asphalt Pavements; JTG F40-2004; Research Institute of Highway Ministry of Transport: Beijing, China, 2004. (In Chinese)
  21. Hesami, E.; Jelagin, D.; Kringos, N.; Birgisson, B. An empirical framework for determining asphalt mastic viscosity as a function of mineral filler concentration. Constr. Build. Mater. 2012, 35, 23–29. [Google Scholar] [CrossRef]
  22. Robati, M.; Carter, A.; Ph, D.; Eng, P.; Asce, M.; Perraton, D.; Eng, P.; Sc, D. New Conceptual Model for Filler Stiffening Effect on Asphalt Mastic of Microsurfacing. J. Mater. Civ. Eng. 2015, 27, 1–11. [Google Scholar] [CrossRef]
  23. Aphalt binder film thickness concept in hot-mix asphalt. Transp. Res. Record J. Transp. Res. Board. 2008, 2057, 37–45.
  24. Kandhal, P.S.; Chakraborty, S. Effect of Asphalt Binder Film Thickness on Short and Long Term Aging of Asphalt Paving Mixtures; NCAT Report 96-01; National Center for Asphalt Technology: Auburn, AL, USA, 1996. [Google Scholar]
  25. Gao, D.; Wang, P.; Li, M.; Luo, W. Modelling of nonlinear viscoelastic creep behaviour of hot-mix asphalt. Constr. Build. Mater. 2015, 95, 329–336. [Google Scholar] [CrossRef]
  26. Standard Test Methods of Bitumen and Bituminous Mixtures for Highway Engineering; JTG E20-2011; Research Institute of Highway Ministry of Transport: Beijing, China, 2011. (In Chinese)
  27. Wu, J.; Collop, A.C.; McDowell, G.R. Discrete element modeling of constant strain rate compression tests on idealized asphalt mixture. J. Mater. Civ. Eng. 2010, 23, 2–11. [Google Scholar] [CrossRef]
  28. Degirmenci, N.; Yilmaz, A. Use of diatomite as partial replacement for Portland cement in cement mortars. Constr. Build. Mater. 2009, 23, 284–288. [Google Scholar] [CrossRef]
  29. Cai, W.; McDowell, G.R.; Airey, G.D. Discrete element modelling of uniaxial constant strain rate tests on asphalt mixtures. Granul. Matter. 2013, 15, 163–174. [Google Scholar] [CrossRef]
  30. Shafabakhsh, G.H.; Ani, O.J. Experimental investigation of effect of Nano TiO2/SiO2 modified bitumen on the rutting and fatigue performance of asphalt mixtures containing steel slag aggregates. Constr. Build. Mater. 2015, 98, 692–702. [Google Scholar] [CrossRef]
Figure 1. Particle size distributions of diatomite and limestone.
Sustainability 10 00808 g001
Figure 2. Selected gradation of sand asphalt.
Sustainability 10 00808 g002
Figure 3. Typical stress versus strain curve.
Sustainability 10 00808 g003
Figure 4. Loading and deformation measurement system.
Sustainability 10 00808 g004
Figure 5. Low-temperature splitting test process.
Sustainability 10 00808 g005
Figure 6. Procedure of experimental setup.
Sustainability 10 00808 g006
Figure 7. Results of the uniaxial compression failure test: (a) failure stress; (b) failure strain; (c) secant modulus.
Sustainability 10 00808 g007
Figure 8. Creep strain-loading cycles of sand asphalts at three stress levels: (a) 0.12 MPa; (b) 0.36 MPa; and (c) 0.72 MPa.
Sustainability 10 00808 g008aSustainability 10 00808 g008b
Figure 9. Results of the low-temperature splitting test.
Sustainability 10 00808 g009
Figure 10. Normal probability plot of residuals (a) and residual vs. predicted values (b) for the prediction of the secant modulus.
Sustainability 10 00808 g010
Figure 11. Normal probability plot of residuals (a) and residual vs. predicted values (b) for the prediction of the creep strain.
Sustainability 10 00808 g011
Figure 12. Normal probability plot of residuals (a) and residual vs. predicted values (b) for the prediction of the splitting strength.
Sustainability 10 00808 g012
Figure 13. Mathematical models of (a) the secant modulus versus the content of diatomite (A) and limestone (B), (b) the creep strain versus the content of diatomite (A) and limestone (B), and (c) the splitting strength versus the content of diatomite (A) and limestone (B).
Sustainability 10 00808 g013
Table 1. Basic properties of asphalt.
PropertyResult
Penetration (25 °C, 0.1 mm) 67.9
Softening point TR&B (°C)66.2
Ductility (5 °C, cm)24.9
Density (25 °C, g/cm3)1.047
Brookfield viscosity (135 °C, Pa·s)4.577
Elastic recovery (%)88
Table 2. Properties of diatomite and limestone.
PropertyColorPHApparent Density (g/cm3)Specific Surface Area (m2/g)
ResultDiatomiteOrange9.982.12711.556
LimestoneWhite7.842.6520.886
Table 3. Apparent densities of fine aggregates.
Diameter (mm)1.180.60.30.150.075
Apparent density (g/cm3)2.7132.7202.6992.6472.700
Table 4. Designation of limestone/diatomite content.
Run1 (AM-0)2 (AM-25)3 (AM-50)4 (AM-75)5 (AM-100)
Volume proportion (%)Limestone1007550250
Diatomite0255075100
Mass fraction (%)Limestone16.212.28.14.10.0
Diatomite03.26.59.713.0
Table 5. Surface area coefficients of aggregates with various diameters.
Diameter (mm)2.361.180.60.30.150.075
FAi0.00820.01640.02870.06140.12290.3277
Table 6. Results of power regressive analysis.
GroupAM-0AM-25AM-50AM-75AM-100
0.12 MPaa0.32760.23480.06470.09420.2017
b0.09670.12340.18700.18350.1240
R20.99330.99900.99520.99630.9988
0.36 MPaa0.61400.63800.45400.38120.5995
b0.14910.08920.09280.09890.0804
R20.99540.99580.99730.99650.9949
0.72 MPaa0.70300.51790.49990.39320.5869
b0.41690.22130.14660.12800.1560
R20.98420.99470.99940.99370.9965
Table 7. Simplex-lattice mixture design (SLD) response values of sand asphalt.
RunAM-0AM-25AM-50AM-75AM-100
R1 Secant modulus (MPa)52.8118.6148.8194.4180.9
R2 Creep strain (%)1.9041.24470.90990.79881.0976
R3 Splitting strength (MPa)1.7332.0372.3732.2981.984
Table 8. Analysis of variance (ANOVA) of secant modulus.
SourceSum of SquaresDFMean SquareF Valuep-Value Prob > F
Model12,487.1326243.5744.560.0219 *
Linear Mixture11,022.40111,022.4078.670.0125 *
AB1464.7311464.7310.450.0838
Residual280.232140.11--
Total12,767.364---
* Significant F values at the 95% confidence level (p-value ≤ 0.05). DF = degrees of freedom.
Table 9. Analysis of variance (ANOVA) of creep strains.
SourceSum of SquaresDFMean SquareF Valuep-Value Prob > F
Model0.7520.38393.970.0025 *
Linear Mixture0.4210.42444.720.0022 *
AB0.3310.33343.210.0029 *
Residual1.906 × 10−329.530 × 10⁻⁴--
Total0.754---
* Significant F values at the 95% confidence level (p-value ≤ 0.05). DF = degrees of freedom.
Table 10. Analysis of variance (ANOVA) of splitting strength.
SourceSum of SquaresDFMean SquareF Valuep-Value Prob > F
Model0.2520.1319.770.0482 *
Linear Mixture0.05810.0589.130.0943
AB0.1910.1930.400.0314 *
Residual0.01326.374 × 10−3--
Cor Total0.264---
* Significant F values at the 95% confidence level (p-value ≤ 0.05). DF = degrees of freedom.
Table 11. Predicted and experimental values of secant modulus and creep strain.
ResponsesPredicted ValueExperimental ValueRelative Error (%)
Secant modulus (MPa)1781853.93
Creep strain (%)0.8160.84623.7
Splitting strength (MPa)2.3172.2064.79

