Article

Evaluating Synergies and Trade-Offs among Sustainable Development Goals (SDGs): Explorative Analyses of Development Paths in South Asia and Sub-Saharan Africa

1
Energy and Climate Studies, KTH Royal Institute of Technology, Brinellvägen 68, 100 44 Stockholm, Sweden
2
Built Environment and Energy Technology, Linnaeus University, 351 95 Växjö, Sweden
3
Finland Futures Research Centre, University of Turku, Åkerlundinkatu 2 A, 33100 Tampere, Finland
*
Author to whom correspondence should be addressed.
Sustainability 2018, 10(3), 815; https://doi.org/10.3390/su10030815
Submission received: 2 February 2018 / Revised: 7 March 2018 / Accepted: 8 March 2018 / Published: 14 March 2018
(This article belongs to the Section Energy Sustainability)

Abstract

:
Understanding the linkages between multiple targets of Sustainable Development Goals (SDGs) may help to integrate different sectoral programmes and develop coherent cross-sectoral policy to explore synergies. Synergy is interaction among two or more actions, which will lead to an impact greater or less than the sum of individual effects. Therefore, synergy can be positive or negative (trade-off). This paper aims at developing an analytical framework to evaluate sectoral linkages and examine potential synergies and trade-offs among various SDGs’ goals and targets. Synergies and trade-offs related to energy access (SDG7), clean water and sanitation access (SDG6), food security and sustainable agriculture (SDG2) and poverty alleviation (SDG1) have been evaluated from the perspective of developing countries using examples from South Asia (Bangladesh, Nepal, and Sri Lanka) and Sub-Saharan Africa (Ghana, Ethiopia and Rwanda), and historical data for the period between 1990 and 2012. The analytical framework includes both qualitative and quantitative methods. Network analysis technique has been used for exploring the conceptual linkage among different indicators, and capturing the targets associated with SDGs. Advanced Sustainability Analysis (ASA) developed under the European framework programme has been used for quantifying the synergies and trade-offs among sustainability indicators. The analysis showed strong synergy among various SDG targets. Interestingly, the potential synergy differs from country to country and over time. Ghana and Sri Lanka had relatively higher potential synergy, whereas Rwanda and Nepal had relatively lower potential synergy among the various targets. Higher synergy values were evidenced in those cases where the policy have recognized and emphasized on linkages among cross-sectoral targets.

1. Introduction

A set of Sustainable Development Goals (SDGs) were introduced as a follow-up to the Millennium Development Goals (MDGs) aimed at addressing complex global challenges. The SDGs encompass a new vision of development for the world as a whole, and compensate for shortcomings attributed to the MDGs [1]. The Sustainable Development Goals (SDGs) comprise 17 different goals with 169 targets, which are supposed to guide and keep track of national and global efforts to achieve sustainable development [2]. The incremental budget needed in low and lower-middle-income countries to meet sustainable development goals may amount to at least $1.4 trillion per year [3]. Understanding the extent to which these multiple targets and goals are linked across different sectors may help to integrate various sectors’ programmes and develop coherent policy across sectors to promote the SDG agenda more effectively [4,5].
Access to clean energy, water, proper sanitation and food is essential for well-being, poverty reduction and sustainable development [4,6,7]. It has been projected that the demand for freshwater will increase by 30%, energy by 50% and food by 40% until 2030 in comparison to the current demand due to cumulative effects of population growth and mobility, economic development, urbanization, cultural and technological changes and climate change [6,8,9,10]. Water is needed to enhance agricultural productivity and food production. The availability of electricity, and use of groundwater pumps for irrigating cultivated land has transformed agro-economies which, in turn, has improved food security in many developing countries. At the same time, dissemination of groundwater pumping practices threatens the depletion of water resources, aquifers and ventures [6]. The agriculture sector also needs energy from cultivation to harvesting, and for distribution of agriculture products [11]. Similarly, access to energy plays a vital role in providing clean water in many remote locations [12]. Water/sanitation, food and energy goals are interlinked. Thus, monitoring the nexus between these different sectors is a key development challenge [13].
Lack of proper understanding and accounting of trade-offs and synergies across different sectors has resulted in (i) incoherent policies; (ii) adverse impacts of development policies of one specific sector on the other; (iii) loss of opportunity for positive synergy effects; and (iv) delayed outcomes leading to sustainable development [14]. The term synergy is originally derived from the Greek word synergos, meaning to “work together” or, literally, to “co-operate”. In this way, synergy measurements are not analogous to conventional statistical correlation analyses. Synergy is very often associated with the famous cliché coined by Aristotle “The whole is greater than the sum of its parts”. This classical cliché is actually a rather narrow and even misleading characterization. In fact, synergy arises in many different forms. Sometimes, wholes are not greater than the sum of their parts, just different. This should be understood as negative synergies or trade-offs. In other words, a trade-off can be understood as an adverse effect, that is, when the achievement of one target is implemented in such a way that it imposes negative impacts or constraints to the achievement of another target [15].
Synergies and trade-offs among different variables have been discussed and analysed in the literature [4,14,16,17,18,19]. Weitz et al. [4] and Blanc [14] used qualitative methods of network analysis to identify and examine different types of interactions among sustainable development goals. Halsnæs and Garg [16] provided a conceptual framework relating the role of energy in development and potential synergies and trade-offs with climate change. Landuyt et al. [19] quantified the interaction among various ecosystem services using correlation coefficients, obtained through pairwise comparison of ecosystem service indicators. Hicks et al. [17] used blending of focus groups interaction and individual semi-structured questionnaires for evaluating synergies and trade-offs among ecosystem services being provided, capturing stakeholder’s preferences. However, most of these methods are qualitative in nature and hardly provide any quantitative basis for evaluation of synergies and trade-offs.
The quantitative synergy analysis developed by Luukkanen et al. [15] has emphasized an explorative approach. It clarifies whether there is positive or negative synergy between two variables. Contributing to on-going efforts to develop methods for evaluating synergies and trade-offs among the SDGs, our paper develops an analytical framework using both qualitative approaches as proposed in Weitz et al. [4] and Blanc [14], and quantitative approaches as proposed by Luukkanen et al. [15]. The strength of this analytical framework is the integration and interpretation of qualitative analysis of the linkages among the variables complemented with quantitative analysis.
The analytical framework developed here is applied to evaluate synergies and trade-offs among goals for energy access (SDG7), clean water and sanitation access (SDG6), food security and sustainable agriculture (SDG2) and poverty alleviation (SDG1) from developing countries’ point of view. Although the analyses of synergies and trade-off can go beyond these four SDGs, we have limited our analysis within these specific SDGs to get more deeper understanding on their linkages which have been identified as priority areas among developing countries from the outcome of the Rio + 20 [4]. The framework and the approach described in this research could be applied with the extended boundary including more SDGs. The paper demonstrates reflective sustainability analyses in terms of synergy among the SDGs in six developing countries: Bangladesh, Nepal, Sri Lanka from Southern Asia and, Ethiopia, Ghana and Rwanda from Sub- Saharan Africa. Figure 1 shows the examined SDGs under this study.
The paper is organized as follows. After this introductory section, the methodology adopted in the study and data sources used for the analysis are discussed in Section 2. Section 3 briefly discusses the sustainable development goals 1, 2, 6 and 7, and their associated targets and indicators suggested for monitoring progress. Conceptual linkages among development paths to reach these targets are analysed, and the SDGs are then presented as a network of targets in Section 4. Quantitative analysis to evaluate the potential synergies and trade-offs among the various development processes are presented in Section 5, and conclusions are drawn in the Section 6.

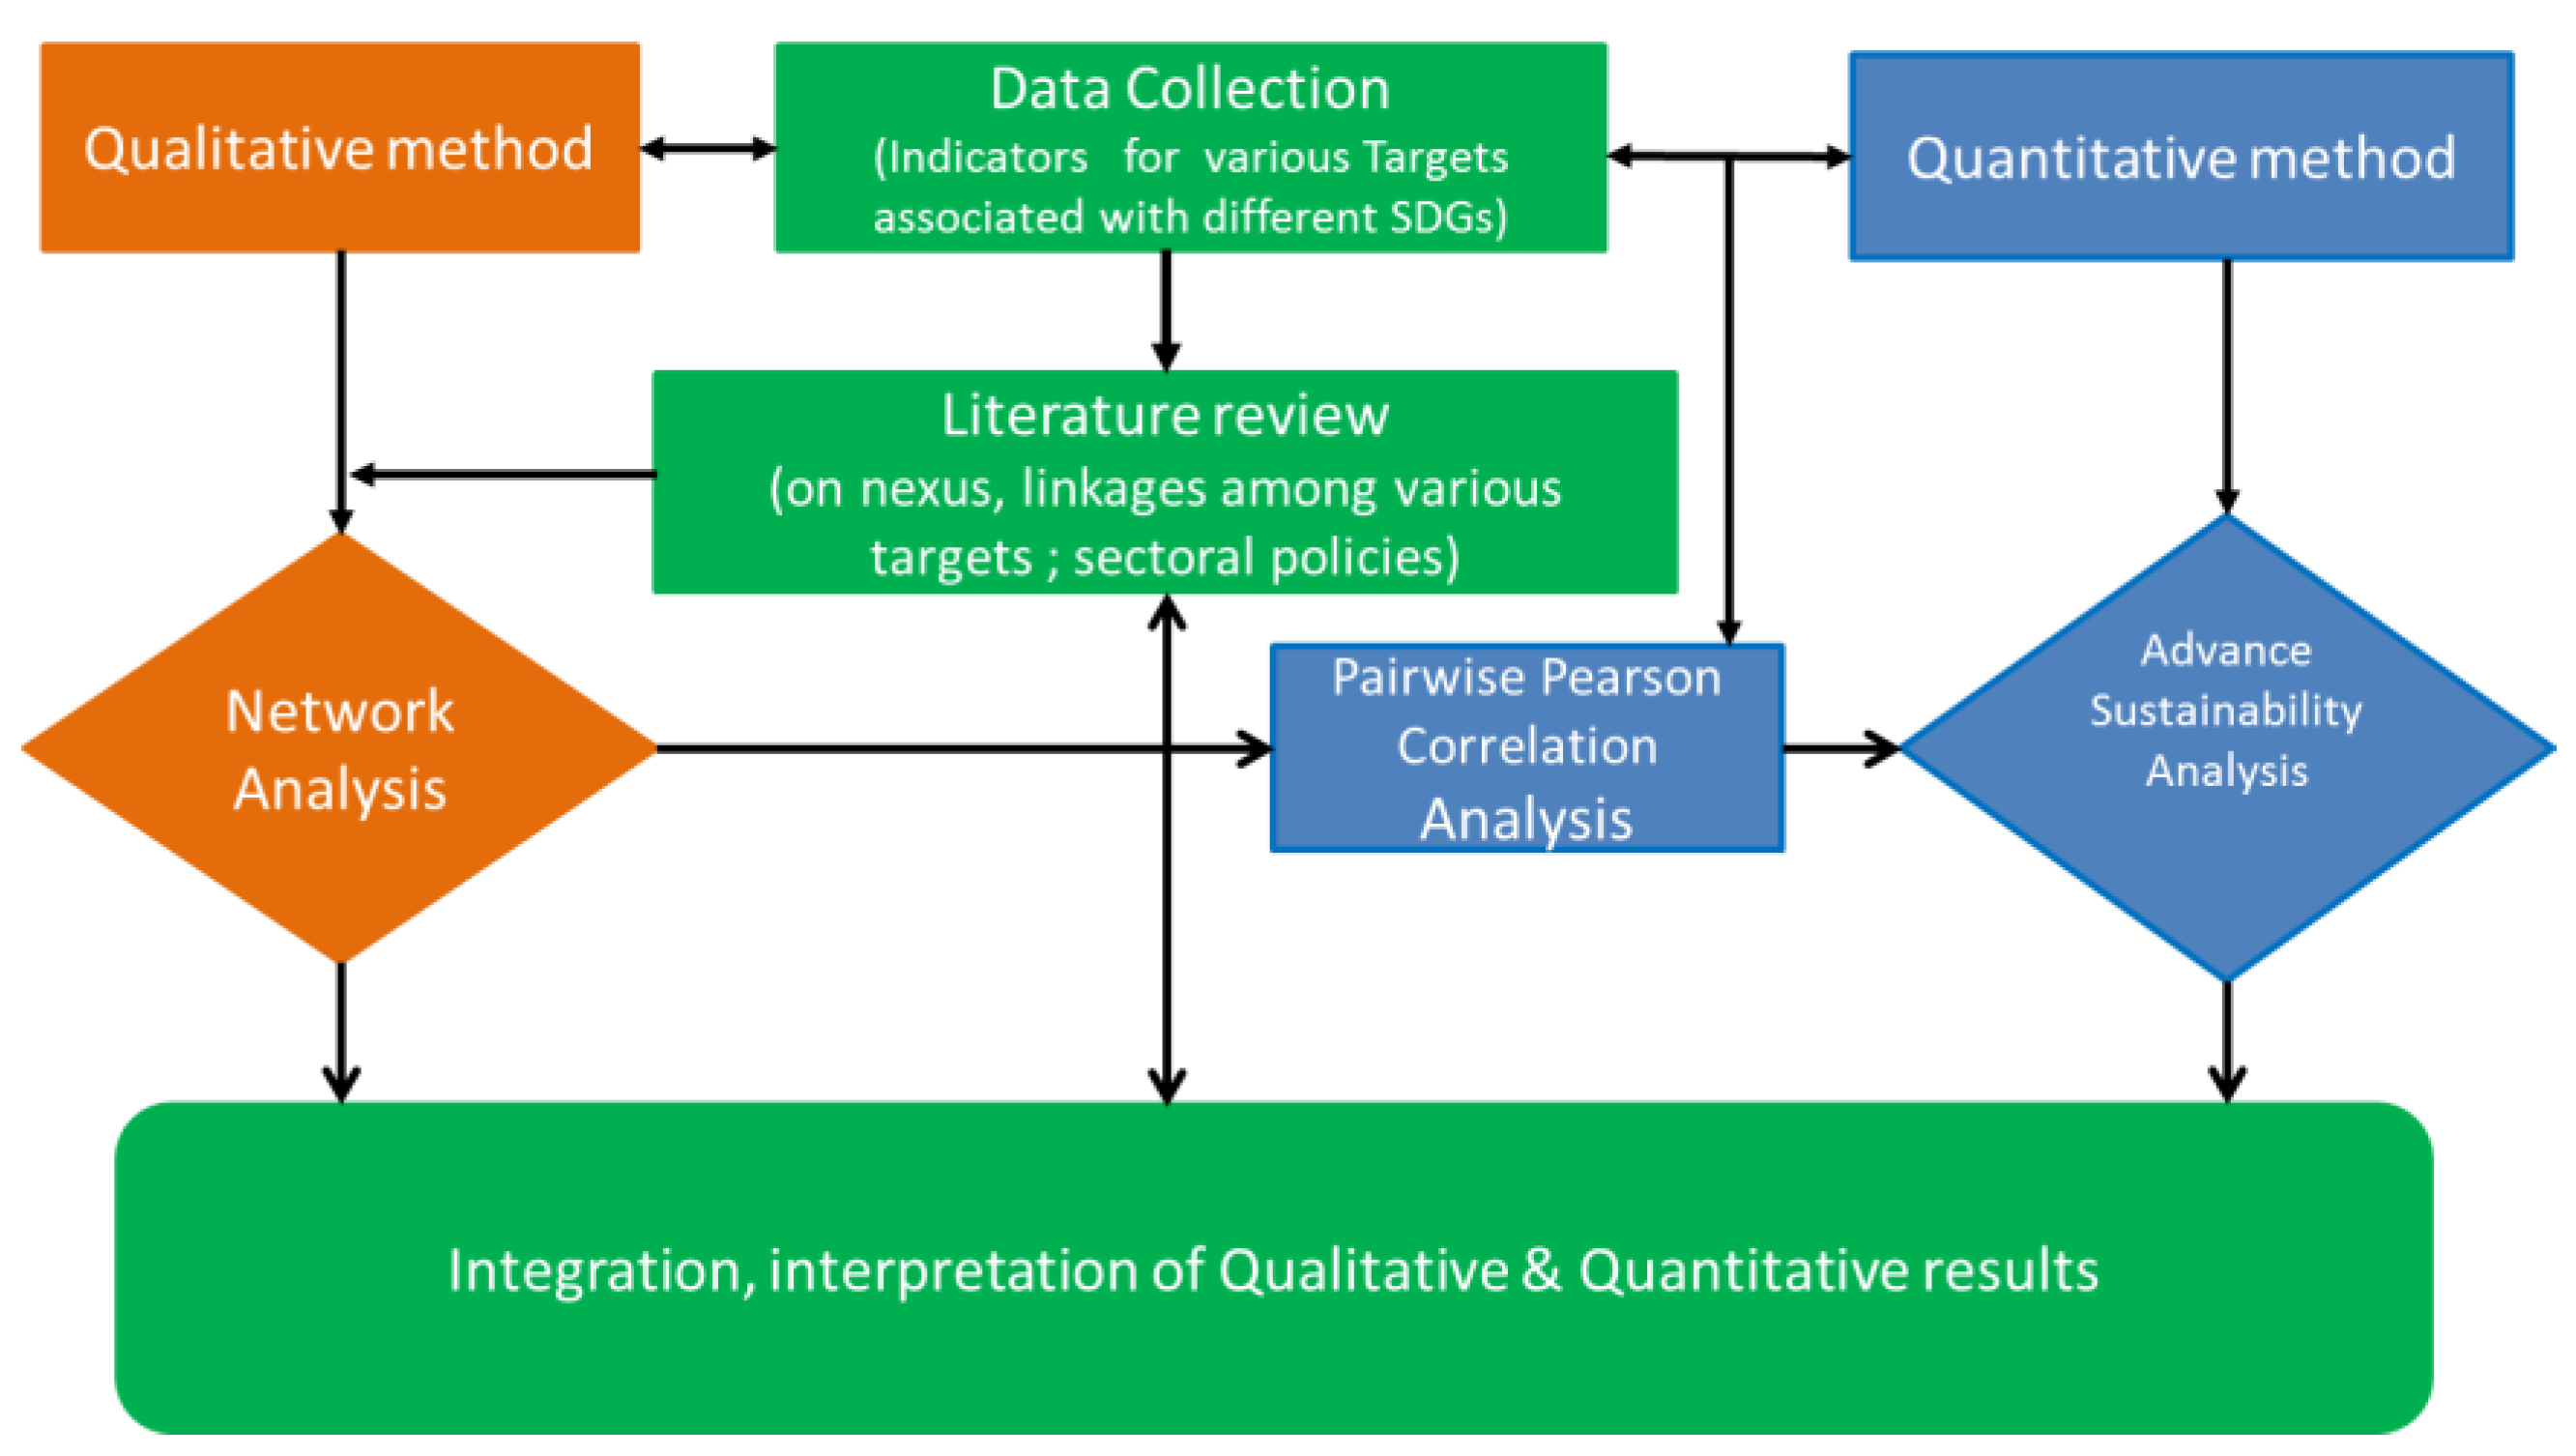
2. Methodology Framework and Data Sources

This research is built upon an analytical framework using both qualitative and quantitative methods (see Figure 2), overcoming the limitation of using the methods in isolation. The methodological framework is explained in more detail in Section 2.1 and Section 2.2.

2.1. Network Analysis

Network analysis has been applied to examine linkages among the targets associated with four selected SDGs at the conceptual and theoretical level. The method adopted in this paper is an extension of the approach proposed by Weitz et al. [4] and Blanc [14]. Nature of interactions between the processes leading towards these targets could be interdependent (i.e., one process not relying on the other) or reinforcing (i.e., the achievement of one helps to reach the target of the others). Such interaction represents synergy among the development processes leading to the achievement of targets. On the other hand, some actions to reach targets may impose constraints on actions to reach other targets indicating a trade-off situation [4]. Indicators measuring these targets have been identified and used for analytical purposes.
Network analysis is a qualitative-method based on reflexive iteration on the analysis of data, evidences from literature and interpretation according to theoretical frameworks, subjective perspectives, intuitive field understandings of the authors and some internal reviews. The process is reflexive and progressive [20,21]. The identified linkages have been further validated using Pearson correlation coefficients, and obtained through pairwise comparison of those indicators with their statistical significance test for which data were available.

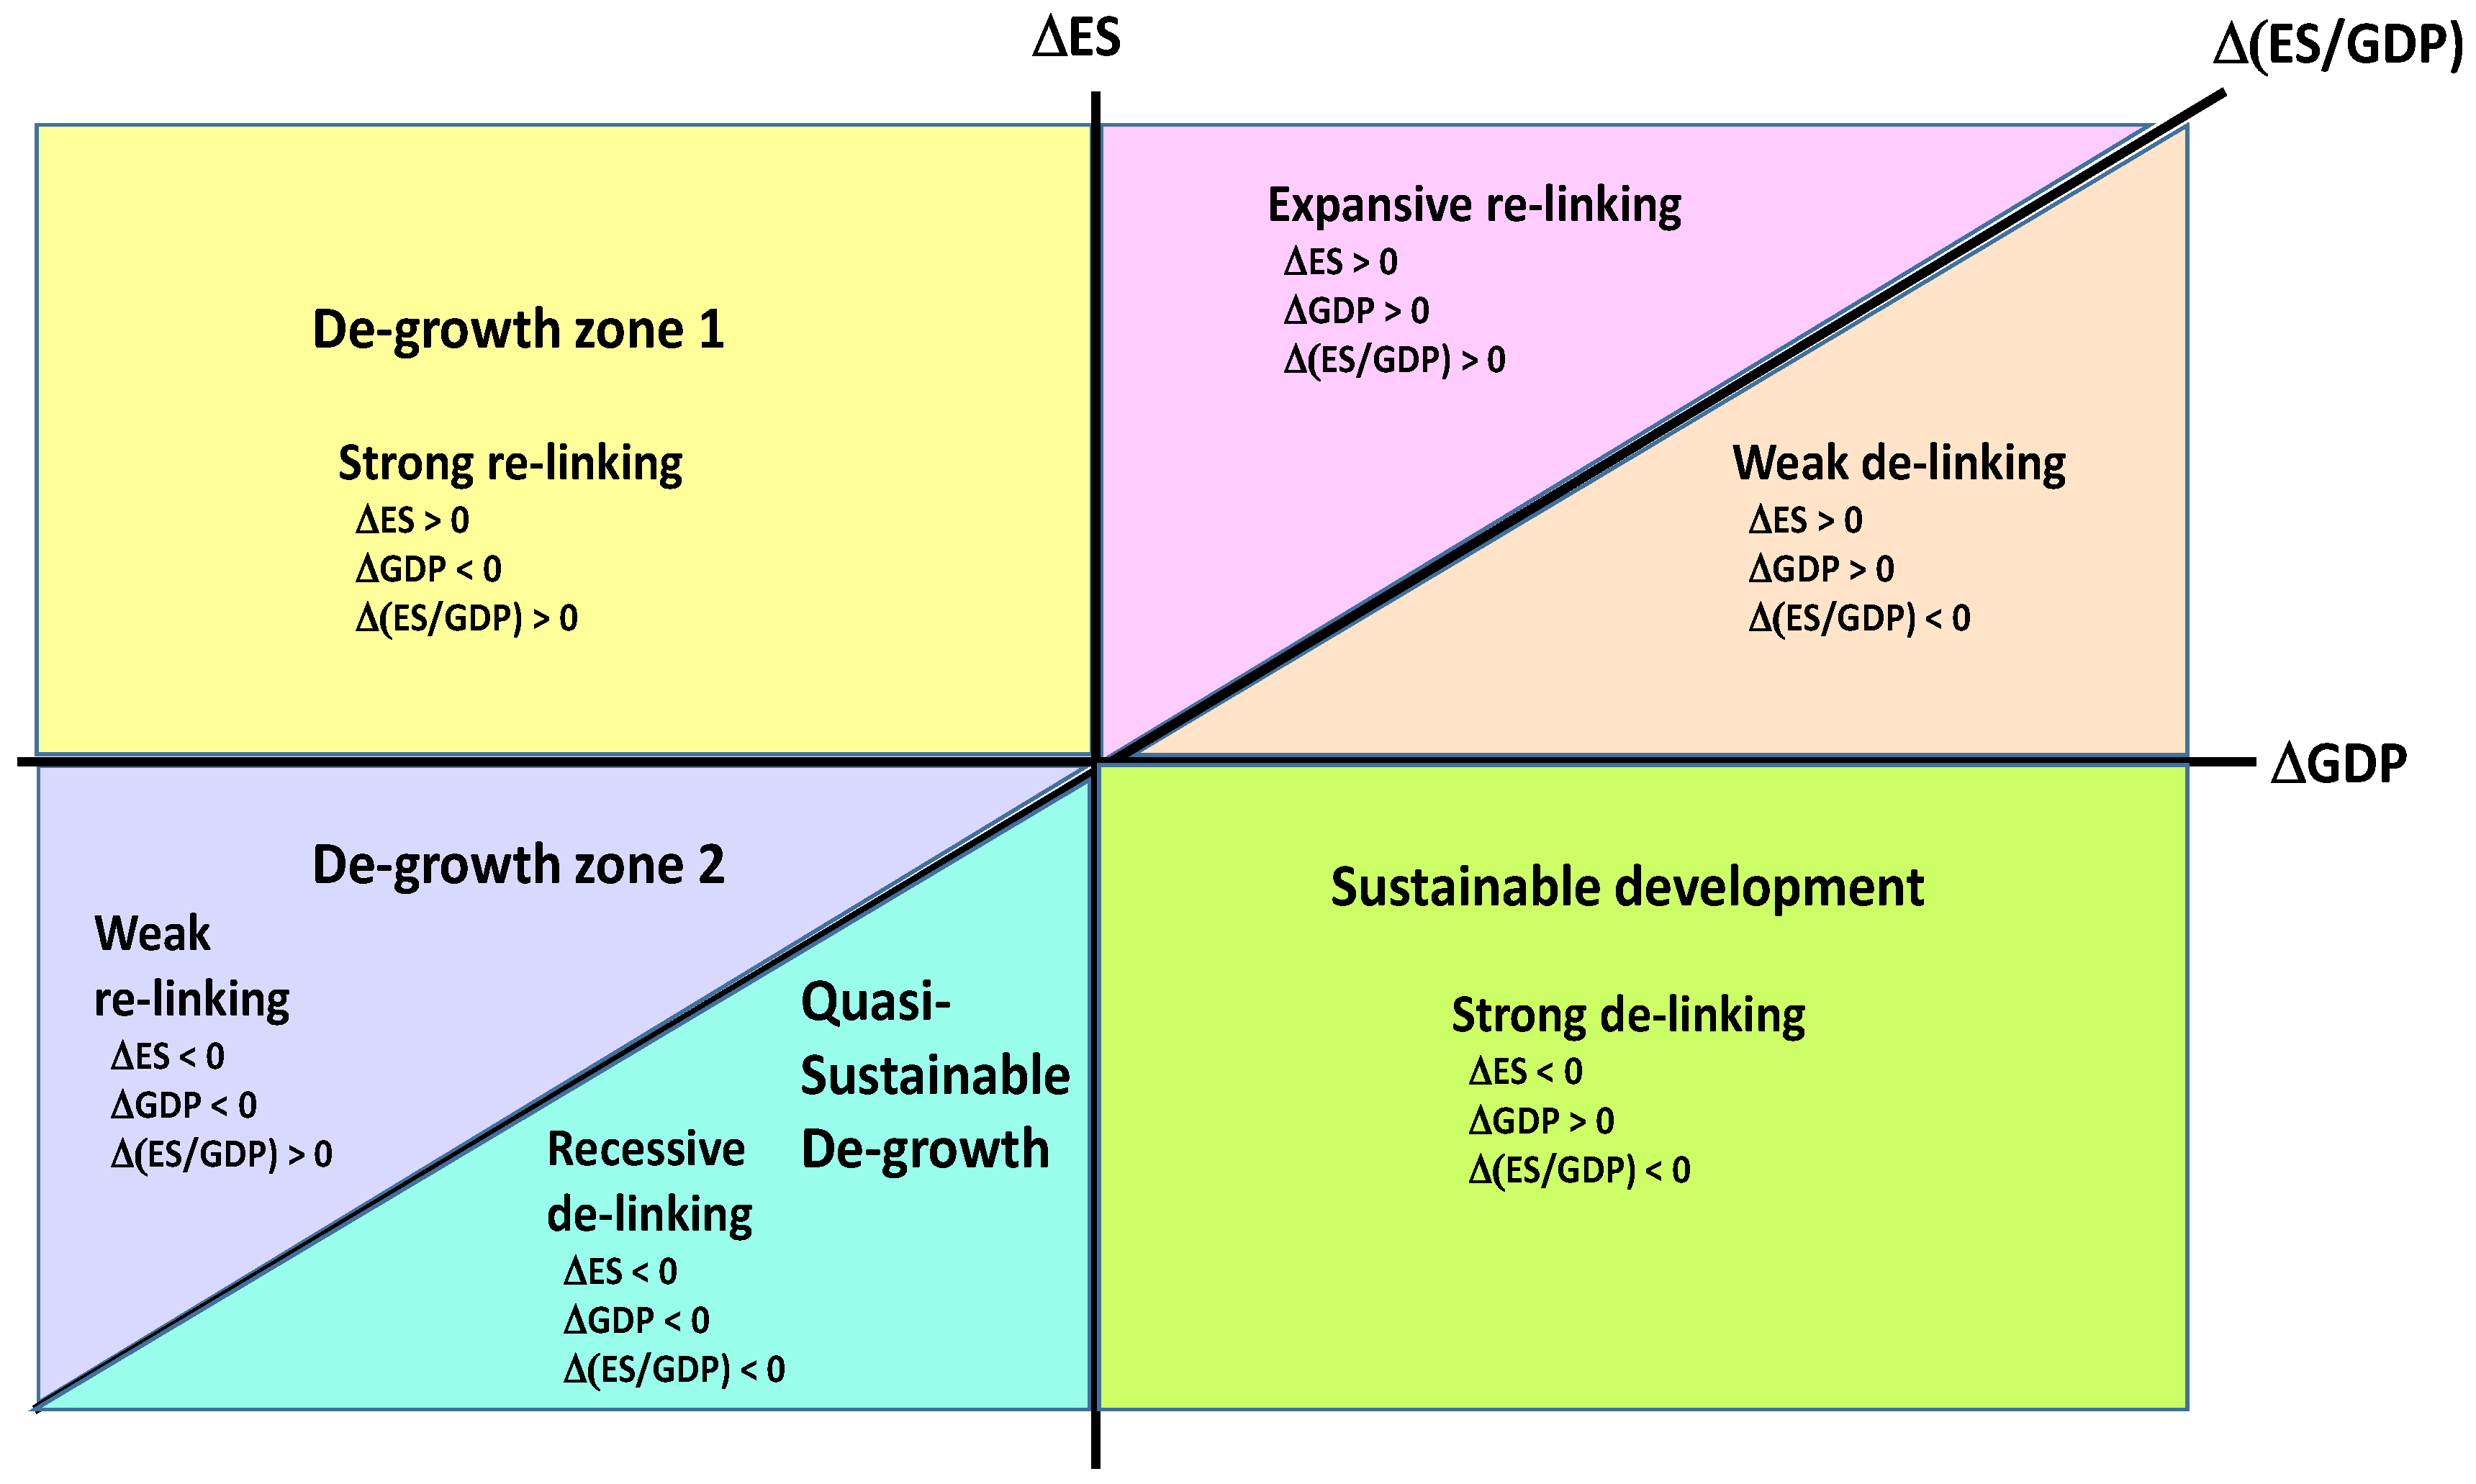
2.2. Advanced Sustainability Analysis

Quantitative evaluation of synergy and trade-off can be made using the Advanced Sustainability Analysis (ASA) approach developed under the European framework programmes FP6 and FP7. This approach has been used in quantitative evaluations of synergy and trade-off in several studies [15,22,23,24,25,26,27,28]. A generic evaluation framework of sustainable development based on the ASA approach is presented in Figure 3.
The framework defines the different areas related to sustainable development in relation to economic development (GDP), environmental stress (ES) and environmental intensity of economic development (ES/GDP). The ASA framework helps in analysing complex sustainable development questions in an integrated manner (see, e.g., Kaivo-oja et al. [29]).
The operationalization of the policy targets and instruments to reach sustainability goals is a demanding challenge. In addition, the analysis of relationships (synergy or trade-off) among SDGs’ targets is a challenging scientific question. Synergy analysis using the ASA approach can provide useful insight to relational analysis. Synergy is basically statistical interaction among two independent variables, say Yi and Yj, and conventionally such interactions are represented as the product of those variables, i.e., Yi × Yj [15,30].
As defined earlier, synergy between two factors exists when their combined impact is greater than the sum of their individual effect. Mathematically this can be expressed as:
z = Ax + By + Cxy + D
where x, y and z are variables and A, B, C and D are coefficients that determine the dependency of “z” on inputs x and y. The synergy or interaction among the variables x and y is determined by the component “Cxy”. If we observe change in these variables (x and y) between two points, say P (x0,y0) to Q (x1,y1), as shown in the Figure 4, we can determine the change in the area (Δz) to be represented by:
Δz = AΔx + BΔy + CΔxΔy
As mentioned previously, the synergy of the inputs is determined by the third component i.e., ΔxΔy which is represented by the shaded area in Figure 4. The synergy can be either positive or negative. If the changes in y with respect to the positive changes in x are also positive, then ΔxΔy is positive, indicating Synergy. If the changes in y are negative, then ΔxΔy is negative, indicating a Trade-off situation. If no change is observed in y with changes performed in x, the change in one variable does not have impact on the other variable—in other words, these variables are De-linked [15].
The evaluation of synergy/trade-off proposed in this paper indicates possible (potential) causality but does not infer a causal relationship between the variables. The potential synergy can be measured as the ratio of the area of the real change (ΔxΔy) to the area of the maximum change (ΔxΔy1), where Δx = Δy1. In other words, the potential synergy can be expressed as the slope of the line AB i.e., as the ratio of Δy/Δx [15].
Maximum synergy can be obtained when relative changes in Δx and Δy are equal. In the case the change in y, i.e., Δy, is larger than changes in x, i.e., Δx, the quotient must be inverted to estimate potential synergy ratio. Therefore, potential synergy/trade-off between two variables can be measured between −1 and +1. Negative sign indicates trade-off between two variables. Datasets are normalized to the selected base year in these calculations.
We examine synergy and trade-off situations among the goals and associated targets between 1990 and 2012. Availability of datasets and their authenticity is a major challenge in most developing countries [31,32]. Since data for all indicators were not available for each year, we have collected the data for the specific years (1990, 1995, 2000, 2005, 2010 and 2012) to capture the progress made over the last two decades.
In this study, we sourced data from various national official and ministerial publications, living standard surveys, reports and data banks of international organizations, viz. Asian Development Bank, World Bank, International Energy Agency, United Nations Food and Agriculture organization and World Health Organization/UNICEF. Data on indicators related with energy targets were sourced from World Bank database [33], IEA [34] and ADB [35]. Data related with poverty indicators were sourced from UN database [36], Bangladesh-HIES [37], MOFED-Ethiopia [38], and GLSS-Ghana [39]. Data related to food and agriculture sectors were sourced from FAO Database [40], and water and sanitation indicators were sourced from WHO [41].

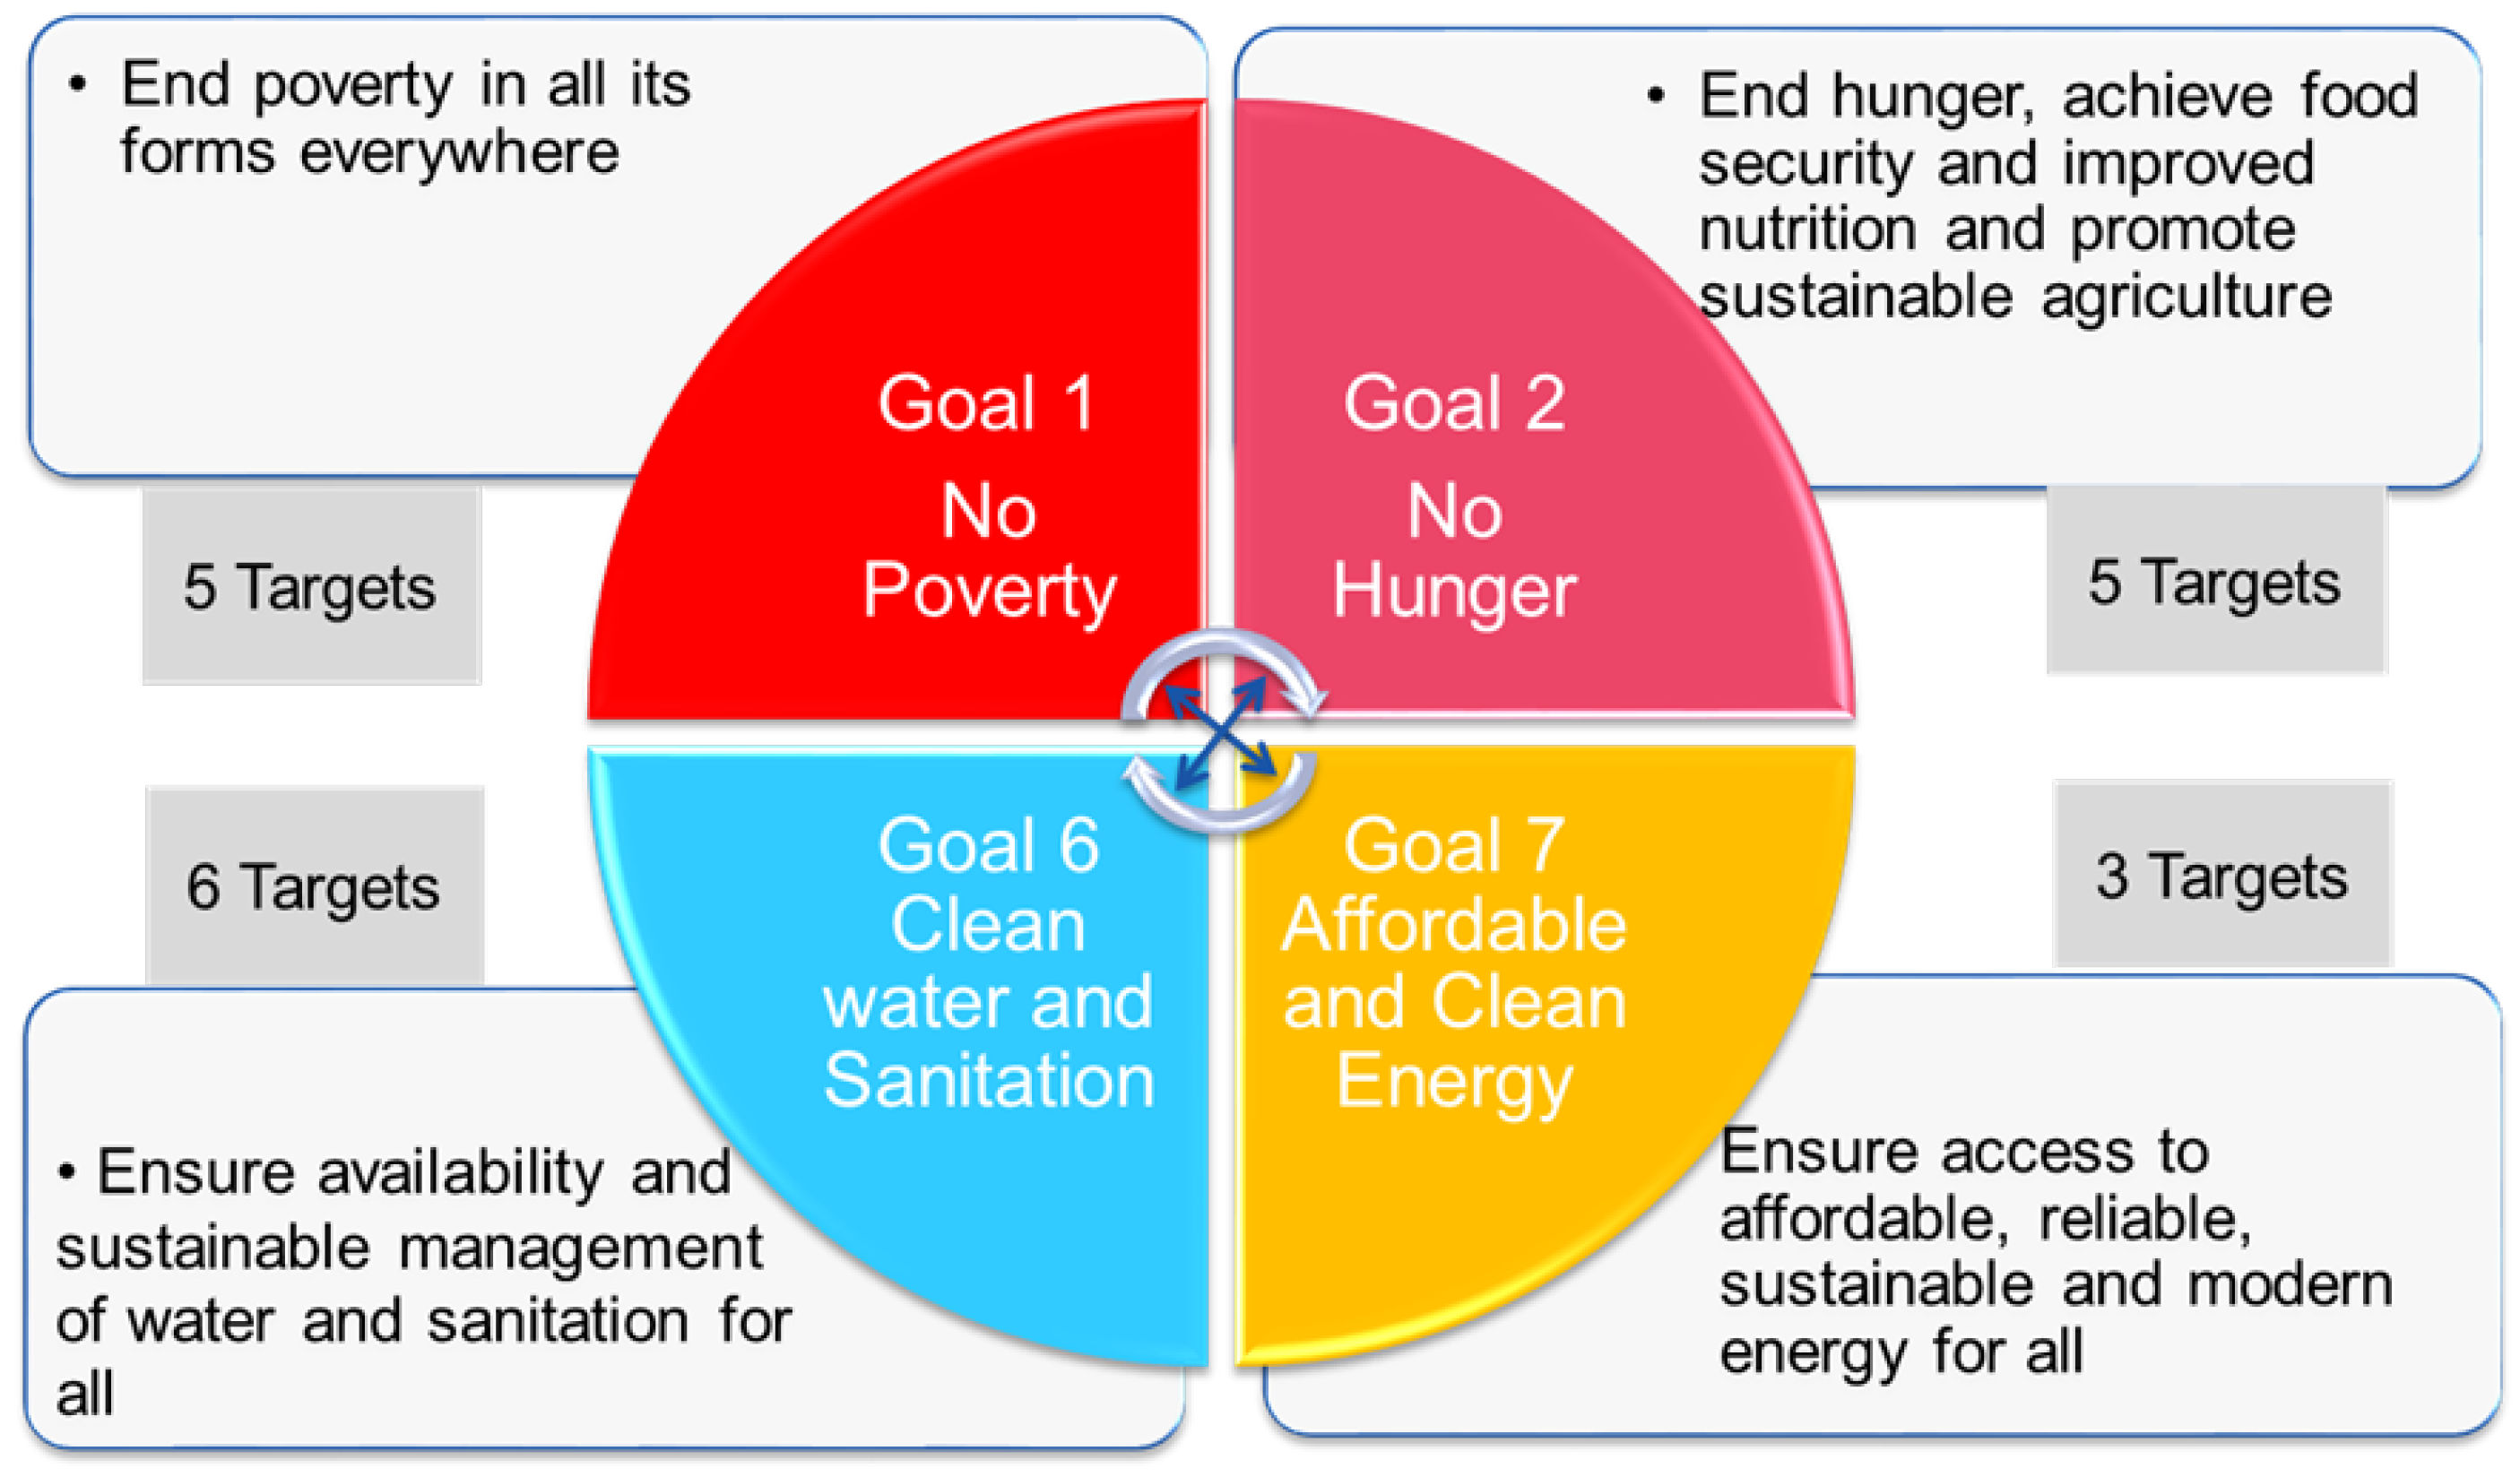
3. Targets and Indicators to Monitor SDGs

Sustainable Development Goals address universal goals and demand the participation of both developing and developed countries to ensure long-term humankind welfare. Table 1 presents the four goals addressed (1, 2, 6 and 7) with some specific associated targets and respective indicators to monitor their achievement.
SDG1 aims at alleviating poverty in all its forms. Definitions of poverty may vary from country to country. However, poverty in all forms refers to various poverty dimensions including nutrition, education and health not least decent work, freedom from violence etc. [42]. In this aspect, goal 1 is a cross cutting goal which is also addressed by targets in other SDGs. Targets 1.1 and 1.2 focus on income poverty. Targets 1.3 to 1.5 focus on reducing vulnerability by introducing social protection systems. The most common method used to measure income poverty is level of income or expenditure, whereby a minimum value of income is set to identify the poverty line (global or national).
SDG2 aims at ending hunger, achieve food security, improve nutrition and promote sustainable agriculture. Targets 2.1 and 2.2 directly address food security and nutrition issues. Whereas 2.3 to 2.5 aim at improving agriculture practices. The latter is directly linked to the goals of ending hunger and achieving food and nutrition security [43,44].
SDG6 is basically an expansion of MDG7, focusing on access to water and basic sanitation, and ensuring availability and sustainable management of water and sanitation for all. It comes with the ambitious target of providing universal access to safe drinking water (Target 6.1) and sanitation and hygiene (Target 6.2). The other targets of SDG6, from 6.3 to 6.6, are associated with various dimensions of sustainable water resources management.
SDG7 aims at ensuring access to affordable, reliable, sustainable, and modern energy for all. This goal enables other sustainable development goals. Among the three targets associated with this goal, 7.1 aims at providing universal access to energy by 2030. Target 7.2 emphasizes enhancement in the share of renewable energy sources in national energy mixes, but does not quantify. Target 7.3 appeals for acceleration in improving energy efficiency.

4. Analysing Linkages among SDGs

Using network analysis, the four SDGs have been analysed observing how the targets associated with each one of them impact targets of other SDGs (Section 4.1, Section 4.2, Section 4.3 and Section 4.4). Based on these analyses, a network of various targets within the four SDGs was plotted illustrating the linkages among key targets related to economic security, energy security, water security and food security (see Section 4.5).

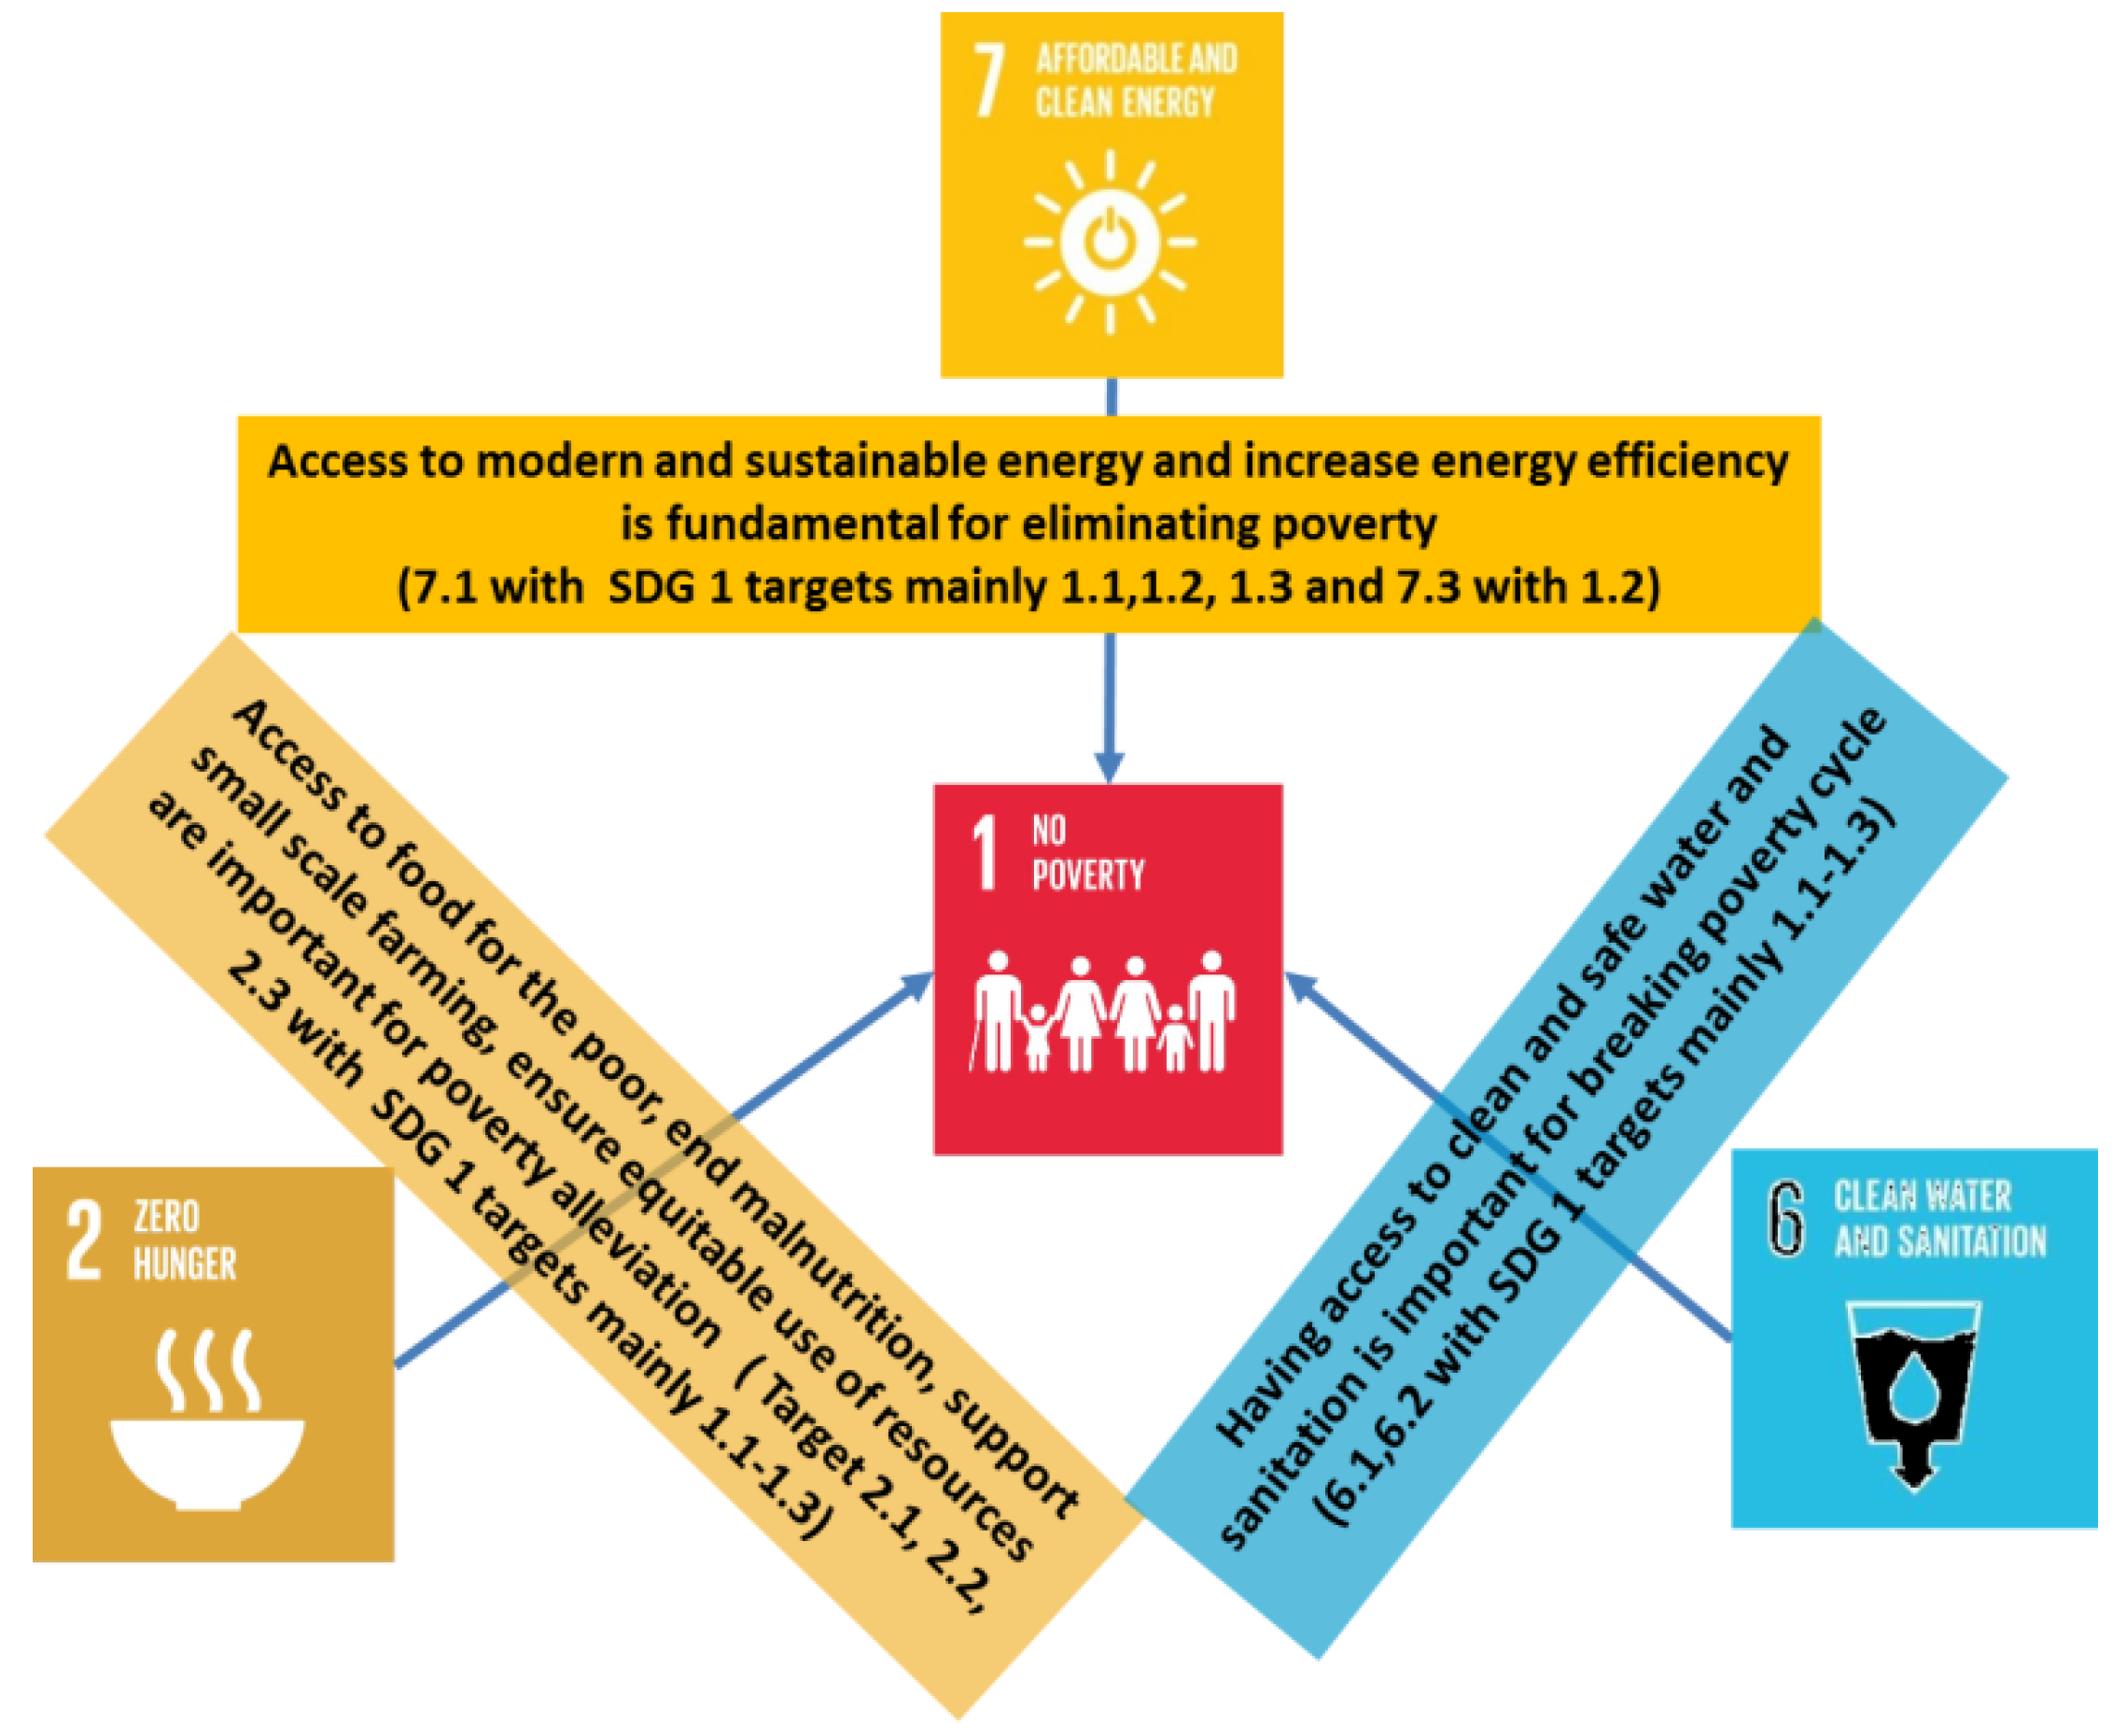
4.1. SDG1 in Focus—Poverty Eradication

Most of the world’s extreme poor are deprived of access to electricity, clean water and sanitation and rely on traditional farming for their income. Alleviating poverty in all its forms everywhere (SDG1) demands universal and inclusive access to basic resources and access to social protection systems addressing inequalities among social groups [46]. Ending poverty can only be achieved if progress on the targets associated with access to clean energy (SDG7), access to clean water and sanitation (SDG6) and food security and nutrition (SDG2) are achieved [43,46]. Since the indicators for monitoring social protection systems are still not well defined, we have not considered aspects of social protection systems in this paper.
Figure 5 illustrates how the targets associated with SDG1 are conceptually linked with the targets associated with the other three SDGs considered in the analysis. Access to modern and sustainable energy and increased energy efficiency are fundamental for eliminating poverty [43]. Some studies have examined the causal relationship between electrification and human wellbeing [47,48,49,50] revealing evidence of the positive relationship between access to electricity (T7.1) and household income (T1.1 and T1.3) in Bangladesh, Nepal, Brazilian Amazon and Rwanda, respectively. Improved efficiency in the use of biomass (T7.3) in developing countries could help to meet a growing energy demand with renewable sources, reducing energy poverty (T1.1 and T1.2) [51].
The targets associated with SDG 6 i.e., access to clean and safe water and sanitation (T6.1 and T6.2) are important for breaking the poverty cycle (T1.1 and T1.2) [43,52]. The Human Development Report [53] argues that limited access to clean water is not simply an issue of water crisis or scarcity, but also a result of poverty, power concentration and inequality. Open defecation is a distinct indicator of extreme poverty which persists in many rural parts of South Asia and Sub-Saharan Africa [52]. Often, the access to clean water and sanitation is viewed as “consummative and income dependent” and resulting advantages are only projected in terms of health and social benefits. However, after examining the economic gains of the reallocation of time formerly dedicated to water collection, and the avoided health risks that followed in a case study in India, Pories [54] argues that access to clean water and sanitation serves as income enabler. The same study highlights that the micro-loans provided to the poor in 10 countries including Bangladesh, Ghana and Ethiopia for access to water and sanitation had an average repayment rate of 99%, demonstrating the linkages between the access of water and sanitation and poverty alleviation.
The targets associated with SDG2, viz. increasing access to sufficient food for the poor (food security), ending malnutrition, improving agricultural productivity, and boosting up the economy of small scale farmers (T2.1, T2.2, and T2.3), are crucial for poverty alleviation (T1.1, T1.2, and T1.3) [4,43,55,56,57]. Food security and poverty reduction go hand in hand. The food produced by many small-scale farmers and poor households may not be sufficient to meet their own demand, neither in quantitative nor in nutritional terms. These households are very vulnerable to food price rises, which can also push them into long-term poverty traps [58]. A study by the Asian Development Bank has shown that change in the food price has offsetting effect on poverty reduction. For example, in recent years, poverty due to higher food prices increased annually by 7.8% in Bangladesh, 6.2% in Nepal, and 15.6% in Sri Lanka. Meanwhile, a rise in the income level has a positive impact on poverty reduction, apparently stronger than the impact of increased food price on poverty. Conceição et al. [59] highlighted that increase in agriculture productivity in Sub-Saharan Africa region can unleash the virtuous cycle of poverty reduction by increasing food security and generating farm employment opportunities while also avoiding the depletion of land and water resources.

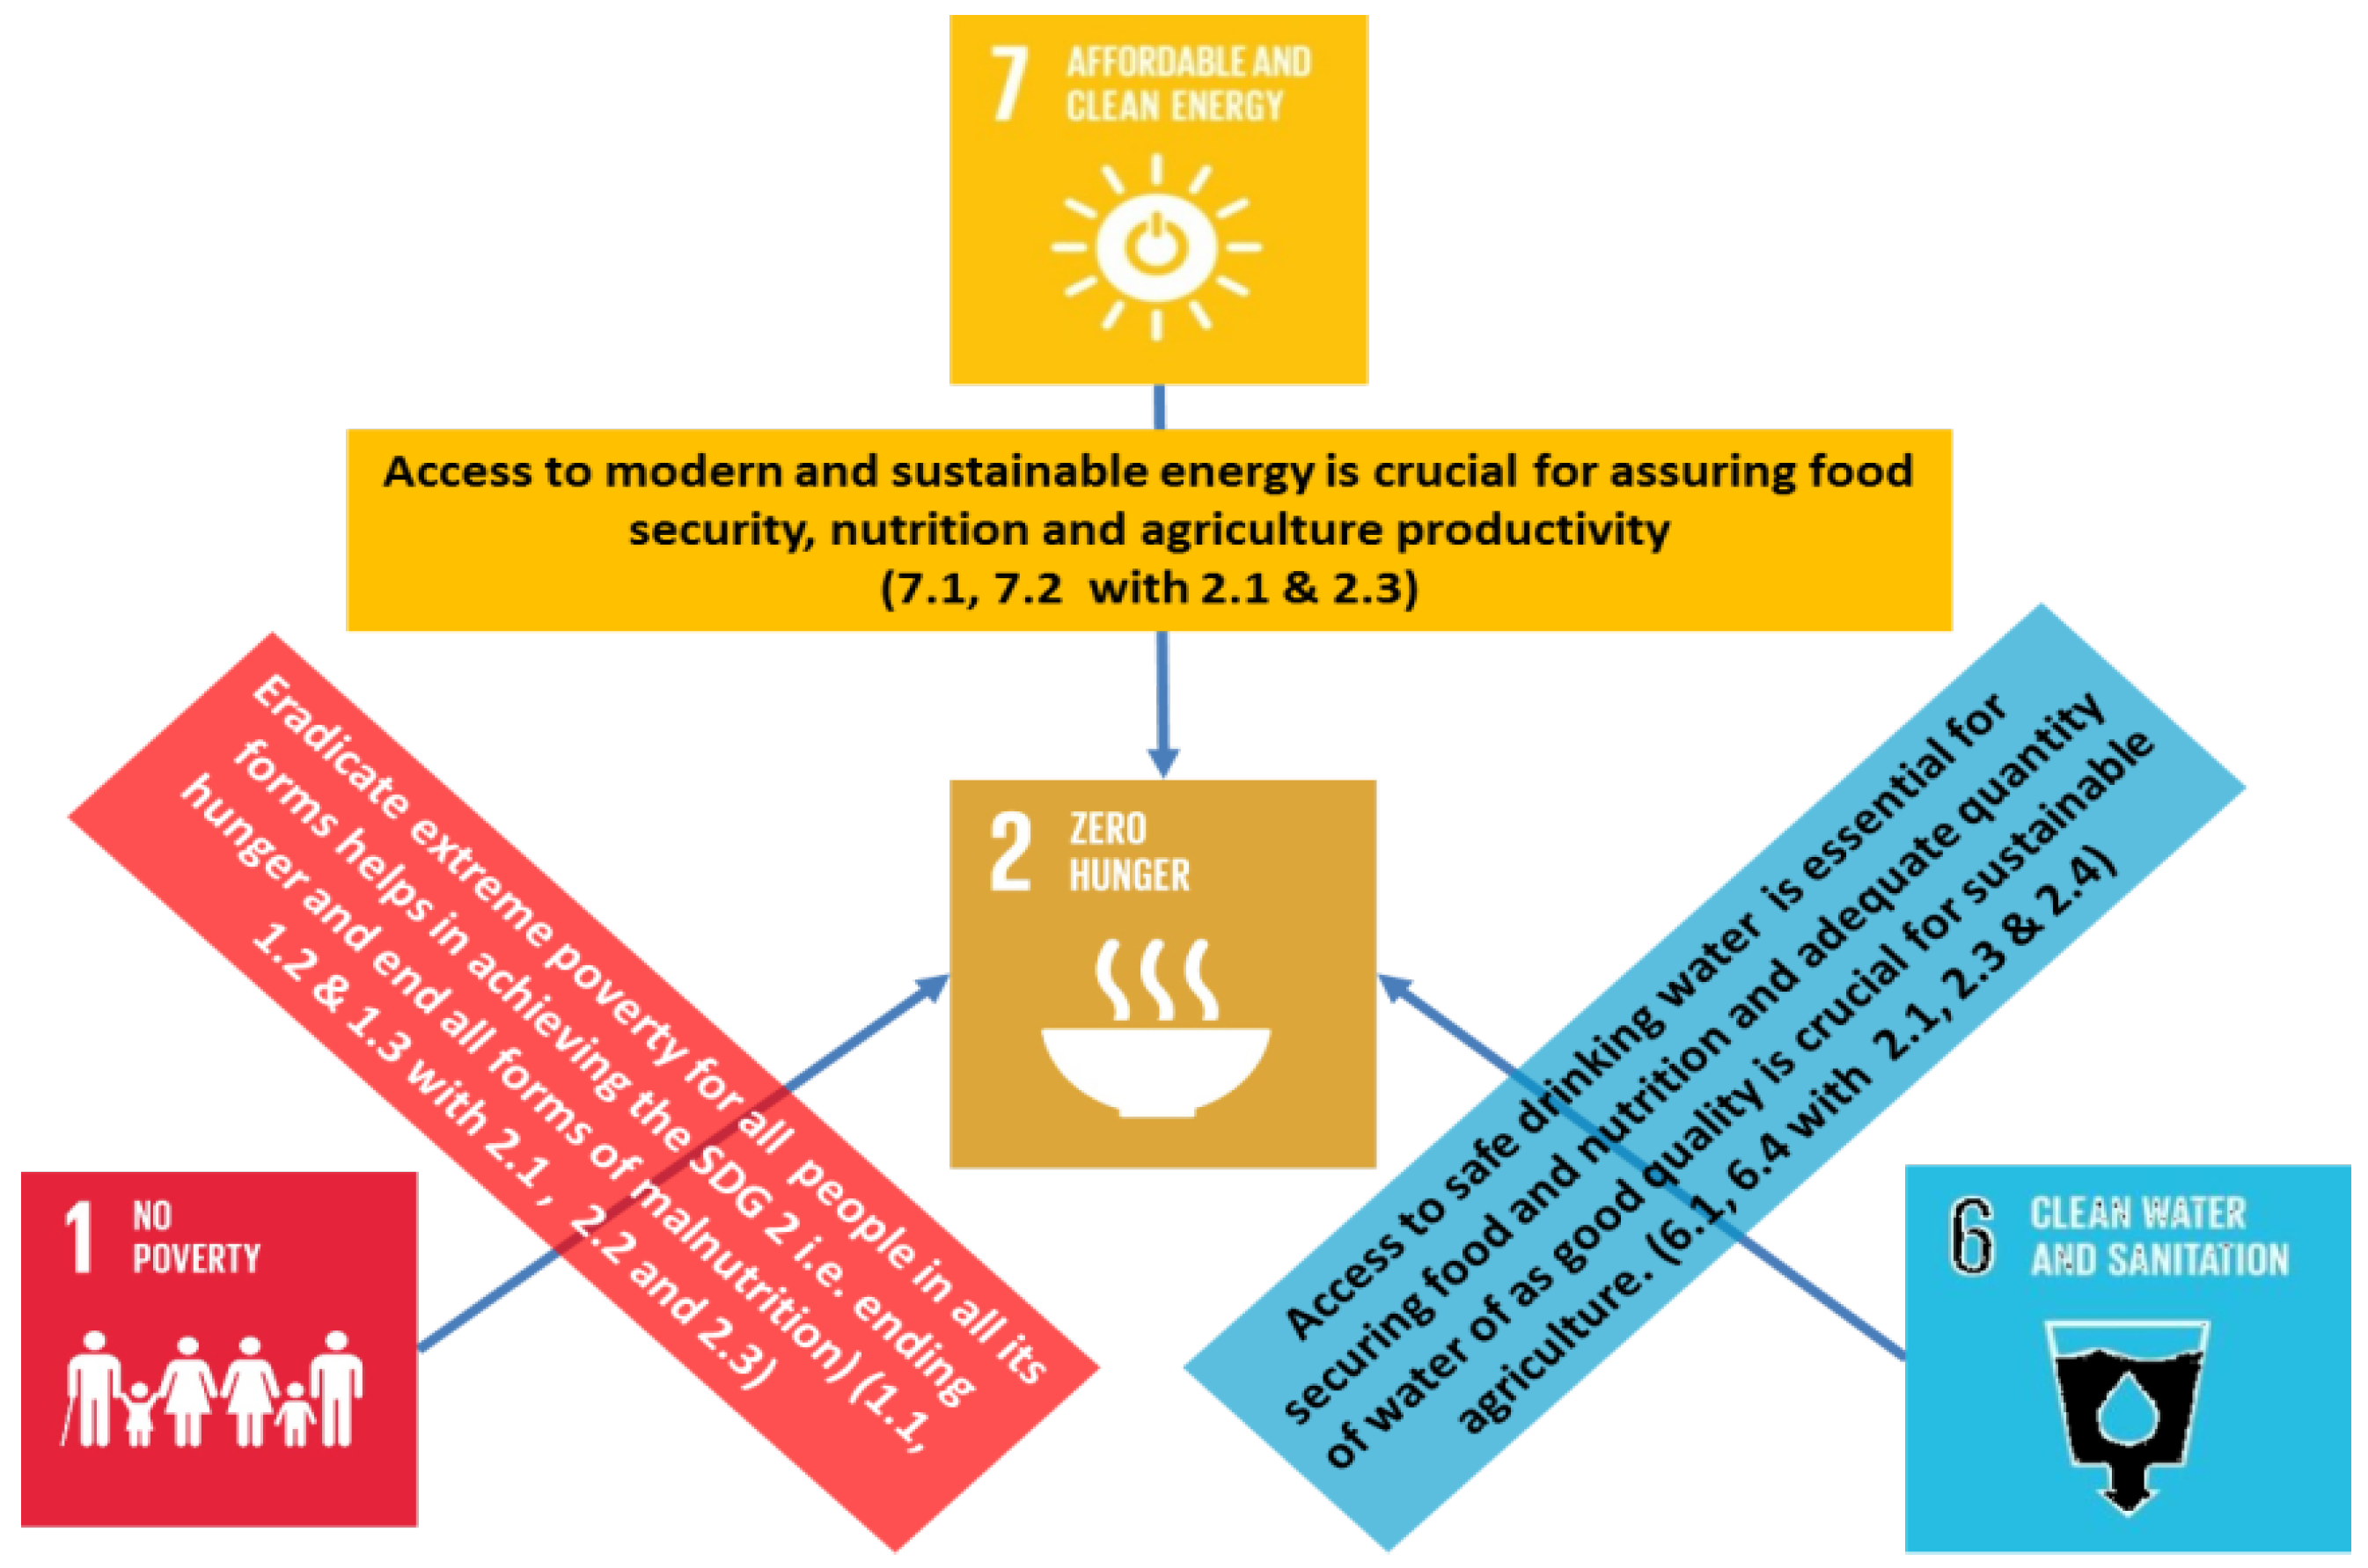
4.2. SDG2 in Focus—Ending Hunger and Guaranteeing Food Security

SDG2 addresses food insecurity and malnutrition while promoting sustainable agriculture to achieve zero hunger and sustainable development. Per capita agricultural land has decreased sharply over the years due to high population growth and industrial development. This threatens food security in both Southern Asia and Sub-Saharan Africa region [60]. Between 1990 and 2012, per capita arable land fell from 0.089 to 0.049 ha in Bangladesh, 0.1124 to 0.08 ha in Nepal, 0.224 to 0.166 ha in Ethiopia and 0.121 to 0.106 in Rwanda. The risk of food insecurity and malnutrition (T2.1 and T2.2) could be minimized by (i) enhancing agricultural productivity (T2.3) with modern agriculture practices and (ii) bringing additional arable area under irrigation, which will again increase yields. However, the percentage of arable land supplied with irrigation has not improved so much in the Sub-Saharan African countries in comparison with South Asian countries in the period between 1990 and 2012. The arable land served by irrigation has increased from 0.2% to 0.7% in Ghana, remained approximately at 0.8% in Rwanda, and decreased from 2.9% to 1.9% in Ethiopia. In the case of South Asian countries, it went up from 32.8% to 69.8% in Bangladesh, and from 37% to 62.7% in Nepal [40]. The staple crops in these two countries are rice and wheat which demand lots of water. Therefore, expansion of irrigated land has been quite important [60].
Similarly, the target associated with SDG6, viz. access to safe drinking water and sanitation and hygiene (T6.1 and T6.2), is essential for securing food and nutrition (T2.1 and T2.2) [4,43,44]. However, the historical trend shows that water is becoming a scarce commodity. The available total renewable water resource per capita has decreased from 1008 to 676 m3/capita/year in Bangladesh; 10,686 to 7207 m3/capita/year in Nepal, and 3122 to 2585 m3/capita/year in Sri Lanka in the period of 1990 to 2012. Whereas in the case of Sub-Saharan Africa, it has decreased from 2004 to 1323 m3/capita/year in Ethiopia, 2103 to 1186 m3/capita/year in Ghana, and 1412 to 878 m3/capita/year in Rwanda in the same period [61]. Proper planning is required to guarantee water for both drinking purpose and agriculture (T6.1 and T6.4).
Access to clean and affordable energy (SDG7, T.7.1) is a key enabler in achieving food security and better nutrition (SDG2, T2.1 and T2.2). The use of energy in agriculture has increased significantly in Bangladesh (from 2.9 to 10 Kgoeq/capita/year) and in Nepal (from 1.7 to 4.4 Kgoeq/capita/year) from 1990 to 2010. This could also be related with the increment in the demand for energy for water pumping. Meanwhile, the per capita energy uses in the agriculture sector over the same period has not changed so much in the case of in Sri Lanka and Ghana [62]. Energy prices influence food prices and therefore, types of energy uses may also impact the food security and nutrition. Minimizing the dependencies of agriculture sector on fossil fuel by providing access to local renewable energy resources (SDG7, T7.2) could help to improve food security and decrease environmental impacts.
Eradicating extreme poverty for all people in all its forms (SDG1, T1.1 and T1.2) helps in achieving universal targets associated with SDG2 i.e., ending hunger and all forms of malnutrition (T2.1 and T2.2) [42,63]. These linkages are bilateral. The linkages of SDG2 with the targets associated with other SDGs 1, 6 and 7 are illustrated in Figure 6.

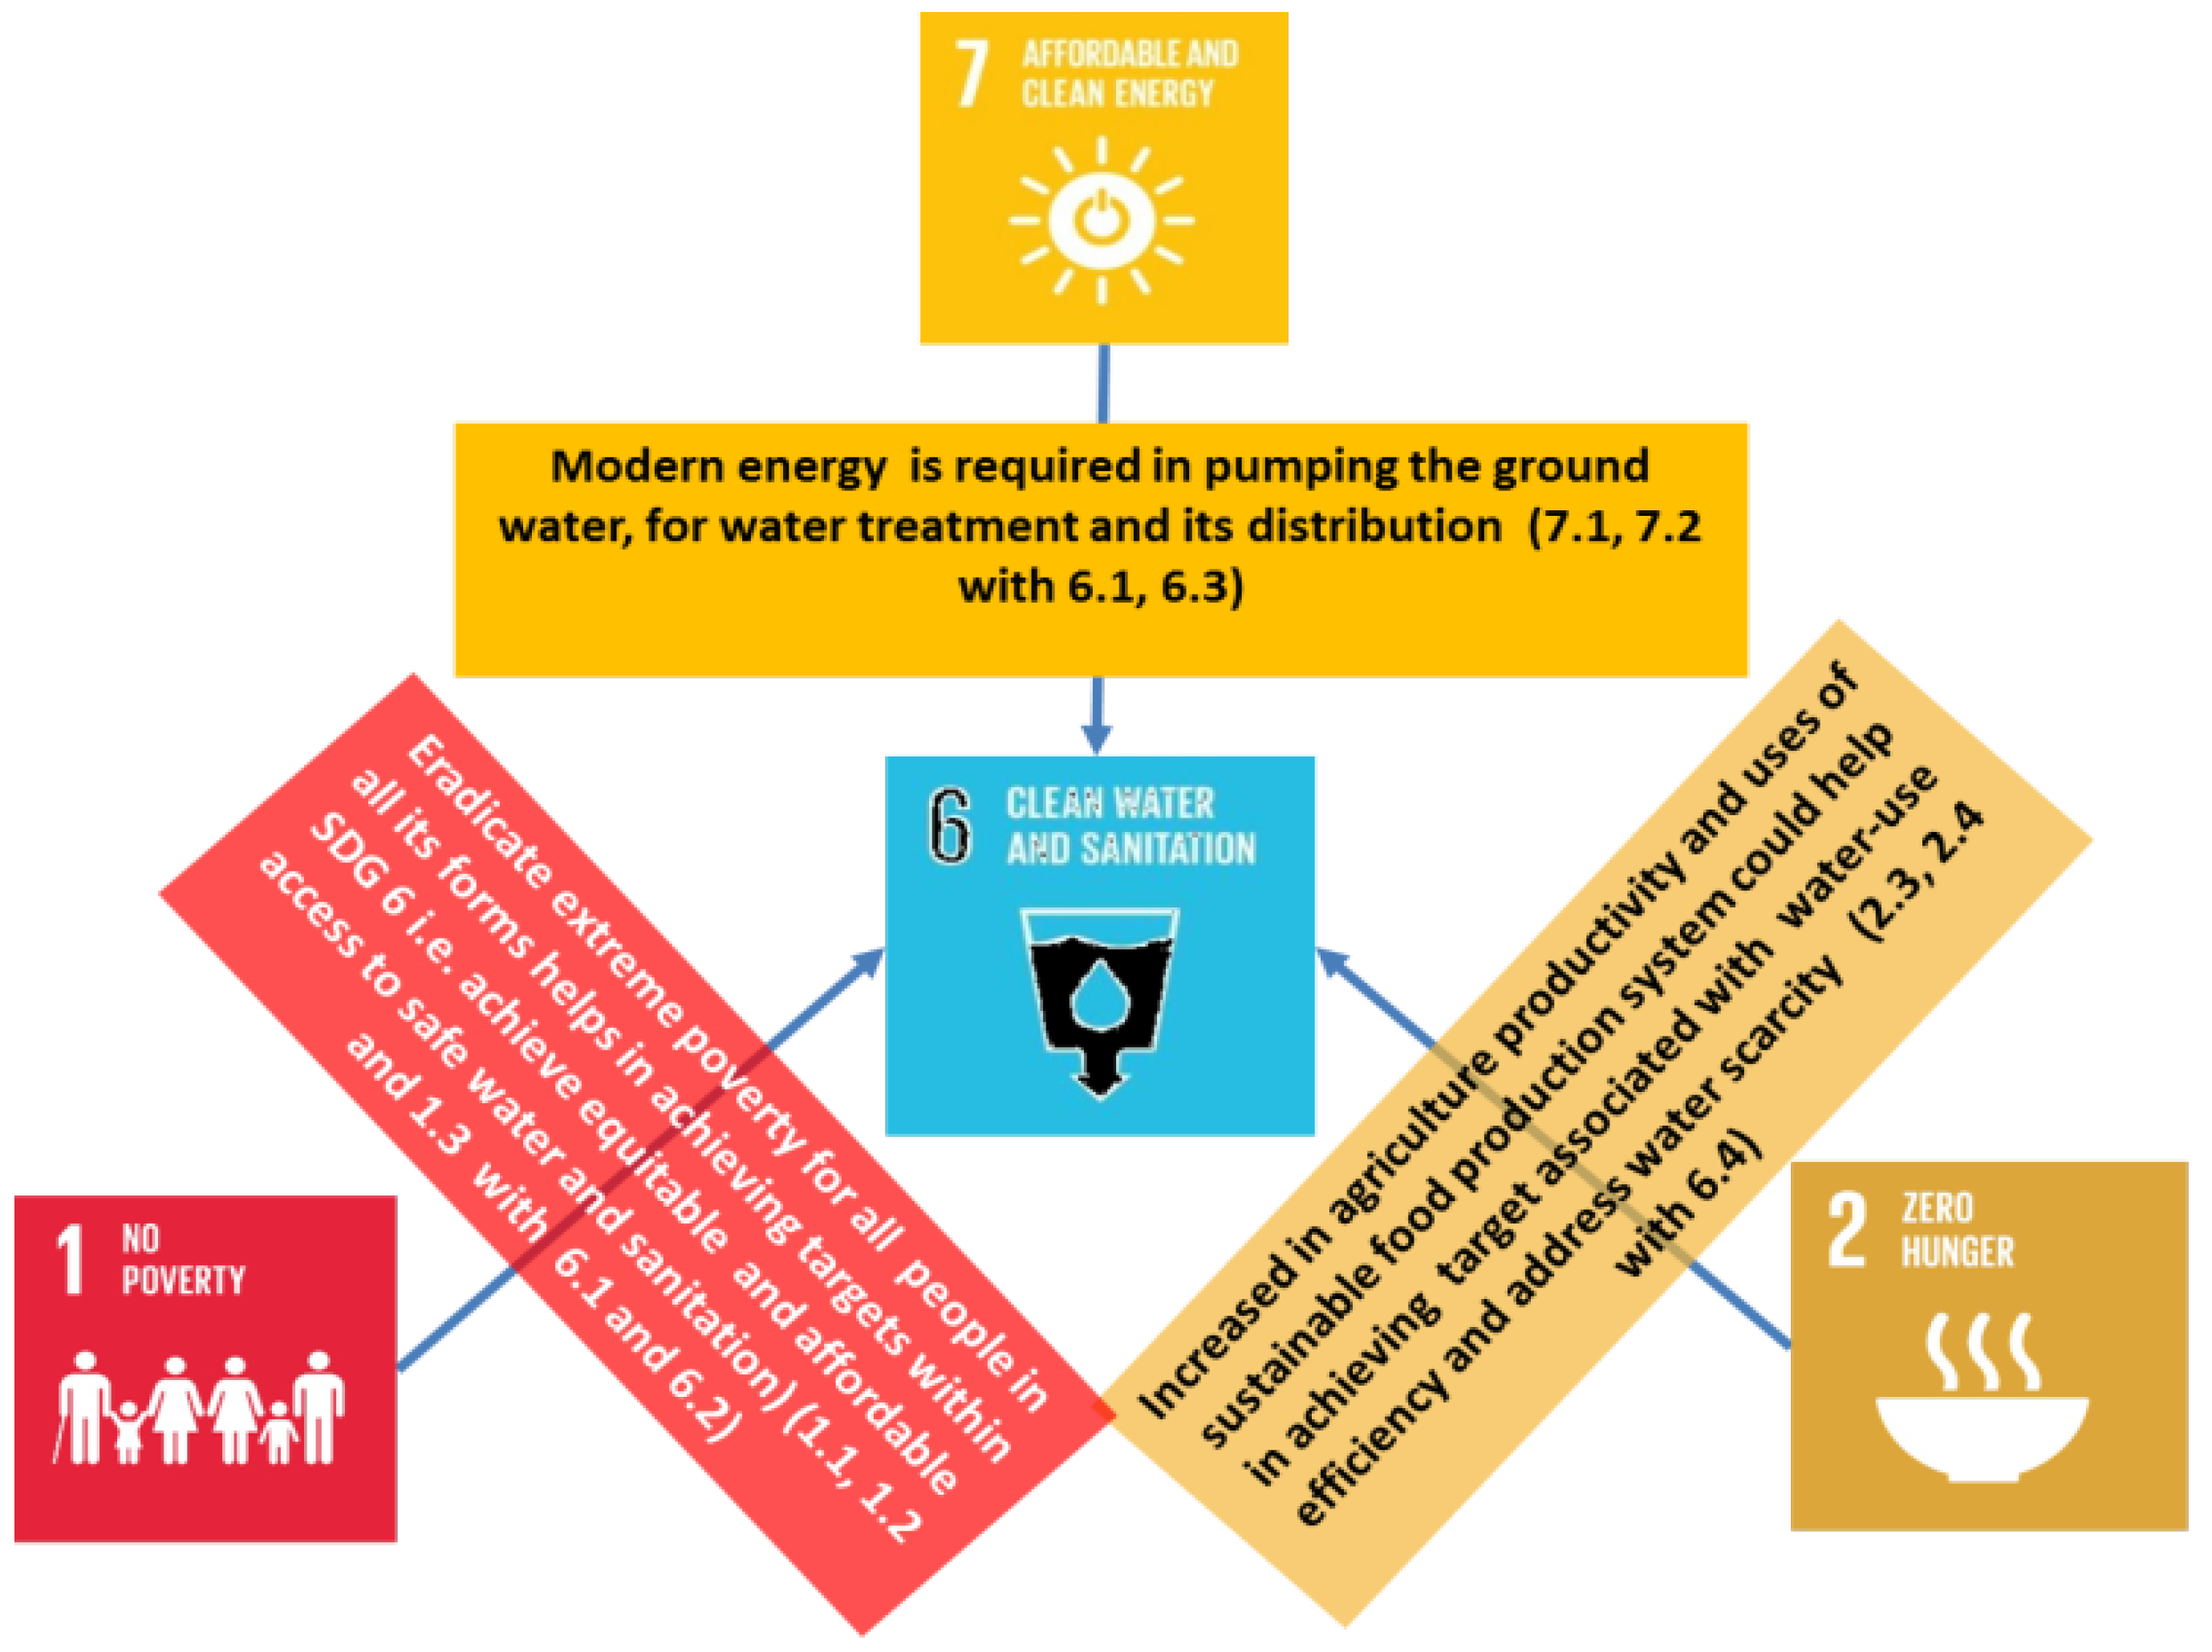
4.3. SDG6 in Focus—Water and Sanitation for All

Goal 6 sets comprehensive and ambitious targets for water and sanitation sector to be achieved by 2030. With reduced poverty (T1.1 and T1.2), affordability shall increase which may speed up the transition towards universal access to safe drinking water and sanitation (T6.1 and T6.2) [43,63,64]. Increase in agriculture productivity (T2.3) and sustainable food production practices (T2.4), which are targeted under SDG2, can help to meet water efficiency in agriculture (T6.4) and vice-versa [65]. Economies in Sub-Saharan Africa and in Southern Asia are largely dependent on the agriculture sector which contributes a significant share to the national GDP, viz. Ethiopia (42%), Ghana (22%), Rwanda (33%), Bangladesh (16%), and Nepal (32%), in 2014 [33]. However, these countries rely mostly on rain-fed farming practices [65]. The small poor farmers and their farming practices are vulnerable due to their high reliance on rain-fed agriculture. The extremity and unreliability on the climatic conditions because of climate change could further deteriorate the livelihood of poor and least resilient farmers [65,66,67,68]. The natural distribution of water is uneven due to geographical and seasonal variation [68]. Effective management of water is crucial to maintain water use efficiency (T6.4), increase agricultural productivity (T2.3) due to reduced risk of rainfall variability, and opportunity for harvesting multi-cropping and more remunerative cash crops [69].
Access to modern energy (T7.1) is crucial in the development of a supply chain for water (viz., pumping the ground water, water treatment or desalination plant, and also its distribution) (T6.1). As discussed previously, energy use is equally important for irrigation purposes. The application of off-grid renewable energy (T7.2) across various segments of the water supply chain can enhance water security especially in the remote isolated areas [70]. Studies carried out in Bangladesh have highlighted the importance of renewable energy technology, viz. solar and biogas, for pumping water and for treating the water in rural areas without access to electricity which suffer from arsenic contaminated water [12,71]. The linkages of SDG6 with the targets associated with other SDGs 1, 2 and 7 are illustrated in Figure 7.

4.4. SDG7 in Focus—Energy for All

Goal 7 aims at sustainable energy production, providing equitable access and consumption of energy. Energy and poverty are linked to each other. Eradication of poverty of all kind (T1.1, T1.2) could increase affordability and could be instrumental in minimizing the clean energy access gap (T7.1). However, understanding the hierarchy of needs and prioritizing targets may be necessary in specific cases. Electrification is not the first priority compared to other more important basic needs such as food and water. Cases has been observed in Nepal and Peru where people have sold PV panels that they received under heavily subsidized schemes to afford other more basic needs such as food. Apparently, the energy programmes wrongly targeted poor villages where there was a prior agenda to address hunger before energy [72,73].
Globally, 15% of freshwater withdrawal is related with energy production which is around 580 billion cubic metres/year (bcm/year) [70]. Out of this water withdrawal, 66 bcm/year is consummative and not returning to the source [74]. Water footprint in the production of energy could be an indicator to show the dependency between energy and water. The total water withdrawal for the energy production may vary from country to country depending upon the energy mix. The water footprint of renewable energy sources such as solar PV and wind is significantly lower than in conventional energy production from fossil-based fuels [70]. Thus, increasing electricity production from renewable energy (T7.2) will help to increase water use efficiency (T6.4). On the other hand, countries with hilly and mountainous landscapes, viz. Nepal and Ethiopia, have large potential to harness water for energy generation. The estimated theoretical hydropower potential is around 84 GW in Nepal and 45 GW in Ethiopia. In both countries, only a small fraction of the total potential (753 MW in Nepal and 2552 MW in Ethiopia till 2015) has been harnessed so far [75].
Meeting the target of ensuring universal access to nutritious and sufficient food and increasing agriculture productivity (T2.1, T2.2, and T2.3) could increase energy demand along the food supply chain, and this could stress the energy system. There could be some trade-offs among the target of ending hunger (T2.1) and energy production, especially in countries that rely on biofuel to expand energy access (T7.1, T7.2). However, with holistic thinking and careful planning, agriculture residues and animal dung can be used for energy production, viz. biogas, which can help in promoting renewable energy (T7.2) and increasing the energy efficiency of traditional biomass utilization (T7.3). This would create synergetic impact [4]. Innovative and sustainable agriculture practices could help to increase agriculture productivity (T2.3) as well as produce renewable energy resources (T7.2). For example, in Sri Lanka, practices of intercropping Gliricidia (a fast-growing, nitrogen-fixing leguminous tree) with coconut is substantially improving agricultural yields as well as providing sustainable bioenergy feedstock. The linkages of SDG7 with the targets associated with other SDGs 1, 2 and 6 discussed above are illustrated in Figure 8.

4.5. Network of Various Targets within SDGs

Our analysis in Section 4.1, Section 4.2, Section 4.3 and Section 4.4 shows the interaction among the targets within and/or across the SDGs. Some of these linkages are reinforcing and interdependent (indicating potential synergies), some are independent (i.e., achievement of one target does not rely on the others, de-linking), or impose conditions or constraints (indicating trade-off). Summarising the discussion from the above sections, the interaction among various targets of SDGs could be presented in an integrated form as a network of targets. Figure 9 represents such a network, where the green lines represent interdependency, the blue lines represent the possible synergy and the red lines represent possible trade-offs. The large and small circles with different colours, viz. purple, orange, sky blue and golden yellow, represent SDGs 1, 2, 6 and 7 and their targets, respectively. Figure 9 illustrates the nexus approach because it integrates key issues of economic security, energy security, water security and food security.
T-1.1
Eradicate extreme poverty
T-1.2
Reduce the poverty by half in all its dimensions as per national definitions
T-1.3
Implement nationally appropriate social protection systems
T-2.1
End hunger and ensure universal access to nutritious and sufficient food
T-2.2
End all forms of malnutrition
T-2.3
Double the agricultural productivity and incomes of small-scale food producers
T-2.4
Ensure sustainable food production systems and increase productivity and production
T-2.5
Maintain the genetic diversity of seeds, cultivated plants, and farmed and domesticated animals
T-6.1
Achieve universal and equitable access to safe and affordable drinking water for all
T-6.2
Achieve access to adequate and equitable sanitation and hygiene for all
T-6.3
Improve water quality, halving the proportion of untreated wastewater, promote recycling and safe reuse
T-6.4
Substantially increase water-use efficiency across all sectors and substantially reduce the water scarcity
T-7.1
Ensure universal access to affordable, reliable, and modern energy services
T-7.2
Increase substantially the share of renewable energy in the global energy mix
T-7.3
Double the global rate of improvement in energy efficiency
The network analysis shows three reinforcing and one dependent linkage between SDG1 and SDG7, and nine reinforcing linkages between SDG1 and SDG2. There are six reinforcing linkages between SDG1 and SDG6, and four dependent linkages between SDG7 and SDG2. There are three dependent linkages between SDG7 and SDG6. Moreover, there are two reinforcing linkages, two dependent linkages and one linkage requiring trade-offs between SDG2 and SDG6. These conceptual linkages could also be verified looking at the pairwise correlation among the indicators measuring these targets. This pairwise correlation describes the size and direction of linkages between two variables.
The targets associated with different goals and respective indicators are listed in Table 1. However, not all targets defined under SDGs are well defined in terms of measurability and indicators. There is also a major challenge on availability of historical datasets and their authenticity in most developing countries [31,32,76]. Due to data constraints, not all desired sets of indicators (as listed in Table 1) could be included in the analysis. The sets of indicators measuring /tracking the progress on the targets T1.1, T2.1, T2.3, T6.1, T6.2, T6.4 and T7.1 associated with SDG 1, 2, 6 and 7, respectively, have been analysed under this study. The performance of the countries under this study, viz. Southern Asian countries (Bangladesh, Nepal and Sri Lanka) and Sub-Saharan African countries (Ethiopia, Ghana and Rwanda), according to those indicators, were tabulated for 1990, 2000, 2005, 2010 and 2012 (Table A1). The countries’ population in the respective years is tabulated in Table A2. The pairwise correlation coefficient with their statistical significance level are tabulated in Table 2.
Notably, the correlation coefficients are mainly positive and strongly correlated between different SDGs with the only exception of SDG_T6.4 (Level of water stress: freshwater withdrawal in percentage of available freshwater resources), which has negative correlation with all other SDGs. The correlation of SDG_T2.3 (Crop yield gap and livestock yield gap, meaning actual yield as per cent of attainable yield) seems to be lower than with the other variables.
Pairwise Pearson’s correlation (calculated above by dividing the covariance of the two variables by the product of their standard deviations) describes the size and direction of linkages between two variables (targets) and only reflects the linear relationship. However, neither the slope nor any other aspects of non-linear relationships could be described [15,77]. The correlation does not measure or track the synergy among these targets. The potential synergies or trade-off among various targets can be examined using the quantitative method, see Section 5.

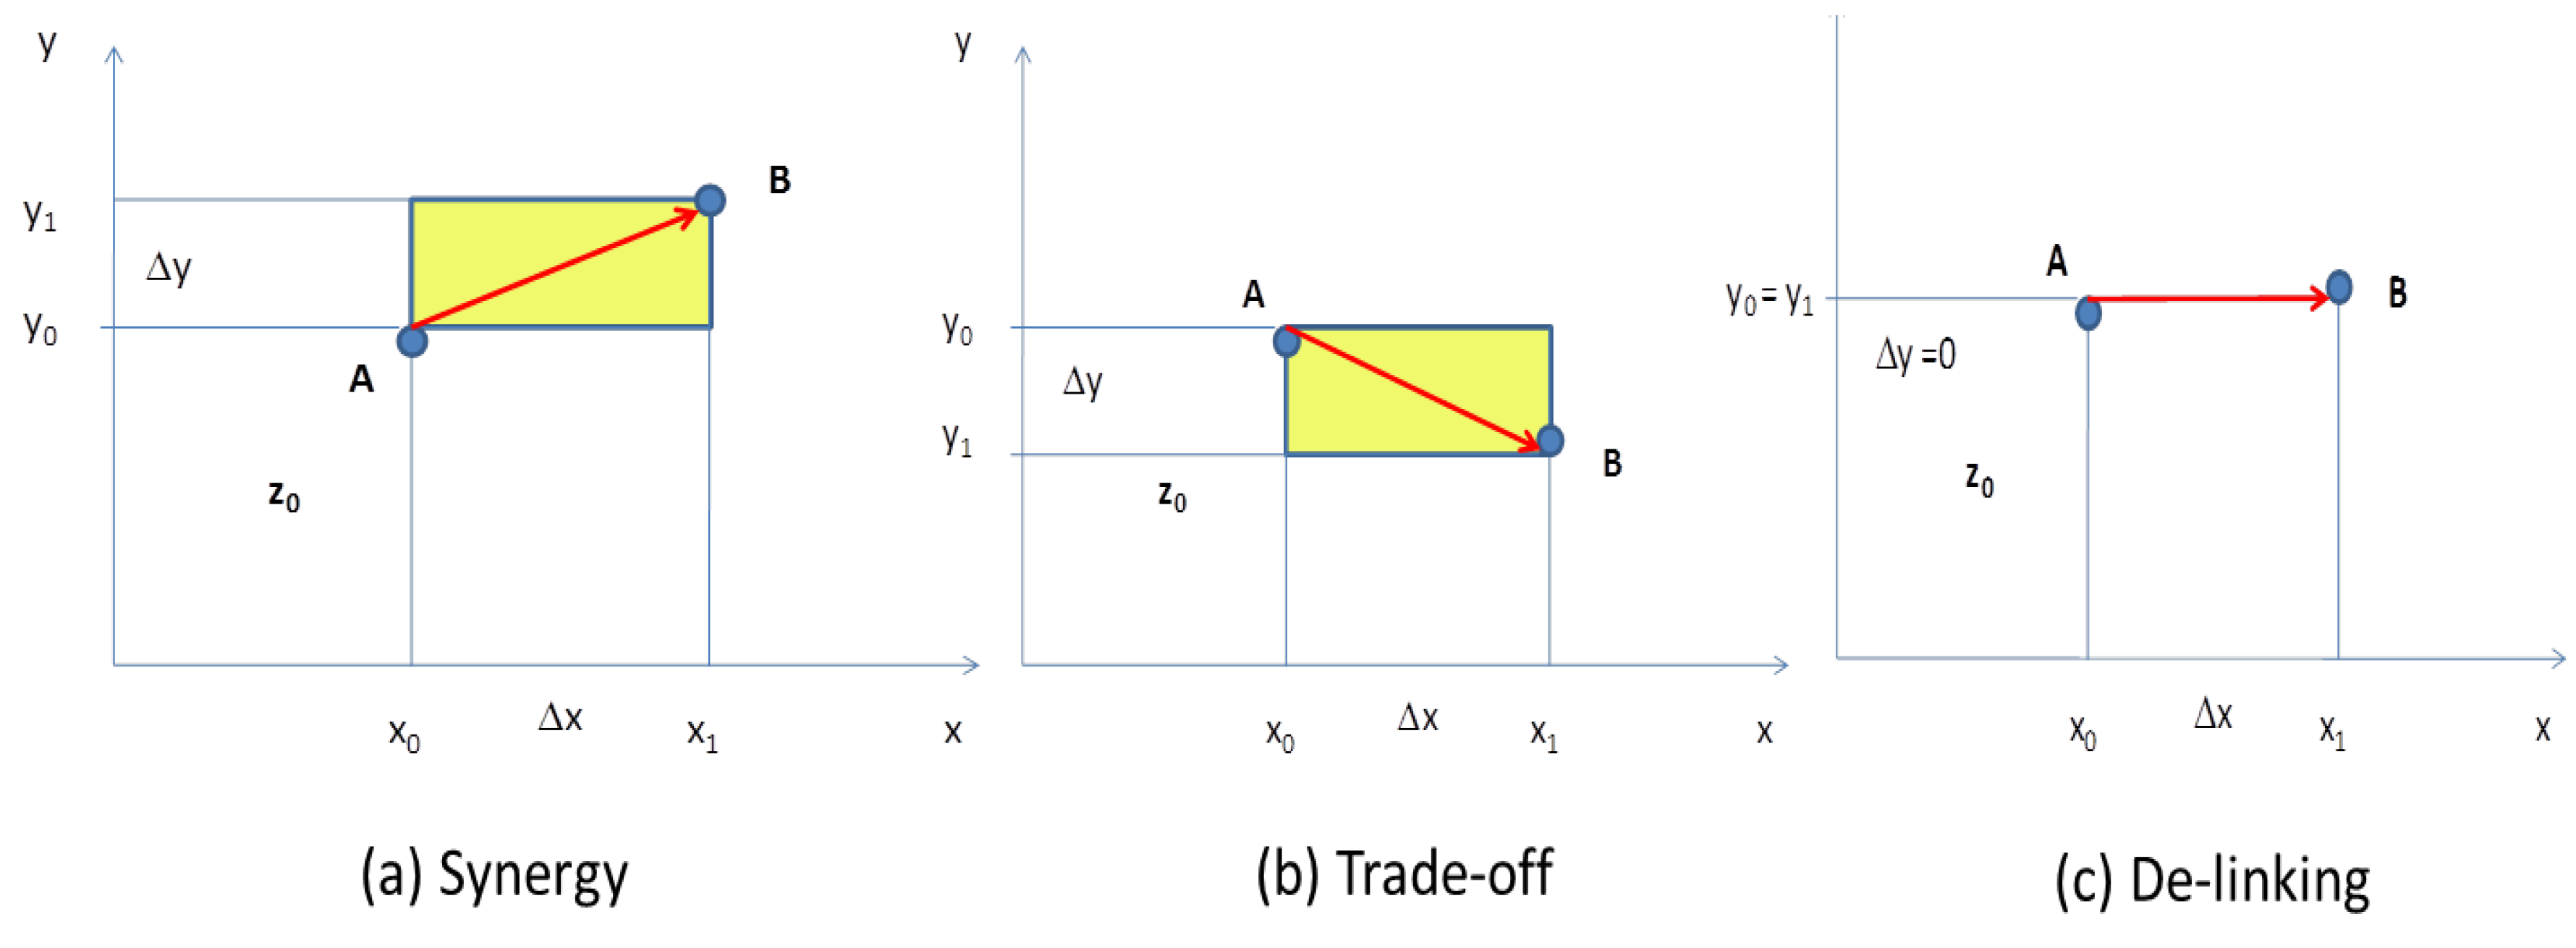
5. Evaluation of Synergy and Trade-Off

The degree of potential synergy, trade-off and de-linking among the targets may vary depending upon the geographical conditions, available resources, the stage of development and the policy measures adopted by the states [28]. The quantitative analyses on synergy/trade-off presented here indicate the potential synergies or trade-offs among the various targets for comparative purposes. As described in the Section 2.2, the synergy among two variables represent statistical interaction and is measured by the ratio of relative changes among these two variables in a given specific time period. The variables are normalized to the previous year in the calculation and the synergy is expressed as an index ranges from +1 to −1, minus (−) sign representing the trade-off situation. Synergies have been evaluated for each five-year time span (1990–1995, 1995–2000, 2000–2005, and 2005–2010) and the two-year 2010–2012 due to constraints on the data availability for the most recent period.

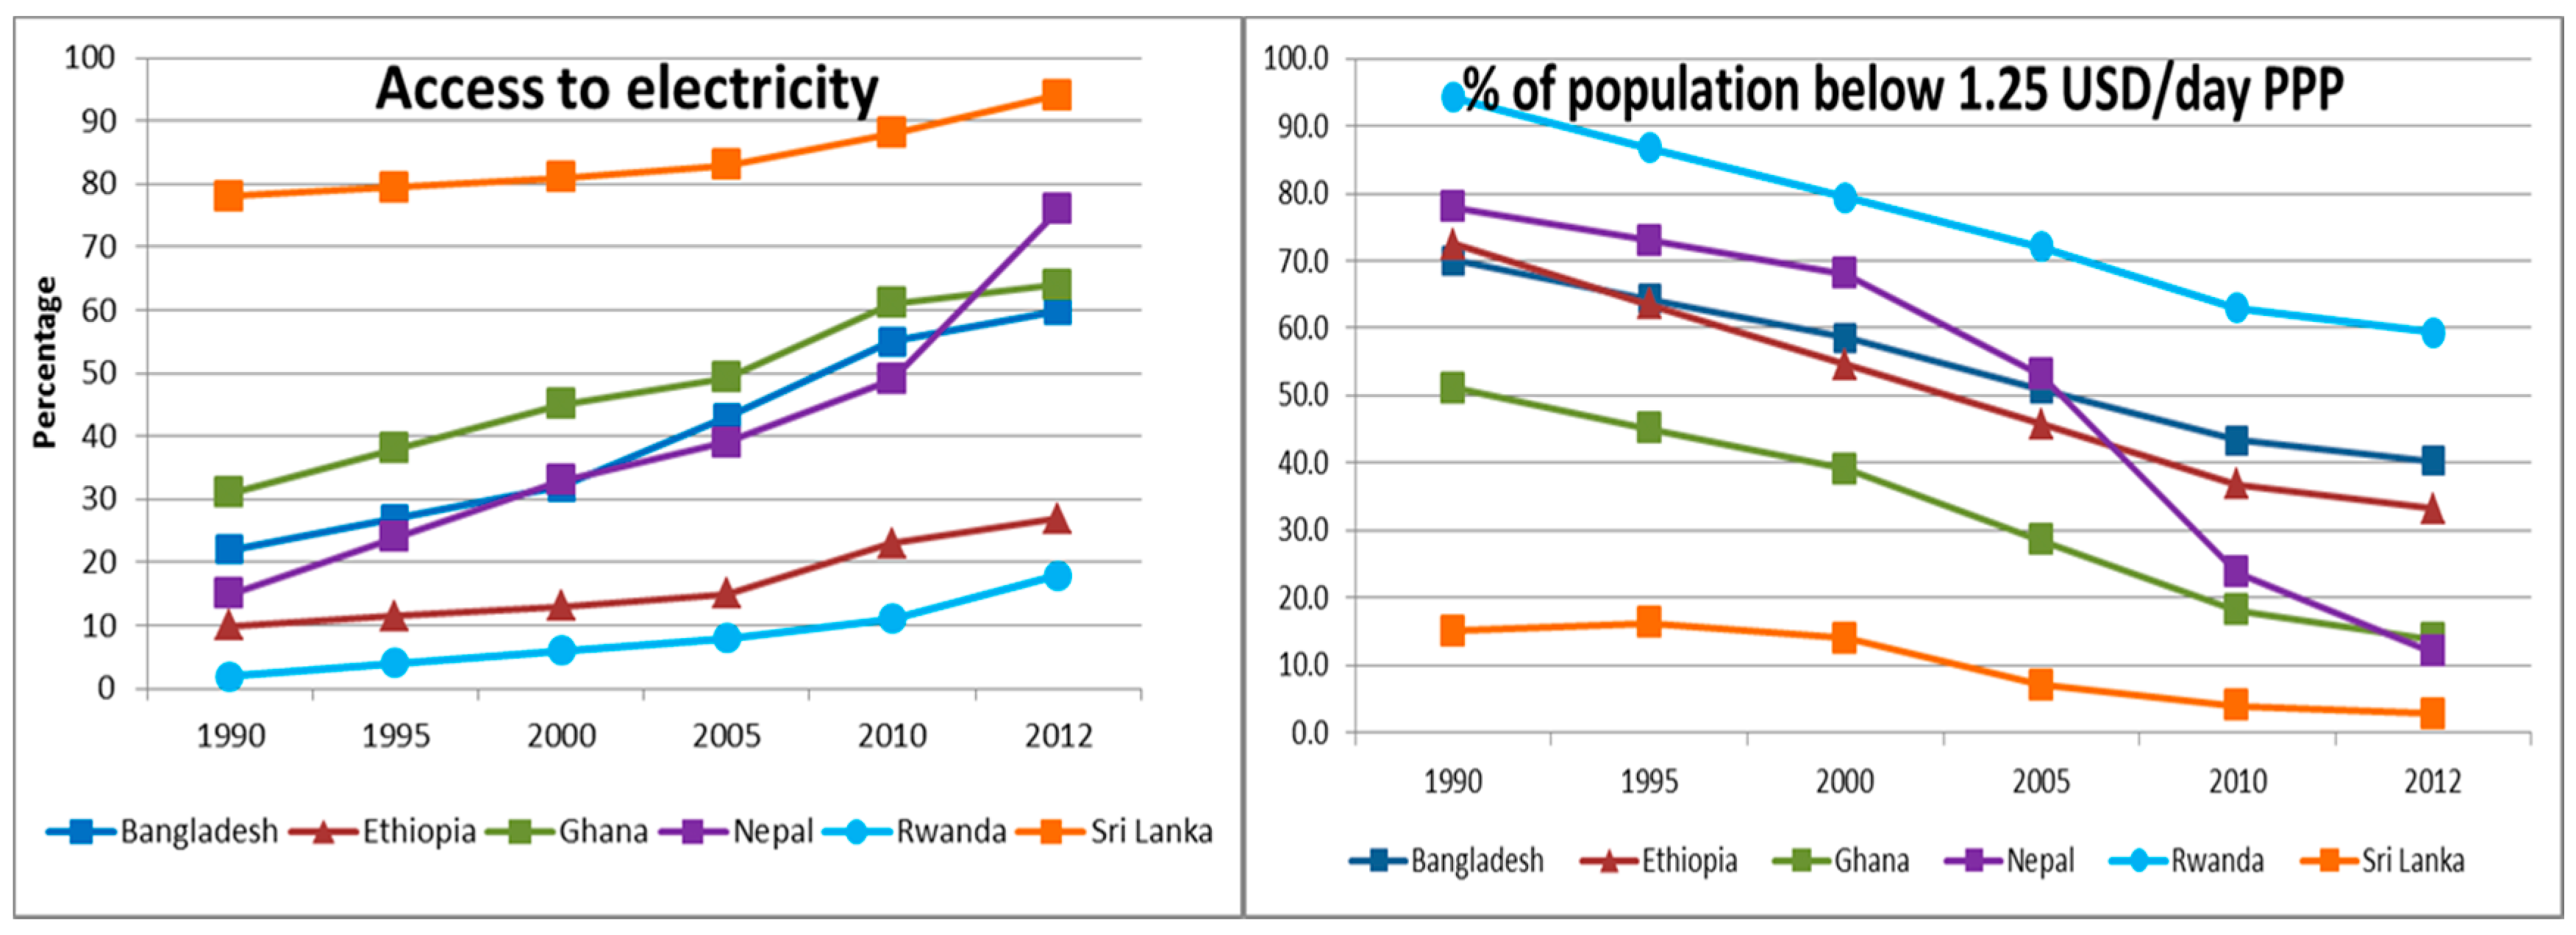
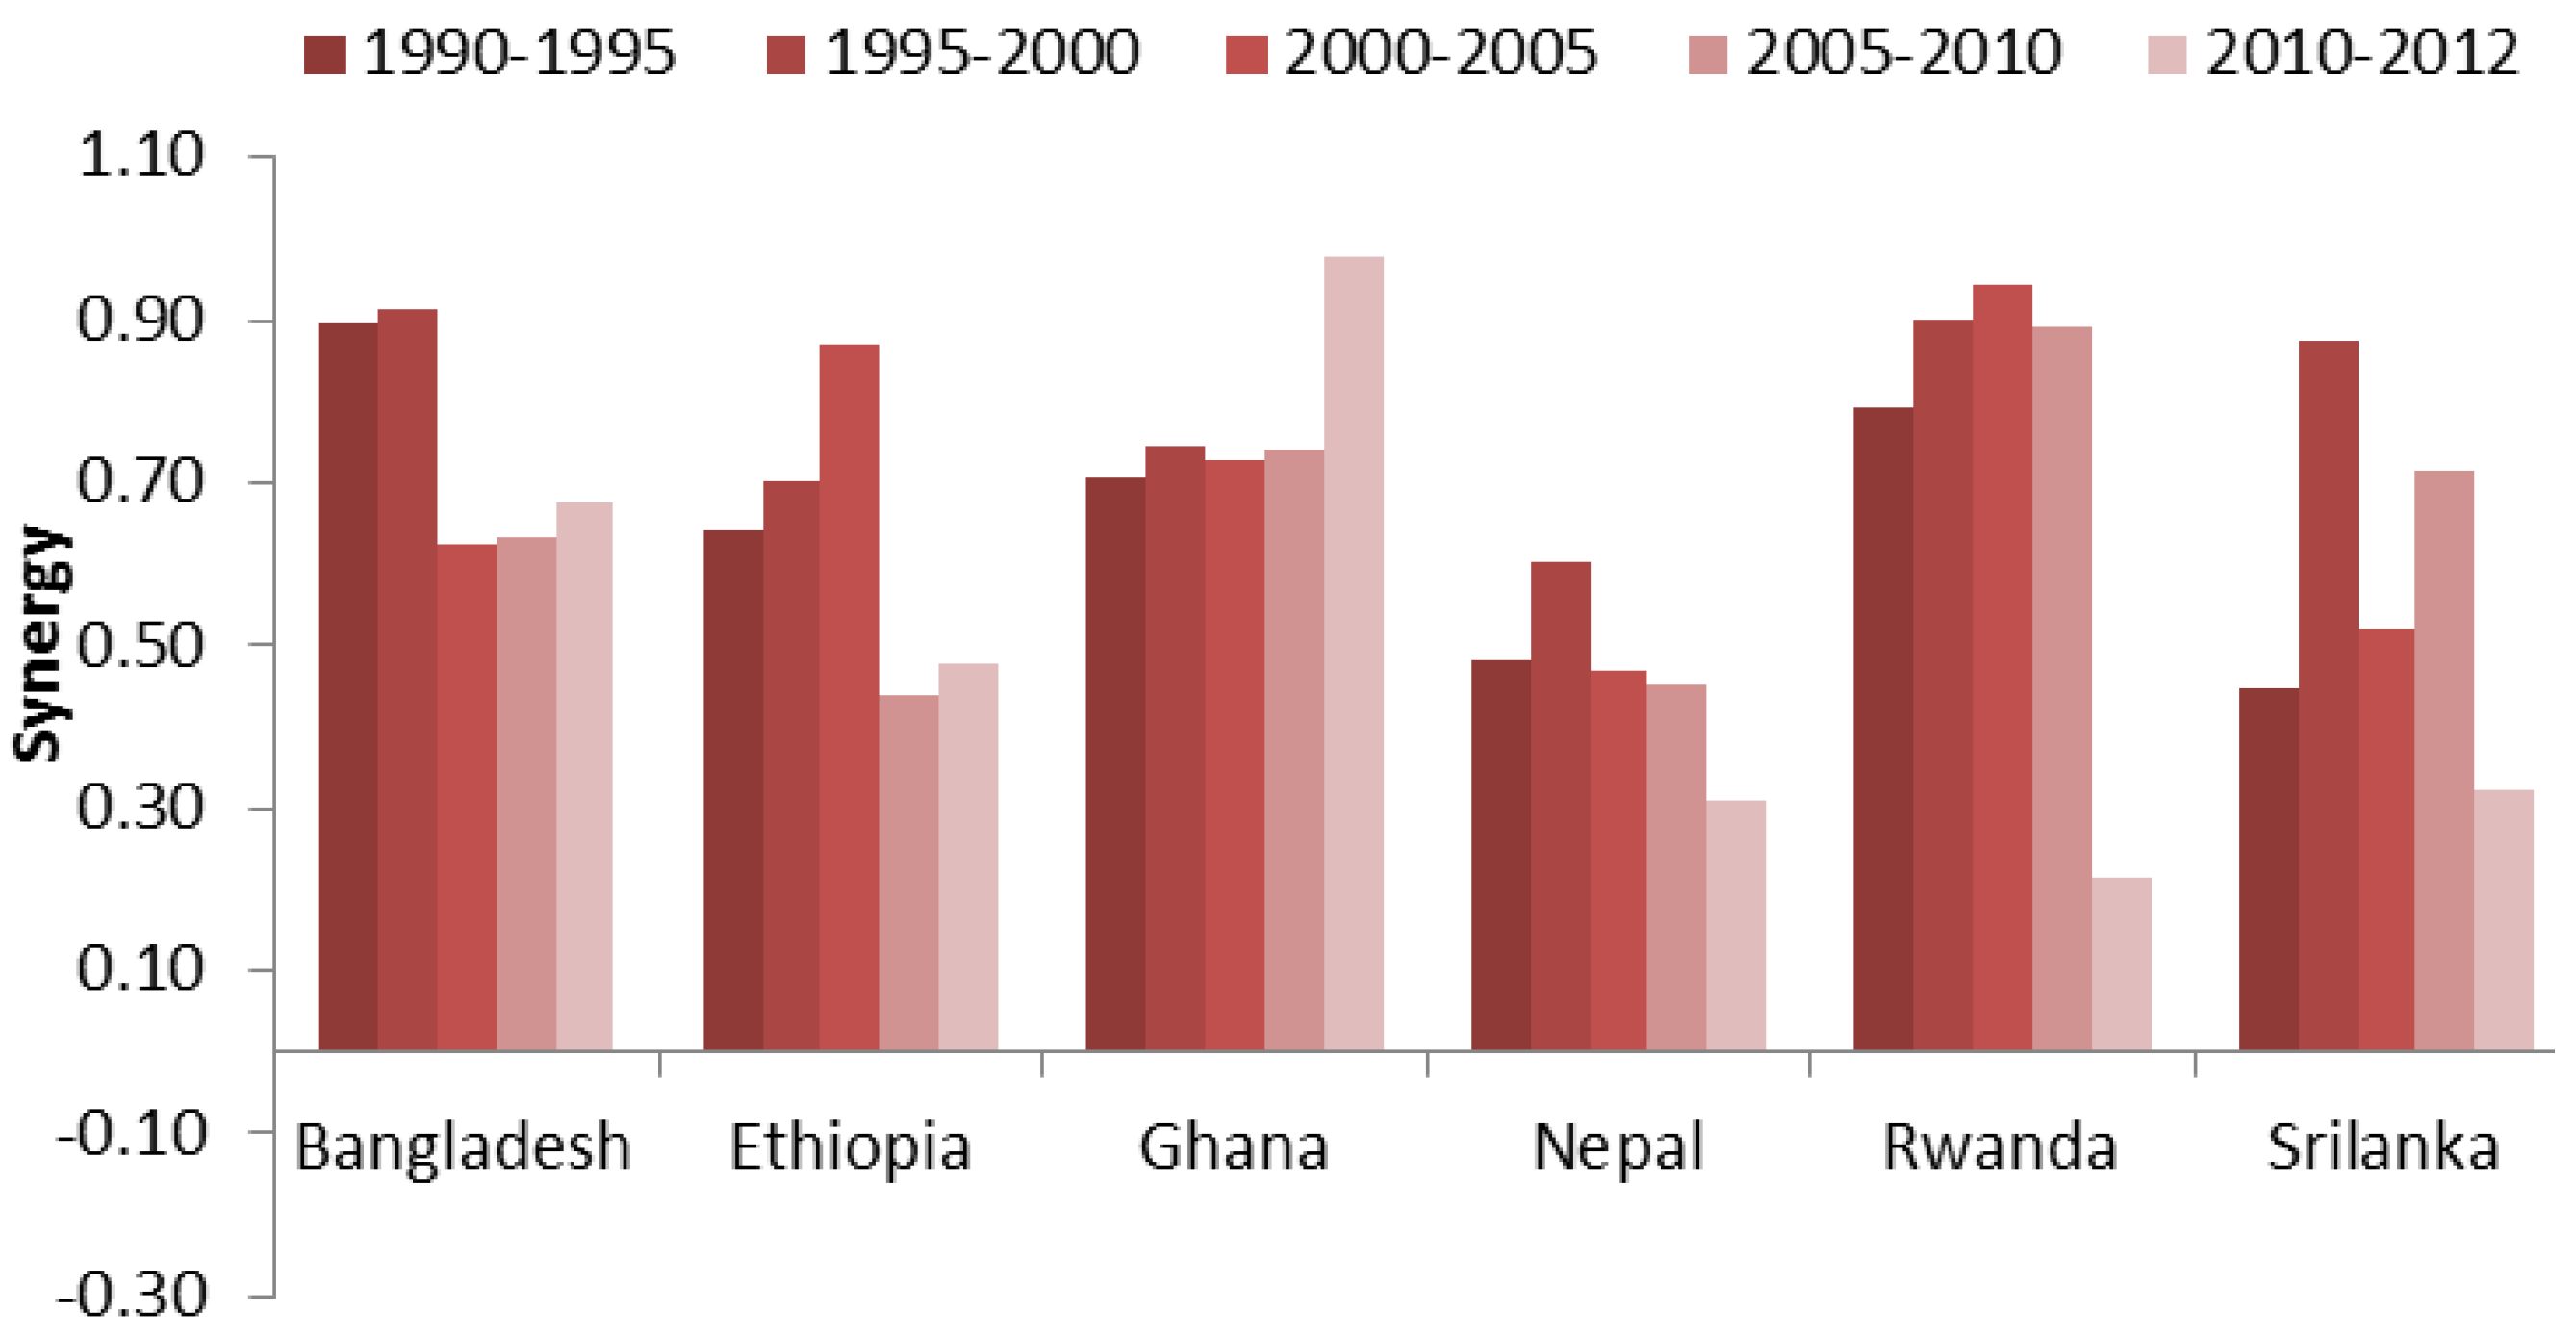
5.1. Synergy among SDG7 and SDG1

Figure 10 shows the share of the population with access to electricity (Figure 10, left) and the share of the population leaving on less than 1.25 USD (PPP) a day (Figure 10, right) in Bangladesh, Ethiopia, Ghana, Nepal, Rwanda and Sri Lanka for 1990–2012.
The share of population with access to electricity has increased in Sri-Lanka from 74% (1990) to 94% (2012). However, the population living under 1.25 USD/day (PPP) has gone down from 15% (1990) to 3.7% (2012). In Rwanda, the access to electricity has gone from 2% to 18% and population under poverty line has gone down from 94% to 62% in the same period. While evaluating the synergy among these two targets, data on population above the poverty line of 1.25 USD/ day (PPP) and the people with access to electricity were used.
Figure 11 shows the power of explorative analysis in synergy evaluation among access to electricity and population above poverty line. Bars above the axis will represent positive synergy while the bars below the axis represent negative synergy (trade-off) conditions. Figure 11 shows that there exists positive synergy between these two targets, viz. number of people with access to electricity (T7.1) and people living above the poverty line of 1.25 USD/ day (PPP) (T1.1), for all the country cases over the observed time spans (1990–2012). These two variables are interdependent and any increment in one variable will have synergetic impact on the others. As aforementioned the aim shall be maximizing the potential synergy. The average synergistic effect of Ghana was relatively higher in comparison to others followed by Bangladesh and Rwanda.
Ghana has launched several strategies/policies (viz., Ghana Poverty Reduction Strategy (2003–2005) and the Growth and Poverty Reduction Strategy (2006–2009)); Ghana Vision 2020 which were effectively executed between 1990 and 2012. The common goal of all these strategies was to accelerate economic growth and reduce poverty. Ghana’s Energy Sector Strategy and Development Plan, 2010 aimed at providing universal energy access, poverty reduction and improved living standards [78]. Policies have well recognized the reinforcing linkages of energy and poverty reduction. Considerable progress has been made towards macro-economic stability and achieving poverty reduction goals [79]. These could reflect the possible reasoning behind higher synergistic value between electricity access and the poverty alleviation in the case of Ghana.
Sri-Lanka is reaching the last mile of the targets both in terms of poverty reduction and in providing access to electricity. The lower synergy between energy access and poverty reduction in the last decade in Sri Lanka could be viewed as last mile problem. The last mile challenges of developing countries are normally associated with reaching the poorest of the poor living in the remotest location, for which providing electricity access and alleviating poverty is more challenging [80].
In the case of Nepal, the low synergy values could be attributed to the definition and pathways adopted for electrification. The household is considered electrified, even when electricity access is achieved with a small solar home system of 5 Wp. This may not really reinforce the poverty alleviation goal despite the other social benefits it can bring [81,82]. The poverty reduction in Nepal is largely impacted by the remittance from abroad and such remittance contributes 30% of the average household income [83,84]. The increase in remittances does have positive impact in increasing the equity investment in expanding access to electricity [85]. However, an integrated policy supporting rural electrification and productive end uses in rural industries could help in increase the synergy effect [86,87].
Figure 12 shows the share of population with access to clean energy (i.e., uses of non-solid fuels for cooking) (Figure 12, left) and the share of the population living on less than 1.25 USD (PPP) a day (Figure 12, right) in the countries Bangladesh, Ethiopia, Ghana, Nepal, Rwanda and Sri Lanka 1990–2012. Though there has been significant progress in the access to electricity in these countries, little progress has been achieved when it comes to meet clean energy access for cooking. The access situation has in fact worsened in Nepal and Ethiopia in the recent years.
Explorative analysis shown in Figure 13 reveals interesting results of the synergy between the number of people with access to clean energy (T7.1) and people living above the poverty line of 1.25 USD/day (PPP) (T1.1) for all the country cases in the observed time spans. The synergistic effect among the two targets was relatively higher in the case of Ghana in comparison to others and increased over time. The economic growth of Ghana has helped in poverty reduction and affordability of clean energy. With the aim of clean energy transition, Ghana’s Energy Sector Strategy and Development Plan 2010 has prioritized the investment on Liquid Petroleum Gas (LPG) infrastructure and promoted pricing incentives to encourage distributors to expand services in the rural areas. As a result, a strong synergy can be observed between the target associated with poverty reduction and clean energy access. However, in the case Nepal and Ethiopia, negative synergy (trade-off) has been observed in recent years. Due to high upfront cost and unreliable supply of LPG causing frequent fuel shortage in Nepal and poor market infrastructure for the supply of clean energy, rural communities are reluctant to switch from biomass/solid fuel [88,89].
Further, the rural energy policy of Nepal focuses on improved cooking stoves rather than fuel transition to cleaner commercial fuels [90]. This imposes negative constraints to efforts aimed at alleviating energy poverty. In the case of Ethiopia, high upfront cost and poor market infrastructure for the supply of clean energy technology are the key factors increasing the uses of conventional solid fuel [91]. Although Ethiopia’s national energy policy objective is to ensure and encourage a gradual transition to clean energy sources, there is no national programme aimed at meeting this target, and efforts are fragmented or rely on development partners and their programmes for improved cooking stoves [92].
In the case of Bangladesh, although positive synergy has been observed throughout the studied period, the synergy trend has decreased in the last 15 years. Behera et al. [93] also reveals that, in Bangladesh, switching from traditional firewood to modern energy is not happening as anticipated even after the rise in household income. The abundant availability of solid fuels in the country, poor market infrastructure for the clean energy supply and lack of awareness about health risks associated with traditional solid fuels could explain this delay.

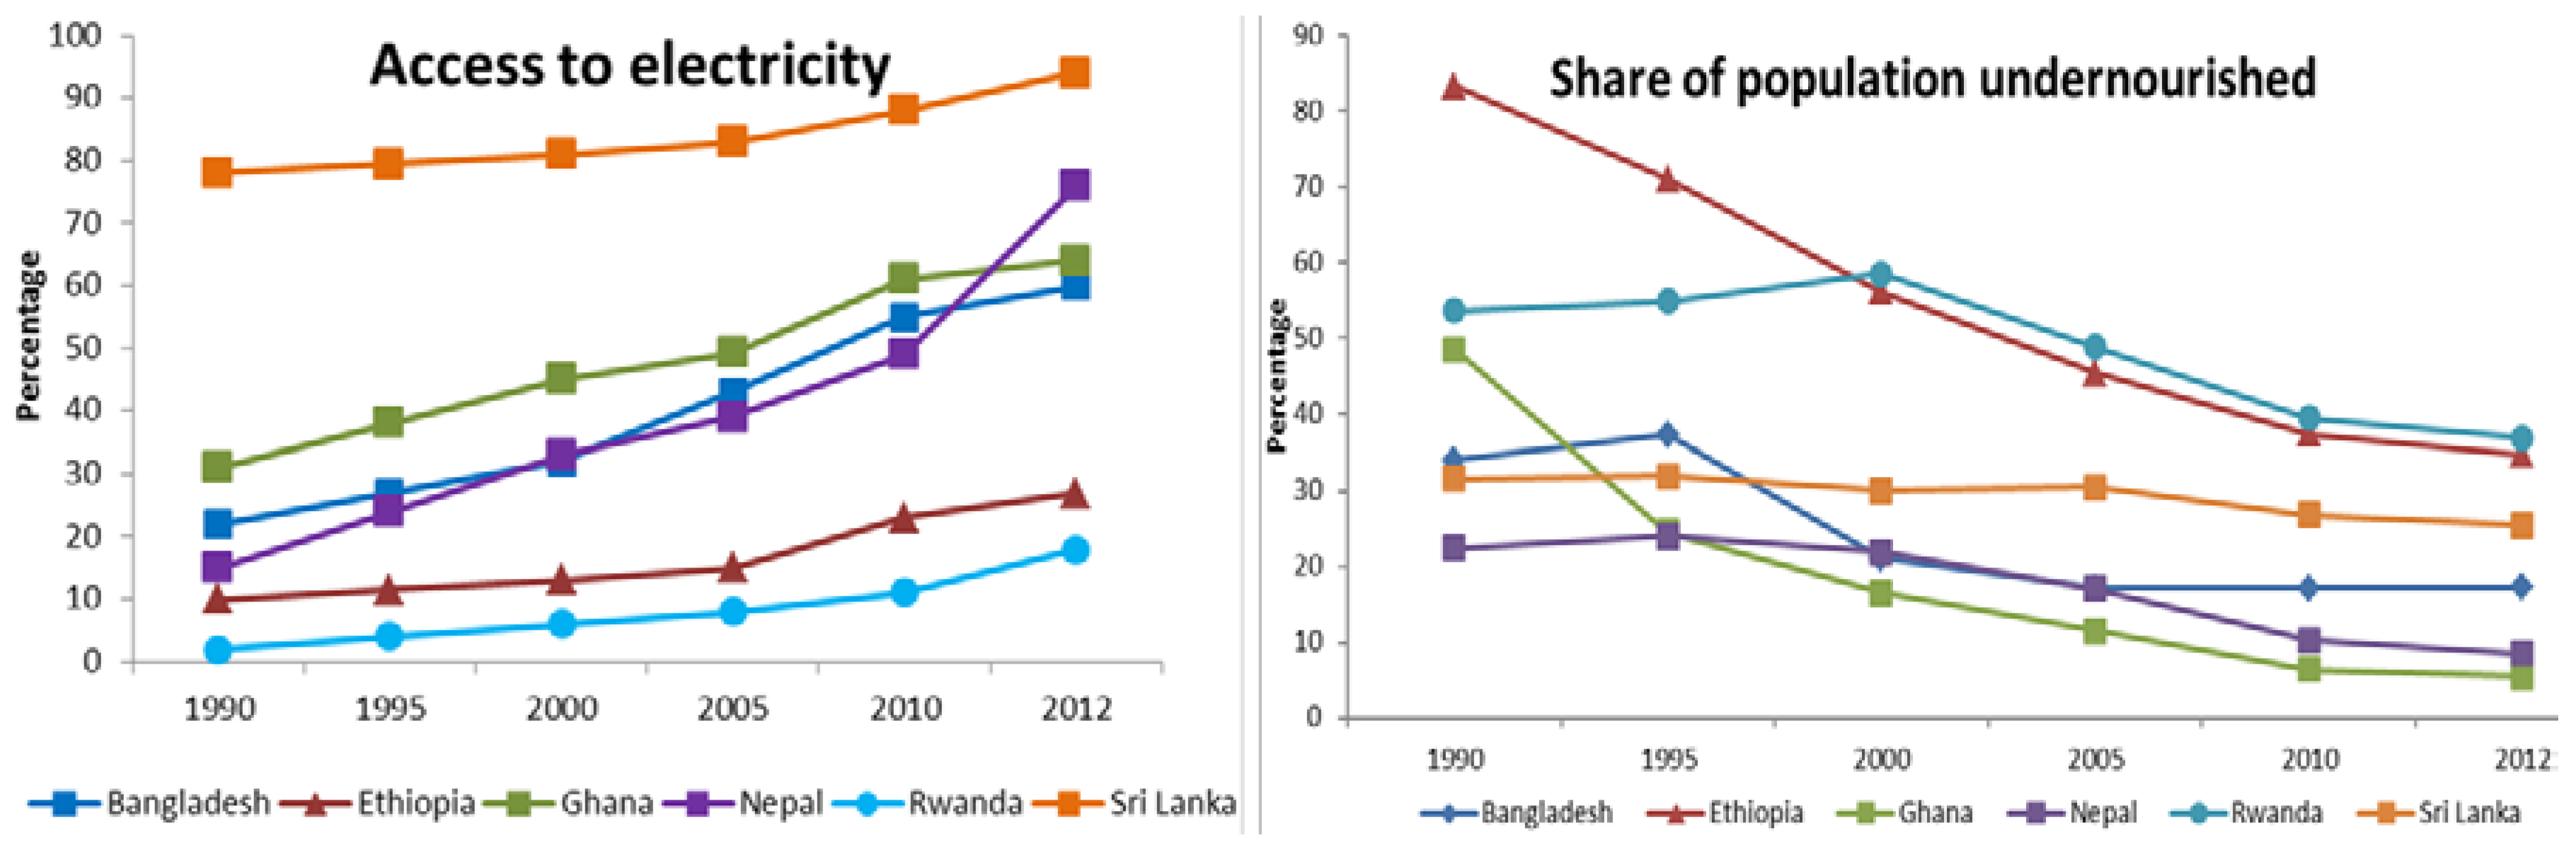
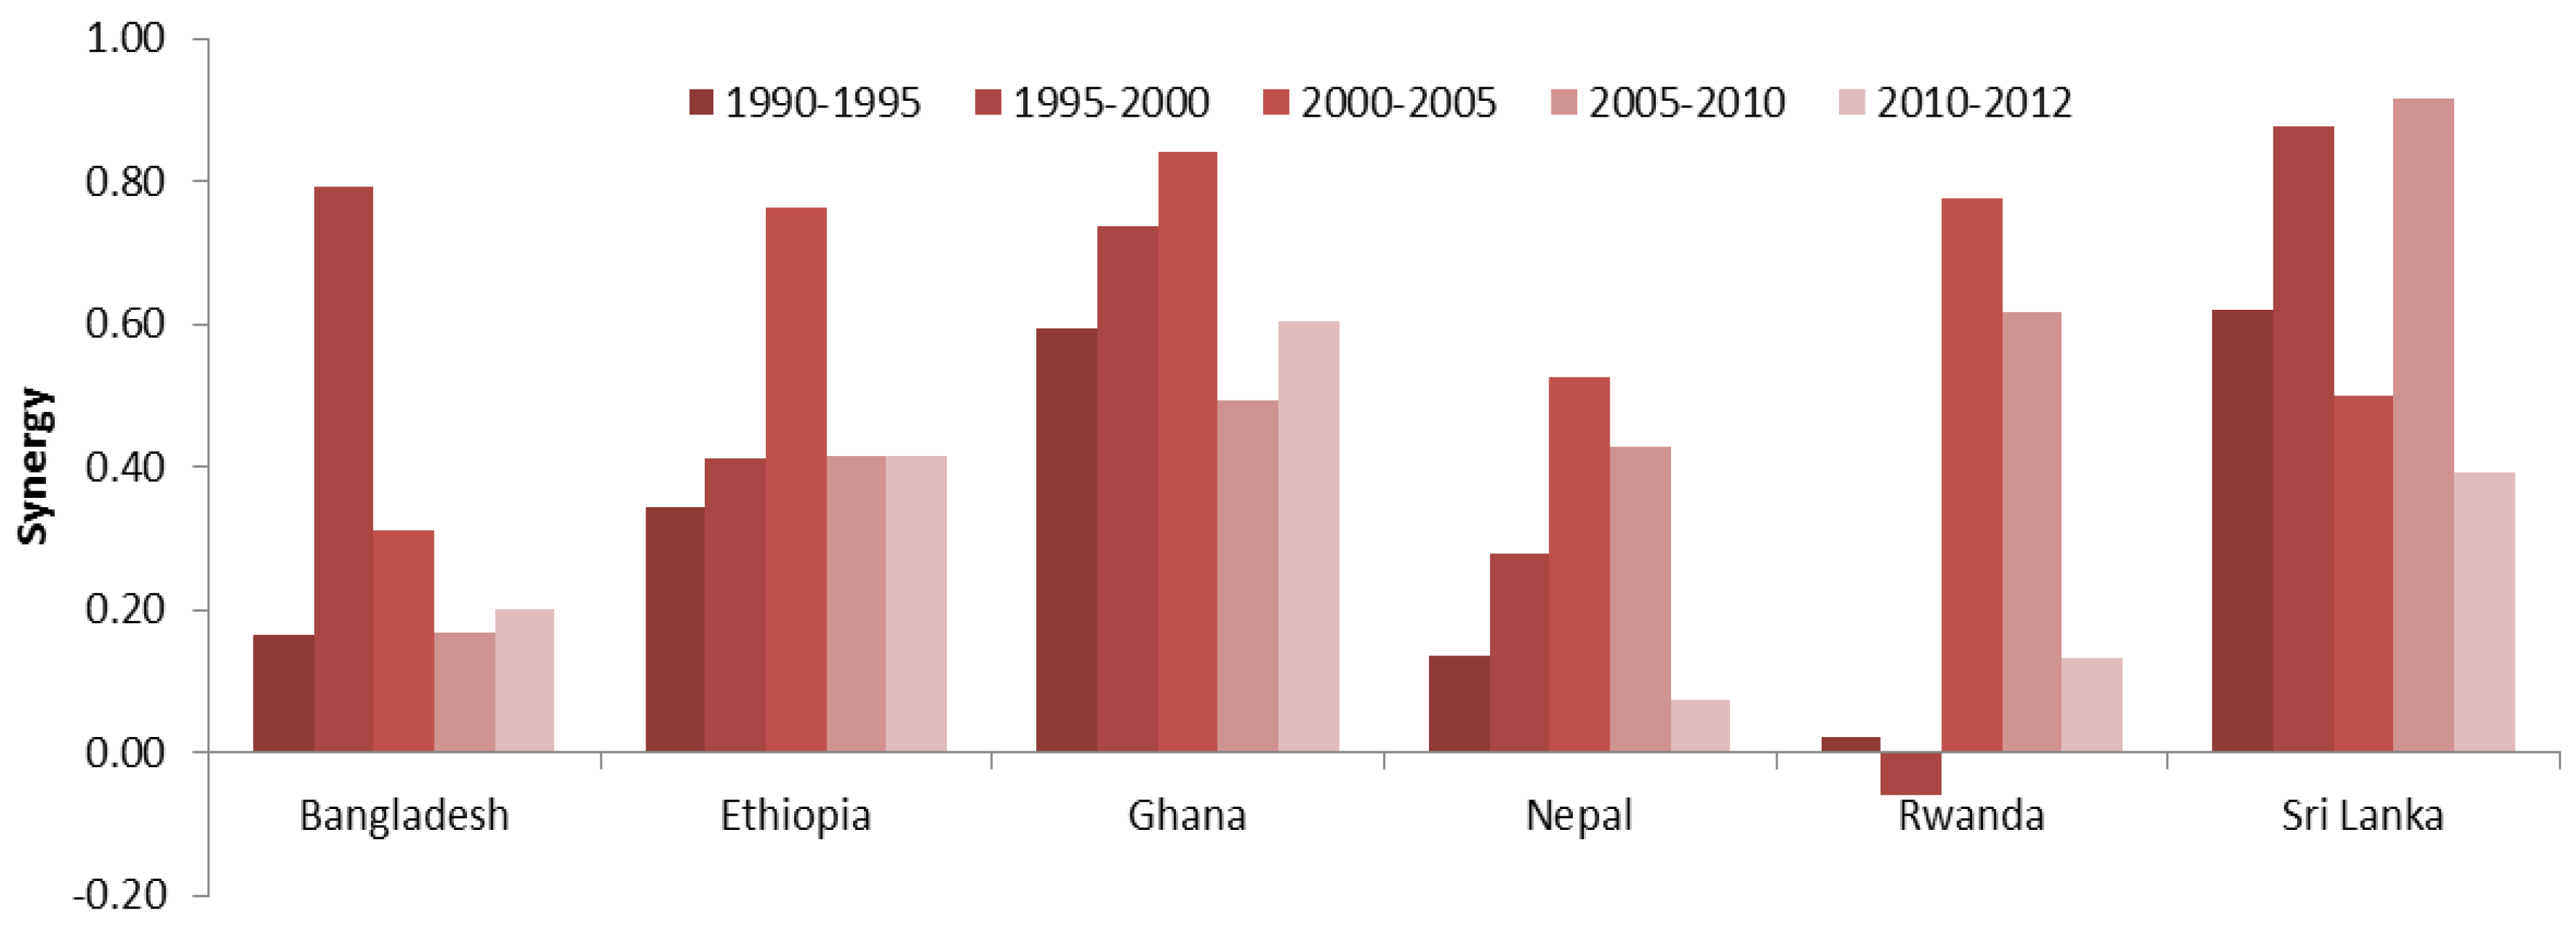
5.2. Synergy among SDG7 and SDG2

Figure 14 shows the share of the population with access to electricity (T7.1) (Figure 14, left) and the share of undernourished population (T2.1) (Figure 14, right) in Bangladesh, Ethiopia, Ghana, Nepal, Rwanda and Sri Lanka 1990–2012.
Ethiopia (from 83.4% to 34.7%) and Ghana (from 48.5% to 5.5%) have been successful in reducing undernourishment significantly. Similarly, undernourishment in Rwanda (from 53.7% to 37%); Bangladesh (from 34% to 17.5%), Nepal (from 22.4% to 8.5%) and Sri (from 31.5% to 25.5%) has been reduced in the same period.
In the synergy analysis, we used the number of population free from undernourishment and number of population with access to electricity in order to indicate positive development. All country cases show positive synergy between these two targets (access to electricity and free from undernourishment). However, the level of synergy is different over time and across countries (see Figure 15).
Average synergy effect between these two targets was higher in the case of Sri-Lanka and Ghana whereas the synergy was relatively lower in Ethiopia, Bangladesh, Nepal and Rwanda. In the case of Ghana, annual average agricultural production growth rate was 5% in the last two decades which has increased food security in Ghana and brought down the undernourishment to 5% [94]. Ghana’s agriculture policy stresses improving productivity, mechanization, irrigation and water management where the role of electricity is crucial [95,96]. However, the price of energy is important in determining the food sufficiency. High energy prices have a significant adverse impact on food availability. A study in Ghana has shown that 1% increment in the energy price could reduce the food sufficiency by 0.047 percent [97].
In Rwanda, the synergy was very low across the period of 1990–1995 and even negative between 1995 and 2000. In the 1990s, the undernourished population increased due to conflict/civil war. This is an unusual case. Despite some progress in electrification since then, Rwanda has not been able to reduce undernourishment significantly even after the end of national conflicts [98].

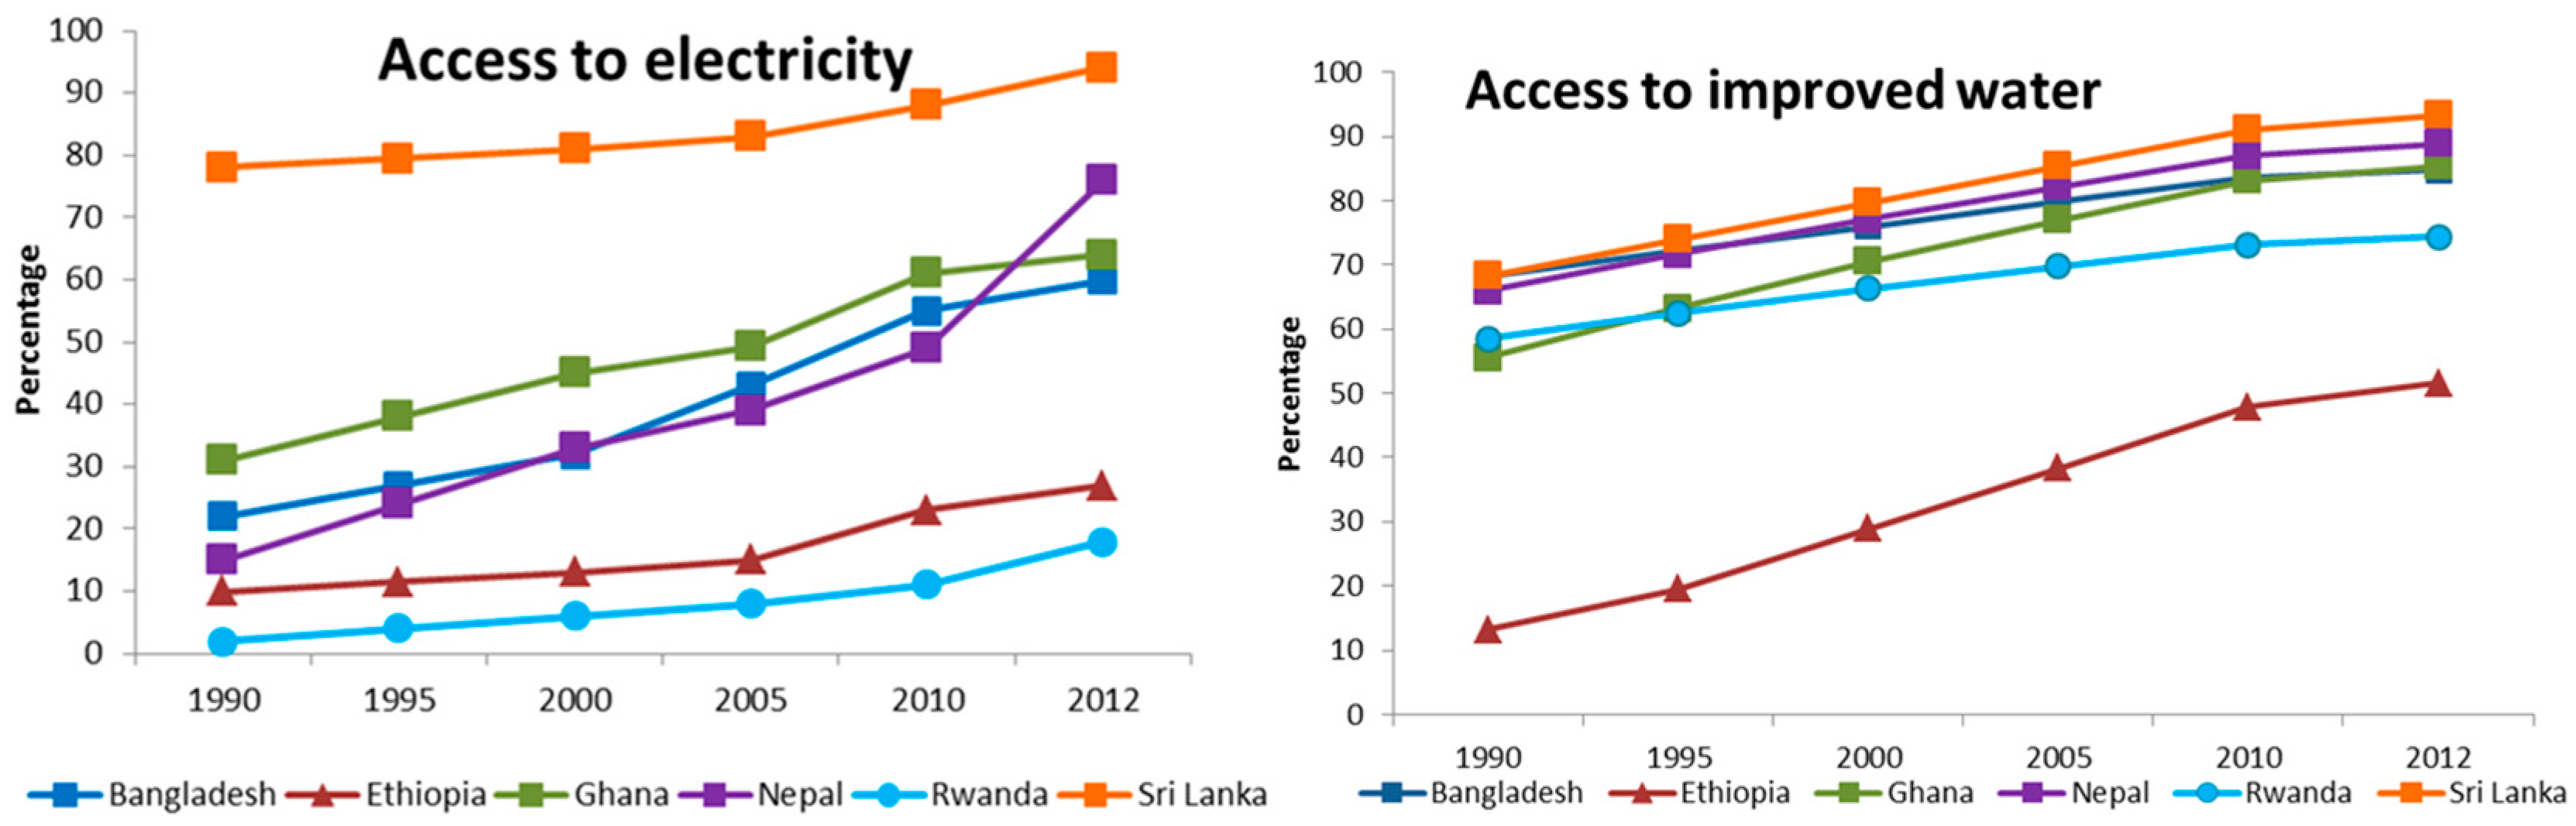
5.3. Synergy between SDG7 and SDG6

Figure 16 shows the share of population with access to electricity (T7.1) (Figure 16, left) and the share of population with access to improved water (i.e., drinking water source piped to housing premises viz. dwelling, plot or yard; and other sources, viz. public taps or standpipes, tube wells or boreholes, protected dug wells, protected springs and rainwater collection) (T6.1) (Figure 16, right) in the studied countries for 1990–2012.
Most of the countries have done significant progress in providing access to improved water in the last 2 decades (Bangladesh from 68.1% to 84.6%, Ethiopia from 13.2% to 51.6%, Ghana from 68.1% to 84.8%, Nepal from 65.9% to 88.9%, Rwanda from 58.5% to 74.3% and Sri-Lanka from 68.3% to 93.3%). Figure 17 illustrates the synergy between targets on access to electricity and access to improved water. All country cases show a clear positive synergy among the targets associated with access to electricity and access to water.
Among them, Ghana has relatively strong synergy followed by Sri-Lanka. Ghana National Water Policy [99] focuses on integrated water resources management, encouraging public and private partnerships. Over 95% of domestic water supplies for the villages and small towns are extracted from the ground sources, and electricity access enables water pumping and purification. Water Sector Strategic Development Plan has recognized the importance of reliable electricity access in providing improved water in urban areas and small towns. Coordination among Community Water and Sanitation Agency (CWSA), Ghana Water Company Limited (GWCL), Water Resources Commission (WRC) with energy ministry and its line agencies have been emphasized [100].
Sri Lanka’s national drinking water policy also recognizes access to safe drinking water as basic citizen right, and emphasizes collaboration and coordination among agencies for maximizing synergies in the sustainable provision of water services [101]. Increase in the electricity access has also helped in the expansion of the water supply provision in different parts of the country. However, the price of electricity significantly influences the cost of water delivery. The electricity cost for providing drinking water was around 24% of the total operational cost in Sri-Lanka [55]. Reducing the electricity cost is key for assuring affordable water supply. This could be achieved by energy management and energy efficiency improvement. Thus, understanding symbiotic relations among various sectors, and exploring them in the cross sectoral policies is important to achieve the sustainable development goals.

6. Conclusions and Way Forward

This study proposed a framework for evaluating the synergies and trade-offs among SDGs applying both qualitative and quantitative approaches. The framework developed under this article applied network analysis on multiple linkages and key challenges including economy, water, food and energy security. The network analysis shows the strong linkages among various targets. There are three reinforcing linkages and one dependent linkage among the targets associated with poverty alleviation (SDG1) and energy access (SDG7), nine reinforcing linkages among the targets associated with poverty alleviation (SDG1) and sustainable agriculture (SDG2), and six reinforcing linkages between poverty alleviation (SDG1) and clean water and sanitation access (SDG6). Similarly, four dependent linkages between SDG7 and SDG2 and three dependent linkages were observed between SDG7 and SDG6. Moreover, there exist two reinforcing linkages, two dependent linkages and one linkage imposing constraint among the targets associated with SDG2 and SDG6.
The study demonstrates sustainability analyses in terms of synergy among the SDGs in six developing countries: Bangladesh, Nepal and Sri Lanka from Southern Asia and Ethiopia, Ghana and Rwanda from Sub-Saharan Africa for the period of 1990–2012 using the Advanced Sustainability Analysis (ASA). The analysis has showed strong synergy among various SDGs targets. However, the synergies differ from country to country and over time. Ghana has relatively higher, and Rwanda lower potential synergy in the Sub-Saharan Africa, whereas Sri Lanka has relatively higher and Nepal has lower potential synergy in the South Asia among various targets associated with energy and other goals. Higher synergy values were evidenced where countries’ policy have recognized the importance of linkages among the cross-sectoral targets. For example, Ghana’s Energy Sector Strategy and Development Plan have well recognized the reinforcing linkages of energy and poverty reduction. Based on the emphasis given by individual countries on specific targets, and the level of previous achievements, the synergy might differ over time. Sri-Lanka is already at the last mile when it comes to access to electricity and ending poverty, thus achieving higher potential synergy among the targets becomes more difficult at this stage.
An advantage of the framework developed here is that the Advanced Sustainability Analysis helped in the quantitative evaluation of synergies and/or trade-offs among various targets, which is also useful in the strategic Nexus analyses. These evaluations could help to analyse if applied sectoral and cross-sectoral policies result in synergetic development of the different sustainability goals. The lessons learnt can be reflected in the used for policy improvements and coherency.
This framework has some limitations, as synergy/trade-off analysis is limited to pairwise targets. The precision of synergy analysis increases along with improved data. Since data for all the indicators/targets were not available on an annual basis, analyses have been made using five-year timeframes. Availability of annual data can help to track the synergy at regular intervals. This will enhance the relevance and applicability of such analysis. Thus, redefining the indicators to capture the objective of the SDGs targets better reflects the sustainability analysis. Nevertheless, the method suggested here serves as a point of departure for envisaging the linkages among the SDGs and tracking sustainable development in a more integrated way. Such an approach can help to develop coherent sustainability polices. Transition paths towards better sustainability can be analysed by such synergy analysis.

Acknowledgments

The authors would like to acknowledge the support of Finland Futures Research Centre, University of Turku for publishing this manuscript in an open access journal.

Author Contributions

Mainali (first author) collected the data, made necessary literature review in building the conceptual frame, and structured the paper. The first author did the analysis with the support from Luukkanen (second author) and fourth author (Kaivo-oja). Silveira (third author) has contributed in refining the overall structure of the paper. The second and fourth authors’ contribution is also important in defining the methodology with ASA. Further, all the authors have contributed in the interpretation of the results for drawing the conclusions.

Conflicts of Interest

The authors declare no conflict of interest.

Appendix A

Table A1. Assessed values of the indicators associated with different targets (1990–2012).
Country_YearT1.1 iiT2.1 iiiT2.3 iiiT6.1 ivT6.2 ivT 6.4 ivT7.1a iT7.1b i
Bangladesh_199031.770.02490.672.236.51007.923.37.19
Bangladesh_199542.374.32593.285.547.5849.732.010.73
Bangladesh_200054.3103.63384.499.859.6810.242.014.84
Bangladesh_200570.1118.53681.6114.172.5716.361.515.98
Bangladesh_201086.0125.64288.3126.684.6696.383.416.78
Bangladesh_201292.8128.54394.1131.794.1676.393.216.93
Ethiopia_199013.38.01238.16.31.30.04.82.16
Ethiopia_199520.916.61033.511.21.72003.56.63.01
Ethiopia_200030.229.11116.319.25.71868.38.64.01
Ethiopia_200541.641.81361.429.411.71508.211.53.38
Ethiopia_201055.354.81832.841.919.01415.820.12.44
Ethiopia_201261.560.22046.847.625.81323.324.92.02
Ghana_19907.27.5989.28.11.02103.14.50.29
Ghana_19959.212.61354.110.61.41724.76.40.88
Ghana_200011.515.71309.213.31.91627.98.51.60
Ghana_200515.318.91432.316.52.61345.010.52.56
Ghana_201019.922.71814.320.23.31265.614.83.76
Ghana_201222.024.11768.121.83.81186.216.34.29
Nepal_19904.114.51920.112.30.810685.72.84.17
Nepal_19955.716.11891.315.22.88850.15.14.92
Nepal_20007.618.52136.318.35.28467.17.85.71
Nepal_200512.021.22311.621.07.67604.59.95.77
Nepal_201020.524.12289.923.410.27405.813.25.68
Nepal_201224.225.22714.224.412.67207.120.95.62
Rwanda_19900.43.41042.64.22.41412.10.10.15
Rwanda_19911.04.11145.34.83.11460.20.30.15
Rwanda_20001.73.3848.35.33.71286.40.50.16
Rwanda_20052.54.61183.66.34.71002.00.70.18
Rwanda_20103.86.21930.17.55.9940.11.10.21
Rwanda_20124.46.82169.58.06.7878.21.90.22
Sri Lanka_199014.511.72965.011.712.13122.313.32.06
Sri Lanka_199515.012.23052.613.213.62881.614.22.95
Sri Lanka_200016.013.13338.214.915.12834.815.13.91
Sri Lanka_200518.013.53467.216.516.72684.616.14.47
Sri Lanka_201019.314.73974.318.318.52634.917.75.07
Sri Lanka_201219.815.23582.919.019.42585.219.25.29
Source: i World Bank Database [33]; IEA [34], ADB [35] ii UN database [36]; Bangladesh-HIES [37]; MOFED-Ethiopia [38]; GLSS-Ghana [39] iii FAO Database [40]; iv WHO [41].
Indicators and units used to major various targets are listed below.
T-1.1
Total number of people living on less than $1.25 a day (in millions)
T-2.1
Total number of people free from undernourishment (in millions)
T-2.3
Cereal yield (kg per Hectare)
T-6.1
Population using safely managed drinking water services (in millions)
T-6.2
Population using safely managed sanitation services (in millions)
T-6.4
Renewable internal freshwater resources (internal river flows and groundwater from rainfall) in the country (m3 per capita)
T-7.1
Population using: (i) reliable electricity; and (ii) clean cooking solutions in millions
Table A2. Populations in selected Countries, 1990–2012 (in millions).
Region199019952000200520102012
Bangladesh105.98118.63131.28142.93151.62155.26
Ethiopia48.157.2766.4476.6687.5692.19
Ghana14.6316.72518.8221.3924.325.54
Nepal18.7421.2423.7425.526.8727.50
Rwanda7.267.648.02910.2910.82
Sri Lanka17.117.87518.6519.3720.1220.40
Source: World Bank Database [33].

References

  1. Joshi, D.K.; Hughes, B.B.; Sisk, T.D. Improving Governance for the Post-2015 Sustainable Development Goals: Scenario Forecasting the Next 50 years. World Dev. 2015, 70, 286–302. [Google Scholar] [CrossRef]
  2. Hák, T.; Janousková, S.; Moldan, B. Sustainable Development Goals: A need for relevant indicators. Ecol. Indic. 2016, 60, 565–573. [Google Scholar] [CrossRef]
  3. Schmidt-Traub, G. Investment Needs to Achieve the Sustainable Development Goals: Understanding the Billions and Trillions; Working Paper; Sustainable Development Solutions Network (SDSN): New York, NY, USA, 2015. [Google Scholar]
  4. Weitz, N.; Nilsson, M.; Davis, M. A nexus approach to the post-2015 Agenda: Formulating integrated Water, Energy and Food SDGs. SAIS Rev. Int. Aff. 2014, 34, 37–50. [Google Scholar] [CrossRef]
  5. Waage, J.; Banerji, R.; Campbell, O.; Chirwa, E.; Collender, G.; Dieltiens, V.; Patcharanarumol, W. The Millennium Development Goals: A cross-sectoral analysis and principles for goal setting after 2015. Lancet and London International Development Centre Commission. Lancet 2010, 376, 991–1023. [Google Scholar] [CrossRef]
  6. Food and Agriculture Organization of the United Nations (FAO). The Water-Energy-Food Nexus: A New Approach in Support of Food Security and Sustainable Agriculture; FAO: Rome, Italy, 2014. [Google Scholar]
  7. World Economic Forum (WEF). Water Security: The Water-Food-Energy-Climate Nexus: The World Economic Forum Water Initiative; Waughray, D., Ed.; Island Press: Washington DC, USA, 2011. [Google Scholar]
  8. Hoff, H. Understanding the Nexus; Background Paper for the Bonn 2011 Conference: The Water, Energy and Food Security Nexus; Stockholm Environment Institute (SEI): Stockholm, Sweden, 2011. [Google Scholar]
  9. United States National Intelligence Council (US-NIC). Global Trends 2030: Alternative Worlds; United States National Intelligence Council: Washington DC, USA, 2012; p. 137.
  10. Endo, A.; Tsurita, I.; Kimberly, B.; Orencio, P.M. A review of the current state of research on the water, energy, and food nexus. J. Hydrol. Reg. Stud. 2017, 11, 20–30. [Google Scholar] [CrossRef]
  11. Food and Agriculture Organization of the United Nations (FAO). The State of the World’s Land and Water Resources for Food and Agriculture (SOLAW)—Managing Systems at Risk; FAO: Rome, Italy, 2011. [Google Scholar]
  12. Khan, E.U.; Mainali, B.; Martin, A.; Silveira, S. Techno-economic analysis of small scale biogas based poly-generation systems: Bangladesh case study. Sustain. Energy Technol. Assess. 2014, 7, 68–78. [Google Scholar] [CrossRef]
  13. Smajgl, A.; Ward, J.; Pluschke, L. The water–food–energy Nexus—Realizing a new paradigm. J. Hydrol. 2016, 533, 533–540. [Google Scholar] [CrossRef]
  14. Blanc, D.L. Towards Integration at Last? The Sustainable Development Goals as a Network of Targets; DESA Working Paper No. 141; United Nations Department of Economic and Social Affairs (UN DESA): New York, NY, USA, 2015. [Google Scholar]
  15. Luukkanen, J.; Vehmas, J.; Panula-Ontto, J.; Allievi, F.; Kaivo-oja, J.; Pasanen, T.; Auffermann, B. Synergies or Trade-offs? A new method to quantify synergy between different dimensions of sustainability. Environ. Policy Gov. 2012, 22, 337–349. [Google Scholar] [CrossRef]
  16. Halsnæs, K.; Garg, A. Assessing the Role of Energy in Development and Climate Policies—Conceptual Approach and Key Indicators. World Dev. 2011, 39, 987–1001. [Google Scholar] [CrossRef]
  17. Hicks, C.C.; Graham, N.A.J.; Cinner, J.E. Synergies and tradeoffs in how managers, scientists, and fishers value coral reef ecosystem services. Glob. Environ. Chang. 2013, 23, 1444–1453. [Google Scholar] [CrossRef]
  18. Duguma, L.A.; Wambugu, S.W.; Minang, P.A.; Van Noordwijk, M. A systematic analysis of enabling conditions for synergy between climate change mitigation and adaptation measures in developing countries. Environ. Sci. Policy 2014, 42, 138–148. [Google Scholar] [CrossRef]
  19. Landuyt, D.; Broekx, S.; Goethals, P.L.M. Unit Bayesian belief networks to analyse trade-offs among ecosystem services at the regional scale. Ecol. Indic. 2016, 71, 327–335. [Google Scholar] [CrossRef]
  20. Srivastava, P.; Hopwood, N. A Practical Iterative Framework for Qualitative Data Analysis. Int. J. Qual. Methods 2009, 8, 78–84. [Google Scholar] [CrossRef]
  21. Bruce, C.D. Questions arising about emergence, data collection, and its interaction with analysis in a grounded theory study. Int. J. Qual. Methods 2007, 6, 51–68. [Google Scholar] [CrossRef]
  22. Kaivo-oja, J.; Luukkanen, J.; Malaska, P. Advanced sustainability analysis. In Our Fragile World. Challenges and Opportunities for Sustainable Development. Encyclopedia of Life Support Systems and Sustainable Development; Tolba, M.K., Ed.; EOLSS Publishers Co. Ltd.: Oxford, UK, 2001; Volume 2, pp. 1529–1552. [Google Scholar]
  23. Kaivo-oja, J.; Luukkanen, J.; Malaska, P. Sustainability evaluation frameworks and alternative analytical scenarios of national economies. Popul. Environ. 2001, 23, 193–215. [Google Scholar] [CrossRef]
  24. Kaivo-oja, J.; Luukkanen, J. The European Union balancing between CO2 reduction commitments and growth policies. Energy Policy 2004, 32, 1511–1530. [Google Scholar] [CrossRef]
  25. Hoffrén, J.; Luukkanen, J.; Kaivo-oja, J. Decomposition analysis of Finnish material flows: 1960–1996. J. Ind. Ecol. 2001, 4, 105–125. [Google Scholar] [CrossRef]
  26. Luukkanen, J.; Kaivo-oja, J. ASEAN tigers and sustainability of energy use: Decomposition analysis of energy and CO2 efficiency dynamics. Energy Policy 2002, 30, 281–292. [Google Scholar] [CrossRef]
  27. Tapio, P.; Banister, D.; Luukkanen, J.; Vehmas, J.; Willamo, R. Energy and transport in comparison. Immaterialisation, dematerialisation and decarbonisation in the EU15 between 1970 and 2000. Energy Policy 2007, 35, 433–451. [Google Scholar] [CrossRef]
  28. Vehmas, J.; Luukkanen, J.; Kaivo-oja, J. Linking analyses and environmental Kuznets curves for aggregated material flows in the EU. J. Clean. Prod. 2007, 15, 1662–1673. [Google Scholar] [CrossRef]
  29. Kaivo-oja, J.; Vehmas, J.; Luukkanen, J. A Note: De-growth Debate and New Scientific Analysis of Economic Growth. J. Environ. Prot. 2014, 5, 1477–1481. [Google Scholar] [CrossRef]
  30. Southwood, K. Substantive Theory and statistical interaction: Five models. Am. J. Sociol. 1978, 83, 1154–1203. [Google Scholar] [CrossRef]
  31. Pachauri, S.; Cherp, A. Energy security and energy access: Distinct and interconnected challenges. Curr. Opin. Environ. Sustain. 2011, 3, 199–201. [Google Scholar] [CrossRef]
  32. Mainali, B.; Pachauri, S.; Rao, N.; Silveira, S. Assessing rural energy sustainability in developing countries. Energy Sustain. Dev. 2014, 19, 15–28. [Google Scholar] [CrossRef]
  33. World Bank Database. Sustainable Energy for All (SE4ALL) Database from World Bank, Global Electrification Database. 2016. Available online: http://data.worldbank.org/indicator/EG.ELC.ACCS.ZS (accessed on 6 July 2016).
  34. International Energy Agency (IEA). Access to Electricity Database, World Energy Outlook; IEA: Paris, France, 2015. [Google Scholar]
  35. Asian Development Bank (ADB). Assessment of Power Sector Reforms in Sri Lanka: Country Report; Asian Development Bank: Manila, Philippines, 2015. [Google Scholar]
  36. UN Database. Millennium Development Goals Database; United Nations Statistics Division: New York, NY, USA, 2016; Available online: http://data.un.org/Data.aspx?d=MDG&f=seriesRowID%3A580 (accessed on 10 June 2016).
  37. Bangladesh-HIES. Final Report of the Household Income and Expenditure Survey (HIES)-2010; Bangladesh Bureau of Statistics (BBS), Statistics Division, Ministry of Planning: Dhaka, Bangladesh, 2010.
  38. Development Planning and Research Directorate Ministry of Finance and Economic Development (MOFED)-Ethiopia. Ethiopia’s Progress towards Eradicating Poverty: An Interim Report on Poverty Analysis Study (2010/11); MOFED: Addis Ababa, Ethiopia, 2012.
  39. Ghana Statistical Service (GLSS)-Ghana. Poverty Profile in Ghana, Ghana Living Standard Survey Round 6; GLSS: Accra, Ghana, 2014. [Google Scholar]
  40. Food and Agriculture Organization Database (FAO Database). Food Security Indicators; Food and Agriculture Organization of United Nation: Rome, Italy, 2016; Available online: http://www.fao.org/economic/ess/ess-fs/ess-fadata/en/#.WIoBDU3JCow (accessed on 1 June 2016).
  41. WHO Database. Data on Water Supply and Sanitation; WHO/UNICEF Joint Monitoring Programme (JMP) for Water Supply and Sanitation; World Health Organization (WHO): Geneva, Switzerland, 2016. [Google Scholar]
  42. Loewe, M.; Rippin, N. Goal 1: End Poverty in All Its Forms Everywhere. Translating an Ambitious Vision into Global Transformation: The 2030 Agenda for Sustainable Development; Loewe, M., Rippin, N., Eds.; Discussion Paper; German Development Institute (DIE), Department “Sustainable Economic and Social Development”: Bonn, Germany, 2015. [Google Scholar]
  43. International Council for Science/International Social Science Council (ICSU/ISSC). Review of the Sustainable Development Goals: The Science Perspective; ICSU: Paris, France, 2015. [Google Scholar]
  44. Burchi, F.; Holzapfel, S. Goal 2: End Hunger, Achieve Food Security and Improved Nutrition, and Promote Sustainable Agriculture. Translating an Ambitious Vision into Global Transformation: The 2030 Agenda for Sustainable Development; Loewe, M., Rippin, N., Eds.; Discussion Paper; German Development Institute (DIE), Department “Sustainable Economic and Social Development”: Bonn, Germany, 2015. [Google Scholar]
  45. UN/SDGs. Sustainable Development Goals (SDGs). 17 Goals to Transform Our World. 2016. Available online: http://www.un.org/sustainabledevelopment/sustainable-development-goals/ (accessed on 12 October 2016).
  46. Food and Agriculture Organization (FAO). FAO and 17 Sustainable Development Goals; Food and Agriculture Organization (FAO) of the United Nations: Rome, Italy, 2015. [Google Scholar]
  47. Khandker, S.R.; Barnes, D.F.; Samad, H.A. The Welfare Impacts of Rural Electrification in Bangladesh. Energy J. 2012, 33, 187–206. [Google Scholar] [CrossRef]
  48. Yadoo, A.; Cruickshank, H. The role for low carbon electrification technologies in poverty reduction and climate change strategies: A focus on renewable energy mini-grids with case studies in Nepal, Peru and Kenya. Energy Policy 2012, 42, 591–602. [Google Scholar] [CrossRef]
  49. Gomez, M.; Silveira, S. Rural electrification of the Brazilian Amazon–Achievements and lessons. Energy Policy 2010, 38, 6251–6260. [Google Scholar] [CrossRef]
  50. Lenz, L.; Munyehirwe, A.; Peters, J.; Sievert, M. Does Large-Scale Infrastructure Investment Alleviate Poverty? Impacts of Rwanda’s Electricity Access Roll-Out Program. World Dev. 2017, 89, 88–110. [Google Scholar] [CrossRef]
  51. Diaz-Chavez, R.; Johnson, F.X.; Richard, T.L.; Chanakyad, H. Biomass Resources, Energy Access and Poverty Reduction (Chapter 21) within Bioenergy and Sustainability; World Bank: Washington, DC, USA, 2015. [Google Scholar]
  52. WHO/UNICEF. Progress on Sanitation and Drinking Water—2015 Update and MDG Assessment; Food and Agriculture Organization (FAO) of the United Nations: Rome, Italy, 2015. [Google Scholar]
  53. United Nations Development Programme (UNDP). Human Development Report 2006: Beyond Scarcity—Power, Poverty and the Global Water Crisis; UNDP: New York, NY, USA, 2006. [Google Scholar]
  54. Pories, L. Income-enabling, not consumptive: Association of household socioeconomic conditions with safe water and sanitation. Aquat. Procedia 2016, 6, 74–86. [Google Scholar] [CrossRef]
  55. Asian Development Bank (ADB). Sri Lanka’s Water Supply and Sanitation Sector: Achievements and a Way Forward; ADB South Asia Working Paper Series; ADB: Manila, Philippines, 2015. [Google Scholar]
  56. Christiaensen, L.; Demery, L.; Kuhl, J. The (evolving) role of agriculture in poverty reduction—An empirical perspective. J. Dev. Econ. 2011, 96, 239–254. [Google Scholar] [CrossRef]
  57. Klasen, S.; Reimers, M. Looking at Pro-Poor Growth from an Agricultural Perspective. World Dev. 2016, 90, 147–168. [Google Scholar] [CrossRef]
  58. Food and Agriculture Organization (FAO). The State of Food Insecurity in the World: Addressing Food Insecurity in Protracted Crises; FAO: Rome, Italy, 2010. [Google Scholar]
  59. Conceição, P.; Levine, S.; Lipton, M.; Rodríguez, A.W. Toward a food secure future: Ensuring food security for sustainable human development in Sub-Saharan Africa. Food Policy 2016, 60, 1–9. [Google Scholar] [CrossRef]
  60. Rasul, G. Food, water, and energy security in South Asia: A nexus perspective from the Hindu Kush Himalayan region. Environ. Sci. Policy 2014, 39, 35–48. [Google Scholar] [CrossRef]
  61. FAO-AQUASTAT. Main Database, Food and Agriculture Organization of the United Nations (FAO). 2016. Available online: http://www.fao.org/nr/water/aquastat/data/query/index.html?lang=en (accessed on 15 July 2016).
  62. Food and Agriculture Organization Corporate Statistical Database (FAOSTAT). Energy Use in Agriculture and Forestry; FAOSTAT: Rome, Italy, 2016; Available online: http://www.fao.org/faostat/en/#data/EE (accessed on 15 July 2016).
  63. Asian Development Bank (ADB). Food Security and Poverty in Asia and the Pacific: Key Challenges and Policy Issues; ADB: Manila, Philippines, 2012. [Google Scholar]
  64. Dombrowsky, I. Ensure Availability and Sustainable Management of Water and Sanitation for All, A Discussion Paper on Translating an Ambitious Vision into Global Transformation: The 2030 Agenda for Sustainable Development; Loewe, M., Rippin, N., Eds.; Deutsches Institut für Entwicklungspolitik: Bonn, Germany, 2015. [Google Scholar]
  65. Mugagga, F.; Nabaasa, B.B. The centrality of water resources to the realization of Sustainable Development Goals (SDG). A review of potentials and constraints on the African continent. Int. Soil Water Conserv. Res. 2016, 4, 215–223. [Google Scholar] [CrossRef]
  66. Freitas, A. Water as a Stress Factor in Sub-Saharan Africa; European Union Institute for Security Studies: Paris, France, 2013; Available online: http://www.iss.europa.eu/uploads/media/Brief_12.pdf (accessed on 7 March 2018).
  67. Intergovernmental Panel on Climate Change (IPCC). Climate Change 2014. Synthesis Report: Approved Summary for Policy Makers. IPCC Fifth Assessment Synthesis Report, 2014. Available online: http://www. ipcc.ch/ (accessed on 7 March 2018).
  68. World Water Assessment Programme (WWAP). The United Nations World Water Development Report 2015. Water for a Sustainable World; UNESCO: Paris, France, 2015. [Google Scholar]
  69. Global Energy Assessment (GEA). Global Energy Assessment: Toward a Sustainable Future; Cambridge University Press: Cambridge, UK; New York, NY, USA; The International Institute for Applied Systems Analysis: Laxenburg, Austria, 2012. [Google Scholar]
  70. The International Renewable Energy Agency (IRENA). Renewable Energy in the Water, Energy and Food Nexus; IRENA: Laxenburg, Austria, 2015. [Google Scholar]
  71. Biswas, W.K. Application of renewable energy to provide safe water from deep tube wells in rural Bangladesh. Energy Sustain. Dev. 2011, 15, 55–60. [Google Scholar] [CrossRef]
  72. Mainali, B. Renewable Energy Market for Rural Electrification in Developing Countries: Country Case Nepal. Licentiate Thesis, Royal Institute of Technology KTH School of Industrial Engineering and Management, Stockholm, Sweden, 2011. [Google Scholar]
  73. Barnes, D.; Halpern, J. Reaching the poor: Designing energy subsidies to benefit those that need it. Refocus 2001, 2, 32–34. [Google Scholar] [CrossRef]
  74. International Energy Agency (IEA). Water for Energy: Is Energy Becoming a Thirstier Resource? Chapter 17. Excerpt from the World Energy Outlook 2012; IEA: Paris, France, 2012. [Google Scholar]
  75. International Hydropower Association (IHA). Hydropower Status Report; IHA Central Office: London, UK, 2016. [Google Scholar]
  76. Zhang, L.; Yang, Z.; Chen, B.; Chen, G. Rural energy in China: Pattern and policy. Renew. Energy 2009, 34, 2813–2823. [Google Scholar] [CrossRef]
  77. Mukaka, M.M. Statistics Corner: A guide to appropriate use of Correlation coefficient in medical research. Malawi Med. J. 2012, 24, 69–71. [Google Scholar] [PubMed]
  78. Sustainable Energy for All Acceleration Framework-Ghan (SE4ALL-Ghana). Situational Analysis Report; SE4ALL: Abidjan, Ghana, 2012. [Google Scholar]
  79. Sustainable Energy for All Acceleration Framework-Ghan (SE4ALL-Ghana). Medium Term National Development Policy Framework Ghana, Ghana Shared Growth and Development Agenda (GSGDA), 2010–2013; Government of Ghana: Accra, Ghana, 2010.
  80. Barki, E.; Parente, J. Challenges and Opportunities of the Last Mile for the Base of the Pyramid: The Case of Brazil. Field Actions Science Reports [Online] 2014, Special Issue 12. Online Since 21 October 2014, Connection on 14 November 2016. 2014. Available online: http://factsreports.revues.org/3671 (accessed on 7 March 2018).
  81. Mainali, B.; Silveira, S. Renewable Energy Market in Rural Electrification: Country Case Nepal. Energy Sustain. Dev. 2012, 16, 168–178. [Google Scholar] [CrossRef]
  82. Mainali, B.; Silveira, S. Alternative pathways for providing access to electricity in developing countries. Renew. Energy 2013, 57, 299–310. [Google Scholar] [CrossRef]
  83. Thapa, S.; Acharya, S. Remittances and Household Expenditure in Nepal: Evidence from Cross-Section Data. Economies 2017, 5, 16. [Google Scholar] [CrossRef]
  84. Dahal, P. The impact of remittances on economic growth in Nepal: An analysis of a significant basis of development. Asia Pac. J. Public Adm. 2014, 36, 261–282. [Google Scholar] [CrossRef]
  85. Mainali, B.; Silveira, S. Financing off-grid rural electrification: Country case Nepal. Energy 2011, 36, 2194–2201. [Google Scholar] [CrossRef]
  86. Bhattacharyya, S.C.; Palit, D. Mini-grid based off-grid electrification to enhance electricity access in developing countries: What policies may be required? Energy Policy 2016, 94, 166–178. [Google Scholar] [CrossRef] [Green Version]
  87. Sarangi, G.K.; Pugazenthi, D.; Mishra, A.; Palit, D.; Kishore, V.V.N.; Bhattacharyya, S.C. Poverty amidst plenty: Case of renewable energy-based off-grid electrification in Nepal. In Mini-Grids for Rural Electrification of Developing Countries, Green Energy and Technology; Bhattacharyya, S.C., Palit, D., Eds.; Springer International Publishing: Cham, Switzerland, 2014. [Google Scholar]
  88. Gurung, A.; Oh, S.E. Conversion of traditional biomass into modern bioenergy systems: A review in context to improve the energy situation in Nepal. Renew. Energy 2013, 50, 206–213. [Google Scholar] [CrossRef]
  89. Heringtona, M.J.; Malakara, Y. Who is energy poor? Revisiting energy (in) security in the case of Nepal. Energy Res. Soc. Sci. 2016, 21, 49–53. [Google Scholar] [CrossRef]
  90. Ministry of Environment (MOE)-Nepal. Rural Energy Policy Nepal; Ministry of Environment: Kathmandu, Nepal, 2006.
  91. Rahut, D.B.; Behera, B.; Ali, A. Patterns and determinants of household use of fuels for cooking: Empirical evidence from sub-Saharan Africa. Energy 2016, 117, 93–104. [Google Scholar] [CrossRef]
  92. Tessema, Z.; Mainali, B.; Silveira, S. Mainstreaming and Sector wide approaches to sustainable energy access in Ethiopia. Energy Strategy Rev. 2014, 2, 313–322. [Google Scholar] [CrossRef]
  93. Behera, B.; Rahut, D.B.; Aryal, J.; Ali, A. Household collection and use of biomass energy sources in South Asia. Energy 2015, 85, 468–480. [Google Scholar] [CrossRef]
  94. Nicolai, S.; Hoy, C.; Bhatkal, T.; Aedy, T. Projecting Progress: The SDGs in Sub-Saharan Africa; Overseas Development Institute: London, UK, 2016. [Google Scholar]
  95. Ministry of Food and Agriculture (MoFA)-Ghana. Food and Agriculture Sector Development Policy (FASDEP II); MoFA: Accra, Ghana, 2007.
  96. Ministry of Food and Agriculture (MoFA)-Ghana. Ministry of Food and Agriculture: Pilot Program Based Budget (PBB) for 2013–2015; MoFA: Accra, Ghana, 2012.
  97. Adom, P.K. Determinants of food availability and access in Ghana: What can we learn beyond the regression results? Stud. Agric. Econ. 2014, 116, 153–164. [Google Scholar] [CrossRef]
  98. FAO, IFAD and WFP. The State of Food Insecurity in the World 2015. In Proceedings of the Meeting of the 2015 International Hunger Targets: Taking Stock of Uneven Progress, Rome, Italy, 16 September 2015; FAO: Rome, Italy, 2015. [Google Scholar]
  99. Ministry of Water Resources, Works and Housing (MoWRWaH)-Ghana. National Water Policy. Ministry of Water Resources, Works and Housing; Government of Ghana: Accra, Ghana, 2007.
  100. Ministry of Water Resources, Works and Housing (MoWRWaH)-Ghana. Water Sector Strategic Development Plan (2012–2025); MoWRWaH: Accra, Ghana, 2014.
  101. Ministry of Water Supply & Drainage (MoWSD)-Sri-Lanka. National Water Supply and Sanitation-2002; MoWSD: Nawala, Sri-Lanka, 2002.
Figure 1. Examined SDGs 1, 2, 6 and 7.
Sustainability 10 00815 g001
Figure 2. Analytical Framework for evaluating synergies and trade-offs among SDGs.
Sustainability 10 00815 g002
Figure 3. Key concepts of sustainability using the ASA approach. Economic growth (GDP), environmental stress (ES) and environmental intensity of economy (ES/GDP) [29].
Sustainability 10 00815 g003
Figure 4. (a) Synergy; (b) trade-off; and (c) delinking situations between two variables x and y determined by their changes ΔxΔy (Adopted from Luukkanen et al. [15]).
Sustainability 10 00815 g004
Figure 5. Linkages of SDG 1 with other three SDGs.
Sustainability 10 00815 g005
Figure 6. Linkages of SDG2 with other three SDGs.
Sustainability 10 00815 g006
Figure 7. Linkages of SDG6 with other three SDGs.
Sustainability 10 00815 g007
Figure 8. Linkages of SDG7 with other three SDGs.
Sustainability 10 00815 g008
Figure 9. Linkages among targets associated with SDGs 1, 2, 6 and 7. Sources: [4,6,14,43,44,46,51,52,58,63,64,65,70] and Authors’ elaboration. Short descriptions on targets (by 2030) are given below. For respective measuring indicator see Table 1.
Sustainability 10 00815 g009
Figure 10. Population share: with access to electricity (left); and living below 1.25 USD/day PPP (right).
Sustainability 10 00815 g010
Figure 11. Synergy: Population with access to electricity and population above poverty line of 1.25 USD/day PPP.
Sustainability 10 00815 g011
Figure 12. Population share: with access to clean energy for cooking (left); and living below 1.25 USD/day PPP (right).
Sustainability 10 00815 g012
Figure 13. Synergy for population that: (i) has access to clean energy; and (ii) is above poverty line of 1.25 USD/day PPP.
Sustainability 10 00815 g013
Figure 14. Population share: (i) with access to electricity (left); and (ii) living undernourished (right).
Sustainability 10 00815 g014
Figure 15. Synergy for population that: (i) has access to electricity (T7.1); and (ii) is free from undernourishment (T2.1).
Sustainability 10 00815 g015
Figure 16. Population share with access: (i) to electricity (left); and (ii) to improved water (right).
Sustainability 10 00815 g016
Figure 17. Synergy: Population with access to electricity (T7.1) and improved water (T6.1).
Sustainability 10 00815 g017
Table 1. Four SDGs examined, their specific targets and indicators [45].
SDGsSymTargets DescriptionMeasuring/Tracking Indicators
End poverty on all its form everywhereT-1.1By 2030, eradicate extreme poverty for all peopleNumbers of people living on less than $1.25 a day
T-1.2By 2030, reduce the poverty by half in all its dimensions according to national definitionsPopulation living below national poverty line
T-1.3Implement nationally appropriate social protection systems and achieve substantial coverage by 2030Multidimensional poverty index, population covered by national social protection programs
End hunger, achieve food security and improved nutrition and promote sustainable agricultureT-2.1By 2030, end hunger and ensure universal access to nutritious and sufficient foodPopulation below minimum level of dietary energy consumption (undernourished)
T-2.2By 2030, end all forms of malnutrition, including achieving, by 2025, the internationally agreed targets on stunting and wasting in children under 5 years of agePer cent of women of reproductive age (15–49) with anaemia
Prevalence of stunting and wasting in children under 5 years of age
T-2.3By 2030, double the agricultural productivity and incomes of small-scale food producersCrop yield or livestock yield
Number of agricultural extension workers per 1000 farmers
T-2.4By 2030, ensure sustainable food production systems and implement resilient agricultural practices that increase productivity and productionLosses from natural disasters, by climate and non-climate-related events (in US$ and lives lost)
T-2.5By 2020, maintain the genetic diversity of seeds, cultivated plants, farmed and domesticated animals, and their related wild species(Indicator on genetic diversity in agriculture)—not yet developed
Ensure availability and sustainable management of water and sanitation for allT-6.1By 2030, achieve universal and equitable access to safe and affordable drinking water for allHousehold or percentage of population using safely managed drinking water services
T-6.2By 2030, achieve access to adequate and equitable sanitation and hygiene for allPercentage of population using safely managed sanitation services
T-6.3By 2030, improve water quality by reducing pollution, halving the proportion of untreated wastewater and increasing substantially by recycling and safe reusePercentage of wastewater safely treated, ratio of treated waste water, directly used treated water to total produced municipal waste water
T-6.4By 2030, substantially increase water-use efficiency across all sectors and substantially reduce the water scarcityLevel of water stress: Renewable internal freshwater resources (internal river flows and groundwater from rainfall) in the country m3 per capita
Ensure access to affordable, reliable, sustainable and modern energy for allT-7.1By 2030, ensure universal access to affordable, reliable, and modern energy servicesShare of the population using: (i) reliable electricity; and (ii) modern cooking solutions in per cent
T-7.2Increase substantially the share of renewable energy in the global energy mix by 2030Share of renewable energy in total primary energy or electricity consumption
T-7.3Double the global rate of improvement in energy efficiency by 2030Rate of primary energy intensity improvement
Table 2. Pairwise Pearson Correlation among various targets (1990–2012).
IndicatorsSDG_T1.2SDG_T2.1SDG_T2.3SDG_T6.1SDG_T6.2SDG_T6.4SDG_T7.1
SDG_T1.210.94 ***0.58 **0.91 ***0.89 ***−0.32 *0.92 ***
SDG_T2.10.94 ***10.59 **0.99 ***0.95 ***−0.27 ns0.93 ***
SDG_T2.30.58 **0.59 **10.64 ***0.75 ***0.02 ns0.74 ***
SDG_T6.10.91 ***0.99 ***0.64 ***10.97 ***−0.27 ns0.94 ***
SDG_T6.20.89 ***0.95 ***0.75 ***0.97 ***1−0.3 *0.97 ***
SDG_T6.4−0.32 *−0.27 ns0.02 ns −0.27 ns−0.3 *1−0.25 ns
SDG_T7.10.92 ***0.93 ***0.74 ***0.94 ***0.97 ***−0.25 ns1
Note: Statistical significance level of correlation coefficients have been presented in stars: p > 0.05 (ns –not significant); p ≤ 0.05 *; p ≤ 0.01 **; p ≤ 0.001 *** (highly significant).

