Article

Biophysical and Socioeconomic State and Links of Deltaic Areas Vulnerable to Climate Change: Volta (Ghana), Mahanadi (India) and Ganges-Brahmaputra-Meghna (India and Bangladesh)

1
ARAID (Aragonese Agency for Research and Development) Researcher, Department of Economic Analysis, University of Zaragoza, 50005 Zaragoza, Spain
2
Basque Centre for Climate Change (BC3), 48940 Leioa, Spain
3
Jadavpur University, 700032 Kolkata, India
4
Kwame Nkrumah University of Science and Technology, Kumasi, Ghana
5
University of Ghana, Legon Boundary, Accra, Ghana
6
Ministry of Finance and Economic Planning, P. O. Box M40, Accra, Ghana
7
South Asian Network on Economic Modeling (SANEM), 1212 Dhaka, Bangladesh
*
Author to whom correspondence should be addressed.
Sustainability 2018, 10(3), 893; https://doi.org/10.3390/su10030893
Submission received: 19 January 2018 / Revised: 14 March 2018 / Accepted: 14 March 2018 / Published: 20 March 2018

Abstract

:
We examine the similarities and differences of specific deltaic areas in parallel, under the project DEltas, vulnerability and Climate Change: Migration and Adaptation (DECCMA). The main reason for studying Deltas is their potential vulnerability to climate change and sea level rise, which generates important challenges for livelihoods. We provide insights into the current socioeconomic and biophysical states of the Volta Delta (Ghana), Mahanadi Delta (India) and Ganges-Brahmaputra-Meghna (India and Bangladesh). Hybrid methods of input-output (IO) construction are used to develop environmentally extended IO models for comparing the economic characteristics of these delta regions with the rest of the country. The main sources of data for regionalization were country level census data, statistics and economic surveys and data on consumption, trade, agricultural production and fishing harvests. The Leontief demand-driven model is used to analyze land use in the agricultural sector of the Delta and to track the links with final demand. In addition, the Hypothetical Extraction Method is used to evaluate the importance of the hypothetical disappearance of a sector (e.g., agriculture). The results show that, in the case of the Indian deltas, more than 60% of the cropland and pasture land is devoted to satisfying demands from regions outside the delta. While in the case of the Bangladeshi and Ghanaian deltas, close to 70% of the area harvested is linked to internal demand. The results also indicate that the services, trade and transportation sectors represent 50% of the GDP in the deltas. Still, agriculture, an activity directly exposed to climate change, plays a relevant role in the deltas’ economies—we have estimated that the complete disappearance of this activity would entail GDP losses ranging from 18 to 32%.

1. Introduction

According to 2003 data, 2385 million people lived within the world’s coastal limit, which represents 41% of the global population. Twenty-one of the world’s 33 megacities are found on the coast. More than 50% of coastal countries have from 80% to 100% of their total population within 100 km of the coastline [1]. Also, various studies estimated expected growth of the population living in the low-elevation coastal zones [2,3] under different scenarios [4]. The calculated economic value of goods and services provided by coastal ecosystems showed that, altogether, coastal ecosystems contribute 77% of global ecosystem-service values [5]. The ecological, economic and social importance of coasts have long been studied and highlighted, and their deterioration due to human activities is intense and increasing [6,7]. Given its current status and climate change predictions, coastal environments will be confronted with serious environmental issues that should be dealt with in advance, in order to achieve sustainable development of the most valued locations of the world [1]. In particular, deltas have been identified as especially vulnerable to climate change and induced sea level rise [8,9] with foreseeable environmental, social and economic costs (indeed, Nicholls, et al. [8] place the global costs of adaptation to sea level rise -varying by elevation- in the range of 26–89 billion dollars per year, by 2040). Deltaic areas are also exposed to other climate-related hazards such as floods, droughts and storm events. Furthermore, it has been estimated that more than 500 million people currently live in deltas, adding to arguments for protection [9,10,11,12].
In order to better understand the potential impacts of climate change in deltas—especially those located in developing regions—and with the aim of assessing different adaptation options (including migration), it is essential to understand the complex connections between biophysical and socio-economic dimensions. Climate change affects the environmental conditions of deltas through changes in temperature, rainfall, salinity, nutrients, land availability and so forth. These changes in turn affect the provision of environmental goods in general and the productivity of crop and fisheries in particular. Ultimately, all these changes affect the livelihoods, income and employment opportunities of people engaged in the agriculture and fishery sectors. Indeed, these aspects relate to wider objectives, such as the Sustainable Development Goals (SDGs) [13] and in particular for poverty, health, education, and gender equality (especially when research such as that in Yadav, et al. [14] find large knowledge gaps regarding the vulnerability of women to changing and an uncertain climate). Furthermore, the cited impacts also affect people working in other economic sectors, directly or indirectly, through supply-chains in the agriculture and fishery sectors both in the delta and in other regions.
In this context (where understanding potentially affected activities under climate change will help future work on future scenarios), this article aims to gather insights into the current biophysical and socioeconomic state of four study sites (covering three deltas), studied in the project DEltas, vulnerability and Climate Change: Migration and Adaptation (DECCMA), with a special focus on the complex links between climate-exposed activities and the rest of the economy. This choice was based on a key topic—the study of deltas in developing countries—where the aforementioned vulnerability is more evident and adaptation capability is lower. Furthermore, the three deltas were considered representative in terms of population and area potentially affected—according to Ericson et al. [9], respectively as small, medium and large [9]: the Volta Delta (Ghana), Mahanadi Delta (India) and Ganges-Brahmaputra-Meghna (GBM), called here Indian Bengal (IB) Delta (we will also call it IBD) for the Indian side and simply Bangladeshi Bengal (BB) Delta for the Bangladeshi side. The maps of the four areas of study are provided in the Supplementary Material in Figures S1–S4.
Key insights expected from the study had to do with the socioeconomic and biophysical context of the deltas, and relations and interdependencies through the supply chain of goods and services in the delta, in the rest of the country and in the Rest of the World (RoW). We studied these aspects while also comparing the similarities and differences across countries, using databases of environmentally and socially extended multiregional input-output (MRIO) tables built specifically for DECCMA. The information from the MRIO tables is used in combination with different analytical methods to better understand the biophysical and socioeconomic state of the case study areas in the context of climate change, which we first studied by way of literature review and expert knowledge. Next, we focused on the analysis of economic activities directly or indirectly exposed to climate change by making use of MRIO databases and other knowledge generated in the DECCMA project. From this information, it became particularly obvious that in all deltas the main activities affected directly by climate change are agriculture and fishing, together with a few others in specific deltas such as forestry, mining, and activities related to tourism. Since the MRIO databases provide all the direct and indirect links of activities, we examined how, downstream in the supply chains, activities such as the food industry, retail trade, textiles, and so forth, are also indirectly affected by climate change.
Furthermore, the DECCMA project has a clear gender focus, given that the potential vulnerability of women is high, markedly so in several areas of South Asia where the seasonal rural-urban migration (especially of men) takes place across these coastal areas (see more on this in Prati, et al. [15]). Accordingly, our analysis also pays attention to gender issues, particularly in relation to employment.
The information obtained from this analysis will be used in DECCMA as background for the study of the effects of climate change in relation to migration and adaptation needs, which is the aim of project. In particular, the understanding of the current socioeconomic structures analyzed here, as well as the associated embodied socioeconomic and environmental flows, are going to be used throughout the project to understand how different natural resources and economic activities are likely to be affected by climate change, and which will be directly and indirectly impacted under different scenarios.
In Section 1.1, we introduce the case study areas. In Section 2, we present the methodology and data for the construction of the MRIO tables and we also present a framework for exploring the biophysical and economic structure of the deltas. Section 3 presents the results, first, on the comparison of the economic structure of the Delta and Non-Delta part of each country (which, for simplicity, we will call “Delta” and “Non-Delta”), including an analysis of the level of climate exposure of sectors and regions from a supply-chain perspective. Section 4 presents the conclusions and discussion.

1.1. Case Study Sites

In the following subsections, we present the study sites in terms of geography, demographics, while their climatic conditions are provided in the Supplementary Material (1.1). The delta definitions are given by the administrative boundaries, which fall either entirely or partially within the 5 m contour line of the river deltas.

1.1.1. The Volta Delta

The Volta Delta region constituting the DECCMA study area covers a total of 3301 km2 with an estimated total population of 863,810 in 2010. The area falls within the geological setting referred to as the Keta basin. The basin is filled with 870 meters of Paleozoic marine and non-marine sediment. This soft geology is generally comprised of quaternary rocks and unconsolidated sediments made up of clay, loose sand and gravel deposits [1]. The Volta River system—the main source of sediment supply to this basin—consists of a larger drainage basin, a broad delta plain, a narrow shelf, a steep upper slope, and a large basin floor. The Volta Delta lies primarily in the coastal savannah zone. The vegetation is primarily swampy, interspersed with short grassland and clumps of bush and trees, mangrove areas and the Savannah woodland. Figure S1 shows the physical map of the Volta delta region and the land cover can be seen in Figure S5 in the Supplementary Material.
The population distributions of districts in the Volta Delta area are shown in Table 1. It must be emphasized that the boundaries of some of the districts (e.g., North Tongu, Ketu) extend beyond the delta area.

1.1.2. The Mahanadi Delta

The Mahanadi Delta is drained by the network of three major rivers: Mahanadi, Brahmhani and Baitarini into the Bay of Bengal. The coastline of the delta is about 200 km long, which stretches from the south near Chilika to the north, up to the Dharma River. The delta covers an area of nearly 95,000 km2 and the upper part of the delta is highly populated. Sediment carrying rivers generally form deltas near the mouth where geologic, tectonic, geographic, climatic and environmental settings are suitable for formation. The Mahanadi River is one of them. The river starts building up its delta plain from Naraj where the undivided Mahanadi branches from its distributary system in the delta plain area. Mahanadi Delta is one of the largest deltas on the east coast of India.
The basin has an extensive area under agricultural use and the upper part of the delta is highly populated compared to the lower part of the delta. The Mahanadi Delta has subsurface features of depression and ridges, mostly covered with forest and low-lying areas under cultivation and human settlement. The land use practice in this delta changes over time depending on the sedimentation and morphology dynamics. Devastating floods in the delta continuously bring about changes in land use patterns. Chilika Lake, the largest coastal lagoon in Asia is situated in the far south of the delta (Figure S6 shows the land-cover of the Mahanadi Delta).
The DECCMA delta definition comprises five districts (Puri, Kendrapara, Bhadrak, Jagatsingpur, Khurda) of Odisha. As for the 2011 census, as shown in Table 2 the total population is around 8.03 million. In terms of literacy in the coastal districts, 76% of the population are literate, of which 54% are male and 46% are female, with Khordha having the highest male and female literacy rates. Women in the Mahanadi Delta region commonly experience many disadvantages. Most of their work is unpaid (which does not appear in employment statistics), having to work hard at home and often in the fields, while having less autonomy than their male counterparts over income and assets. Being poorly represented in policy and decision-making, their opportunities for human development are low. Women also suffer when men migrate (men comprising about 99% of the migrants from coastal areas) [17], left to run the households with increasing work burdens and decreased roles in the community (see more in Prati, et al. [15]).

1.1.3. The Indian Bengal Delta

The Ganges-Brahmaputra-Meghna (GBM) basin spans across Bangladesh, Bhutan, Nepal, China and India, and represents one of the largest estuarine regions of the world, the Sundarbans Delta. The IB Delta, situated in West Bengal, is comprised of two districts, North 24 Parganas and South 24 Parganas. The delta defined in DECCMA (by the pink border on the left of Figure S3) spreads across an area of 14,054 km2. The Government of India has declared 9630 km2 of area in the Sundarbans as the Sundarban Biosphere Reserve. The total forest area is 4264 km2 of which 1810 km2 is comprised of wetlands [18]. Figure S3 shows the map of the IB region, and Figure S7 shows the different land use patterns. Around 44% of the total land use pattern is under agriculture (cultivable land).
According to the 2011 Census, as shown in Table 3 the total population of North 24 Parganas is 10,009,781. The decadal growth rates of North 24 Parganas and South 24 Parganas are 12.04% and 18.17%, respectively. The growth rate of South 24 Parganas is much higher than the growth rate of 13.84% of West Bengal (the state they belong to) during the period of 2001 and 2011. As noted earlier, sex ratios in both the districts are almost identical (955 females per 1000 males) and are higher than the state-level figures of 950 females per 1000 males in West Bengal. As in the case of the Mahanadi Delta, women in the IB region commonly experience many disadvantages of the same kind, perhaps with different characteristics in terms of how migration takes place (higher proportion to a nearby mega city, as it is close to Kolkata, rather than to other states, and so forth).

1.1.4. The Bangladeshi Bengal Delta

According to the Statistical Year Book, the area of the GBM Delta on the Bangladesh side represents almost a third of the country (43,863 km2) of Bangladesh, covering 100,807 km2 of the Non-Delta (the rest of the country) (Statistical Year Book, [1]). Given the selection applied in DECCMA of administrative regions (region delimited in red in Figure S4, where in the top right corner it is represented in orange with respect to the whole country) that partially or entirely fall within the 5-meter contour, the delta definition of the BB represents 47,802 km2. Figure S8 shows the agro-ecological zones of Bangladesh (includes the BB Delta definition).
Looking at the demography, some 156 million people live in the delta, despite risks from floods caused by monsoons, heavy runoff, and tropical cyclones. Most of the BB Delta has a population density of some 1226 inhabitants per km2 making it one of the most densely populated regions on earth. The annual growth rate is 1.292% [1]. The population density is 793 per km2 for the delta region, compared to 1041 per km2 for the rest of the country. Table 4 shows this and summarizes the demographic profile of the Delta and Non-Delta areas. Women in the BB Delta region also tend to experience many barriers and disadvantages, including access to health services, economic opportunity, political participation, control of finances, or to safe evacuation in case of disasters. In this last aspect, women and girls’ acute vulnerability in disasters is due to a host of gendered factors, including cultural or religious restrictions on female mobility, as well as differences in the socialization of girls which means they may not be equipped with the same survival skills as their brothers. Previous cases revealed how many women in Bangladesh did not leave their houses during floods because it was regarded as culturally inappropriate, or did not have sufficient swimming skills [20,21]. Also, it is not only in crisis situations where women and girls are disproportionately vulnerable to the consequences of a changing climate. Because they are (although this is not always well reflected in the documented employment statistics as we will see) the main actors in the home and in household food production (subsistence agriculture, household nutrition, water and fuel collection), they tend to be more directly reliant on natural resources and are particularly vulnerable as resources become scarce.

2. Methodology and Data

In this section, we describe the general approach for the construction of the DECCMA MRIO tables. We present the analytical tools which, in combination with the MRIO tables, will serve to analyze the socioeconomic structure of the case study areas in the context of climate change. In the Supplementary Material, we present the “1.2. Particularities of the construction of the input-output table of the study sites” describing the data, data sources and procedures. Among these we highlight the need for labor force surveys that the International Labor Organization (ILO) gathers [11], notably for India and Ghana, in order to gather information on labor by skill type. From the national statistics, the census data on employment (also by gender) typically comprises 17 activities in India and 21 in Ghana and Bangladesh. Also, it is worth highlighting that for the IB delta (for both the North and South 24 Parganas) we had additional detailed information by sector, not only on the value-added, consumption, production (in the case of agriculture, also productivity data by crop), and so forth, but also on intermediate goods provision such as water and electricity. For the BB it was worth considering the use of the national IO table 2012—which has 86 sectors—the private consumption from the Household Income and Expenditure Survey (with 327 items of both food and non-food goods) [22].

2.1. Construction of Climate Change: Migration and Adaptation Multiregional Input-Output Tables

The IO tables describe in monetary terms the flows of goods and services between all the individual sectors of a national/regional economy and the use of goods and services by final users. These tables are usually developed by National Statistical Institutes and are widely used in economic and environmental analysis. Figure 1 shows the structure of a typical national IO table for a single region (or country), where Z is the matrix of intermediate deliveries and its element z i j denotes the sales of sector i to sector j; y is the vector of final demands (i.e., private consumption, government consumption and investments) and its element y i indicates the final demand for goods produced by sector i; e is the column vector of sectoral exports to the RoW; x is the column vector of gross outputs by sector; m is the vector of imports from the RoW; and v is the vector of value-added by sector. Lower-case letters are used to indicate vectors, capital letters indicate matrices, italicized lower-case letters indicate scalars (including elements of a vector or matrix). Subscripts indicate industries and superscripts indicate countries. Vectors are columns by definition, row vectors are obtained by transposition, denoted by a prime (e.g., x ). Diagonal matrices are denoted b ^ (e.g., x ^ ).
The MRIO tables represent the socioeconomic structure of two or more countries/regions and show, in addition to the information reported by the single region IO tables, the flows of goods and services between the countries/regions covered by the MRIO table. The MRIO tables can be constructed by putting together information from various single region IO tables or by regionalization of a single region IO table into several sub-regions. The latter is the method followed in DECCMA, as we describe at the end of this subsection.
The 4 MRIO tables developed in the DECCMA project, distinguish 2 regions, the “Delta” and the rest of the country, which for simplicity we call “Non-Delta.” They also include information on the exports to, and imports from, the RoW. Figure 2 shows the structure of the DECCMA MRIO table, where the set of red squares represent transactions matrices and Z r s . is the matrix of intermediate deliveries from region r to region s (being r, s the Delta and Non-Delta regions) and its element Z i j r s denotes the sales of sector i in region r to sector j in region s; y r s is the matrix of final demands (i.e., private consumption, government consumption and investments) and its element y i r s indicates the final demand in region s for good i produced by region r; e r is the column vector of exports to the RoW of region r; x r is the column vector of gross outputs in region r; m r is the transpose of the vector of imports from the RoW in region r; and v r is the transpose of the vector of value-added by sector in region r.
Further, the global MRIO table is extended with a vector l r with element l t r indicating land used by sector i in country r. Also, the table is extended with vectors l t r with elements l i , t r indicating labor by sector i in country r; by type t (skilled/unskilled, male/female). These employment vectors are reflected outside of the computation shown below but are used in those following Equation (4). The data on employment by each sector and category (skill/gender) is obtained from the particular country census and labor surveys, at the national level also typically consistent with ILO [11], (see the Supplementary Material we describe the “Particularities of the construction of the IO table of the study sites”).
The components of the MRIO table can also be expressed in matrix and vector form as follows
Z = [ Z N D , N D Z N D , D Z D , N D Z D , D ]     F = [ y N D , N D y N D , D e N D y D , N D y D , D e D ]   e = [ e N D e D ] x = [ x N D x D ]       m = [ m N D m D ]     v = [ v N D v D ]
The relation between the different components of the MRIO table is defined by the following accounting equations
x = Z i + F j   and   x = Z i + m + v
where i and j are summation vectors of appropriate dimensions (i.e., vectors with ones) of appropriate length.
The starting points for the construction of the DECCMA MRIO are the national IO tables of Ghana, India and Bangladesh, as reported by the Global Trade Analysis Project (GTAP) version 9 database. The construction of these MRIO tables basically consists of splitting the national IO tables (which look like Figure 1) into the Delta and Non-Delta parts. In order to do so, we use the most recent dataset from the GTAP 9 with detailed accounts of regional production and consumption, bilateral trade flows, land use (also of energy flows, and CO2 emissions), all for the base year 2011 [25]. The list of GTAP sectors are shown in the Supplementary Material in Table S1. To perform the regionalization, we first choose the departure matrix of a country, surrounding or neighboring region with an economy similar to the one under consideration, which in this case is the country table for 2011 of GTAP 9. We follow one of the most popular regionalization methods, a variant of the Simple Location Method (SLQ), which has been recently developed and defended as superior to many others and is more appropriate for the type of available tables, the Flegg’s Location Quotient (FLQ), see [26,27,28,29,30,31,32]. To use this method, and regionalize the original national table and data of intermediate transactions to the delta, the employment and production totals by sector are the main data source. Then, completing other parts of the table with “real” or specific delta data (e.g., the rows of employment and land use, columns of household consumption, government and exports), this “real” or “superior” data is added to make the best use of the available local data and avoid possible biases. A full description of the method for the construction of the DECCMA MRIO tables has been shown in [33]. Also, in the Supplementary Material, we describe the “Particularities of the construction of the IO table of the study sites.” Once constructed the Delta and Non-Delta trade parts, also based, as for the domestic table (with the FLQ), on the relative importance of the sectors in each region, the domestic parts of the Non-Delta are obtained by difference, since the addition of the four parts in the intermediates matrix, and another four parts in the final demand obviously give us again (respectively) the total matrix of intermediates and of final demand of the country table. The resulting distinctions between “Delta” and “Non-Delta” parts enable us to get the four MRIO tables that follow a structure as with the one reported in Figure 2.

2.2. Input-Output Analysis and Extensions

The MRIO tables developed in DECCMA can be used to derive a set of indicators related to the composition of the GDP by industry in the delta, the characteristics of the employment by sector, skill and gender, or the use of resources such as land in the primary sectors (see Section 3.1). In this sense, the MRIO in themselves represent a novel comprehensive dataset containing valuable information to understand the structure of the economy of the countries analyzed and paying special attention to the role of the economy in the deltas.
However, the combination of MRIO tables with different analytical tools offers a powerful framework for further assessing and understanding the linkages of national and regional economies and the relevance of different economic sectors. In our case we use two analytical tools from the IO field: the classical Leontief demand-driven model [34,35] (see also [36,37,38,39]) and the Hypothetical Extraction Method [40,41,42,43,44].
We will use the Leontief demand-driven to analyze land use in the agricultural sector of the Delta and to track the links with the final demand (the demand of final goods and services, that is, those that are not further transformed within production processes) of the Delta, Non-Delta and RoW.
The departing point of the Leontief demand-driven model is the accounting equation:
x = Z i + F j
This equation can be transformed into the Leontief demand-driven model represented by the following expression:
x = ( I A ) 1 F j
where A = Z ( x ^ ) 1 is the matrix of technical coefficients of the multiregional table indicated above, and the element a i j r s = z i j r s / x i j s of A represents the intermediate inputs from sector i in region r required by sector j in region s to produce one unit of its output; and B = ( I A ) 1 is the Leontief inverse matrix and the element b i j r s represents the total (direct and indirect) output of sector i in region r that is required to satisfy one unit of final demand for the goods produced by sector j in region s. Finally, being w = l ( x ^ ) 1 a vector of unitary land use coefficients per unit of output, and using Equation (1) we can define the matrix of land use multipliers as follows:
M = w ^ ( I A ) 1 = w ^ B
where the element m i j r s of M represents the land use by sector i in region r that is required to satisfy one unit of final demand for the goods produced by sector j in region s. This multiplier can be used to better understand the interlinkages of the different components of the economy. For example, the cropland used by the rice sector in the Delta required to satisfy the demand in the Non-Delta for products from the foods industry in the Non-Delta: m r i c e , f o o d D , N D   y f o o d N D , N D , can be used to understand to what extent the food security in the Non-Delta relies on land availability in the Delta. The results of this analysis are presented in Section 3.2. Similarly, making use of w t = l t ( x ^ ) 1 as a generic vector of unitary labor (also by type t, that is, gender or skill) coefficients per unit of output, and using Equation (4) we define the labor (also by type, that is, gender or skill) multipliers as in Equation (5).
Finally, we make use of the so called Hypothetical Extraction Method to evaluate the importance of the hypothetical disappearance of a sector or a group of sectors (in our case we will present results for agriculture), not only directly in the GDP of the sector, but also considering the losses in other sectors which directly or indirectly depend on the agricultural sector, given the existing linkages.

2.3. Hypothetical Extraction Method

Of the main two possibilities of computing the Hypothetical Extraction Method, we will follow the one by [43,45,46] in which B is the block (group of sectors, agriculture in our results, representing with −B all other sectors) to analyze, we make A B , B = A B , B = A B , B = 0 , that the new matrix of technical coefficients would read as follows (The other possibility, shown in [39,44,47,48] implies extracting two of the three matrices in which block K has any external influence, understanding that the Hypothetical Extraction Method aims at measuring the cost of the missing linkages with other sectors and not the internal ones.).
C = [ A B , B A B , B A B , B A B , B ] = [ 0 0 0 A B , B ] = 0
and the matrix of multipliers after eliminating the sector would be r ^ ( I C ) 1 , being r = v ( x ^ ) 1 a vector of unitary value-added coefficients per unit of output.
The interpretation can then be seen as similar to the classical multiplier method, based on [49] in which backward linkages and forward linkages are defined, and a sector is “key backward” (“forward”) if its push or dispersion (pull or absorption) power is above the average sectoral impact. In this case, the absolute total linkage losses can be deconstructed into two parts: the one related to the costs of satisfying final demand of the B-extracted sectors, which refers to the backward linkages of group B on the rest of the economy, and those costs that are necessary to satisfy the final consumption of the remaining sectors that correspond to the definition of forward linkages of group B on the rest of the economy. In our results we will focus on the first, making use of the backward linkages.
Regarding the software used, all the databases compiled are ultimately (previously statistical data on census, and also in formats which we extract and organize in SPSS) organized into Excel files to make computations within it and with the Matlab software (all from the year 2013). Most maps have been developed within the (DECCMA) consortia with Geographical Information Systems software such as ArcGIS.

3. Results

3.1. Overview of the Economy of the Deltas

The GDP per capita in the year 2011, based on purchasing power parities (PPP) shown in Figure 3 reveals that most of the deltas have a smaller GDP per capita than that of the rest of the country, except for the BB, where a more similar figure appears. Interestingly the lowest GDP per capita appears for the Volta Delta and Ghana (1050 and 1200 billion U.S.$/person, respectively) followed by the BB and Bangladesh (1600 and 1500 billion U.S.$/person, respectively). The highest GDP per capita of the deltas appears in the IBD (around 2350 billion U.S.$/person), while the Mahanadi almost reaches 2000 billion U.S.$/person. In both cases though, this measure appears to be much lower than for the rest of the country (around 3160 in both cases, since these deltas represent a small share of the whole country in many aspects).
With respect to the sectoral composition of the GDP (the Value-added, VA), from the 57 sectors of the MRIO tables of the GDP of the Delta and Non-Delta regions in the 4 case study areas, we present in Figure S9 the results aggregated for 16 categories of sectors.
Comparing the structure of the deltas, it can be observed that the share of the agricultural sectors is lower in the Indian and Bangladeshi parts of the GBM Delta (below 15% of the GDP in both cases) than in the Mahanadi (17%) and the Volta (21.9%). In the three Asian deltas the contribution of the services, trade and transportation sectors represent more than 50% of the total GDP of the economy, while in the Volta they represent 40%. In the BB Delta the construction sector is quite strong in relation to the other three deltas (14.7%) while industrial activities (due to transformation of agricultural goods in the food industry, and others such as salt-mining) are especially relevant in the Volta (almost 20%). Figure S9a shows the strong importance of the primary sectors in the Volta Delta, notably the fishing sector, which is much larger compared with the rest of the country (7.4% vs. 1.7%). On the other hand, employment in services of public administrations, finance & insurance, in construction, and surprisingly (but also occurring in most deltas) in crop production, is higher for the rest of the country than for the delta. In the Mahanadi Delta, the contribution of the primary sector is of 17% of the value-added, and fishing contributes 3% of the value-added. In the case of the IB Delta, the fishing sector is clearly much bigger compared with the rest of the country (4.1% vs. 0.8%), and the IB Delta also has a higher representation of the trade-transport sectors (31.9% vs. 22.9%).
Regarding employment, as shown in Figure S10 in the Supplementary Material, in Ghana, about 72% of Non-Delta labor works to satisfy the final demand (FD) of the Non-Delta itself, 2% to satisfy the FD of the Delta region and 26% to satisfy the FD of the RoW. Whereas, about 68% of the Delta labor satisfies the FD of the Delta itself, 17% to satisfy the FD of the Non-Delta and 15% of labor within the Delta satisfies the FD of the RoW.
In the Mahanadi Delta, we can see the relatively modest contribution of Delta demand in Non-Delta employment (as it is a smaller area, while the employment in India is estimated for 2011 as 457 million 878 thousand people). Still, in absolute terms it represents an employment of 1 milllion 608 thousand people to satisfy the goods and services demand in the Delta. On the other hand, we observe on the right-hand side how employment in the Delta (2 million 488 thousand people) requires a significant proportion (around 35%) to satisfy the FD of the Non-Delta, while a much smaller proportion (less than 10%) is required to satisfy the FD of the Rest of the World.
The IBD shows, on the left-hand side, the relatively modest contribution of Delta demand in the Non-Delta employment (as it is a smaller area, while the employment in India is estimated for 2011 to be 458 million people). Still, in absolute terms it represents an employment of 3 million 398 thousand people to satisfy the goods and services demand in the Delta. On the other hand, we observe on the right-hand side how the employment in the Delta (5 million 688 thousand people) requires a significant proportion (more than 45%) to satisfy the FD of the Non-Delta, and a non-trivial proportion (more than 10%) to satisfy the FD of the Rest of the World. In the BB, employment in the Delta follows a similar pattern to the Volta Delta and the Mahanadi Delta. However, in the case of employment in the Non-Delta it is worth noting the high 10% required to satisfy the FD of the Delta, revealing the importance of the Delta to the whole of Bangladesh. Figure S12 in the Supplementary Material show the employment by sector within the Delta, extending the results of Figure 4.
With regards to employment distribution by gender, the results shown in Figure S12 in the Supplementary Material reveal, for Ghana, that out of the total males employed in the Non-Delta, 73% work to satisfy the FD of the Non-Delta itself, 25% for RoW, while 2% to work to satisfy the FD of the Volta Delta region. Likewise, of the males employed in the Delta, 70% work to satisfy the FD of the Delta region itself, 14% satisfy the FD of the RoW and 16% the Non-Delta. This trend is not different for female employment in terms of regional demand. While the majority of females within the Delta work to satisfy the FD of the Delta itself, the majority of females within the Non-Delta work to satisfy the FD of the Non-Delta itself. This implies that in both Delta and Non-Delta regions, the different gender categories of labor work to satisfy local consumption.
Similarly, Figure S13 shows the distribution of employment by gender in major sectors across the regions. It is revealing that in the Volta Delta, agriculture is the number one male employer across regions, whilst the service sector employs the most females. Agriculture employs 45% of Non-Delta males and 41% of Delta males, while the service sector employs 48% of Non-Delta females and 44% of Delta females. The results also reveal that there are almost no females in the construction sector across the regions, which is mostly due to the lack of a trade component involved with these goods and services. On the other hand, in the food industry across the regions, more women than men are found in relative terms. In the Mahanadi Delta, as observed in Figure S12b the work of females satisfies, directly and indirectly, less of the final demand from other countries (both in the Non-Delta and in the RoW) than the work of males. In Figure S13b we observe the work of women in the Delta mostly in services, manufacturing and fishing, and also in the construction sectors, while they are less prevalent, relatively, in agriculture and energy.
Regarding the IBD, we may observe in Figure S12c how the work of females directly and indirectly satisfies a greater part of the demand from abroad (both in the Non-Delta and in the Rest of the World) than the work of males. In Figure S13c we observe the work of women in the Delta mostly in the services, manufacturing and fishing, while they are relatively less prevalent in agriculture, energy or construction. In the BB, we observe that the work of females directly and indirectly satisfies more of the FD from the Rest of the World than the work of males, however it is worth noting just how large the proportion of female employment is that serves to satisfy the demands of the Delta itself.
All the aspects above emphasize the socioeconomic links across regions, which are of major importance to the central purpose of the analysis of this work: the embedded biophysical relations. Table 5 examines the agricultural land of the Delta by agricultural sector. The direct agricultural land use is clearly dominated by pastureland, which is assigned to the production of raw milk, of animal products NEC. (“Not Elsewhere Classified”) and also to other crops and vegetables, fruits and nuts.
In the case of the Mahanadi delta, the direct agricultural land use is clearly dominated by paddy rice (close to a million hectares), but this changes enormously when we look at the embodied agricultural land used in the FD for goods and services. In the case of the IB Delta, the direct agricultural land use is also clearly dominated by paddy rice (above 800 thousand hectares), but this changes enormously when we look at the embodied agricultural land used in the FD for goods and services. In the BB, the direct agricultural land use is clearly dominated by paddy rice (3 million hectares), but this changes notably when we look at the embodied agricultural land used in the FD for goods and services as we will see in Section 3.2. In the Volta Delta, most of the agricultural land is used for livestock, while in the case of crops, the area is used for cultivating vegetables, fruit, nuts, and for cereals.

3.2. Demand Side Analysis of Land Use of the Deltas

The land use extensions, in combination with the MRIO tables and the Leontief demand-driven model, allow for a better understanding of the extent to which the consumption in the Delta and Non-Delta areas rely on the land use of the Delta. This information is especially useful in the context of the potential land losses in the Deltas due to climate change. Figure 5 shows the ultimate destination (Delta, Non-Delta and RoW) of the cropland and pasture land used in each delta. Notably the BB Delta (closely followed by the Volta) shows the highest share of Delta agricultural land which ends up used for the FD for the Delta itself. By contrast, the Mahanadi shows the highest share of Delta agricultural land which ends up used for the FD for the rest of the country.
For the computation of embodiments and footprints, we illustrate, as an example, the case of agricultural land use (in physical units) in Figure 6.
For the Volta Delta, Figure 6a examines the embodiment of agricultural land of the delta in the demanding regions (delta; non-delta and Rest of the World). We can observe how the embodied land use in the animal products NEC is particularly relevant, mostly occurring to satisfy the (exports) FD of the Non-Delta (also some for the RoW). We also observe how sectors that do not directly use much agricultural land, such as the food industry sectors, have notable embodied (directly and indirectly) agricultural land levels.
In the case of the Mahanadi Delta, we observe how the embodied land use in processed rice, cereal grains, oilseeds, vegetables and fruits, raw milk and trade is non-trivial, mostly occurring to satisfy the (exports) FD of the Non-Delta (also partly the RoW). In the case of the IB Delta, the embodiment of agricultural land of the Delta across demand for the regions (Delta; Non-Delta and Rest of the World). We observe how the embodied land use for raw milk is also relevant, mostly occurring to satisfy the (exports) FD of the Non-Delta (also partly the RoW). We also observe how sectors not directly using so much agricultural land, such as the food industry and textile sectors, have notable embodied (directly and indirectly) agricultural land levels. We observe how the embodied land use for growing vegetables, fruits and nuts are particularly relevant, mostly occurring to satisfy the (exports) FD of the Non-Delta (also partly the RoW). We also observe how sectors not directly using so much agricultural land, such as processed rice and food industry sectors, have notable embodied (directly and indirectly) agricultural land levels.
In the Supplementary Material, results from the hypothetical extraction method are discussed with the example of Table S2. Ultimately, Table S3 reports a summary of import, export and footprints of all the metrics studied apart from land, that is, employment, energy and CO2 emissions. The Volta Delta is a net importer (embodied in goods and services from other regions, higher than in exports) of all the metrics studied including agricultural land, employment, energy and CO2 emissions. The two Indian Deltas are net exporters of agricultural land (also in particular only with respect to the rest of the country), embodied in goods and services sold to other regions, but net importers of energy and CO2 emissions. One notable difference between the two Deltas is that the Mahanadi Delta is a net importer of employment, while the opposite is true of the IBD. The case of the relative dependence of the Volta Delta from the rest of the country and Rest of the World results is surprising, and reveals vulnerabilities such as the low development of advanced agriculture with novel technology, and the lack of other industrial activities other than some minor activities of food processing, mining, textile or other crafts. By contrast, the other Deltas show how their abundant natural endowments and conditions (fish resources, cultivable land, forests, mangroves, and so forth—the latter mostly in terms of the many types of ecosystem services rather than just as provisioning services) situate them more as suppliers. In these areas, environmental (and often also social) pressures occur, to satisfy their own needs but also partly those from abroad.

3.3. Hypothetical Extraction Method: The Role of Agriculture in Deltas

As indicated, another way to understand the importance of some economic activities exposed to the impacts of climate changes is the measurement of the potential impact to the GDP of the economy of their disappearance in that economy (i.e., no sectoral output, hence no provision of inputs to other sectors, no requirement inputs from other sectors). This impact, which includes both the direct GDP loss in the sector that hypothetically disappears and the cascading or indirect effects in other sectors, can be computed using the Hypothetical Extraction Method in combination with the MRIO tables.
Table 6 shows the results of the hypothetical extraction of the agriculture sector in the four Deltas. We may observe how in the Mahanadi the direct loss in the agricultural sector would represent the 27.3% of total GDP of the Delta. However, the integration with other sectors is not so high, most being related to the food itself as final product, and hence the hypothetical losses in other sectors which drag from agriculture would not be so high (0.36% of the total Delta GDP). In the IB Delta this integration is slightly higher and so it is the hypothetical loss in other sectors (1.23% of the total Delta GDP). Most notably, in the BB it goes above 5% the Delta GDP having the smaller representation of these Deltas of the agricultural sector in the total delta GDP (16.2%).
Finally, the Volta Delta stands out as the Delta that would have the highest impact of an already highly important sector (24.1% of the total Delta GDP) in other sectors with a hypothetical disappearance (8.3% over total Delta GDP). In these last two Deltas mentioned, a first look at the possible explanation of the results leads us to the existence of key food processing activities within the Delta such as rice processing, the textiles and leather transformation in the BB and in general all food processing, beverages and tobacco products in the Volta, along with the (relatively more important) logging, cattle and meat products transformation. Notwithstanding, looking at the absolute values of GDP losses by sector, we observe that many other industrial sectors would face relevant losses, and much more importantly the sector most highly affected (much higher even than the food processing, textiles, leather, and so forth) is the trade sector in all Deltas. In the case of the Volta Delta, it is also the “Transport NEC” sector (while in Deltas such as the IB and the BB, the “Electricity” sector and “Chemical, rubber, plastic products” appear to potentially face high losses).
Further assessments of the importance of the sectors can be obtained from studies on vital aspects for life, such as the role of agriculture in food security and being not only the primary source of proteins, vitamins, and so forth, but also the primary income for many households. In this line, many other studies have observed the role of the agricultural activities in these areas in the present, and key challenges for the future (e.g., [50,51,52,53,54,55,56,57]).

4. Conclusions and Discussion

Deltas have been identified as particularly vulnerable to climate change [8,9] with foreseeable environmental, social and economic costs. Phenomena such as sea level rise, increase in salinity, changes in hydrology, alteration of habitats or extreme events will directly affect, to a greater or lesser extent, specific activities in the Delta, such as agriculture (e.g., loss of land and reduction of productivity), fishing (e.g., reduction of stocks) or transportation (e.g., damages in infrastructures). However, it is not so obvious to what extent these impacts will spill-over to other sectors and regions through supply chains affecting employment and the income of men and women.
Some previous work, for example, the Special Feature of [58], have addressed the sustainability of some Deltas, their livelihoods, ecosystem services, policy implications, and so forth. Along this line of research, this article has revealed some insights into the economic structure of the Volta (Ghana), Mahanadi (India) and Ganges-Brahmaputra-Meghna (GBM), (India and Bangladesh) Deltas in the context of climate change. These are the Deltas studied in the project Deltas, Vulnerability and Climate Change: Migration and Adaptation (DECCMA), with a focus placed on analyzing current socioeconomic and biophysical contexts and existing linkages between the case study areas and other regions.
Following wide objectives within the project (such as understanding structural and socioeconomic changes), in order to better understand the potential impacts of climate change in Deltas, especially in those located in developing regions, in coastal areas, and so forth, and to assess different adaptations options (including migration), it becomes necessary to understand the complex connections between their biophysics and socio-economics. Climate change affects the environmental conditions in the Deltas through changes in climatic variables, but also of the soil, productivity, and so forth, which in turn will affect the provision of environmental goods in general, and in agriculture and fisheries in particular. Ultimately, all these changes will affect the livelihoods, income and employment opportunities of people engaged in these activities, and also people working in other economic sectors directly or indirectly linked through supply-chains. The main aims of this paper focus on these last socioeconomic aspects, with the goal of characterizing and understanding the socioeconomic relationships of the activities (highlighting e.g., dependencies, but also groups of populations more or less affected, given skill qualification and/or gender distribution, and so forth) within the deltaic areas and also within the rest of their respective countries and within the rest of the world. In order to do so, and given the challenges of developing such comprehensive databases in these contexts, there has also been an important attempt to provide the community methods and experience in studying these types of area. In particular, with a notable effort in terms of methodological and data gathering contributions, for Deltas in developing countries which have been considered representative of small (Volta), medium (Mahanadi) and large (GBM) size (especially measured in terms of population potentially affected by impacts of climate change).
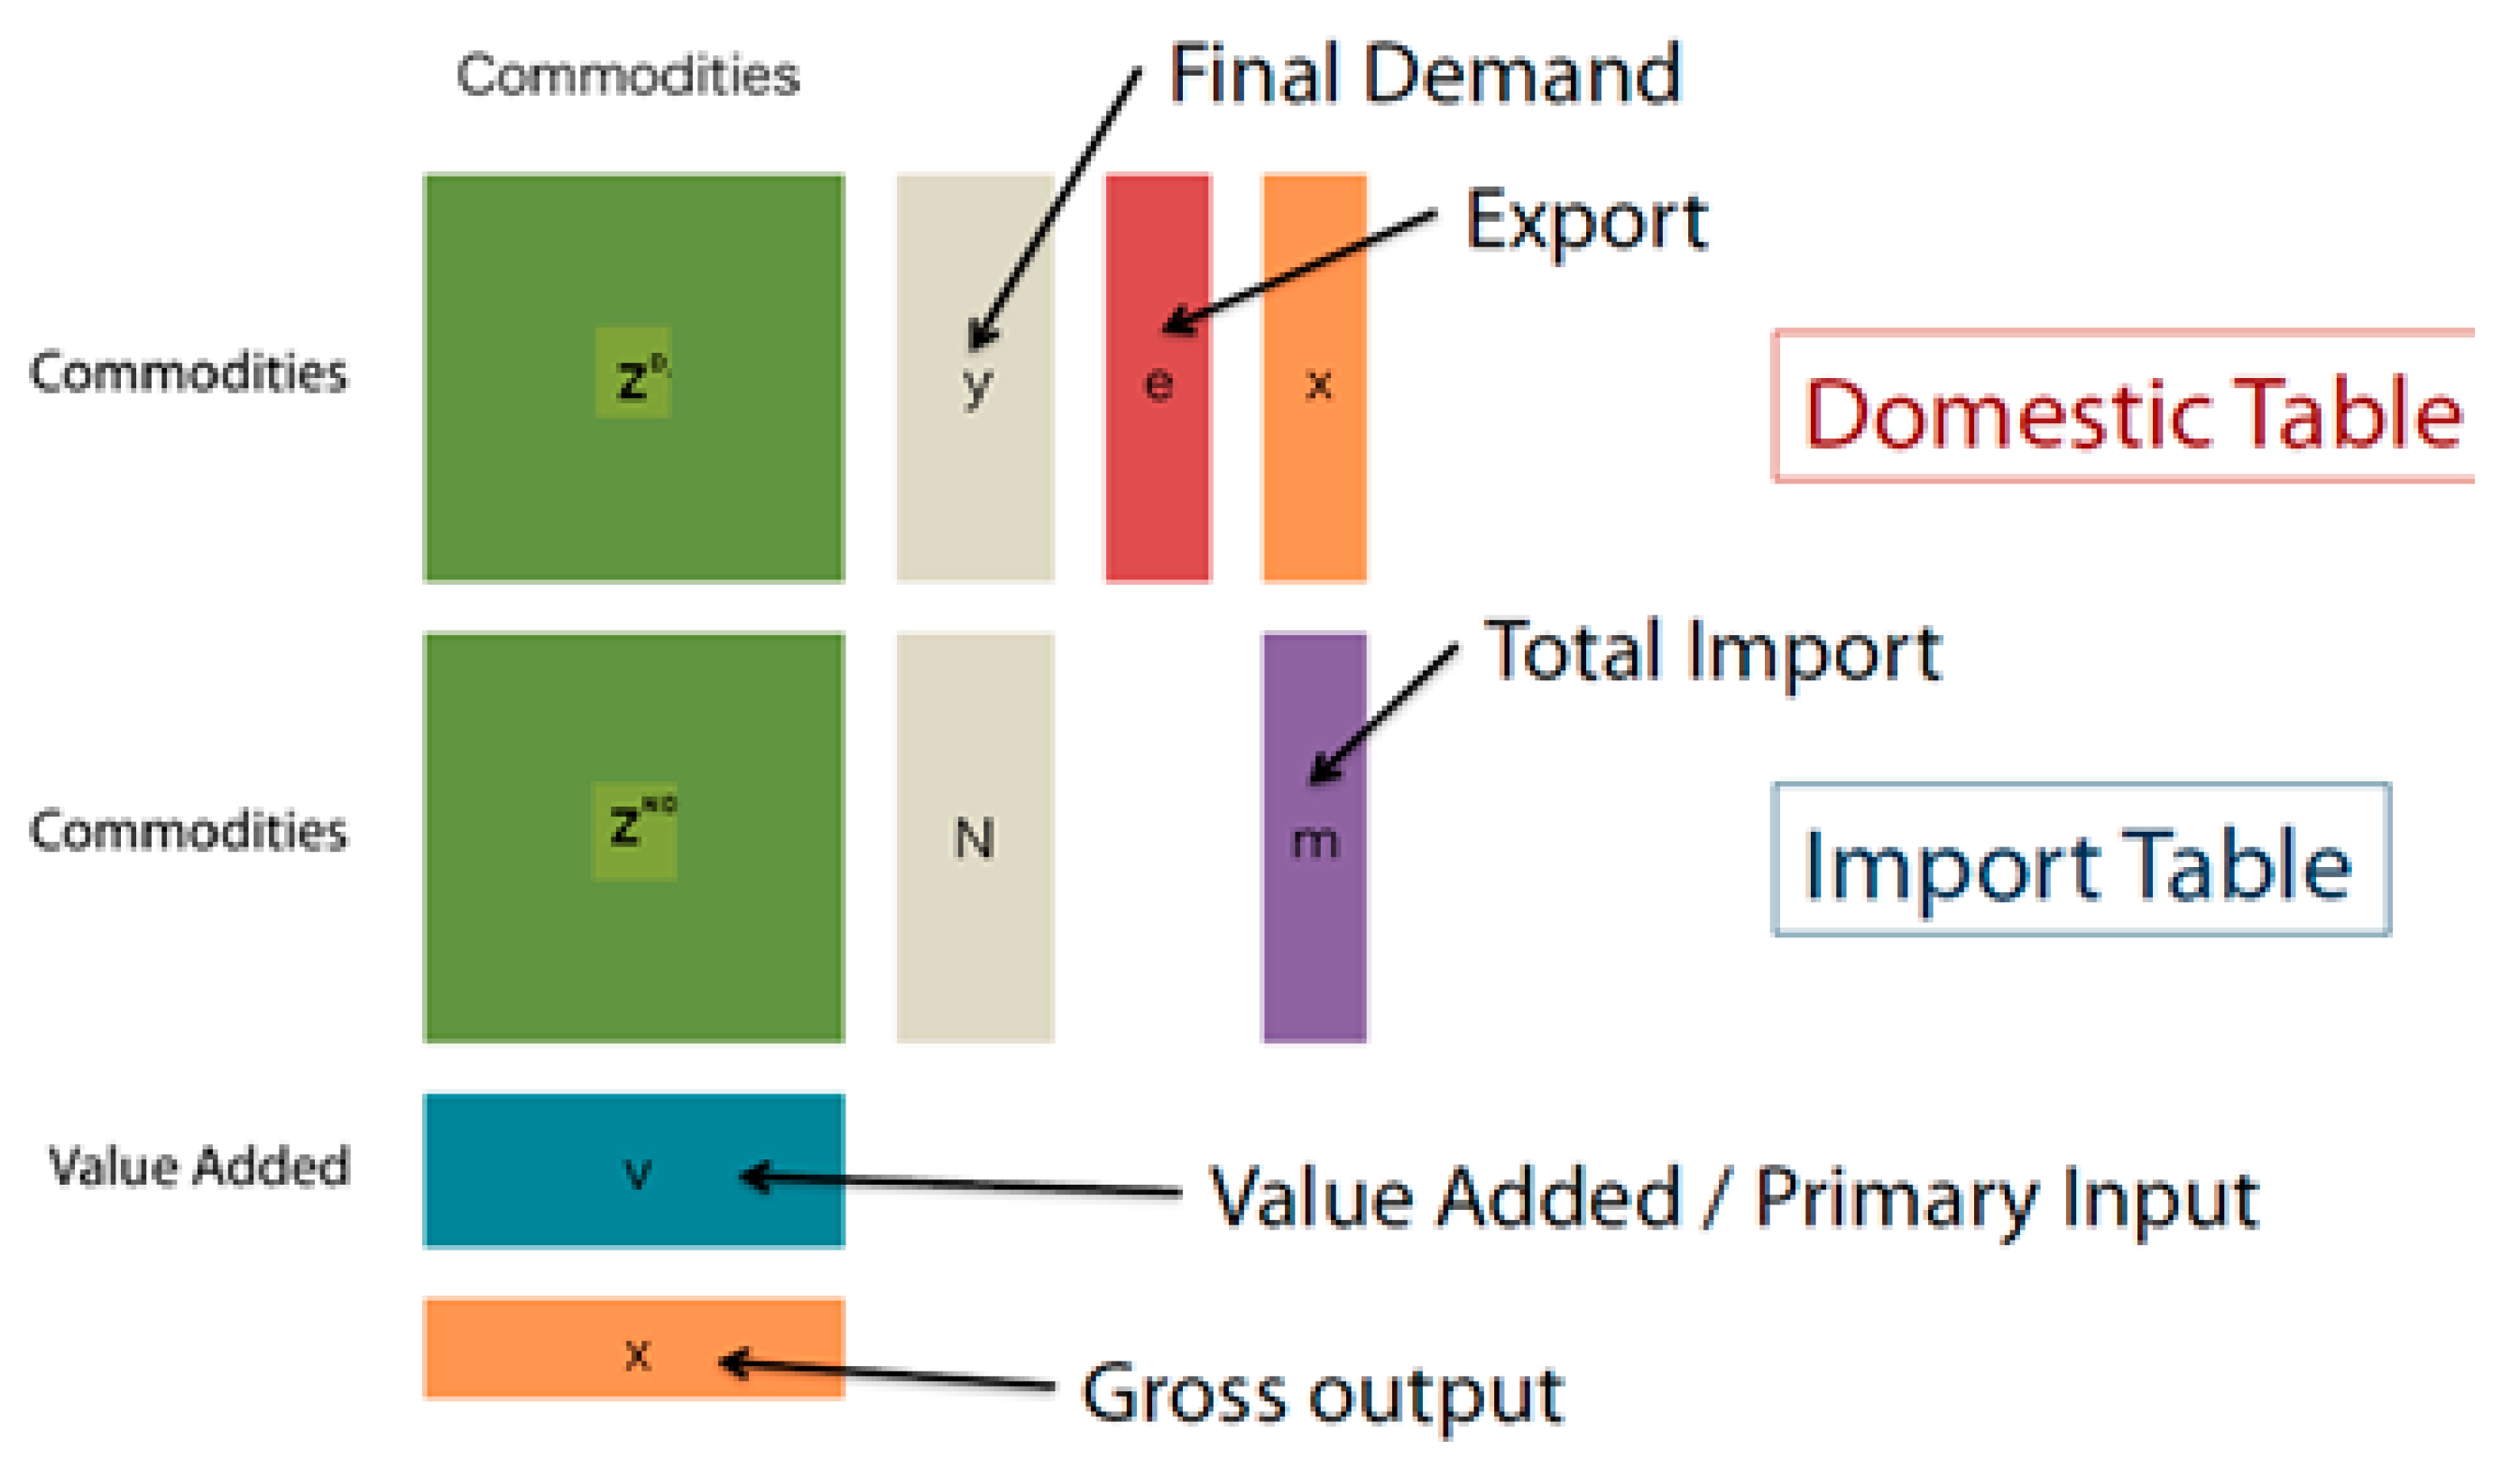
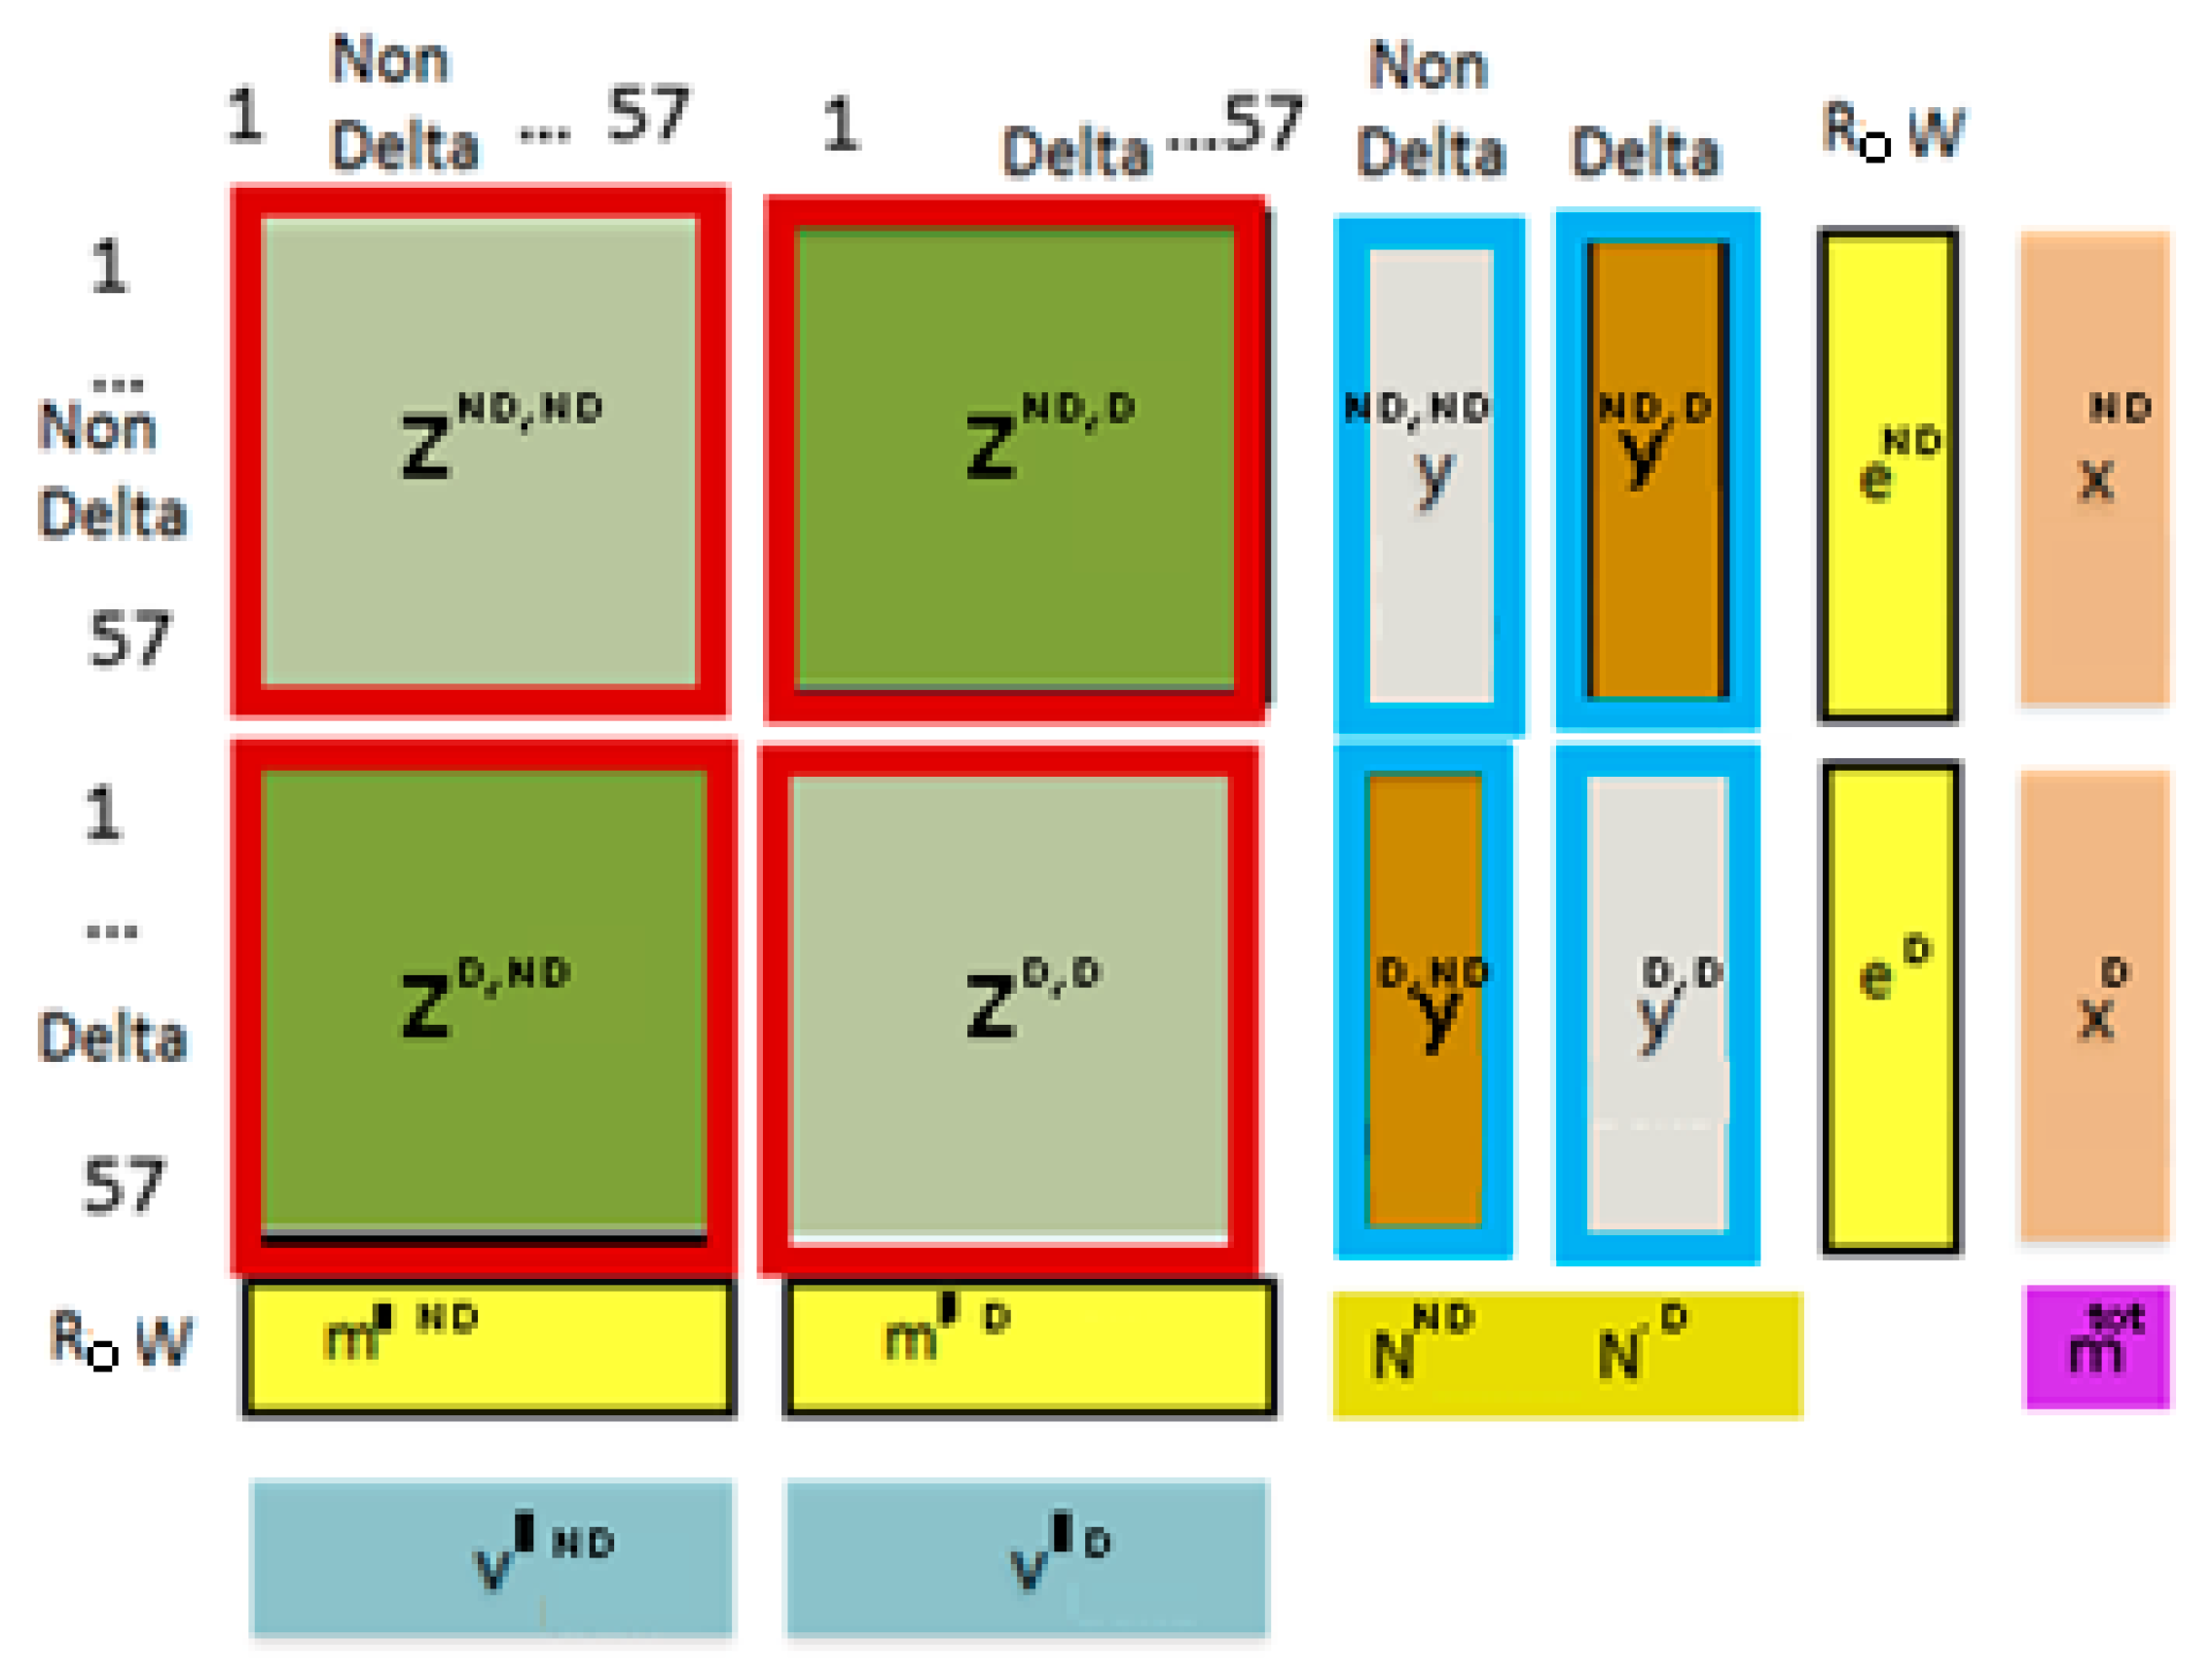
In this sense, regarding the methodology and data, we have developed MRIO tables for the 4 (the GBM is split between the Indian Bengal and Bangladeshi Bengal sides) study sites. The MRIO framework reveals itself as a powerful tool to assess the economy-wide potential impacts of climate change, by providing information on the interdependencies between economic activities directly exposed to climate change (e.g., agriculture) and other activities that might be potentially affected through the supply chains (e.g., food processing) both in the hotspot (Delta) and in other regions (Non-Delta). The method has been demonstrated to be useful for analyzing three climate hotspots of different sizes in terms of populations and areas potentially affected. In this sense, this model could also be useful to assess other climate hotspots such as arid and semi-arid regions or glacier and snowpack dependent river basins.
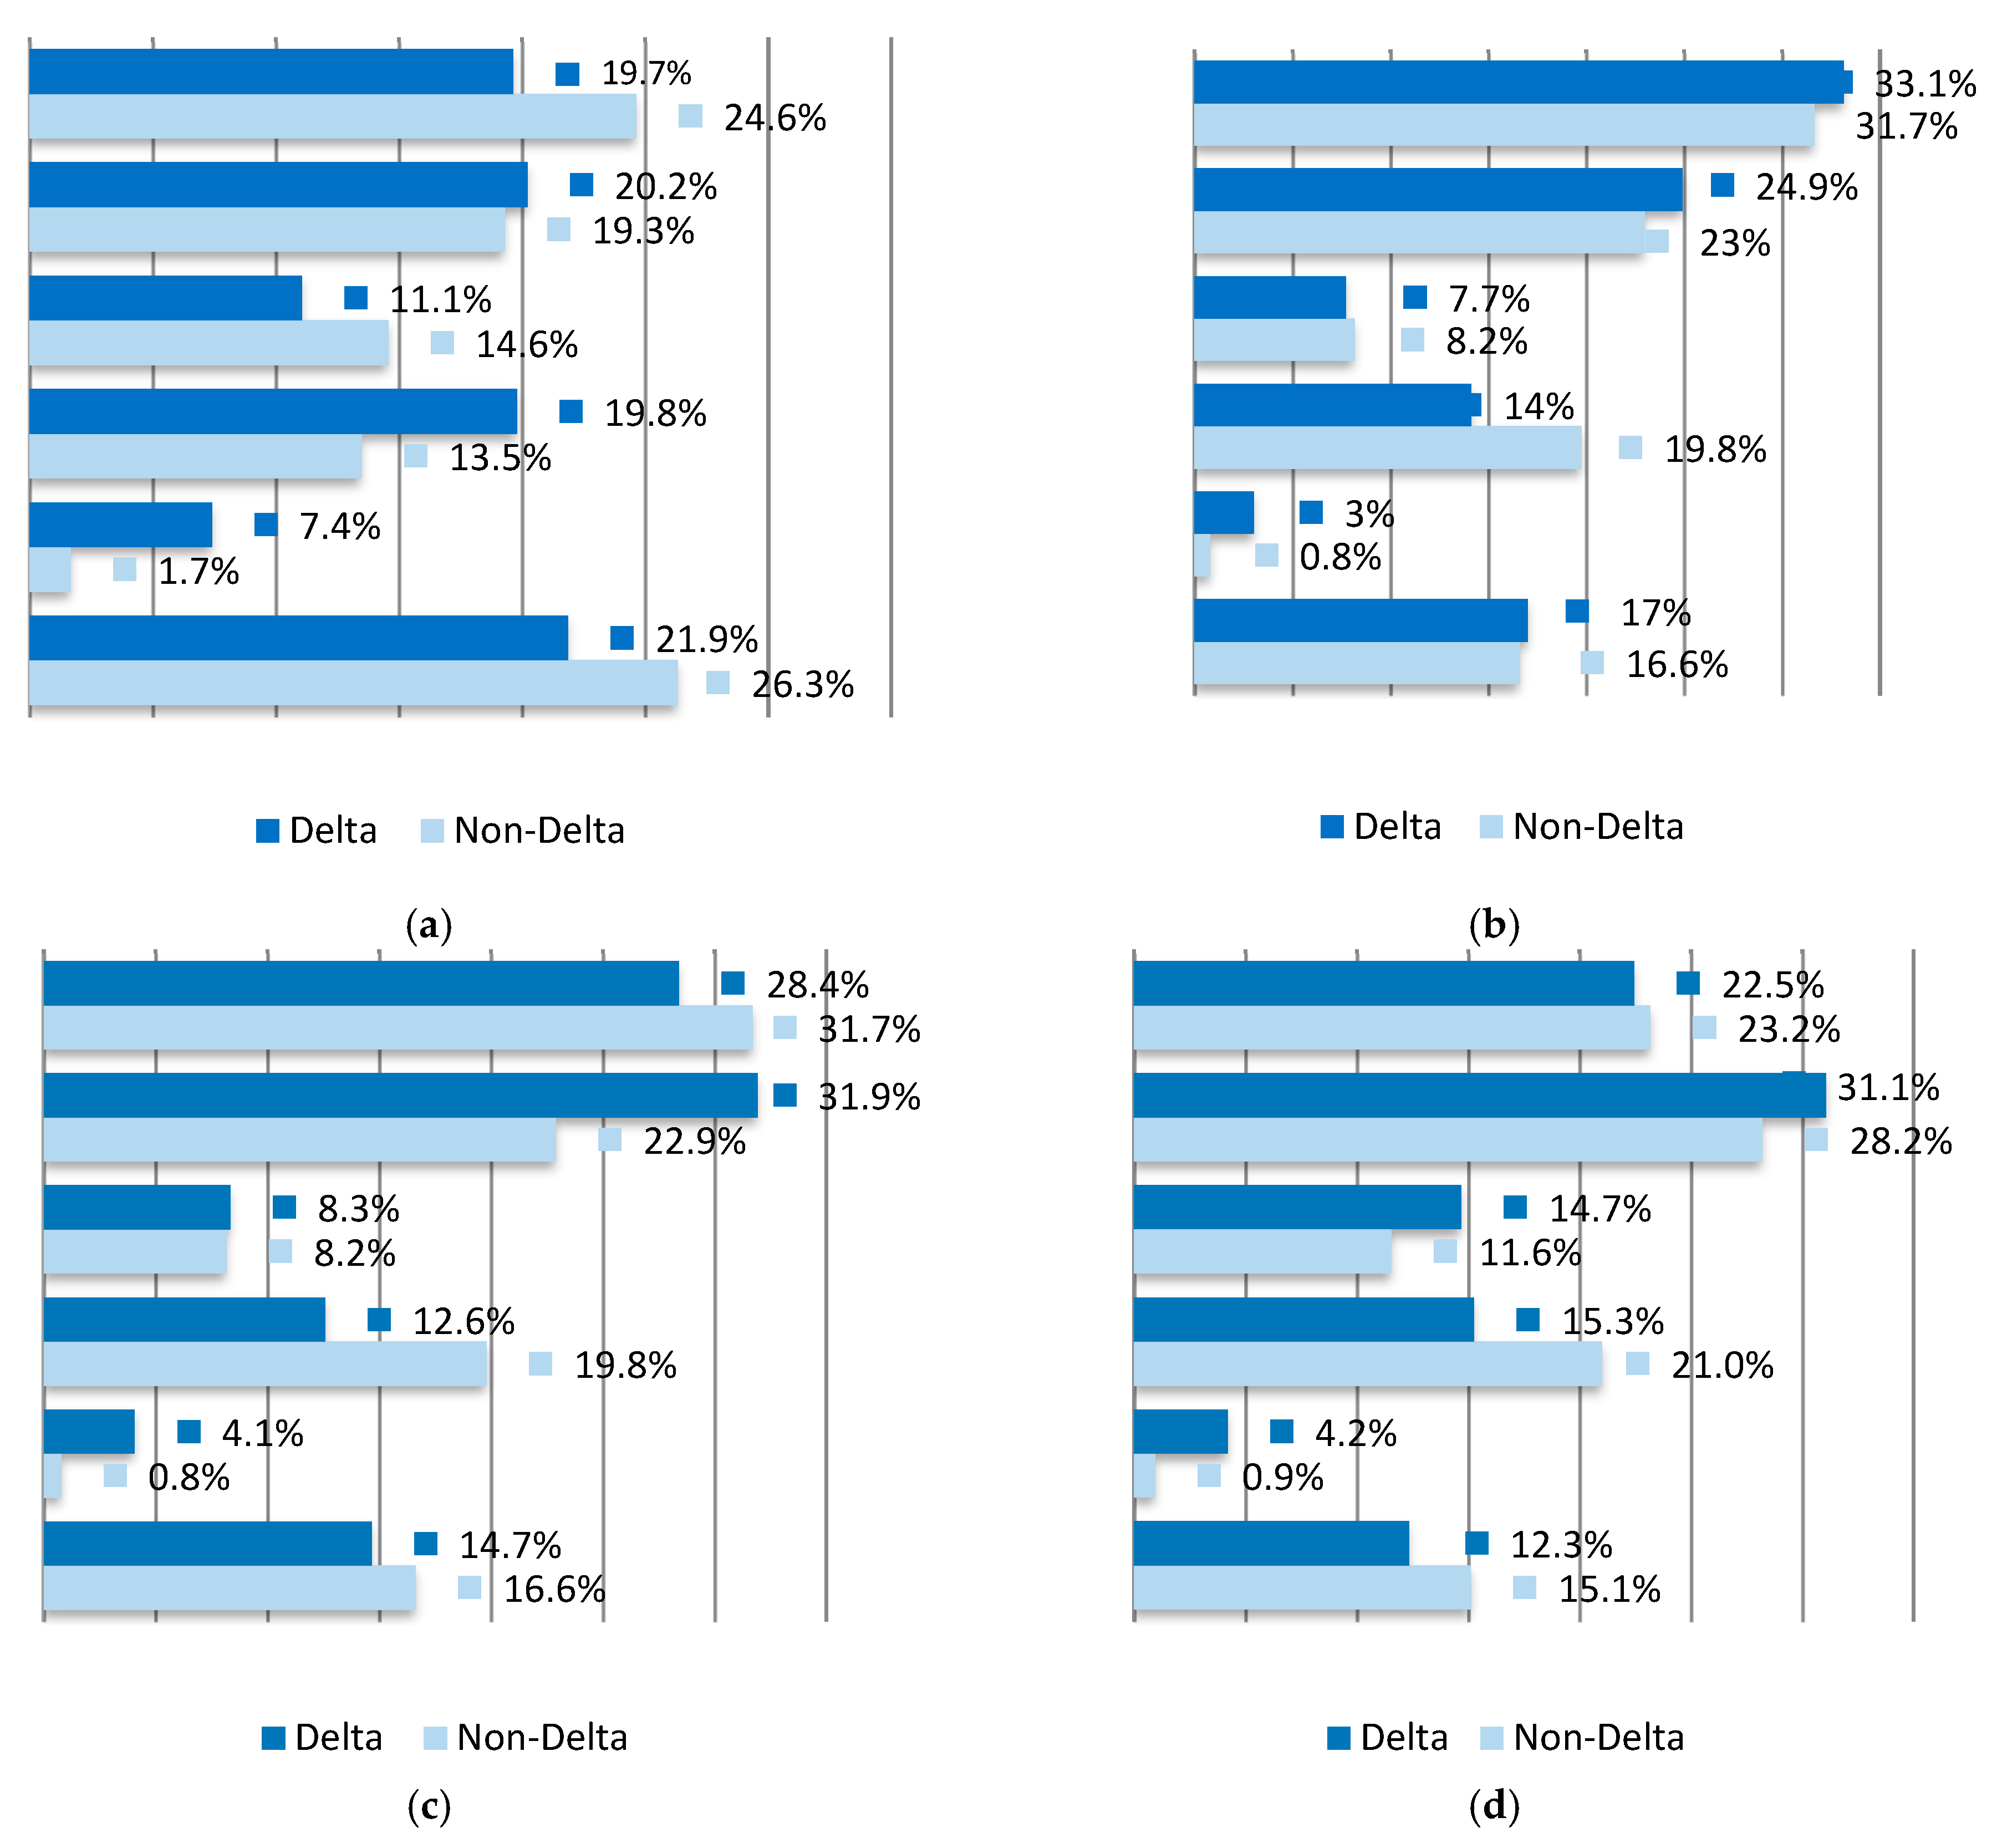
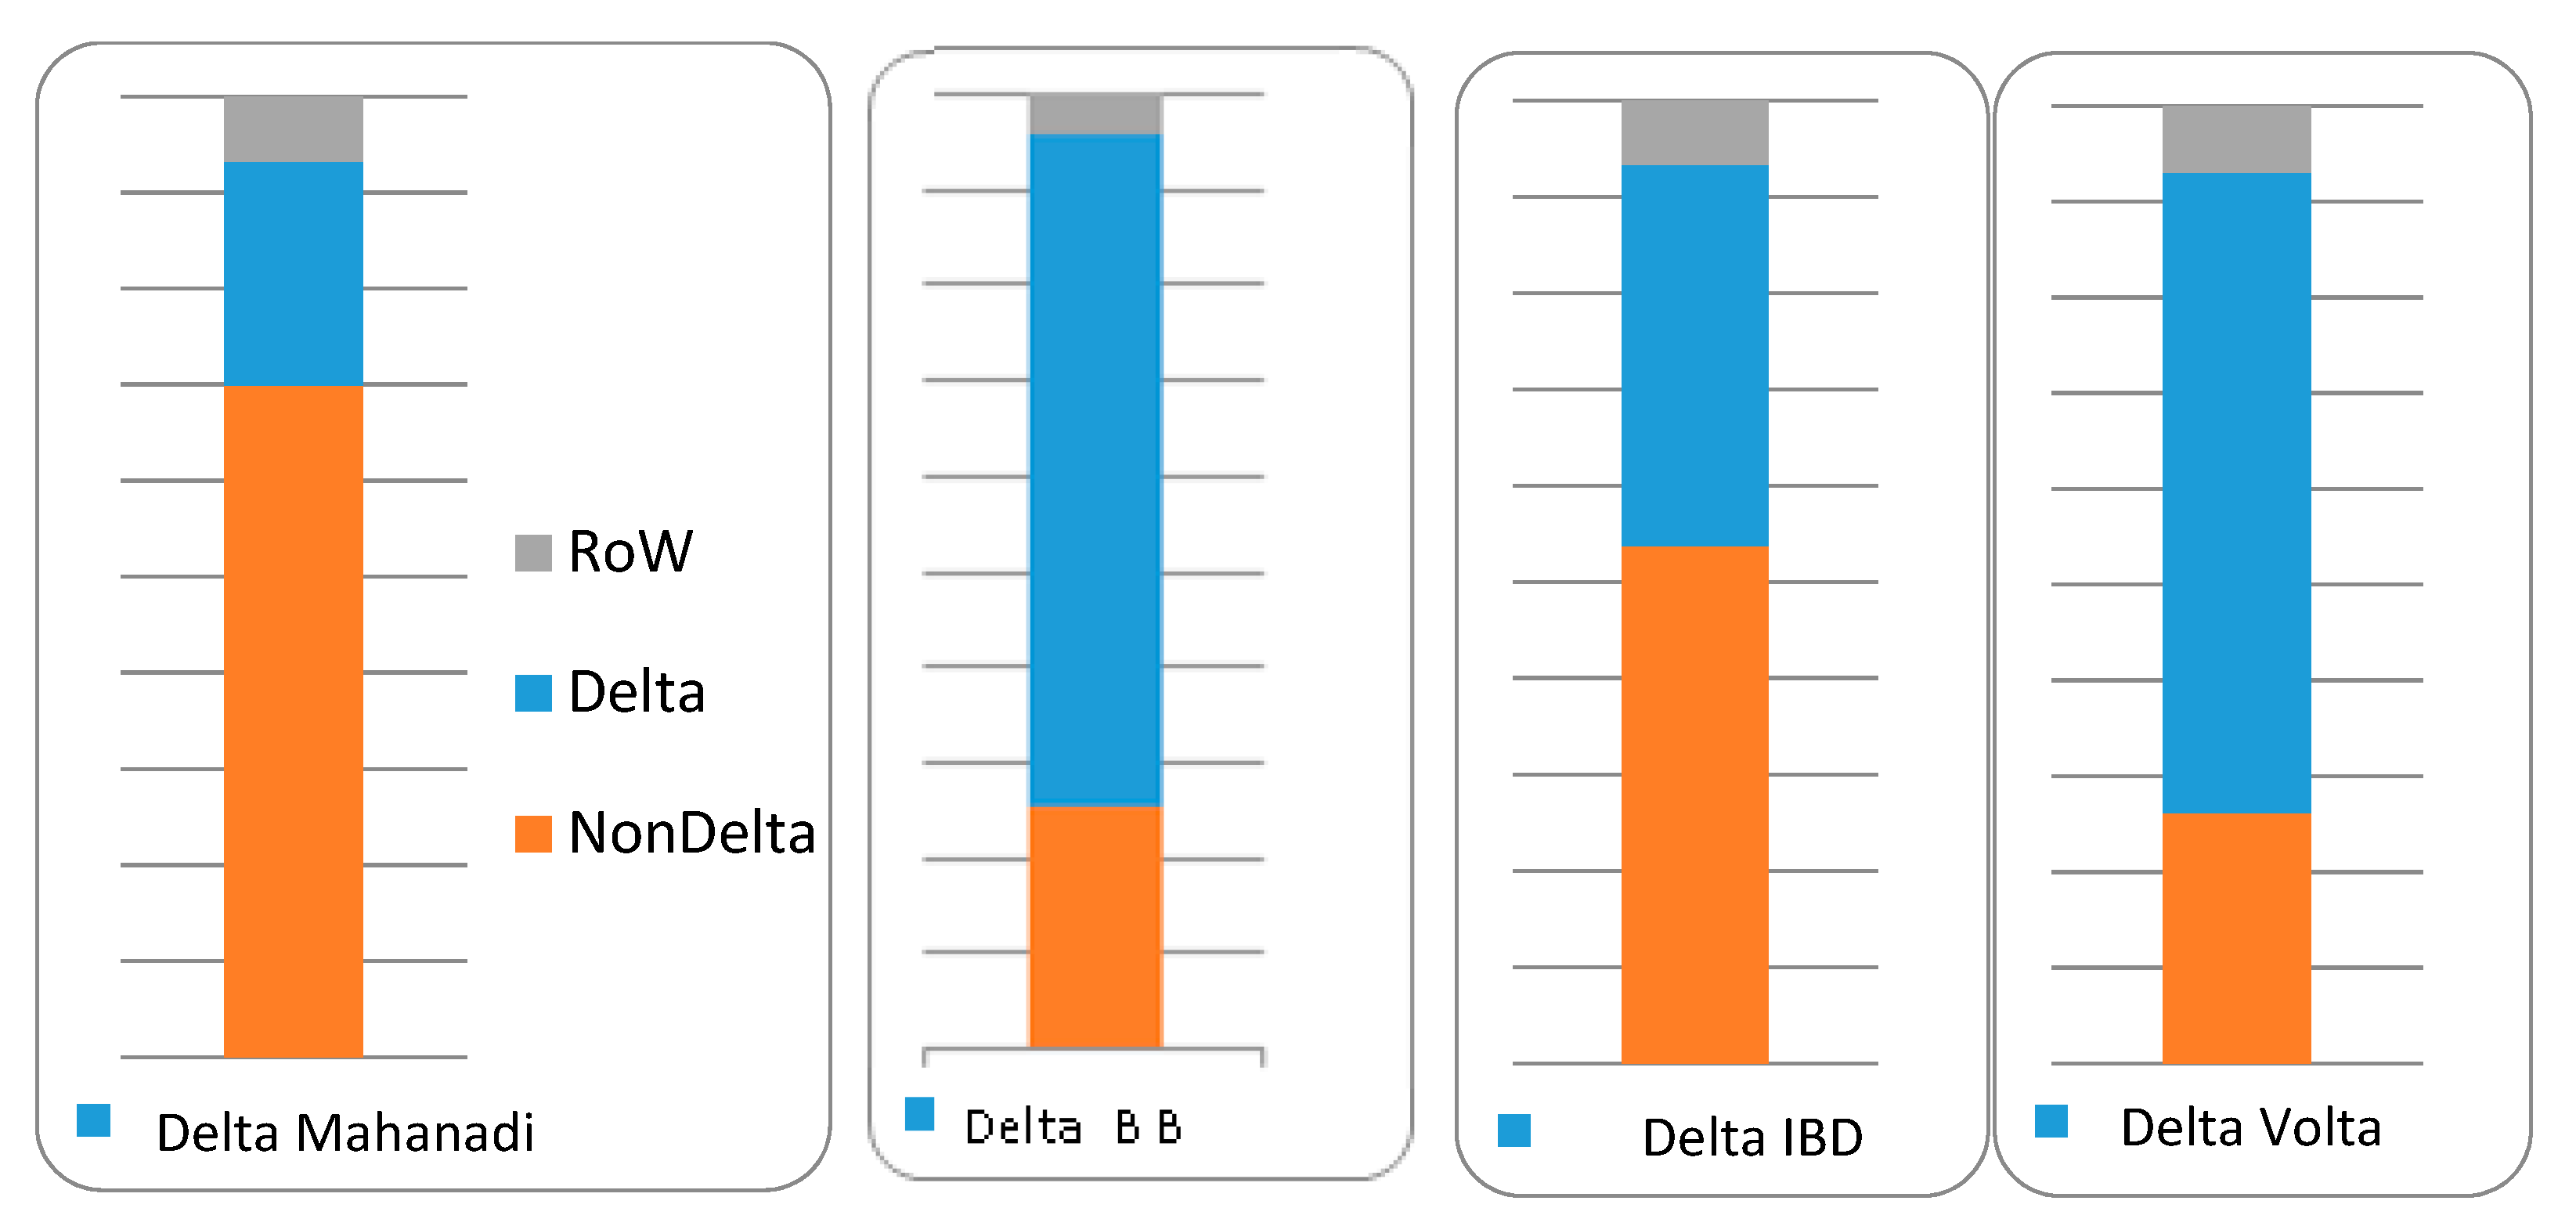
With respect to the results, from the analysis it could be concluded that even though the agricultural and fishing sectors represent a significant part of the Deltas’ economies (16–29%), other activities such as services, trade and transportation account for 50% of the GDP in these regions, as the fishing sector is much larger within the rest of the country. Interestingly some manufacturing activities were revealed to be relatively predominant in the Volta Delta economy compared to the situation in the rest of the country (Non-Delta). Key results in the Mahanadi Delta show the strong importance of agriculture (17% of the value-added) and fishing (3% of the value-added vs. 0.8%) sectors. On the contrary, the relative size in value-added of industrial activity is much smaller in the Delta than in the rest of the country (Non-Delta). For the IB Delta we found the strong importance of the agriculture sector, notably the fishing sector, which is relatively much bigger than in the rest of the country (4.1% vs. 0.8%). As a common result across all the Deltas, the trade and transport activities—which quite often go unnoticed when highlighting important sectors of the Deltas, such as small business trade, and so forth, were revealed to be more important in the Delta than in the rest of the country (Non-Delta).
In the Volta Delta, the work of females satisfies less of the final demand abroad (both in the Non-Delta and in the Rest of the World) compared to the work of males. As with the IB Delta, women in this Delta are not engaged in activities which generate either outputs or intermediate inputs that can significantly cater to external demand. In both Deltas, the embodied work of women in the Delta is most present in services, manufacturing and fishing, and in the case of the Volta Delta also in the construction sector, where women in large numbers act as helping hands in carrying labor intensive raw materials like cements, bricks and so forth, while being relatively less important in agriculture and energy. In the Mahanadi Delta, the work of females satisfies the final demand abroad more than the work of males, and this is most present in services, manufacturing and fishing sectors, while they are relatively less important in agriculture, energy or construction sectors.
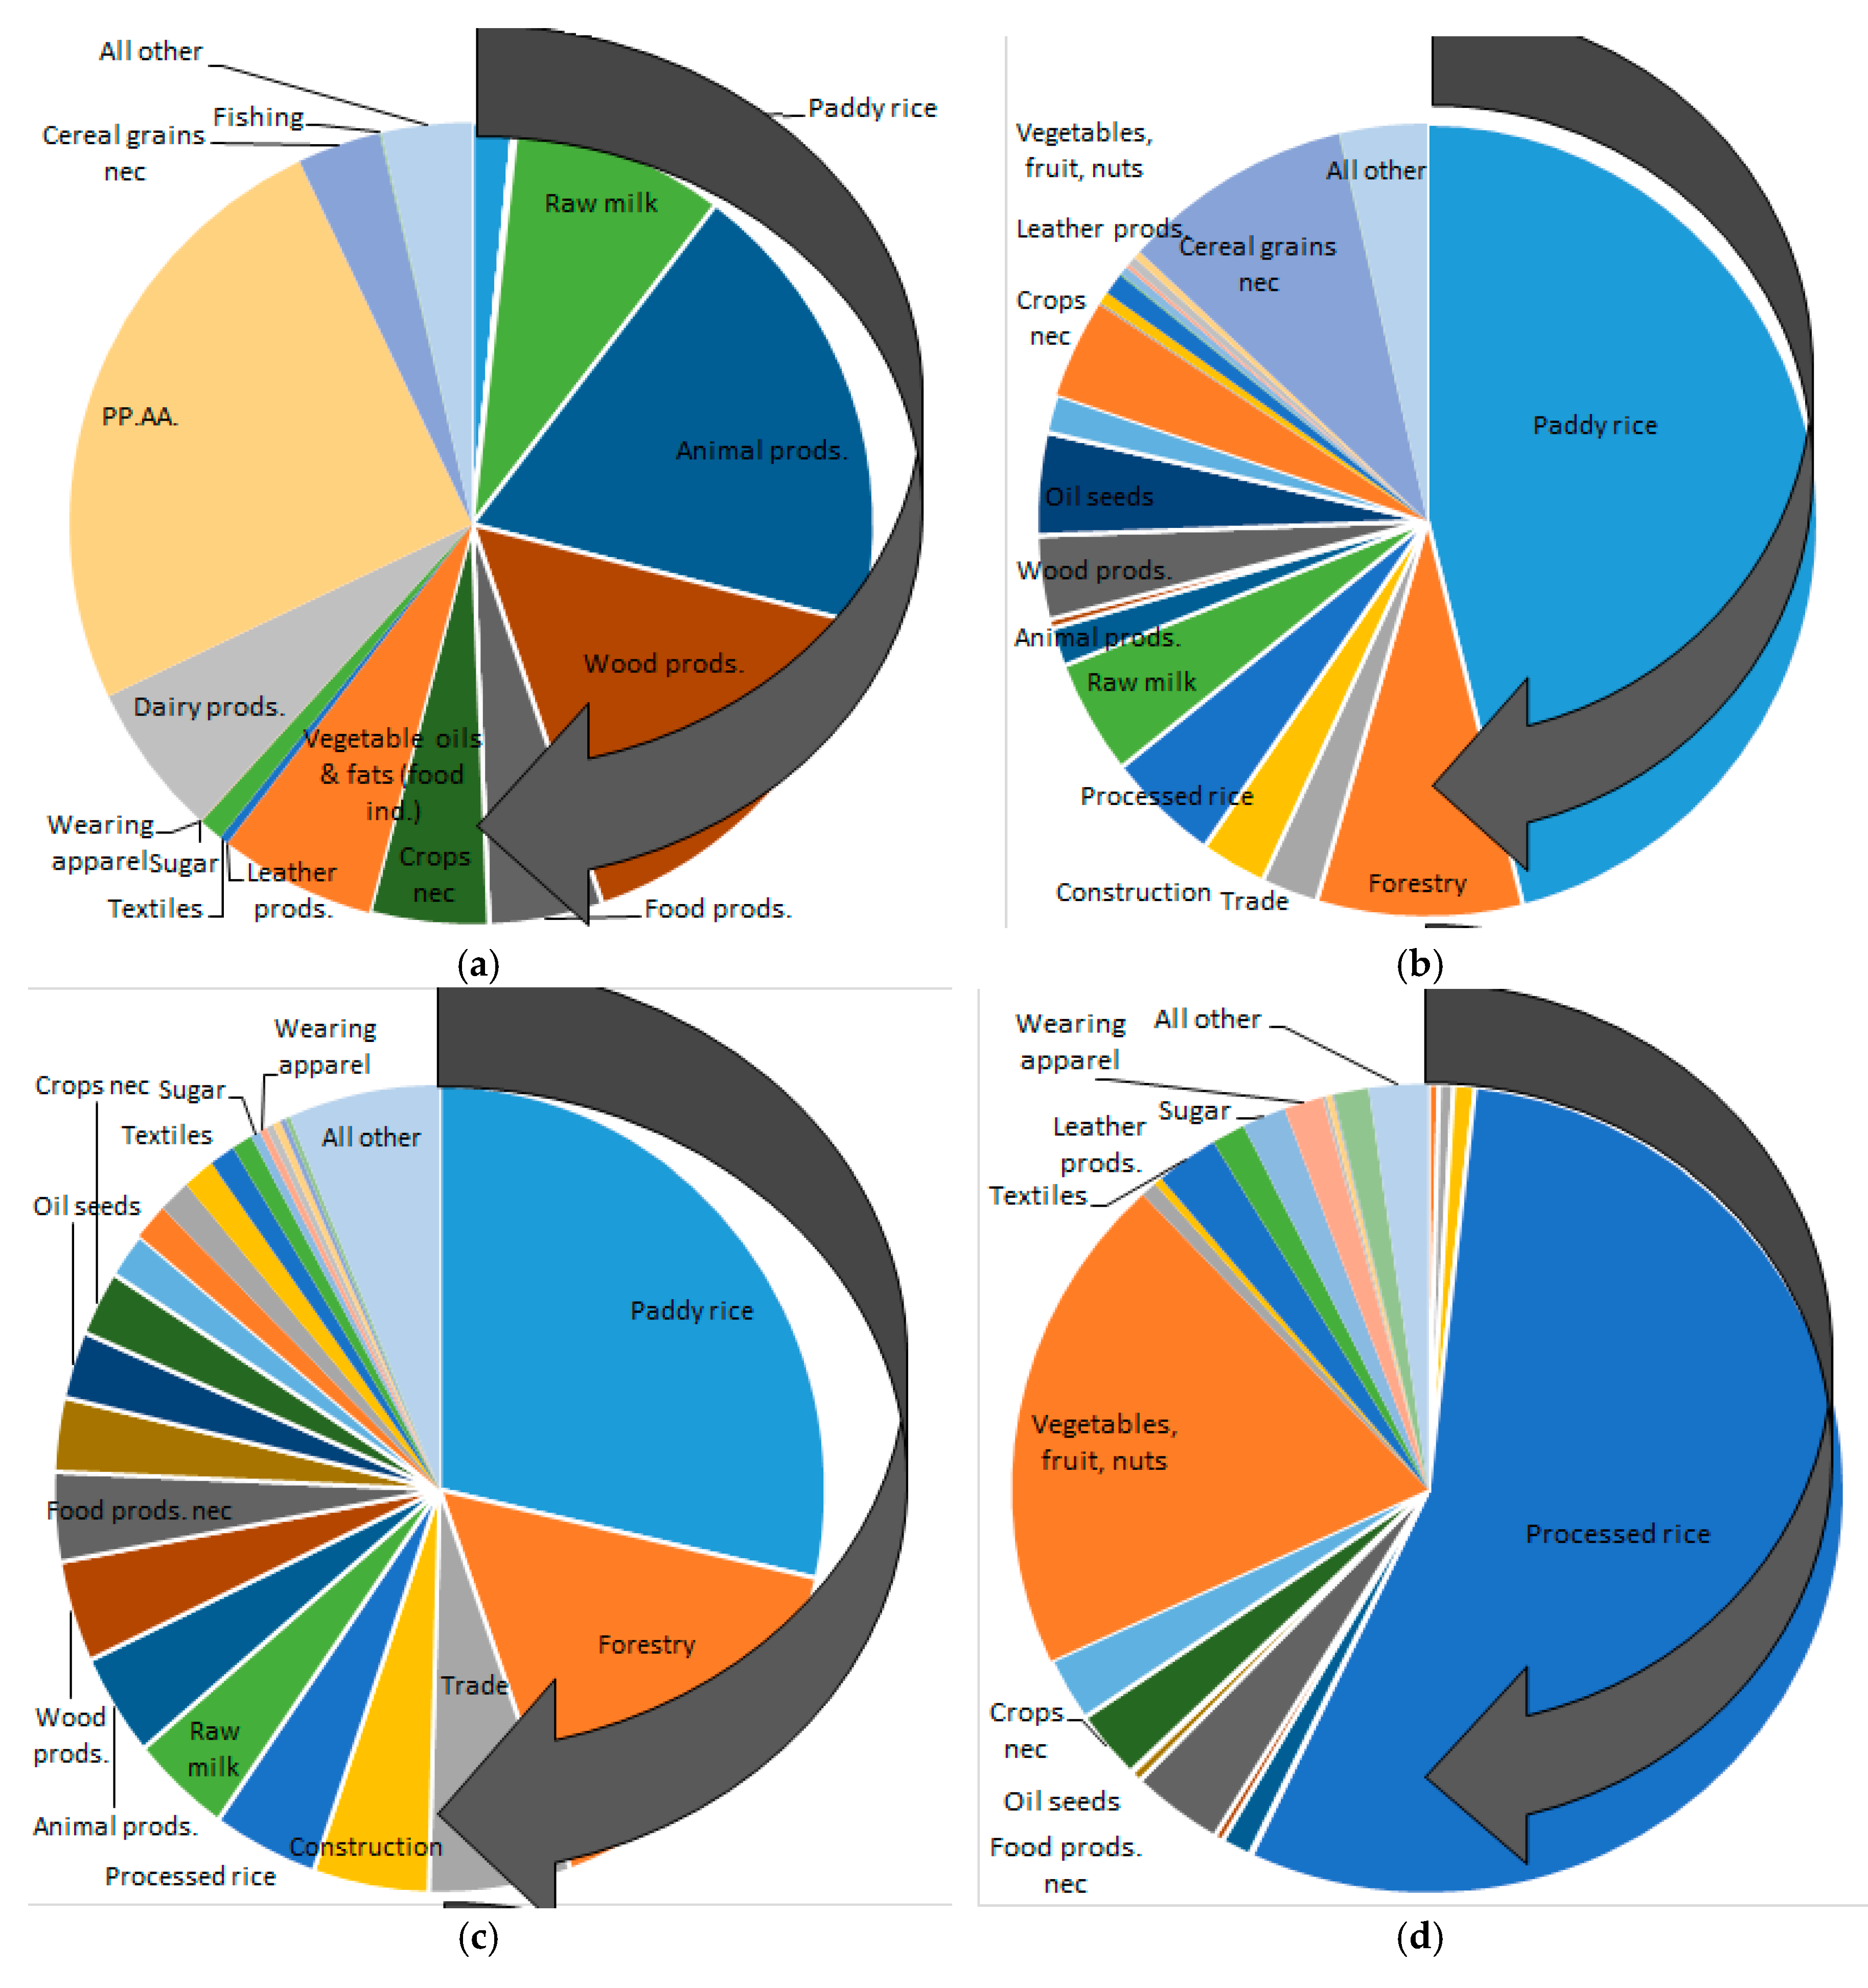
The results on land use show that in the Volta Delta agricultural land use is dominated by pastureland, but also animal products NEC and other activities downstream in the supply chains. Land use is also high for other crops and vegetables, fruits and nuts; finding more embodied agricultural land in the final demand for goods and services in the animal products NEC. The embodied land use is also relevant in sectors without a particularly important direct use, such as the food industry sectors. By contrast, in the case of the Mahanadi and the IB Deltas, agricultural land use is clearly dominated by paddy rice (560 thousand hectares and above 800 thousand hectares for the Mahanadi and IB Deltas, respectively), this changes enormously when we look at the embodied agriculture land in the final demand for goods and services. The embodied land use is particularly relevant in raw milk, and also indirectly in sectors such as the food industry and textiles.
All in all, the Volta Delta is a net importer (embodied in goods and services from other regions) of all the metrics studied including agricultural land, employment, energy and CO2 emissions. The two Indian Deltas are net exporters of embodied agricultural land (with respect to the rest of the country), embodied in goods and services sold to other regions (higher than in imports), but net importers of energy and CO2 emissions. Differences among the two Deltas include the Mahanadi Delta as a net importer of employment, while the opposite is true in the IB Delta. The results showing the relative dependence of the Volta Delta on the rest of the country and Rest of the World are surprising, and reveal vulnerabilities and lack of development in key activities. These are present in industrial activities other than some minor activities of food processing, mining, textile or other crafts, but also in agriculture. In comparison, the other Deltas show how their abundant natural endowments and conditions (fish resources, cultivable land, forests, mangroves, and so forth) should situate them more as suppliers.
All these results should be considered while taking into account the potential limitations of the present research. Despite the multidisciplinary and multi-(Delta) country teams involved in our project, there were still numerous difficulties in gathering the data for the construction of the IO tables. As also occurs in many developed countries, the comprehensive IO framework implies extensive data needs, often from different sources, which need to be made consistent (with possible biases, and under uncertainties). Of particular difficulty was finding adequate information on trade and on the transactions of intermediate goods and services across activities. Also in the regionalization process, even though the FLQ incorporates the positive aspects from previous methods, for example, it has a cross-industry foundation, and also accounts for the relative size of the region, the method obviously does not avoid the problems of estimating numerous data points. We consider however that the effort was worthwhile, since no similar framework for the studied Deltas existed (and to our knowledge, of any Delta) that could provide so much consistent information and key economic variables such as GDP, GDP per capita, employment, capital, use of resources, and so forth. Finally, with respect to the use of the information, we focused on its validation and on better understanding the (natural base and socioeconomic) contexts of the Deltas and surrounding areas, as well as their interrelations. We also identified the climate exposed-activities, but we did not model possible shocks of these under environmental change, notwithstanding, these aspects may open paths for further research.
Future research that can be derived from these constructed databases, models and analyses can be focused particularly on the effects of climate change in these vulnerable areas, and especially the expected increases in the current trends of coastal to urban migration and needs for adaptation. Migration is one of the defining features of the 21st century, with increasing relation to environmental change, and a topic that will have to be understood in order to achieve the Sustainable Development Goals (SDGs) (The links between migration and development also have implications for migration policy and practice, particularly the Global Compact for Migration (GCM), which will be agreed by the UN member states in 2018. Certain coastal areas such as the studied Bay of Bengal might be extremely affected by rising sea levels and extreme events, which might result in high levels of migration to inland regions and cross-regional migration [59,60]. The number of climate refugees (also often called environmental migrants, refers to those forced to leave their home region due to sudden or long-term changes to their local environment) is becoming a more important issue due to increased droughts, desertification, sea-level rise, disruption of seasonal weather patterns, monsoons, and so forth. (see e.g., [61,62,63,64,65]). We have obtained insights for the studied areas in line with previous literature situating women as the most vulnerable to the impacts of disasters and carrying a greater burden, more prone to deepening poverty and worsening existing inequalities [66,67]. The (particularly male) seasonal migration from the Deltas is a wide phenomenon, and also has important gender implications and effects, as well as effects on employment (levels, wages, and so forth). For these and other factors and existing vulnerabilities for women—markedly in several areas of South Asia, see e.g. Yadav, et al. [14] where the authors also suggest action plans and strategies to minimize vulnerability to climate change such as empowering women economically and educationally, organizing training and outreach programs, and involving them in formal climate change mitigation and adaptation policies and programs. In this line, the project has a clear gender focus, and a strong focus on migration and adaptation. The adaptation options not always result in reducing future climate vulnerabilities. For example, in Yadav, et al. [14] there is an identification of various adaptation measures taken in Ghana, including extensification and intensification of agriculture, temporary migration, planting of drought resistant varieties, irrigation, and livelihood diversification. But many coping measures (e.g., livelihood diversifications activities such as selling of firewood and charcoal production) and adaptation responses (including intensification, extensification and irrigation) are found to currently deliver maladaptive (i.e., not adjusting adequately or appropriately to the environment or situation) outcomes. In this line, the results obtained here may be useful in policy and adaptations implementations, for example, by protecting the valuable resources and activities which provide sustainable livelihoods for the population in the Deltas, and the necessary income and resources to sell to the Rest of the World and to import other goods.

Supplementary Materials

The following are available online at https://www.mdpi.com/2071-1050/10/3/893/s1, Figure S1: Map of the Volta Delta depicting the study site (region within the red line), Figure S2: Map of the Mahanadi delta depicting the study site (region within the red line), Figure S3: Map of the Indian Bengal Delta depicting the study site (region within the red line), Figure S4: Map of the Ganges-Brahmaputra-Meghna Bangladeshi Delta depicting the study site (region within the red line), Figure S5: Land use distribution of the Volta Delta, Figure S6: Land use/Land Cover of Mahanadi Delta, Figure S7: Land use/Land cover Map of IB Delta, Figure S8: Agro-ecological zones of Bangladesh (includes the BB Delta definition), Figure S9: Distribution of value-added by main 16 categories for the deltas, Figure S10: Employment of the Delta and Non-Delta (x axis) by demanding region (y-axis, being represented the Delta in orange, Non-Delta in blue, and RoW in grey), Figure S11: Employment (1000 people) of the Delta by demanding region and sector, Figure S12: Employment (share per 1) by gender of the Non-Delta and Delta (x axis) by demanding region (y-axis, being represented the Delta in orange, Non-Delta in blue, and RoW in grey), Figure S13: Direct and embodied labor by sector and gender in the Non-Delta and Delta, Table S1: List of the 57 GTAP sectors, Table S2: Summary of import, export and footprints.

Acknowledgments

This work was carried out under the DEltas, vulnerability and Climate Change: Migration and Adaptation (DECCMA) project which is part of Collaborative Adaptation Research Initiative in Africa and Asia (CARIAA), with financial support from the UK Government’s Department for International Development (DfID) and the International Development Research Centre (IDRC), Canada. The views expressed in this work are those of the creators and do not necessarily represent those of DfID and IDRC or its Board of Governors.

Author Contributions

I.A. and I.C. conceived and designed the work, analysis and performed computations and analyses; S.H. and R.N.B. conducted data compilation and analysis for India; P.O-W.A., P.K.O-D., J.K.A. and S.K.A. conducted data compilation and analysis for Ghana; B.K., S.R. and Z.H. conducted data compilation and analysis for Bangladesh. All authors contributed to the discussion, cross-comparisons of analyses and writing of the paper.

Conflicts of Interest

The authors declare no conflict of interest.

References

  1. Martínez, M.L.; Intralawan, A.; Vázquez, G.; Pérez-Maqueo, O.; Sutton, P.; Landgrave, R. The coasts of our world: Ecological, economic and social importance. Ecol. Econ. 2007, 63, 254–272. [Google Scholar] [CrossRef]
  2. Balk, D.; Montgomery, M.R.; Mcgranahan, G.; Kim, D.; Mara, V.; Todd, M.; Buettner, T.; Dorelien, A. Mapping Urban Settlements and the Risks of Climate Change in Africa, Asia and South America. In Population Dynamics and Climate Change; Guzmán, J.M., Martine, G., McGranahan, G., Schensul, D., Tacoli, C., Eds.; UNFPA: New York, NY, USA; IIED: London, UK, 2009. [Google Scholar]
  3. McGranahan, G.; Balk, D.; Anderson, B. The rising tide: Assessing the risks of climate change and human settlements in low elevation coastal zones. Environ. Urban. 2007, 19, 17–37. [Google Scholar] [CrossRef]
  4. Neumann, B.; Vafeidis, A.T.; Zimmermann, J.; Nicholls, R.J. Future Coastal Population Growth and Exposure to Sea-Level Rise and Coastal Flooding—A Global Assessment. PLoS ONE 2015, 10, e0118571. [Google Scholar] [CrossRef] [PubMed]
  5. Costanza, R.; Arge, R.; Groot, R.; De Farberk, S.; Grasso, M.; Hannon, B.; Limburg, K.; Naeem, R.V.O.; Paruelo, J.; Raskin, R.G.; et al. The value of the world’s ecosystem services and natural capital. Nature 1997, 387, 253–260. [Google Scholar] [CrossRef]
  6. Waycott, M.; Duarte, C.M.; Carruthers, T.J.B.; Orth, R.J.; Dennison, W.C.; Olyarnik, S.; Calladine, A.; Fourqurean, J.W.; Heck, K.L.; Hughes, A.R.; et al. Accelerating loss of seagrasses across the globe threatens coastal ecosystems. Proc. Natl. Acad. Sci. USA 2009, 106, 12377–12381. [Google Scholar] [CrossRef] [PubMed] [Green Version]
  7. Barbier, E.B.; Hacker, S.D.; Kennedy, C.; Koch, E.W.; Stier, A.C.; Silliman, B.R. The value of estuarine and coastal ecosystem services. Ecol. Monogr. 2011, 81, 169–193. [Google Scholar] [CrossRef]
  8. Nicholls, R.J.; Marinova, N.; Lowe, J.A.; Brown, S.; Vellinga, P.; de Gusmão, D.; Hinkel, J.; Tol, R.S.J. Sea-level rise and its possible impacts given a “beyond 4 °C world” in the twenty-first century. Philos. Trans. R. Soc. A Math. Phys. Eng. Sci. 2011, 369, 161–181. [Google Scholar] [CrossRef] [PubMed]
  9. Ericson, J.; Vorosmarty, C.; Dingman, S.; Ward, L.; Meybeck, M. Effective sea-level rise and deltas: Causes of change and human dimension implications. Glob. Planet. Chang. 2006, 50, 63–82. [Google Scholar] [CrossRef]
  10. Syvitski, J.P.M.; Saito, Y. Morphodynamics of deltas under the influence of humans. Glob. Planet. Chang. 2007, 57, 261–282. [Google Scholar] [CrossRef]
  11. ILO Yearly Indicators. Ghana, India and Bangladesh: “Population census”, “Living Standards Survey”, “Labour Force Survey”, “Survey of Employment and Earnings”; International Labour Organization: Geneva, Switzerland, 2015. [Google Scholar]
  12. Giosan, L.; Syvitski, J.; Constantinescu, S.; Day, J. Climate change: Protect the world’s deltas. Nature 2014, 516, 31–33. [Google Scholar] [CrossRef] [PubMed]
  13. United Nations Transforming our world: The 2030 Agenda for Sustainable Development. General Assembly 70 Session 2015, 16301, 1–35. [CrossRef]
  14. Yadav, S.S.; Lal, R. Vulnerability of women to climate change in arid and semi-arid regions: The case of India and South Asia. J. Arid Environ. 2018, 149, 4–17. [Google Scholar] [CrossRef]
  15. Prati, G.; Cazcarro, I.; Hazra, S. The Migration-Sustainability-Care Nexus: The Case of the Mahanadi Delta, India, 2018; DECCMA Working paper.
  16. Population and Housing Census Districts’ Composite Budgets for 2013 Fiscal Year; Census Ghana: Accra, Ghana, 2013.
  17. CMLS. Studies, Stories and a Canvas: Seasonal Labor Migration and Migrant Workers from Odisha; Centre for Migration and Labor Solutions, Aajeevika Bureau: Udaipur, India, 2014. [Google Scholar]
  18. PCA Primary Census Abstract. Census of India; Directorate of Census Operations, Government of India: New Delhi, India, 2011.
  19. Primary Census Abstract 2011. West Bengal; Government of West Bengal: Kokata, India, 2011.
  20. KARAT Coalition; One World Action (OWA). Climate Change: Women in Developing Countries, the Hardest Hit. Available online: http://docplayer.net/39990559-Climate-change-women-in-developing-countries-the-hardest-hit.html (accessed on 20 March 2018).
  21. Mearns, R.; Norton, A. Social Dimensions of Climate Change: Equity and Vulnerability in a Warming World; The World Bank: Washington, DC, USA, 2010. [Google Scholar]
  22. Bangladesh Bureau of Statistics (BBS). Report of the Household Income & Expenditure Survey (HIES) 2010; Bangladesh Bureau of Statistics: Dhaka, Bangladesh, 2010.
  23. Kanemoto, K.; Geschke, A.; Murray, J.; Moran, D.; Lenzen, M. Multi Regional Input–Output (MRIO) course. In The International School of Input-Output Analysis; Data foundation: Alexandria, VA, USA, 2011. [Google Scholar]
  24. Lenzen, M.; Moran, D.; Kanemoto, K. Building EORA: A global multi- region input—Output database at high country and sector resolution. Econ. Syst. Res. 2013, 25, 37–41. [Google Scholar] [CrossRef]
  25. Narayanan, G.; Badri, A.A.; McDougall, R. Global Trade, Assistance, and Production: The GTAP 9 Data Base, Center for Global Trade Analysis; Purdue University: West Lafayette, IN, USA, 2015. [Google Scholar]
  26. Flegg, A.T.; Webber, C.D. On the appropriate use of location quotients in generating regional input-output tables: Reply. Reg. Stud. 1997, 31, 795–805. [Google Scholar] [CrossRef]
  27. Flegg, A.T.; Webber, C.D. Regional size, regional specialization and the FLQ formula. Reg. Stud. 2000, 34, 563–569. [Google Scholar] [CrossRef]
  28. Flegg, A.T.; Webber, C.D.; Elliot, M. V On the appropriate use of location quotients in generating regional input-output tables. Reg. Stud. 1995, 29, 547–561. [Google Scholar] [CrossRef]
  29. Kowalewski, J. Regionalization of National Input-Output Tables: Empirical Evidence on the Use of the FLQ Formula; Hamburg Institute of International Economics: Hamburg, Germany, 2012; Volume 126. [Google Scholar]
  30. Tohmo, T. New developments in the use of location quotients to estimate regional input-output coefficients and multipliers. Reg. Stud. 2004, 38, 43–54. [Google Scholar] [CrossRef]
  31. Kronenberg, T. Construction of Regional Input-Output Tables Using Nonsurvey Methods: The Role of Cross-Hauling. Int. Reg. Sci. Rev. 2009, 32, 40–64. [Google Scholar] [CrossRef]
  32. Flegg, A.T.; Tohmo, T. A comment on Tobias Kronenberg’s “Construction of regional input-output tables using nonsurvey methods: The role of cross-hauling”. Int. Reg. Sci. Rev. 2013, 36, 235–257. [Google Scholar] [CrossRef]
  33. Arto, I.; Cazcarro, I. Hybrid (Survey and Non-Survey) Methods for the Construction of Subnational/Regional IO Tables with Insights for Their Construction for Deltaic Environments, 2017; DECCMA working paper.
  34. Leontief, W. Quantitative Input and Output Relations in the Economic System of the United States. Rev. Econ. Stat. 1936, 18, 105–125. [Google Scholar] [CrossRef]
  35. Leontief, W. Interrelation of Prices, Output, Savings and Investment. A Study in Empirical Application of the Economic Theory of General Interdependence. Rev. Econ. Stat. 1937, XIX, 109–132. [Google Scholar] [CrossRef]
  36. Leontief, W. The Structure of American Economy, 1919-1929; Harvard University Press: Cambridge, MA, USA, 1941. [Google Scholar]
  37. Leontief, W. Environmental Repercussions and the Economic Structure: An Input-Output Approach. Rev. Econ. Stat. 1970, 52, 262–271. [Google Scholar] [CrossRef]
  38. Leontief, W. Structure of the World Economy: Outline of a simple Input-Output for mulation. Am. Econ. Rev. 1974, 64, 823–834. [Google Scholar] [CrossRef]
  39. Miller, R.E.; Blair, P.D. Input-Output Analysis: Foundations and Extensions, 2nd ed.; Cambridge University Press: Cambridge, UK, 2009. [Google Scholar]
  40. Paelinck, J.; de Caevel, J.; Degueldre, J. Analyse Quantitative de Certaines Phénomènes du Développement Régional Polarisé: Essai de Simulation Statique d’Itinéraires de Propagation’, No. 7. Problémes de Conversion économique: Analyses Théoriques et études Appliquées; Bibliothèque de l’Institut de Science économique: Paris, France, 1965. [Google Scholar]
  41. Meller, P.; Marfán, M. Small and Large Industry: Employment Generation, Linkages, and Key Sectors. Econ. Dev. Cult. Chang. 1981, 29, 263–274. [Google Scholar]
  42. Clements, B.J. On the decomposition and normalization of interindustry linkages. Econ. Lett. 1990, 33, 337–340. [Google Scholar] [CrossRef]
  43. Strassert, G. Zur bestimmung strategischer sektoren mit hilfe von inputoutputmodellen. Jahrb. Natl. Stat. 1968, 182, 211–215. [Google Scholar]
  44. Cella, G. The input-output measurement of interindustry linkages. Oxf. Bull. Econ. Stat. 1984, 46, 73–84. [Google Scholar] [CrossRef]
  45. Schultz, S. Approaches to identifying key sectors empirically by means of input-output analysis. J. Dev. Stud. 1977, 14, 77–96. [Google Scholar] [CrossRef]
  46. Heimler, A. Linkages and Vertical Integration in the Chinese Economy. Rev. Econ. Stat. 1991, 73, 261–267. [Google Scholar] [CrossRef]
  47. Miller, R.E. Interregional Feedback Effects in Input-output Models: Some Preliminary Results. Reg. Sci. Assoc. 1966, 17, 105–125. [Google Scholar] [CrossRef]
  48. Miller, R.E. Interregional feedbacks in input-output models: Some experimental results. West. Econ. J. 1969, 7, 57–70. [Google Scholar] [CrossRef]
  49. Rasmussen, P.N. Studies in Inter-Sectoral Relations. Ph.D. Thesis, Copenhagen University, Copenhagen, Denmark, 1957. [Google Scholar]
  50. WFP. India—Food Security Atlas of Rural Odisha, 2008. UN World Food Programme (WFP); World Food Programme: New Delhi, India, 2008. [Google Scholar]
  51. WFP. Comprehensive Food Security & Vulnerability Analysis (CFSVA) Ghana; World Food Programme: New Delhi, India, 2009. [Google Scholar]
  52. Lykke Hvam, L. The role of the state in development. A Case Study of Food Security and Vulnerability among Beneficiaries of India’s Targeted Public Distribution System (TPDS); Lund University: Lund, Sweden, 2013. [Google Scholar]
  53. Biswas, A.K.; Uitto, J.I. Sustainable Development of the Ganges-Brahmaputra-Meghna Basins; United Nations University Press: Tokyo, Japan, 2001. [Google Scholar]
  54. Rasul, G. Food, water, and energy security in South Asia: A nexus perspective from the Hindu Kush Himalayan region. Environ. Sci. Policy 2014, 39, 35–48. [Google Scholar] [CrossRef]
  55. Faisal, I.M.; Parveen, S. Food security in the face of climate change, population growth and resource constraints: Implications for Bangladesh. Environ. Manag. 2004, 34, 487–498. [Google Scholar] [CrossRef] [PubMed]
  56. Yu, W.; Alam, M.; Hassan, A.; Khan, A.S.; Ruane, A.C.; Rosenzweig, C.; Major, D.C.; Thurlow, J. Climate Change Risks and Food Security in Bangladesh; World Bank: Washington, DC, USA, 2010. [Google Scholar]
  57. AFC. The Ghana Food Security Research with a Focus on the Upper West Region Submitted to Mennonite; Economic Development Associates (MEDA), 2012; Available online: http://www.associatesforchange.org/download3/Pro%20Poor%20Research/Final%20MEDA%20%20Food%20Security%20Research%20Report%2017%20July%20by%20AfC.pdf (accessed on 20 March 2018).
  58. Renaud, F.G.; Szabo, S.; Matthews, Z. Sustainable deltas: Livelihoods, ecosystem services, and policy implications. Sustain. Sci. 2016, 11, 519–523. [Google Scholar] [CrossRef]
  59. Gray, C.L.; Mueller, V. Natural disasters and population mobility in Bangladesh. Proc. Natl. Acad. Sci. USA 2012, 109, 6000–6005. [Google Scholar] [CrossRef] [PubMed]
  60. Kartiki, K. Climate change and migration: A case study from rural Bangladesh. Gend. Dev. 2011, 19, 23–38. [Google Scholar] [CrossRef]
  61. Boano, C.; Zetter, R.; Morris, T. Environmentally Displaced People: Understanding the Linkages between Environmental Change, Livelihoods and Forced Migration; Refugee Studies Centre: Oxford, UK, 2008. [Google Scholar]
  62. Byravan, S.; Rajan, S.C. The Ethical Implications of Sea-Level Rise Due to Climate Change. Ethics Int. Aff. 2010, 24, 239–260. [Google Scholar] [CrossRef]
  63. Williams, A. Turning the Tide: Recognizing Climate Change Refugees in International Law. Law Policy 2008, 30, 502–529. [Google Scholar] [CrossRef]
  64. Biermann, F.; Boas, I. Preparing for a Warmer World: Towards a Global Governance System to Protect Climate Refugees. Glob. Environ. Polit. 2010, 10, 60–88. [Google Scholar] [CrossRef]
  65. Tacoli, C. Crisis or adaptation? Migration and climate change in a context of high mobility. Environ. Urban. 2009, 21, 513–525. [Google Scholar] [CrossRef]
  66. Arora-Jonsson, S. Virtue and vulnerability: Discourses on women, gender and climate change. Glob. Environ. Chang. 2011, 21, 744–751. [Google Scholar] [CrossRef]
  67. Haysom, L. Gender and climate change. Agenda 2014, 28, 1–2. [Google Scholar] [CrossRef]
Figure 1. Simplified structure of a national input-output (IO) table. Source: Adapted from [23,24].
Sustainability 10 00893 g001
Figure 2. Multiregional input-output (MRIO) for the Delta and Non-Delta regions. Source: Adapted from [23,24].
Sustainability 10 00893 g002
Figure 3. Gross domestic product (GDP), purchasing power parities (PPP) per capita 2011 (Billion U.S.$/person) at the deltas and rest of the country. Source: Own elaboration from Deltas, vulnerability and Climate Change: Migration and Adaptation (DECCMA) MRIO tables.
Sustainability 10 00893 g003
Figure 4. Distribution of GDP by sector. Source: Own elaboration from DECCMA MRIO tables. (a) Volta delta; (b) Mahanadi delta; (c) Indian Bengal delta; (d) Bangladeshi Bengal delta.
Sustainability 10 00893 g004
Figure 5. Cropland and pasture land used in each delta by final destination. Source: Own elaboration from the computations with the IO table and extensions of the delta and Rest of the country.
Sustainability 10 00893 g005
Figure 6. Cropland and pasture land embodied in each delta by sector of final demand. Source: Own elaboration from the computations with the IO table and extensions of the delta and Rest of the country. (a) Volta delta; (b) Mahanadi delta; (c) IB delta; (d) BB delta.
Sustainability 10 00893 g006aSustainability 10 00893 g006b
Table 1. Demographic profile for the Volta delta (and Rest of the Country).
District NameArea (km2)Density (people/km2)Total Population% TotalTotal Male% MaleTotal Female% Female
South Tongu64413787,95010.240,01945.547,93154.5
Keta Municipal753196147,61817.168,55646.479,06253.6
North Tongu1460102149,18817.370,28247.178,90652.9
Akatsi South53618498,68411.445,49346.153,19153.9
Ketu South1130168190,27122.089,99847.3100,27352.7
Ada East290452130,97515.262,17447.568,80152.5
Ada West32418359,1246.828,57948.330,54551.7
Total Delta5136168863,810100405,10146.9458,70953.1
Total Non-delta233,39710223,795,01310012,228,87751.411,566,13648.6
Source: 2010 Population and Housing Census Districts’ Composite Budgets for 2013 Fiscal Year [16].
Table 2. Demographic profile for the Mahanadi delta (and Rest of the Country).
District NameArea (km2)Density (people/km2)Total Population% TotalTotal Male% MaleTotal Female% Female
Puri35014851,698,73021.1865,38050.9833,35049.1
Bhadrak24516151,506,33718.8760,26050.5746,07749.5
Kendrapara24805811,440,36117.9717,81449.8722,54750.2
Jagatsinghapur16696811,136,97114.2577,86550.8559,10649.2
Khordha27558172,251,67328.01,167,13751.81,084,53648.2
Total Delta16,7994788,034,0721004,088,45650.93,945,61649.1
Total Non-delta3,287,2633661,202,535,501 619,033,38751.5583,502,11448.5
Source: [18].
Table 3. Demographic Profile (2011) for 2011 for the Indian Bengal delta (and Rest of the Country).
Total PopulationTotal Male% MaleTotal Female% Female
Non-DeltaTotal1,192,397,831613,828,67651.5578,569,15548.5
Rural823,111,641422,326,87051.3400,784,77148.7
Urban369,286,190191,501,80651.9177,784,38448.1
Indian Bengal DeltaTotal18,171,7429,293,16751.18,878,57548.9
Rural10,351,8075,305,77351.35,046,03448.7
Urban7,819,9353,987,39451.03,832,54149.0
Source: (“Primary Census Abstract 2011, West Bengal”). Census of India-2001 & 2011 [18,19].
Table 4. Demographic Profile (2011) for the Bangladeshi Bengal (BB) (and Rest of the Country).
RegionArea (km2)Density (people/km2)Total Population (Thousand)Total Male (Thousand)% MaleTotal Female (Thousand)% Female
Non-delta100,2211041104,28352,47450.351,80949.7
Delta47,80279337,89818,67749.319,22150.7
Source: [18].
Table 5. Cropland and pasture land used (thousand hectares) in each delta by agricultural sector. Source: Own elaboration from the computations with the IO table and extensions of the delta and rest of the country.
Direct Land MahanadiDirect Land IBDDirect Land GBMDirect Land Volta
Paddy rice845833300015
Wheat0121080
Cereal grains nec.1570431
Vegetables, fruit, nuts603065551
Oil seeds957990
Sugar cane, sugar beet21710
Plant-based fibers176540
Crops nec.19319366
Bovine cattle, sheep and goats, horses2921025
Animal products nec.26760142
Raw milk76820341
Wool, silk-worm cocoons5500
Table 6. GDP losses with the hypothetical disappearance of the agricultural sector.
Direct Losses (Mio USD)% Total GDPIndirect Losses (Mio USD)% Total GDPTotal Losses (Mio USD)% Total GDP
Mahanadi−123227.3%−160.4%−124827.7%
IB−415016.6%−3071.2%−445717.8%
BB−801916.2%−24765.0%−10,49521.2%
Volta−45624.1%−1568.3%−61232.4%
Source: Own elaboration from the computations with the IO table and extensions of the delta and Rest of the country.

