Article

Measurement and Spatial Differentiation Characteristics of Transit Equity: A Case Study of Guangzhou, China

1
School of Geography and Planning, Sun Yat-sen University, Guangzhou 510275, China
2
Institute of Transport Geography and Spatial Planning, Shaanxi Normal University, Xi’an 710119, China
3
College of Environment and Resources, Fuzhou University, Fuzhou 350116, China
*
Author to whom correspondence should be addressed.
Sustainability 2018, 10(4), 1069; https://doi.org/10.3390/su10041069
Submission received: 23 January 2018 / Revised: 25 March 2018 / Accepted: 29 March 2018 / Published: 3 April 2018
(This article belongs to the Special Issue Travel Behaviour and Sustainable Transport of the Future)

Abstract

:
Urban public transit is an important solution for narrowing the mobility gap between captive riders and choice riders and to address issues of social equity. An equitable transit system essentially could meet the needs of transit dependents and maximize the scope of public transit services. To acquire a better understanding of transit equity, we use Lorenz curves and the GINI coefficient to measure the relative supply of public transit to the population and employ the spatial overlay method to analyze the matching degree of transit supply and demand in Guangzhou, China. The findings show that there are obvious and unequal differences between the levels of transit service in the internal zones. The spatial coverage rate and number of stop services of the outer city are significantly less than that of the inner and middle city. Eighty percent of the population shares only 36.7% of the public transit supply in Guangzhou. Most communities of low-supply and high-need public transit are distributed contiguously in the eastern Baiyun and southern Huadu districts. This distribution pattern is beneficial to the transit agency, which could improve the supply in these areas to avoid the risk caused when a large number of residents lack access to public transit services. The results could serve as an excellent foundation for planning the handling of spatial gaps in the Guangzhou public transit supply.

1. Introduction

Vitality, a significant indicator for measuring a city, lies in spatial accessibility. The urban space and its facilities are not perfect when their access is automobile dominated, far from a transit system or inconvenient for walking [1]. China is currently going through rapid urbanization. The growth of the population and the expansion of urban space in a mega-city determines two main issues that must be solved during the pursuit of sustainable development: intensive land use and the transformation of urban spatial structures from the single-center pattern to the multi-center one. Urban transport networks play a guiding role in forming urban spatial structures and land use patterns [2]. However, the transportation problems of the big cities in China are serious, which are mainly manifested in traffic congestion, air pollution, and low travel efficiency [3]. Faced with a huge transport demand and overall transportation problems, China’s large cities must implement public transit strategies, make them a priority, and establish a public-transit-oriented land use pattern to achieve the goal of urban sustainable development [4,5].
With the transition of the planned economy to the market economy, as well as the continuous deepening of enterprise reform, the polarization between rich and the poor in urban China has been aggravated. The living pattern, based on the socioeconomic stratum, was formed and the poor strata showed the tendency of inhabiting particular geographical spaces [6]. The poverty of these groups is aggravated by high transport expenditure, long travel time, as well as a lack of public transit services [7]. The focus of transport planning has shifted from its traditionally well-studied economic influence to evaluating the social and environmental implications, in which equity is an important goal [8]. People should have equal access to mass transit and one way to achieve equity is to provide public transit to individuals who need it most [9]. If the transit system fails to meet those who rely on public transit for everyday life, individuals may suffer from transport-related social exclusion [10,11]. With the increase in urban socio-spatial polarization, balancing the distribution of public transit networks on the basis of all citizens and appropriately tilting it to specific social groups is a social equity issue that requires attention [12]. The success of cleansing and transforming slums in some European countries shows that upgrading and improving the living environment of communities is essential and measures must be taken to alleviate urban poverty at the community level [13].
Since the 1960s, researchers have been examining the connection between population demographics and transit, as well as the influencing factors of the spatial distribution of different social groups [14]. Glaeser et al. found that public transit in central cities is the main influential factor, after studying the effects of transit on residential choice between rich and poor in big cities [15]. Kain’s spatial mismatch theory posits that the low-income working populations who live in city centers of America are far from the suburbs and therefore have difficulty reaching job-rich areas [16]. Most studies based in the United States contend that regions with lower transit accessibility are correlated with lower income levels [17]. However, in many other conditions, due to better transit networks and employment density, many low-income workers living around city centers have higher accessibility to jobs available downtown and in the adjacent zones [18,19,20]. Studies on equitable distribution in the field of public facilities have gone through three periods: territorial equality, spatial equity, and social equity. Studies in the territorial equality stage focus on the difference of the accessibility level of public service facilities among regions, the spatial equity stage is the “spatial matching” between the distribution of facilities and residents, and the focus of the social equity stage is on equity and justice for different social groups. The distribution of transit networks affects the education and medical opportunities that social groups acquire, and scholars in recent years have begun to address the extent of how public transit makes transit dependents participate in necessary social activities [21,22]. One way to quantify public transit deficiencies is to construct the index of need and that of public transit supply [23]. The former is based upon the distribution of sociodemographic groups and public service facilities, and the latter represents the region’s level of public transit service. The difference between the two indices is called the “transport gap”, which represents the indicators of a region’s transport-disadvantaged level.
This study intends to measure the equity distribution of a transit network objectively and to understand transport disadvantages in Guangzhou. The measurement concerns horizontal equity (i.e., the distribution of transit accessibility of communities), in which Gini coefficients are calculated for each study district and for the whole study area to provide an equity measure and highlight potential areas for intervention, as well as vertical equity (i.e., spatial gaps in transit supply based on social needs).
The remainder of the paper is structured as follows. Section 2 provides a brief summary of the research context regarding studies on public transit equity. Section 3 demonstrates the methodology employed for the study. Section 4 associates the results with the spatial distribution of equity assessment of public transit. Section 5 then concludes the paper by providing the discussion and policy implications of the key findings.

2. Research Context

The interest in considering equity first appeared in the 1990s with an exploration of the demand to consolidate equity as a policy target in public transit supply. One way to achieve this goal in the city context is to provide transit services to the people who need it most. Litman argues that transport equity analysis should focus on two dimensions: horizontal equity and vertical equity [24]. Horizontal equity emphasizes the impact of transport resources on impartiality in distribution among different individuals, and resembles studies on the spatial equity stage of public service facilities in that the two explore the minimum equality standard of the “uniform” people without considering sociospatial differentiation. Vertical equity involves equality in the distribution of transport resources among individuals differing in needs and capabilities, which emphasizes the needs of various social groups to make up for social injustice.
The focus of the horizontal equity framework is on transit services offered to the maximum number of users. The earliest studies examined the quality of transit services by using a few simple yet strong indicators such as ‘the density of public transit service kms’, which forms the basis to recognize spatial maps that manifest service quality [25]. At present, the equity assessment of transit supply is closely related to accessibility and connectivity measurements. Delbosc and Currie used the Gini coefficient and Lorenz curve as measures to discuss the equity of Melbourne’s public transit supply among different groups and concluded that 70% of the population only shared 19% of services [26]. Transit connectivity, as used by Kaplan S., was a measure of comprehensive impedance for assessing equity in the Denmark public transit supply [27]. Karner A. developed and demonstrated a measure of route-level accessibility that can be used to provide a direct comparison of public transit accessibility outcomes for protected demographic groups relative to a system-wide mean or non-protected groups [28].
Equity assessments affected by a public transit project and policy appraisal is one topic of vertical equity studies. The investment in transport infrastructure has been increasing with the development of the urban economy. The equity impact of transport infrastructure projects is the basis to ensure equitable urban transportation [29]. Steven et al. analyzed the social equity impacts on social groups when public transit ticket pricing structures shifted from flat fare pricing to distance-based fares [30]. Nuworsoo et al. studied the impact of different public transit charging schemes on transport equity through the household travel survey and assessed the actual impact, particularly on low-income populations [31]. Lau analyzed the spatial mismatch during the construction of Singapore’s new urban center and assessed affordability for low-income groups who use public transit to commute, and the results are of great value to the construction of new towns during the rapid urbanization process [32].
With the recent interest in transport and social exclusion, accessibility analysis has been widely used to assess the rationality of the distribution of public transit service relative to social needs. The ‘PTAL’ (Public Transport Accessibility Level) approach has been used since the early 1990s to assess equity in transit supplies in the UK [33]. In this method, transit accessibility is measured using an index comprising walking access time, reliability of service and number of services within the catchment. Although the ‘PTAL’ approach was criticized for overly emphasizing ‘place-based’ gaps in services when other forms of transport disadvantage (e.g., accessibility limitations caused by financial situation, mobility, or individual-based needs, etc.) can be experienced by social groups with no particular spatial concentration, it provides a useful way for the spatial evaluation of public transit and social needs [34]. Providing public transit services for disadvantaged groups is an important manifestation of vertical equity. Many existing studies illustrated the links between public transit supply, well-being, social exclusion, and time poverty for low-income populations and those of the general, the disabled, the elderly, and female populations [28,35]. These studies focused on the travel characteristics of transport disadvantaged groups from the perspective of behavioral geography, which provides a reference point for research on the spatial patterns of public transit equity [36,37].
Urban public transit is an important spatial attribute in which the implication expressed through the theme of equity has special significance. However, the discussion of vertical equity mainly focuses on certain groups [38], in which some spatial information is neglected. This study discusses the equity of transit network distribution from two aspects. First, in terms of horizontal equity, this paper evaluates the spatial match between the distribution of transit access and residents based on the community level. Second, in terms of vertical equity based on needs, we generate communities’ needs indices related to public transit by using the linear weighting function relation between sociodemographic variables and facility accessibility to identify the areas where supply and needs are seriously mismatched. The results of this study provide a good basis for recognizing the spatial differences between supply and needs of public transit in Guangzhou.

3. Methodology

3.1. Study Scope

The scope of study in this paper includes all nine municipal districts of Guangzhou City, with coverage of more than 3647.43 km2 containing 2009 communities. The average population size and the average area per community are 5505 people and 1.795 km2 respectively. Guangzhou, the third largest city of China, is a pioneer city in reform and opening-up and now dominates as the core city of the Pearl River Delta economic circle, which is one of the three major economic circles. Guangzhou is a microcosm of major cities in China regarding the public transit equity issue. We use population-related data of the community level from the 2010 yearbook of the sixth census of Guangzhou.

3.2. Approach to the Transit Supply Measurement

The transit supply measurement aims to generate an index that could represent fair/poor access distance to the public transit and measure the transit service level for each community. It covers bus and subway services in the study zone. The calculation method of this index is detailed in Currie [37,38], and the following formula is used for index calculation:
S I c o m = N A r e a B n A r e a com * SL Bn )
In which S I c o m stands for the supply index of the community under analysis, and N the amount of stops within walking distance of each community, B n is the walking buffer area for each stop in each community, A r e a com is the spatial zone of the community, and S L is the measure of service level (number of bus/subway arrivals each week).
The calculation of the index of transit supply requires the following steps: First, leverage the basic data of remote sensing images from the Geospatial Data Cloud [38], and implement vectoring operations for public transit stop locations in the ArcGIS10.3 software. We then supplemented the names of stops/stations and bus/subway lines based on the Baidu map and Amap, and established the public transit spatial database. The database was updated in January 2017, and included 1191 bus lines, 5573 bus stops, 10 subway lines, and 148 subway stations. Finally, a database of bus stops and subway stations was set up, including the location of each stop/station, bus/subway lines passing the stop/station, frequency, and service hours of the lines.
The service frequency of each stop/station is computed as “the total amount of vehicle arrivals each week”. In each community, the distance to access each stop/station is measured, positing a walk access of 400 m and 800 m respectively for bus stops and subway stations, which is based on typical walk catchment areas (75% to 80% of residents would go to a stop by walking) for public transit modes in existing studies. In some cases, the integrated service level of subway and bus and the overlap in walk catchments are ‘double counted’, recognizing that these areas are more prominent in the specific service level. The actual transit stop does not necessarily have to be within the community in order to make a contribution to the supply for that community.
This method is limited because it uses service frequency without measuring access to the desired destinations. A community that has a single, high frequency bus line passing by may be assigned the same value as the community centered on two bus lines with half the frequency in the same direction [39]. In spite of this limitation being known, this simplicity contributes its usefulness to the wide-application for practitioners. Anyone with access to a GIS platform and knowledge of the service levels and transit stops can compute this index for any area. Overall, the adopted approach quantifies the supply of broad levels. The use of each stop to assess walk catchments to identify overlapping walk ‘buffers’ with a higher service level is a refinement to the other methods [40]. Communities with a population density of less than 50 people per square kilometer were excluded from this study when using the Lorenz curve and GINI coefficient to measure equity, owing to the fact that by including these large areas with very small population into the calculation, severe deviation in the horizontal equity will arise [26].

3.3. Equity Analysis

3.3.1. Lorenz Curves and Gini Coefficient

The Gini coefficient and Lorenz curves are usually used to measure and analyze the inequality of income distribution in a region, which could be applied to the diachronic comparison of the same city and the synchronically comparative assessment of different cities. Currently they have been applied in various disciplines, from studies of transport to business modelling and even within biodiversity [38,39,40,41,42,43]. The introduction of the Gini coefficient and Lorenz curve to the field of transport is used for the analysis of the equity of traffic resources allocation in different regions and the comparison of different groups possessing or using traffic resources. Because income distribution is similar to that of public service facility distribution in the implication of equity, many scholars have adopted this method in the equity evaluation study on the distribution of public transit resources. This study uses the Gini coefficient and the Lorenz curve to analyze the horizontal equity of communities’ transit accessibility. The Lorenz curve is a graphical representation of equity that illustrates the distribution of a public transit network among its inhabitants and stands for the cumulative public transit resources enjoyed by a certain proportion of residents (Figure 1). In this figure, the curve between OD is a Lorenz curve, which reflects the inequality degree of the distribution of public transit resources. The OD line represents the ideal situation of absolute equitable distribution while the OD curve is the actual distribution. As the population scale expands, the cumulative public transit resources also increase. The larger the curvature is, the more inequitable the public transit resources distribution is, and vice versa.
The formula calculating the Gini coefficient is as follows:
G   =   1     k = 1 n ( P k     P k 1 ) ( R k     R k 1 )
G represents the Gini coefficient for evaluating the social equity of the urban transit network, and P k is the cumulative proportion of population, e.g., k = 1 ,   2 ,   3 ,   ,   n , P 0 = 0 , P n = 1 . R k is the cumulative proportion of transit supply values. As the measurement of income distribution, the value of Gini coefficient is set between 0 and 1; the smaller value illustrates greater equity. This study has no intention to identify if a higher Gini coefficient is fair or not, but instead to offer a representation of how service is distributed in a study area.

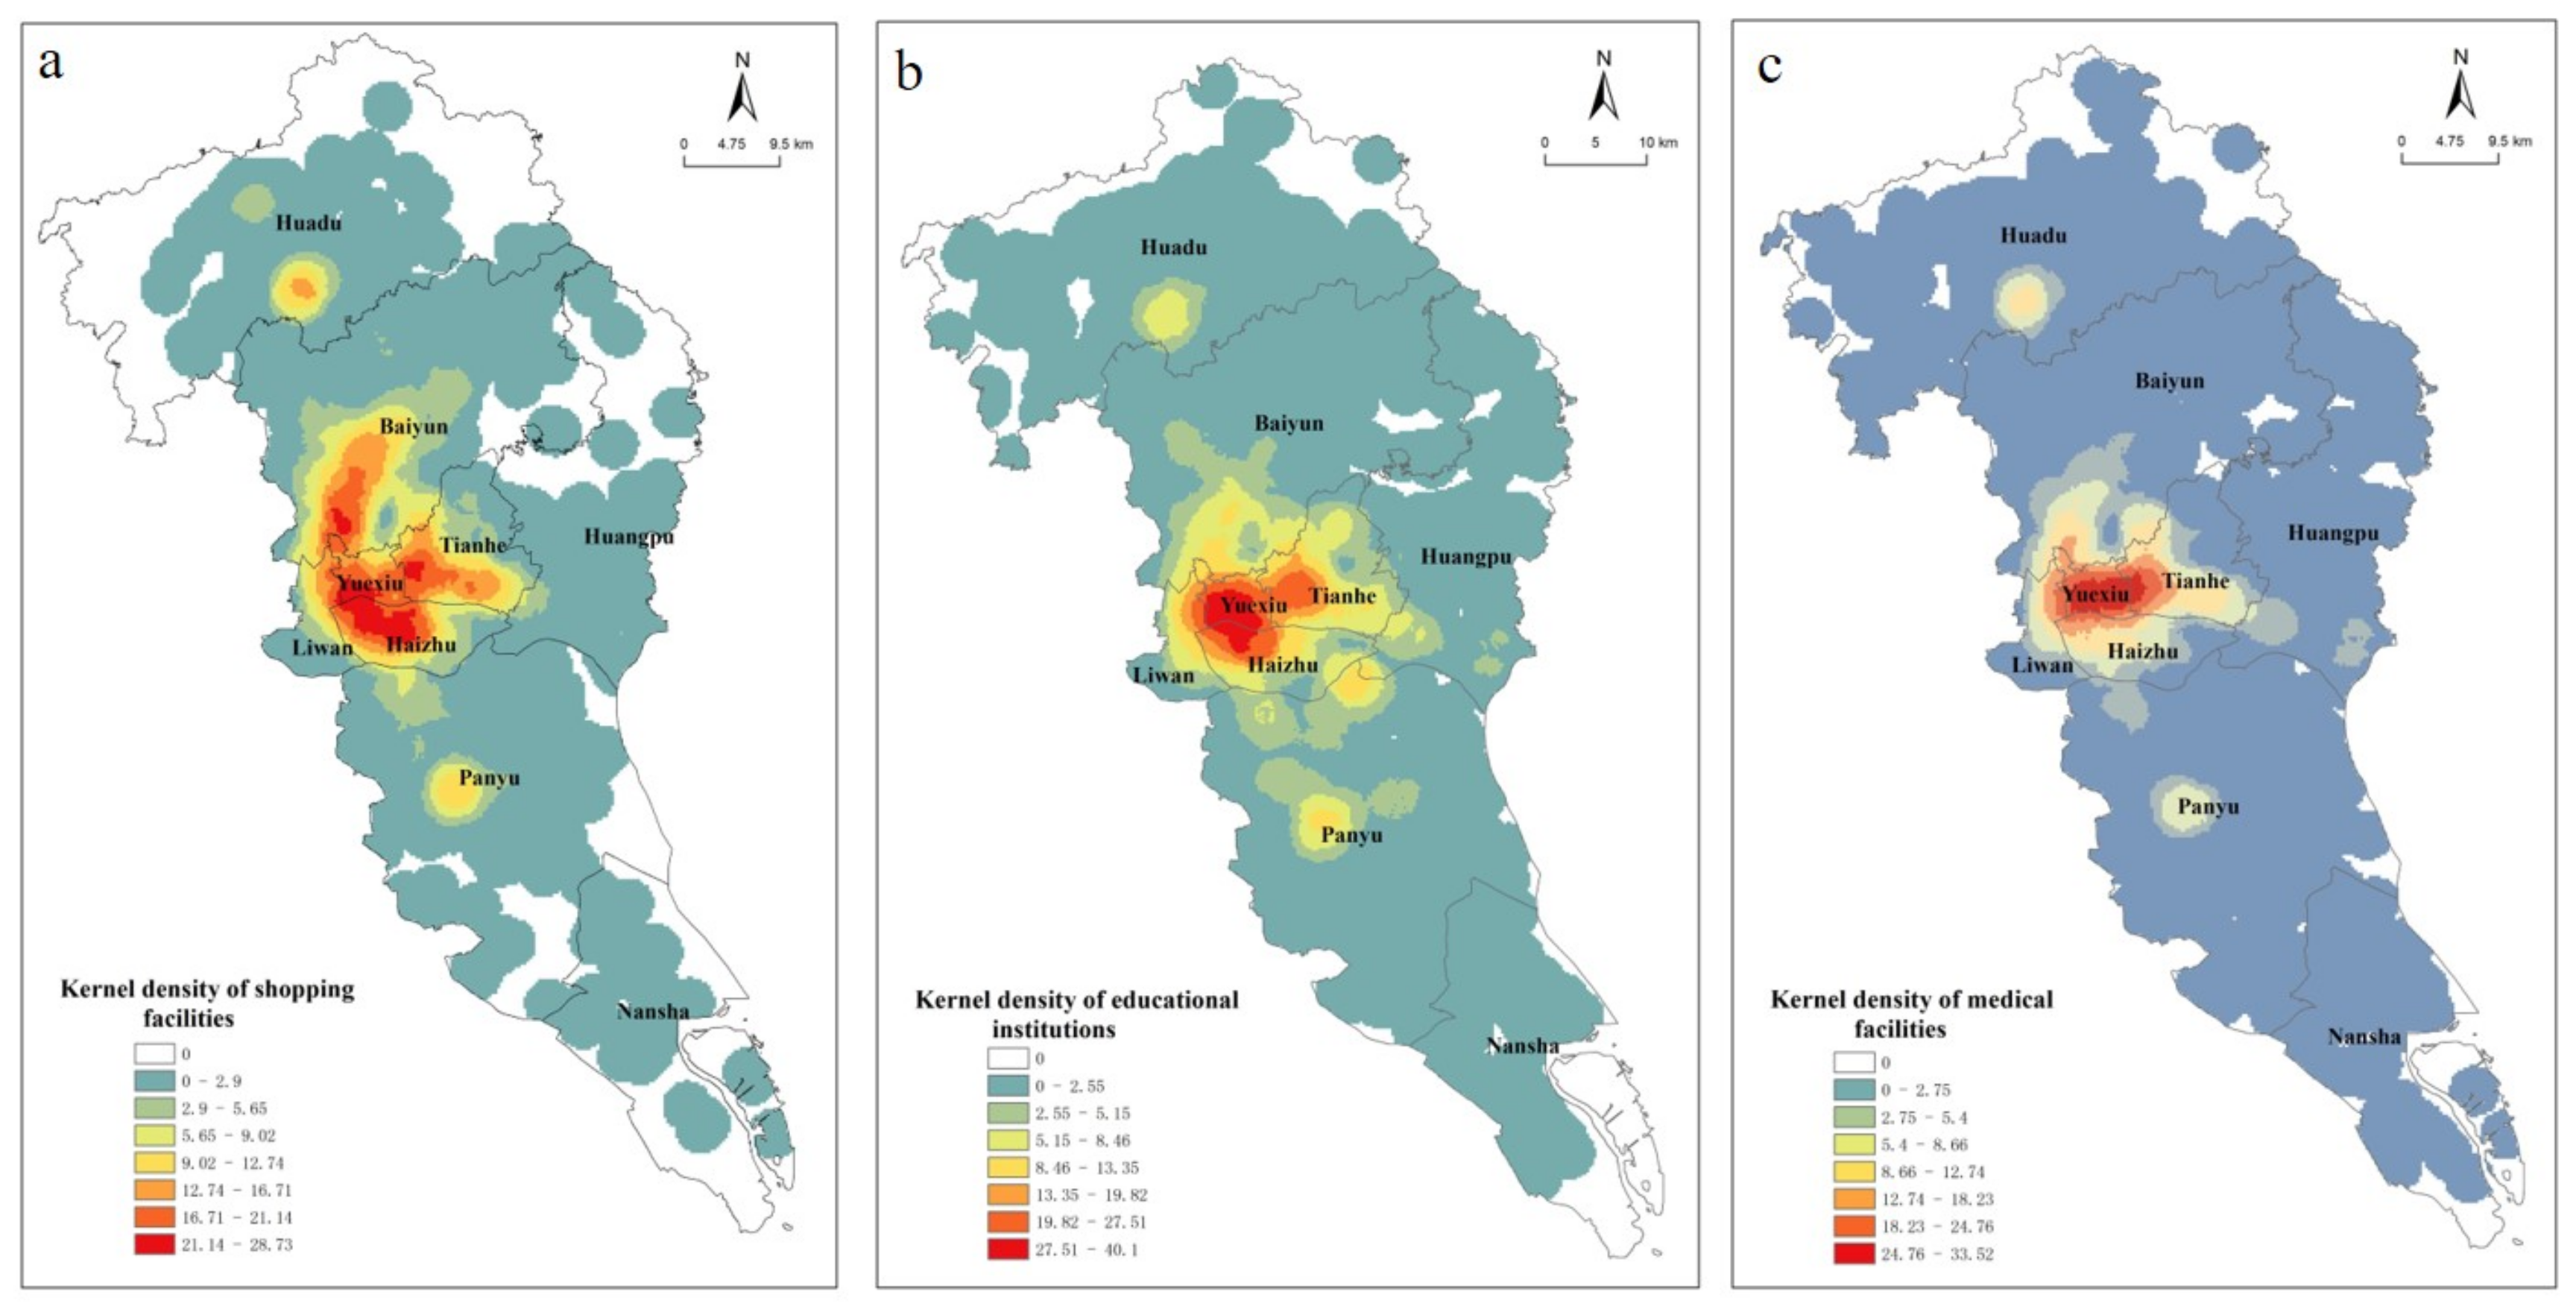
3.3.2. The Spatial Overlay of Supply Indicator and Transit Needs

The public transit needs index is used widely to evaluate the equity of the distribution of public transport resources. We compare the transit supply values of communities to the spatial distribution of needs indices by using the method of spatial overlay as the assessment of vertical equity.

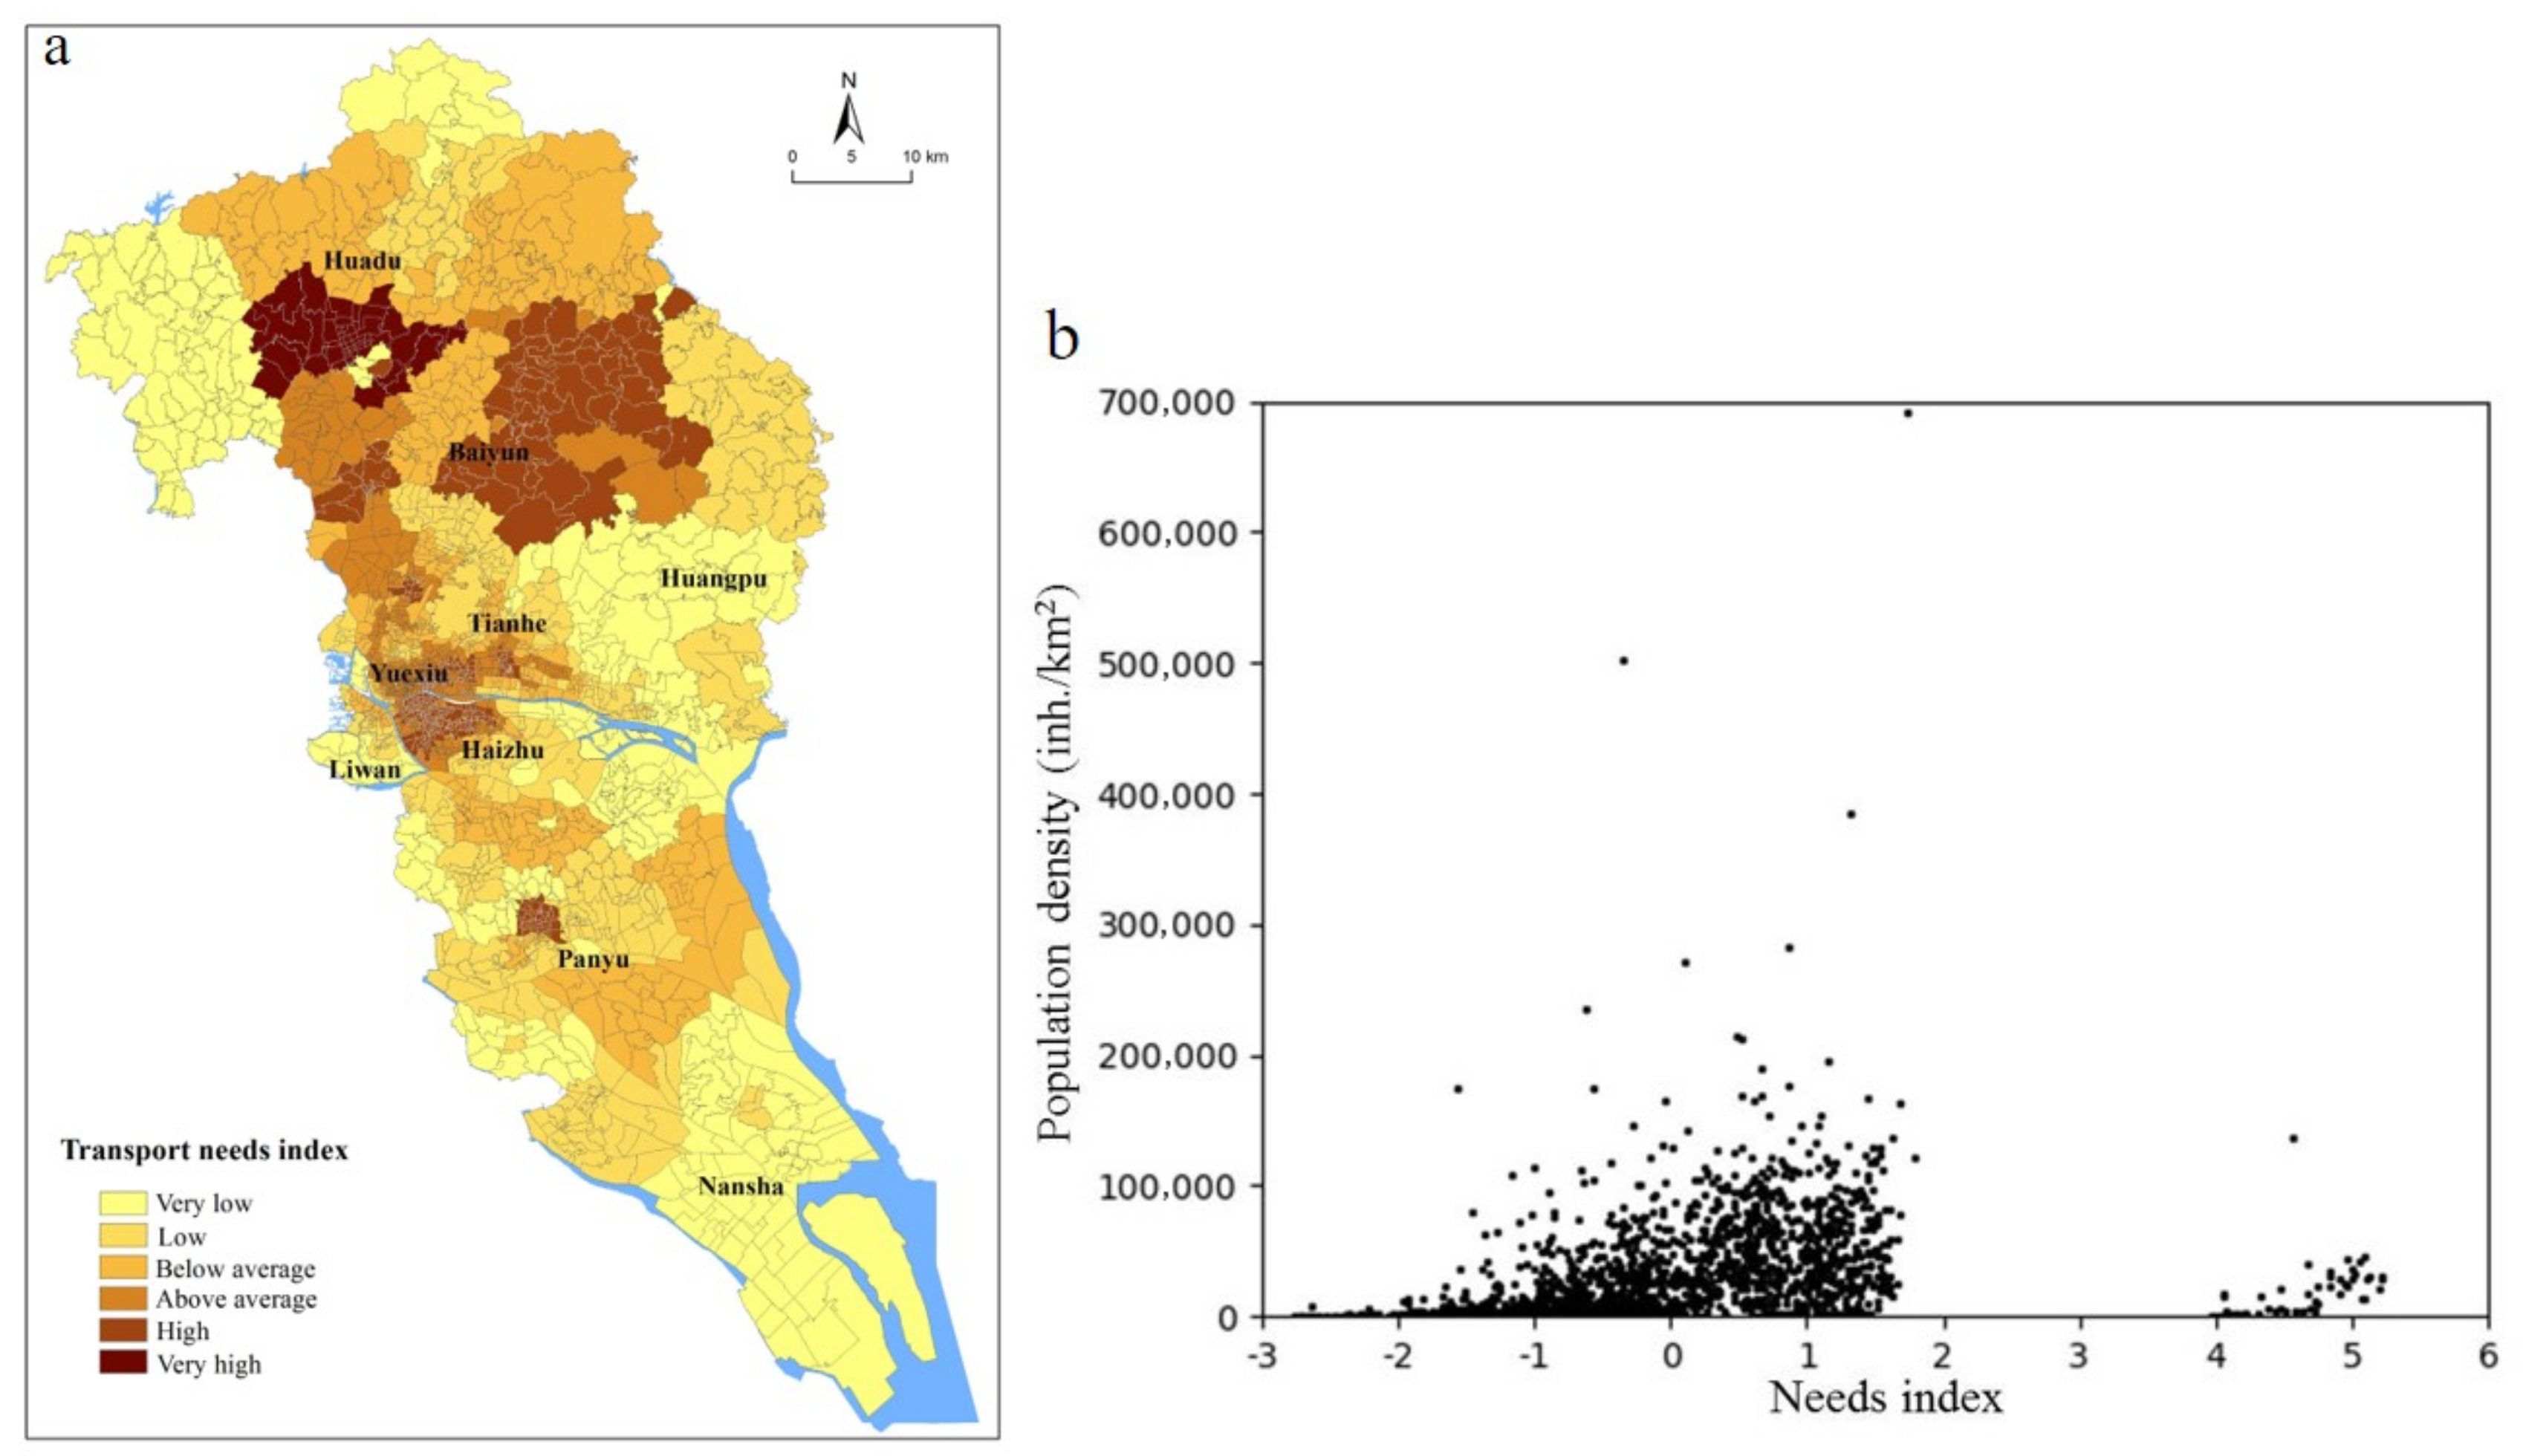
Index of Community Public Transit Needs

The influential factors of the transport disadvantage situation are diverse, including physical environment, physiological factors, and socioeconomic factors. The social exclusion theory believes that personal factors that affect transport disadvantage mainly include low-income status, car ownership, old-age, lack of education, and social status. Major locational factors are the distance from the city center, the average level of socioeconomic status, the crime level, and the level of accessibility to medical, education and entertainment activities, among others. Based on the structure of the index proposed by Currie (2004, 2010) and the socioeconomic condition of the case, there are 4 personal factors in this paper that represent the need for public transit in the community: a population over 65, teenagers aged 6–19, unemployed individuals and illiteracy levels [44,45,46]. There are three locational factors: the number of public service facilities within walking or bicycle distance of the community, and the distance from the community to CBD [47,48,49]. In Table 1 the quantitative indicators of transport disadvantage are shown for each community and the factor of disadvantage that it represents.
The data of public service facilities in this study are chosen from the point of interest (POI) data of medical, shopping, and education facilities. POI is a type of point data that represents real geographical entities, including latitude, longitude, address, and other spatial information and attributable information such as name and category [50]. These data divide geographical entities into 15 categories, in which shopping service, education culture service, and health care service are the main categories. Based on Baidu POI, the geographical coordinates of various facilities were collected as point data. We finally enumerated 7295 shopping facilities, 5667 medical facilities, and 7308 education institutions after eliminating duplicate data. Public service facilities are closely related to quality of life. Residents need to have sufficient accessibility to these facilities, which should be distributed in a ‘normal’ or reasonable range [51]. Figure 2 presents the Kernel density of the shopping facilities, educational institutions, and medical facilities. The nearest neighboring analysis results indicate these three types of public service facilities have significantly clustered patterns (the values of the nearest neighbor index R for the three are 0.089, 0.12, 0.095 respectively) and they have strong relevance with major city centers’ locations. Facility accessibility of the community refers to the number of medical facilities, shopping facilities, and educational institutions that can be accessed within certain travel times. Using ArcGIS10.3 software to calculate the network distance between centroids of communities and public service facilities, the facility is considered to be accessible by walking or cycling if the distance is less than 1.25 or 2.5 km. These distances echo the average travel time of 15 min, which is considered as the maximum standard for travel time of 80% of people in the existing research [52,53].
This paper uses factor analysis to obtain the needs index for each community. It is a method involving data dimensionality reduction, reducing a large number of variables to another smaller group of uncorrelated components that in turn are used to calculate the comprehensive score of each community for a certain index. Relatively disadvantaged communities that require public transit service are those with a high need index score, and relatively advantaged communities are those with a lower one [30]. The public transit needs index explains the differences between communities based on the correlation among these variables. Factor analysis sets higher weights for variables that affect the community more, which reveals the inner structure of the high-correlation dataset.

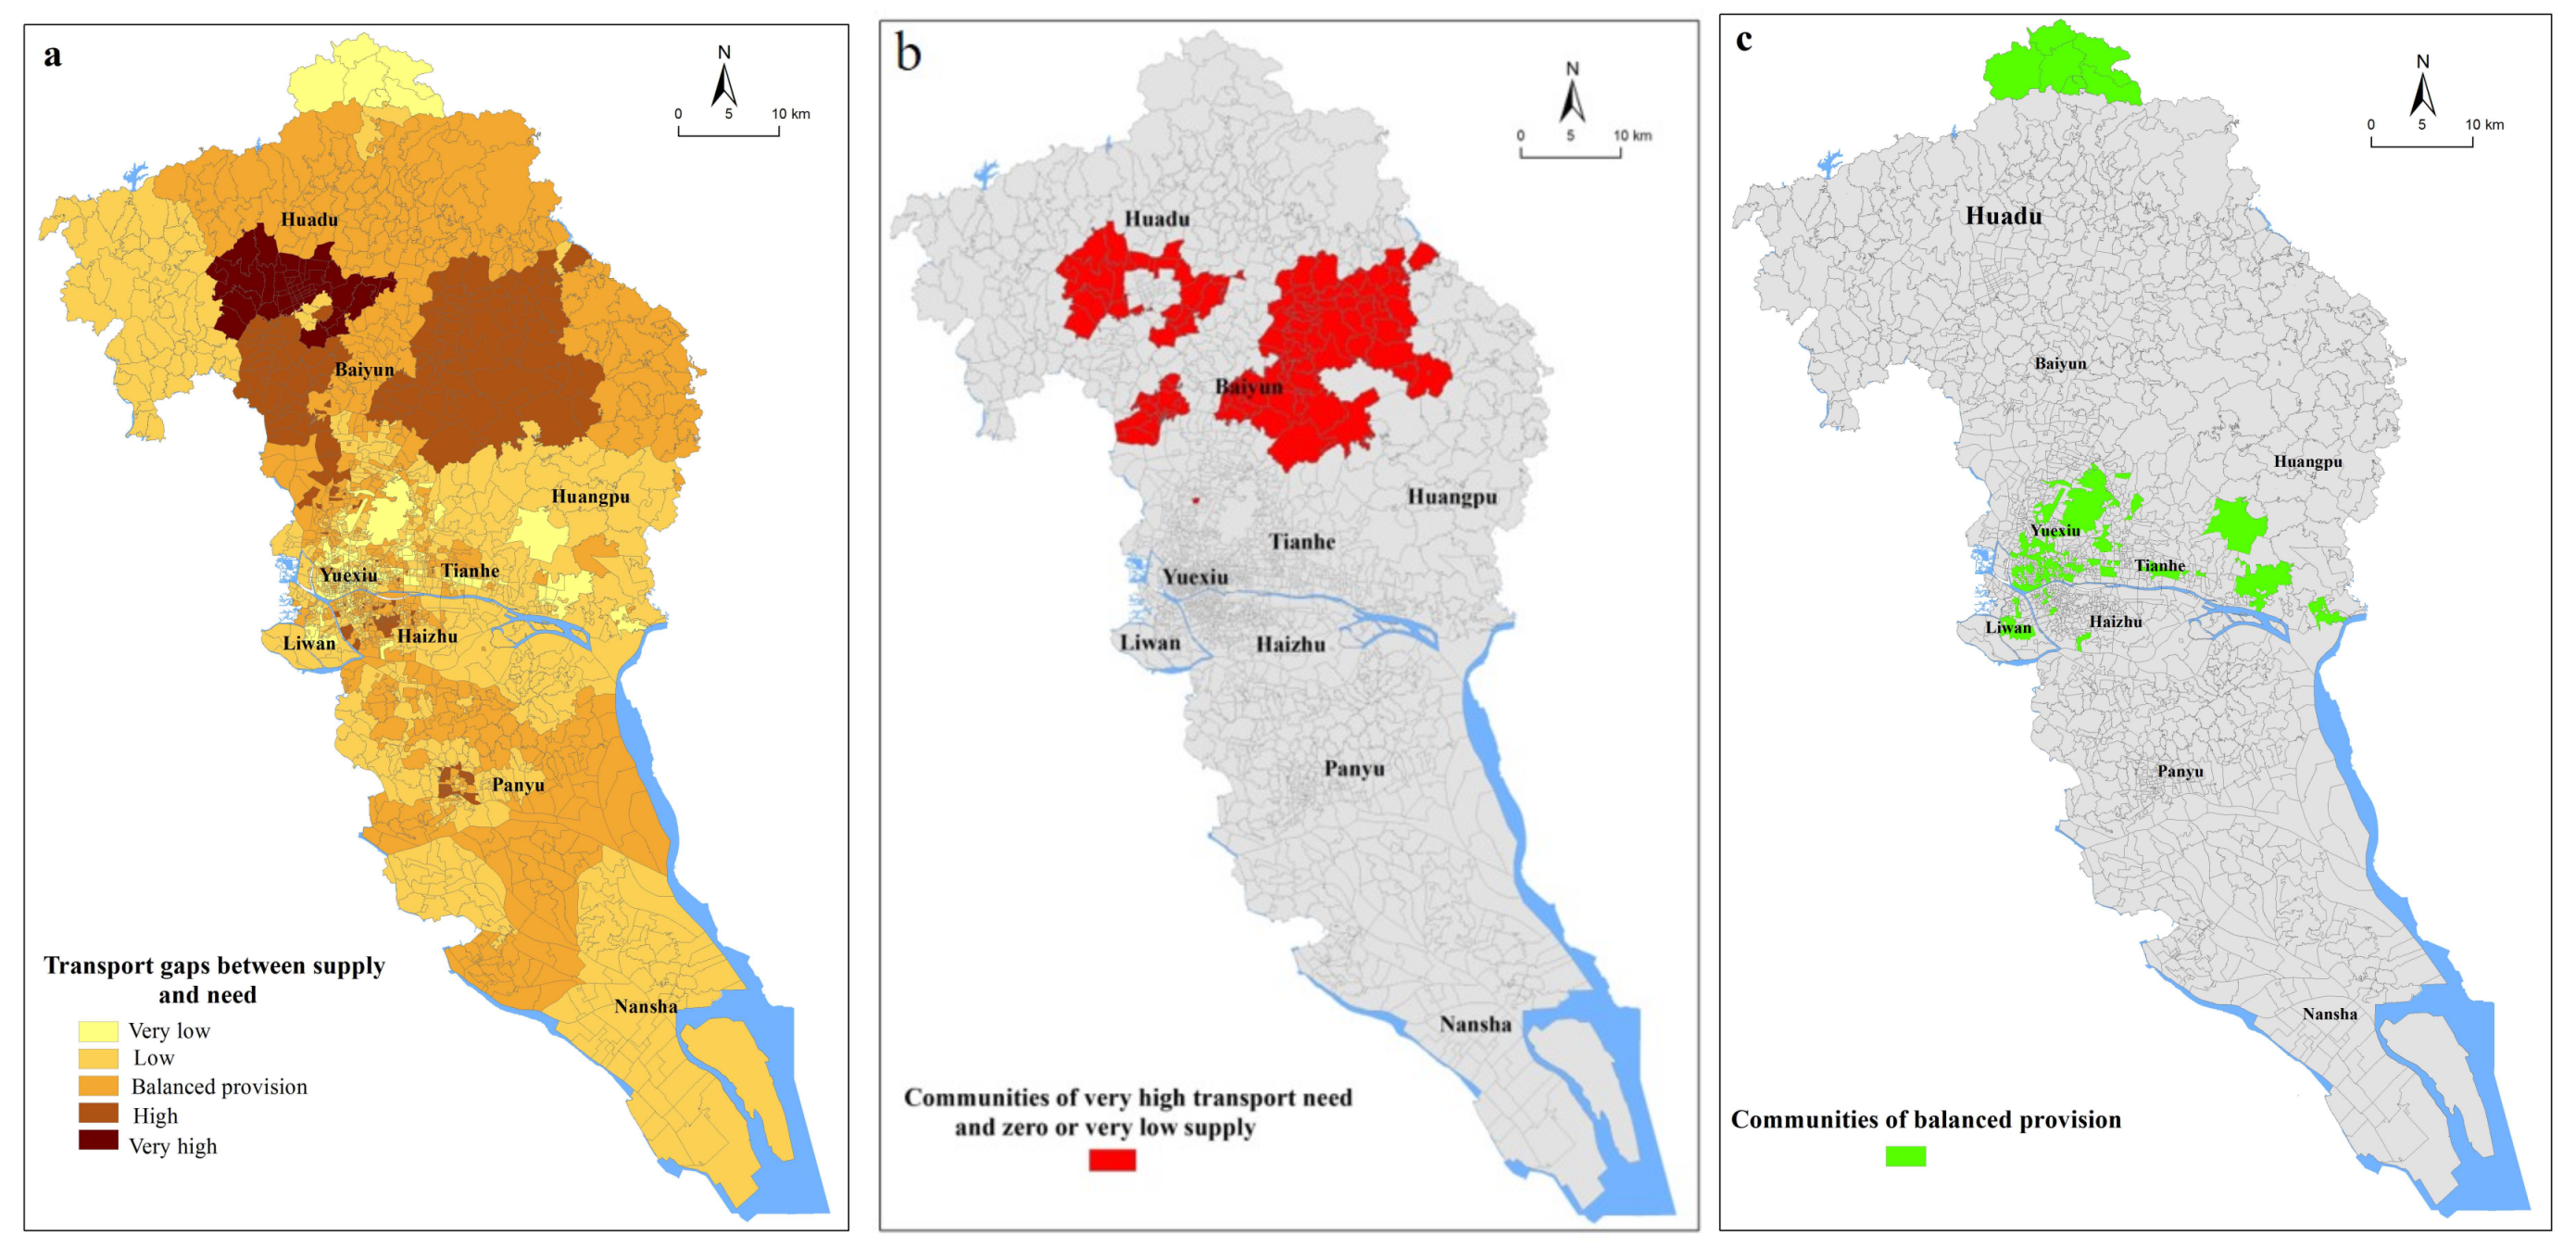
The Matching of Supply Indicator and Transit Needs

We use GIS mapping to compare the spatial distribution of the needs index with relative measures of transit supply, and calculate the public transit gaps index by subtracting the standardized supply and needs index. The method of min-max for data normalization is used here, and the formula is as follows:
x = ( x x m i n ) / ( x max x m i n )
T G = T N T S
T G is the gap index of the difference between public transit needs and supply; T N is the standardized value of transport needs; and T S is the standardized value of public transit supplies. Standardized scores then are introduced to help resist the measures’ limitations argued in the sections above, which makes the comparisons between scores of supplies and needs of different communities difficult to handle. Based on the standardized values, higher index values of designate areas resulted from a roughly strong demand for, but an undersupply of, public transit that requires considerable attention in public transit planning. Lower values indicate, from the perspective of economy, places with a provision that outgrows need.

4. Results

4.1. Overview

Table 2 is a summary of the service frequency and spatial coverage of bus stops at the community level in the regions of Guangzhou (inner city, middle city, and suburbs). The table indicates that there are 2043 arrivals per stop per week on average, and 6027 arrivals per community per week. On average, communities have a coverage of 73.01% in the walk catchment for public transit. Nevertheless, if Guangzhou in its entirety is evaluated, only 34.76% of Guangzhou is within a walk catchment for public transit. The obvious difference between the two figures can be accounted for by the fact that many small-size communities are high in walk catchment coverage (usually located in the inner city) but large communities (usually in the outer suburbs) dominate Guangzhou’s spatial coverage. Table 2 shows that the difference of public transit service level is very obvious among the inner, middle, and outer city. Stops in the inner city have an average number of 2909 arrivals per week and communities have an average number of 4944 times per week with an excellent spatial coverage of 94.64%. In contrast, the outer areas in Guangzhou have only 1157 arrivals per stop per week, which is 151.4% lower than the inner city and 40.1% lower than the middle city. Only 34.91% of suburb communities are within the public transit coverage areas (59.73% lower than the inner city and 23.76% lower than the middle city). On the whole, only 20% of suburbs’ spatial areas is covered by public transit within the walk catchment area, compared to 75% of the inner city. This illustrates limited walk catchment overlaps, sparser coverage, and the inferior service levels of the outer city in comparison with the inner city and the middle city.

4.2. Horizontal Equity Across the Population

Figure 3 shows the findings and measurement of spatial distribution of public transit supply, and communities with high supply index are concentrated mainly in the central areas. The high supply index is representative of a community that has good access distance to transit stops and a high level of public transit service. The supply index is categorized into seven groups, comprising three above average, three below average categories, and one group with zero supply. The red areas in Figure 3b represent high accessibility, low accessibility is in the green areas, and zero accessibility is in the brown areas. The figure shows that transit accessibility is concentrated highly in the central urban area and spreads to the surrounding communities. Zero supply covers 0.68% of the population, almost living exclusively in the Guangzhou suburbs. The very low supply group is located in most communities of the middle and outer city, in which 62.15% of the population is below the average of Guangzhou in supply index scores. Above average, high, and very high supply are dense in the inner city. The index is significantly lower in the outer suburbs and peripheral areas of the central city. The reason for the low supply index in the peripheral areas of the central city lies in the communities there with small areas. The overall level of public transit service is not satisfying, owing to the limited number of stops through the public transit’s intensive service frequency. The reason for the lower index in the outer suburbs is that the density of transit stops is relatively sparse, and the spatial coverage of services is limited.
The assessment should be based on population if the goal of the transportation department is to provide a high service level among all households. This section provides a basis for assessing the aggregation degree of public transit at several levels. Combining the population density of communities in Figure 3a and the distribution of transit accessibility of communities in Figure 2b can to some extent explain the horizontal equity results of the transit accessibility distribution. Figure 3c shows the Gini coefficient scores of each district, which depends on the topology of the transit network. With higher scores comes a greater concentration degree of transit accessibility [54]. Due to the decentralized property of their transit network, the districts acquire lower Gini Index scores, than other districts with highly centralized nature of transit. Among the ranking of Gini coefficient score of all districts, the Huadu district and Huangpu district rank first and second respectively (G = 0.703, 0.696), which are the closest to the absolute inequity value of 1. It indicates that the high-quality transit services of these two districts are mainly concentrated in several communities while other communities are poorly connected. The lowest value for the index of inequality falls in the Yuexiu district (G = 0.398), which indicates that the transit accessibility of communities in this district is generally good.
Using Lorenz curves visually represents the analysis results of the distribution of communities’ transit accessibility across the population (Figure 4). The overall degree of horizontal equity of transit services is low (G = 0.61), indicating that there is a certain difference among residents, and approximately 80% of the residents enjoy merely 36% of the available service. The Lorenz curve of the inner city (districts of Yuexiu, Haizhu, Liwan, Tianhe corresponds) more tightly with the perfect distribution line, and the distribution of transit network is more equitable among the population than the outer and middle city. The degree of equity of the outer city (districts of Huadu, Nansha district) is the lowest, where public transit serves a smaller proportion of the population.

4.3. Vertical Equity with Respect to the Transport Needs of Communities

4.3.1. The Analysis of Public Transit Needs

A statistical approach built on the foundation of factor analysis is utilized in this paper to gain values of transit need index for each community. The results show that the observed value of the Bartlett test is 15,870, the corresponding probability P is Sig. = 0 < 0.05, and the KMO value is 0.747. According to Kaiser’s KMO metric, the original variables group is a fair match for the factor analysis. Principal component analysis is employed as the extraction method in processing 7 × 2009 original data matrices. The method of varimax rotation is utilized to make the factor loading values deviate to the 0 and 1 poles as far as possible, which is convenient for information extraction and the naming of principal components. After five iterations, the results tend to converge. The component is selected according to the standard that characteristic values (eigenvalues) larger than 0.5, and cumulatively more than 86.98% of the total variance of the data (Table 3), and the corresponding principal component values can be obtained. Factor loading (Table 4) shows that the first component is attached with high loadings regarding the unemployed population (0.95), the uneducated population (0.926), the adolescents (0.901), and the population aged 65 and above (0.756), which represent groups unable to afford and/or use a car. The second component is associated strongly with the amount of primary infrastructure within walking (0.962) and biking distance (0.949), therefore manifesting the proximity to the elementary public service facility. Each of the components is weighted by its relative impact (normalized to unity) on the whole variance. Lastly, an index of public transit need per community is computed by using a linear combination of the factor loadings as weights for the single variable. Communities with a high index value are regarded to be comparatively disadvantaged.
Figure 5a represents the spatial distribution of the transport needs index for Guangzhou. Communities with a relatively high value of index shown in the dark areas are disadvantaged for transport and in need of strong services, and communities with low needs index values denote areas that most residents here not characterized as public transit dependent. Communities in parts of the Baiyun district and Huadu district are marked chiefly by high needs indices, owing to their smaller amounts of primary infrastructure within walking or biking distance. Relatively high needs indices are found in some communities in the districts of Yuexiu and Haizhu, mainly due to their special sociodemographics in the old inner-city. From Figure 5b, it is possible to qualitatively recognize that the highest value of needs indices is found in less-populated communities, and most inhabitants residing in densely populated communities are not characterized as being dependent on public transit.

4.3.2. Analysis of Public Transit Supply-Demand Gaps

The supply of public transit and its supply-demand gaps are determined by regional characteristics [55]. The communities’ public transit gap indices are helpful in identifying areas with insufficient public transit. From the perspective of mathematics, the value of the gaps index will be lower when public transit provision is improved. However, due to socioeconomic factors’ influence on the social need of public transit, other aspects need to be considered to solve the transport disadvantage problem. Figure 6 shows the relative distribution of demand and supply values and the relative thresholds in Guangzhou’s communities. This graph shows that there is no apparent connection between supply and demand; most values are concentrated in ‘high’, ‘above mean value’, ‘below mean value’, and ‘low’ groups of both log supply and normalized composite need indicators (1009 communities, serving 72.2% of the population). The supply and needs of public transit in these communities is relatively balanced. There are 57 communities with high public transit needs, covering 3.23% of the total population, in which 25 communities (1.243% of the population) have a severe shortage of public transit services and display very high needs. The government can improve the travel environment for these communities by reducing relative demand (increasing public service facilities) or by increasing the provision of public vehicles.
The values of public transit gaps indices are divided into five categories from small to large, using the natural discontinuity grading method. This method could maximize differentiation among all levels of the data and set the boundary at the point where the difference of data values is relatively large. In Figure 7a, the results of the public transit gaps index are shown in the map of the city divided by community. The communities with a lower transit gap index have a public transport provision in correspondence to or exceeding its needs, while those with a higher gap index are areas with a mismatch between the needs and supply. The urban area of Huadu district is densely populated, but its distance from CBD is relatively long, and public transit services are obviously insufficient. Therefore public transit gaps are very large in these communities (Figure 7a). The level of transit accessibility and facility-accessibility in parts of the Baiyun district is low and affected by mountain terrain, so the gaps between supply and needs are also very huge. Figure 7b displays the spatial distribution of the communities with ‘very high’ public transit needs scores but at ‘zero’ or ‘very low’ service levels. These communities are distributed in the eastern Baiyun district and the southern Huadu district, where public transit service is poor. These communities could be given priority when the government makes public transit policies. Figure 7c shows the distribution of communities where the supply-demand gaps indices are very low, in other words, the relative balance between supply and needs. Communities spatially distributed in the central urban areas belong to the high demand and high supply group. In addition, the communities of Timian Street are also balanced in supply and needs, which fall into the low needs and low supply category.

5. Conclusions

This paper adopts the method of public transit supply construction, associates measures of social needs used in existing studies, and applies the method on a community scale to discuss the spatial differentiation of transit access of communities related to residents’ needs. This method objectively aims at evaluating the service level of Guangzhou’s public transit. The results show that the difference is obvious among zones for communities’ transit accessibility. Compared with the inner city and middle city, the service level of the outer city decreases significantly, and the spatial coverage rate is less than 59.73% and 23.76% (of the other two); its number of service stops are less than 151.4% and 40.1% (of the other two). In terms of horizontal equity, 80% of the population in Guangzhou shares only 36% of the public transit supply. The poorest match between the spatial distribution of the public transit supply of community and population appears in the Huadu district and the Huangpu district, with services of high quality mainly concentrated in several communities. The inequality in the Yuexiu District was the lowest (G = 0.39) where the transit supply of communities is generally good. In terms of vertical equity, communities with ‘very high’ public transit needs are distributed mainly in the districts of Baiyun, Huadu, Yuexiu, and Haizhu. Among these districts, the high needs of the Baiyun district and the Huadu district are due to their low accessibility to public service facilities and that of the Yuexiu district and the Haizhu district are due to the sociodemographic characteristics of the old city centers. Communities with high population density do not particularly depend on public transit. The supply-demand relation of most communities is relatively balanced. Communities with low supply and high needs are distributed contiguously in the eastern Baiyun district and southern Huadu district. This kind of distribution pattern allows the transport sector to provide these areas with the public transit supply. It can avoid the risks that a large number of residents lack public transit supply, and that the rich become car-dependent while the poor, who cannot afford a car, must take a long time to commute and lose job opportunities as a result. These risks will be unstable factors in a society.
The study results are consistent with that of the existing ‘needs-gap’ studies and there is a certain degree of ‘spatial mismatch’ between public transit services and communities’ demand. This result provides an angle to identify the spatial characteristics of the supply-demand gap of public transit in Guangzhou. In the future, the government can improve services of existing public transit in communities with particularly high needs but low supply (such as building more bus stops or increasing service frequency) or optimize existing transit networks (such as providing new means of transportation like mini buses or giving subsidies for other types of public transit). Public transit supply in Guangzhou is concentrated in the inner and middle city, which can help solve urban traffic congestion and the CBD accessibility problem, yet the service in the outer city is so sparse that many communities only have one bus line passing through them. Although the layout of the road network limits service, and the regional environmental characteristics also make it difficult to implement effective public transit operations in some places, the low density itself means that provided services are limited. The social values of New Urbanism advocate the equal ownership of public facility services among different classes. It advocates that walking and using public transit as the main modes of travel can reduce car dependence and promote social inclusion. Chinese cities must learn the innovative community planning practices suggested by New Urbanism. The results of our study are beneficial to the improvement of the transit network based on the community level, to increase community ridership and transit dependency and to reduce the degree of spatial mismatch, and are a valuable reference for the realization of the community pattern as suggested by the philosophy of sustainable cities.
Horizontal equity attaches attention to the equal distribution of public resources for individuals or groups. Transport planning and policy making need to ensure that disadvantaged groups can enjoy equal access to public resources by frequently using alternatives to motorized vehicles. Because these groups are more dependent on non-motorized traffic or public transit, any measures of increasing traffic system diversity and regional accessibility are beneficial to enhancing vertical equity. Due to the particularities and the socioeconomic condition of the case, this paper considers only several of the demographics indicated by Litman o measure equity [24]. It would be meaningful to measure other demographics related to car ownership such as low income, household composition, as well as people with disabilities, to obtain a more complete picture of inequity. Guangzhou is home to people from diverse backgrounds and with multiple needs, which creates a rising demand for transit networks in many demographic settings. Because of this, transit equity is an important consideration and now is a perfect time to examine Guangzhou’s infrastructure.
Sustainable cities are inseparable from the multi-modal transportation network composed of the slow traffic system, public transit system, etc., which enables people to transfer within a variety of transport modes during their daily travel in the city. To further increase the proportion of trips by public transit, more than a reliance on ‘Public Transit Priority’ strategy, it is necessary to develop shared transport options, such as car-sharing and bicycle-sharing. Shared transport could provide individualized travel mode choice, alleviate transport congestion, and improve the public transit service level. Bicycle-sharing can help to solve the last mile problem and expand the service scope of the public transit system, while car-sharing can replace long-distance travel by private car. Urban and transportation planning organizations need to pay particular attention to the integration of shared transport and urban space, and provide shared transport with more resource support, such as establishing urban bicycle lanes for bicycle-sharing. The order of spatial allocation of urban transport resources in the future should be based on the publicness and intensification of travel modes, starting from the top should be rail transit, bus, bicycle (including bicycle-sharing), car-sharing, taxis, then finally the private car. In the next few years, the shared transport system should be combined with the original public transit network, which together could compose the new urban public transit system. It will be necessary to estimate the modal split for the means of shared transport and analyze the spatial differentiation characteristics of their supply-demand interaction.

Acknowledgments

We would like to express our gratitude to the National Natural Science Foundation of China for the financial support of this research (NSFC Grant Numbers: 41671160).

Author Contributions

Xiaoshu Cao contributed to the conceptual framework of the methodology. Huiling Chen wrote the major parts of the paper. Feiwen Liang and Wulin Wang created the figures and tables.

Conflicts of Interest

The authors declare no conflict of interest.

References

  1. Peter, C.; Yang, B.; Zhang, Q. Transit Oriented Development in China a Manual of Land-Use and Transportation for Low Carbon Cities; China Architecture & Building Press: Beijing, China, 2014. [Google Scholar]
  2. Banister, D. Sustainable urban development and transport—A Eurovision for 2020. Transp. Rev. 2000, 20, 113–130. [Google Scholar] [CrossRef]
  3. Potoglou, D.; Kanaroglou, P.S. Modelling car ownership in urban areas: A case study of Hamilton, Canada. J. Transp. Geogr. 2008, 16, 42–54. [Google Scholar] [CrossRef]
  4. Banister, D. The sustainable mobility paradigm. Transp. Policy 2008, 15, 73–80. [Google Scholar] [CrossRef]
  5. Banister, D. Cities, mobility and climate change. J. Transp. Geogr. 2011, 19, 1538–1546. [Google Scholar] [CrossRef]
  6. Yuan, Y.; Wu, F.; Xu, X. Multiple deprivations in transitional Chinese cities: A case study of Guangzhou. Urban Aff. Rev. 2011, 47, 721–736. [Google Scholar] [CrossRef]
  7. Wu, Q.; Wang, X.; Chen, G. Social-spatial differentiation and residential segregation of old city of Nanjing, China: Evidence from the community-level census data in 2000. Sci. Geogr. Sin. 2013, 33, 1196–1205. [Google Scholar]
  8. Lucas, K. Transport and social exclusion: Where are we now? Transp. Policy 2012, 20, 105–113. [Google Scholar] [CrossRef]
  9. Alotaibi, O.; Potoglou, D. Perspectives of travel strategies in light of the new metro and bus networks in Riyadh City, Saudi Arabia. Transp. Plan. Technol. 2017, 40, 4–27. [Google Scholar] [CrossRef]
  10. Duvarci, Y.; Yigitcanlar, T.; Mizokami, S. Transportation disadvantage impedance indexing: A method logical approach to reduce policy shortcomings. J. Transp. Geogr. 2015, 48, 61–75. [Google Scholar] [CrossRef]
  11. Ji, J.; Gao, X. Evaluating Urban Structure by Modeling Satisfaction towards Public Transportation. Acta Geogr. Sin. 2009, 64, 1477–1487. [Google Scholar]
  12. Zhao, P.; Li, S. Restraining transport inequality in growing cities: Can spatial planning play a role? Int. J. Sustain. Transp. 2016, 10, 947–959. [Google Scholar] [CrossRef]
  13. Di Ciommo, F.; Lucas, K. Evaluating the equity effects of road-pricing in the European urban context—The Madrid Metropolitan Area. Appl. Geogr. 2014, 54, 74–82. [Google Scholar] [CrossRef]
  14. Alonso, W. Location and Land Use: Towards a General Theory of Land Rent; Harvard University Press: Cambridge, MA, USA, 1964. [Google Scholar]
  15. Glaeser, E.; Kahn, M.; Rappaport, M. Why do the poor live in cities? The role of public transportation. J. Urban Econ. 2006, 63, 1–24. [Google Scholar] [CrossRef] [Green Version]
  16. Kain, J. Housing segregation, negro employment, and metropolitan decentralization. Q. J. Econ. 1968, 82, 175–197. [Google Scholar] [CrossRef]
  17. Grengs, J. Does public transit counteract the segregation of carless households? Measuring spatial patterns of accessibility. Transp. Res. Rec. 2001, 3–10. [Google Scholar] [CrossRef]
  18. Blumenberg, E.; Ong, P. Cars, buses, and jobs: Welfare participants and employment access in Los Angeles. Transp. Res. Rec. J. Transp. Res. Board 2001, 22–31. [Google Scholar] [CrossRef]
  19. Kamruzzaman, M.; Tan, Y.; Yang, J.; Mohamed, M. Measures of Transport-Related Social Exclusion: A Critical Review of the Literature. Sustainability 2016, 8, 696. [Google Scholar] [CrossRef]
  20. Bröcker, J.; Korzhenevych, A.; Schürmann, C. Assessing spatial equity and efficiency impacts of transport infrastructure projects. Transp. Res. B Meth. 2010, 44, 795–811. [Google Scholar] [CrossRef]
  21. Taleai, M.; Sliuzas, R.; Flacke, J. An integrated framework to evaluate the equity of urban public facilities using spatial multi-criteria analysis. Cities 2014, 40, 56–69. [Google Scholar] [CrossRef]
  22. Di Ciommo, F.; Shiftan, Y. Transport equity analysis. Transp. Rev. 2017, 37, 139–151. [Google Scholar] [CrossRef]
  23. Fransen, K.; Neutens, T.; Farber, S.; Maeyer, P.D.; Deruyter, G.; Witlox, F. Identifying public transit gaps using time-dependent accessibility levels. J. Transp. Geogr. 2015, 48, 176–187. [Google Scholar] [CrossRef]
  24. Litman, T. Evaluating transportation equity. World Transp. Policy Pract. 2002, 8, 50–65. [Google Scholar]
  25. Sherman, L.; Barber, B.; Kondo, W. Methods for evaluating metropolitan accessibility. Transp. Res. Rec. 1974, 499, 70–82. [Google Scholar]
  26. Delbosc, A.; Currie, G. Using Lorenz curves to assess public transit equity. J. Transp. Geogr. 2011, 19, 1252–1259. [Google Scholar] [CrossRef]
  27. Kaplan, S.; Popoks, D.; Prato, C.G.; Ceder, A. Using connectivity for measuring equity in transit provision. J. Transp. Geogr. 2014, 37, 82–92. [Google Scholar] [CrossRef]
  28. Karner, A. Assessing public transit service equity using route-level accessibility measures and public data. J. Transp. Geogr. 2018, 67, 24–32. [Google Scholar] [CrossRef]
  29. Delmelle, E.C.; Casas, I. Evaluating the spatial equity of bus rapid transit based accessibility patterns in a developing country: The case of Cali, Colombia. Transp. Policy 2012, 20, 36–46. [Google Scholar] [CrossRef]
  30. Farber, S.; Bartholomew, K.; Li, X.; Páez, A.; Habib, K.M.N. Assessing social equity in distance-based transit fares using a model of travel behavior. Transp. Res. Part A 2014, 67, 291–303. [Google Scholar] [CrossRef]
  31. Nuworsoo, C.; Golub, A.; Deakin, E. Analyzing equity impacts of transit fare changes: Case study of Alameda–Contra Costa Transit, California. Eval. Program Plan. 2009, 32, 360–368. [Google Scholar] [CrossRef] [PubMed]
  32. Lau, G.C. Spatial mismatch and the affordability of public transit for the poor in Singapore’s new towns. Cities 2011, 28, 230–237. [Google Scholar]
  33. Wu, B.M.; Hine, J.P. A PTAL approach to measuring changes in bus service accessibility. Transp. Policy 2003, 10, 307–320. [Google Scholar] [CrossRef]
  34. Hine, J.; Mitchell, F. Transport Disadvantage and Social Exclusion: Exclusionary Mechanisms in Transport in Urban; Ashgate: Aldershot, UK, 2003. [Google Scholar]
  35. Matas, A.; Raymond, J.L.; Roig, J.L. Job accessibility and female employment probability: The cases of Barcelona and Madrid. Urban Stud. 2010, 47, 769–787. [Google Scholar] [CrossRef]
  36. Chai, Y.W. The Activity Space of Urban Elderly in China; Science Press: Beijing, China, 2010. [Google Scholar]
  37. Hess, D.B. Walking to the bus: Perceived versus actual walking distance to bus stops for older adults. Transportation 2011, 39, 1–20. [Google Scholar] [CrossRef]
  38. National Geomatics Center of China. National Geographic Information Public Service Platform. Available online: http://ngcc.sbsm.gov.cn/ (accessed on 20 August 2015).
  39. Ricciardi, A.M.; Xia, J.; Currie, G. Exploring public transit equity between separate disadvantaged cohorts: A case study in Perth, Australia. J. Transp. Geogr. 2015, 43, 111–122. [Google Scholar] [CrossRef]
  40. Currie, G. Quantifying spatial gaps in public transit supply based on social needs. J. Transp. Geogr. 2010, 18, 31–41. [Google Scholar] [CrossRef]
  41. Nahmias-Biran, B.H.; Sharaby, N.; Shiftan, Y. Equity aspects in transportation projects: Case study of transit fare change in Haifa. Int. J. Sustain. Transp. 2014, 8, 69–83. [Google Scholar] [CrossRef]
  42. Wilkie, D.S.; Morelli, G.A.; Demmer, J.; Starkey, M.; Telfer, P.; Steil, M. Parks and people: Assessing the human welfare effects of establishing protected areas for biodiversity conservation. Conserv. Biol. 2006, 20, 247–249. [Google Scholar] [CrossRef] [PubMed]
  43. Gering, J.C.; Crist, T.O.; Veech, J.A. Additive partitioning of species diversity across multiple spatial scales: Implications for regional conservation of biodiversity. Conserv. Biol. 2003, 17, 488–499. [Google Scholar] [CrossRef]
  44. Welch, T.F. Equity in transport: The distribution of transit access and connectivity among affordable housing units. Transp. Policy 2013, 30, 283–293. [Google Scholar] [CrossRef]
  45. Tang, Z.; Gu, S. An Evaluation of the Central City of Social Performance in the Distribution of Urban Parks in Shanghai: From Social Equity to Social Justice. Urban Plan. Forum 2016, 1, 15–21. [Google Scholar]
  46. El-Geneidy, A.; Levinson, D.; Diab, E.; Boisjoly, G.; Verbich, D.; Loong, C. The cost of equity: Assessing transit accessibility and social disparity using total travel cost. Transp. Res. Part A 2016, 91, 302–316. [Google Scholar] [CrossRef]
  47. Waintrub, N.; Greene, M.; Ortúzar, J.D.D. Designing incentive packages for increased density and social inclusion in the neighbourhood of mass transit stations. Habitat Int. 2016, 55, 133–147. [Google Scholar] [CrossRef]
  48. Jaramillo, C.; Lizárraga, C.; Grindlay, A.L. Spatial disparity in transport social needs and public transit provision in Santiago de Cali (Colombia). J. Transp. Geogr. 2012, 24, 340–357. [Google Scholar] [CrossRef]
  49. Foth, N.; Manaugh, K.; El-Geneidy, A.M. Towards equitable transit: Examining transit accessibility and social need in Toronto, Canada, 1996–2006. J. Transp. Geogr. 2013, 29, 1–10. [Google Scholar] [CrossRef]
  50. Chen, W.; Liu, L.; Liang, Y. Retail center recognition and spatial aggregating feature analysis of retail formats in Guangzhou based on POI data. Geogr. Res. 2016, 35, 703–716. [Google Scholar]
  51. Lucas, K. Making the connections between transport disadvantage and the social exclusion of low income populations in the Tshwane Region of South Africa. J. Transp. Geogr. 2011, 19, 1320–1334. [Google Scholar] [CrossRef]
  52. Cao, X.; Lin, Q. A SEM-based Study on Urban Community Resident’s Travel Behavior in Guangzhou. Acta Geogr. Sin. 2011, 66, 167–177. [Google Scholar]
  53. Currie, G.; Delbosc, A. Exploring public transit usage trends in an ageing population. Transportation 2010, 37, 151–164. [Google Scholar] [CrossRef]
  54. Mishra, S.; Welch, T.F.; Jha, M.K. Performance indicators for public transit connectivity in multi-modal transportation networks. Transp. Res. Part A 2012, 46, 1066–1085. [Google Scholar] [CrossRef]
  55. Manaugh, K.; Badami, M.G.; El-Geneidy, A.M. Integrating social equity into urban transportation planning: A critical evaluation of equity objectives and measures in transportation plans in North America. Transp. Policy 2015, 37, 167–176. [Google Scholar] [CrossRef]
Figure 1. Example of a typical Lorenz curve.
Sustainability 10 01069 g001
Figure 2. Kernel density of shopping facilities (a); educational institutions (b) and medical facilities (c) in Guangzhou. Source: Created by authors.
Sustainability 10 01069 g002
Figure 3. The spatial distribution of community population density (a); community transit accessibility index (b) and GINI coefficient of each district (c) in Guangzhou. Source: Authors.
Sustainability 10 01069 g003
Figure 4. Lorenz curves of the distribution of transit network resources. Source: Authors.
Sustainability 10 01069 g004
Figure 5. The spatial distribution of index of public transit needs (a) and its relation with the community population density (b). Source: Authors.
Sustainability 10 01069 g005
Figure 6. The relative distribution of public transit service and needs index in Guangzhou. Source: Authors.
Sustainability 10 01069 g006
Figure 7. The distribution of public transit gaps (a); high transport needs with very low supply (b) and relative supply-demand balanced (c) communities. Source: Authors.
Sustainability 10 01069 g007
Table 1. Factors of public transit need and indicators used. Source: Authors.
Types of IndicatorsFactor of Public Transit NeedIndicator UsedSource
Personal factors of transport needThe elderlyPopulation aged over 60 yearsJaramillo 2012; Fransen 2015;
The unemploymentUnemployed populationJaramillo 2012; Fransen 2015; Currie 2010
IlliteracyIlliterate populationJaramillo 2012; Fransen 2015; Currie 2010
ChildrenThe number of studentsJaramillo 2012; Fransen 2015; Currie 2010
Locational factors of transport disadvantageDegree of accessibility to public service facilitiesThe number of public service facilities within walking distanceJaramillo 2012; Fransen 2015
Degree of accessibility to public service facilitiesNumber of public service facilities within bicycle distanceJaramillo 2012; Fransen 2015
Degree of accessibility to the centerDistance from CBD to the centroid of the communityJaramillo 2012; Fransen 2015
Table 2. Analysis of arrival times of community public transit stations in each district. Source: Authors.
Average Total Arrivals per Week per CommunityAverage Total Arrivals per Week per StopAverage Area of Individual Community (km2)Area of All Communities (km2)Average Proportion of Each Community Covered by Stop/Station Walk CatchmentAverage Proportion of All Communities Covered by Stop Walk Catchment
Inner GuangzhouYuexiu district380937100.1539.3697.52%80.10%
Haizhu district422424940.3998.8694.29%73.20%
Liwan district375223940.3261.9196.04%77.77%
Tianhe district799130380.69133.2190.69%69.39%
Average494429090.3983.3494.64%75.12%
Middle GuangzhouBaiyun district590817521.87674.7969.64%38.62%
Panyu district603516302.30766.5158.12%39.78%
Huangpu district10,29914144.27465.1864.18%45.6%
Average819216213.22476.6258.67%41.31%
Outer GuangzhouHuadu district296510624.09940.9036.01%18.35%
Nansha district475812525.68425.6833.80%21.67%
Average386211574.89683.2934.91%20.01%
Average of Guangzhou602720432.423606.3973.01%34.76%
Table 3. Eigenvalues and the total variance explained. Source: Authors.
ComponentInitial EigenvaluesRotation Sums of Squared Loadings
TotalVariance Explained (%)Cumulative Variance (%)TotalVariance Explained (%)Cumulative Variance (%)
13.81254.45554.4553.18545.50645.506
22.27732.52686.9812.90341.47586.981
30.4666.66093.641
40.1852.63896.280
50.1361.93698.215
60.0801.13699.351
70.0450.649100.000
Table 4. The rotated component matrix. Source: Authors.
VariableComponent
12
Unemployment0.950.109
Illiteracy0.9260.005
Children0.901−0.279
The elderly0.756−0.445
Walking accessibility−0.040.962
Biking accessibility0.0040.949
Distance from the center0.199−0.831

