Abstract
A growing body of evidence for chemical contamination in seafood has raised concerns about the safety of seafood consumption. Available data also indicate that some fishery stocks that are overharvested are also the most laden with certain contaminants. Flame retardant chemicals, used in textiles, plastics, and other products are a class of these seafood contaminants that are particularly concerning as they are linked to cancer and endocrine disruption. To investigate the potentially useful relationship between fishery sustainability and flame retardant concentration in seafood, we used polybrominated diphenyl ethers (PBDEs) as a case study to assess how fishery status and species vulnerability coincide with levels of brominated flame retardants found in the tissue of popularly consumed fish. While none of our metrics of sustainability showed strong relationships to PBDE contamination rates, our results suggest that the same intrinsic biological and ecological traits, which facilitate the uptake of chemicals, also contribute to how species respond to fishing pressures. Given the dual challenges of ensuring seafood sustainability and protecting human health, we then explored the implications of bundling the public good of conservation with the private good of health.
1. Introduction
Historic management of economically and ecologically valuable species has placed many fisheries around the world in danger of decline or collapse. This decline brings significant long-term consequences for global biodiversity, and affects hundreds of millions of people who rely on fisheries as a primary food source [1,2,3]. Despite motivation to confront this problem, fishery scientists struggle with how best to address fishery collapse [1,4]. Human health depends on the sustainability of seafood in ways beyond subsistence alone, as seafood can be a healthy dietary choice due to its high nutrient content, including selenium and long-chain omega-3 acids [5,6,7,8]. Even with the well-documented benefits of seafood consumption, there is growing evidence showing serious health risks due to chemical and heavy metal contamination of seafood from the accumulation of xenobiotic substances (contaminants) ingested or absorbed by the fish via their environment prior to harvest [7].
The prevalence of mercury and methylmercury in seafood has received much attention in recent years due to its significant health effects, especially on the cognitive capabilities of young children [8]. While mercury has been the most commonly discussed contaminant found in popularly consumed fish species, a different class of contaminants has begun to cause concern among medical and environmental researchers. Flame retardants, particularly brominated flame retardants, are used in products such as textiles, furniture, electronics, plastics, and other building materials to decrease the chance of combustion and reduce fire danger [9,10,11,12,13]. Though humans are exposed to flame retardants through dust released from common household items, most of these persistent organic pollutants (POPs) found in human bodies come from the consumption of fish and shellfish—even when seafood is a small part of the diet [14]. These, and other POPs, are referred to as persistent because they do not readily break down in the environment. While there is uncertainty about the exact long-term effects of flame retardants on human health, these chemicals are known to disrupt endocrine function, impair spermatogenesis, interfere with neurodevelopment, and act as carcinogens. Despite this, flame retardants are produced and distributed under the auspices of human safety and are already pervasive in the environment [12,15,16]. PBDEs (polybrominated diphenyl ethers) are a class of commonly used brominated flame retardant which, like mercury, biomagnify in the food chain. Concentrations of such substances amplify as they are passed up the food chain. The top predator (often humans) consumes the highest concentrations of the substances, which the body is unable to break down or digest. When PBDE does metabolize in the environment, the molecule can break down into new brominated compounds, such as hydroxylated polybrominated diphenyl ether (OH-PBDE) or methoxylated polybrominated diphenyl ether (MeO-PBDE). These compounds are still toxic. For these reasons, certain congeners of PBDEs have been banned by the European Union.
Previous research suggests that ecologically sustainable seafood, in general, contains less mercury, revealing a common ground shared by the proponents of both human health and conservation [17]. In principle, pressures on many overfished stocks could be lessened by demonstrating to consumers and industry leaders that many threatened fish stocks also tend to be unhealthy in the human diet so that reducing consumption of these less-healthy species on the basis of the ‘private good’ of human health may pay a double dividend to the ‘public good’ of fishery sustainability. In this paper, we seek to examine the generality of the relationship between contamination and sustainability in the case of flame retardants. Specifically, we examine PBDE concentrations reported in commercial fishes and linked each data point to corresponding metrics of sustainability. We also consider the association between PBDE concentrations and biological predictors of fishery sustainability. Given the dual challenges of ensuring seafood sustainability and protecting seafood consumers from excessive PBDE exposure, we then discuss the potential for sustainability and health messaging to consumers (e.g., seafood advisories or press releases).
2. Materials and Methods
We collected globally-recorded concentrations from the published literature of PBDEs for consumed species of fish or shellfish from both marine and freshwater sources. All samples were collected between 2002 and 2012. The dataset included 458 samples containing 187 types of fish from 41 contributing sources and 49 unique PBDE congeners, or specific chemical varieties. Some researchers analyzed for individual congener concentrations, while others reported the sum of total PBDEs. This means two authors might report ΣPBDE, for example, but one author analyzed for PBDE, in general, and the other for specific congeners, such as BDE-47, BDE-99, and BDE-152, and added the results for reporting. We utilized only those values (n = 328) which were reported as ΣPBDE to maintain as much consistency as possible across different labs which likely tested for varying sets of individual PBDE congeners.
To put the values displayed in this article into context, the Agency for Toxic Substances and Disease Registry (ATSDR) provides a Minimal Risk Level (MRL) for decaBDE and lower brominated BDEs. The MRLs for oral exposure to PBDEs provide a threshold “at or below which that substance is unlikely to pose a measurable risk of harmful (adverse), noncancerous effects…however…MRLs should not be used as predictors of harmful (adverse) health effects” [18]. Cancer, however, though notoriously difficult to research and trace back to a point source, is a central concern when considering brominated flame retarding chemical additives. The MRL for decaBDE is 10 mg of PBDE per kg of body weight, per day, determined by oral exposure spanning 15–364 days. The MRL observed over the same timeline for lower brominated BDEs is 0.007 mg/kg/day. Assuming the average adult weighs 70 kg, the ATSDR states that a person is unlikely to experience adverse health effects unless he or she consumes more than 7.0 × 10⁸ ng of decaBDE per day or 4.9 × 10⁵ ng of lower brominated BDEs per day. These thresholds are several orders of magnitude higher than the amount of PBDEs the average American consumes via fish and shellfish (Figure 1). The PBDE concentration data portrayed in this figure come from 27 different published sources, including academic papers and government reports. Shrimp appear to be of special concern since it is both relatively high in PBDE content and is also consumed more frequently by the average American. Although the MRL range for PBDE is far higher than what the average American consumes on a yearly basis, PBDE is just one of many possible chemicals which are found in human bodies, the interactions of which may amplify toxic effects (Figure 2) [19].
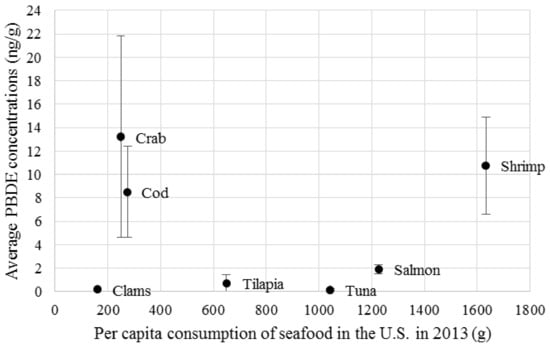
Figure 1.
The risk of consuming popular seafood choices. Seafood types here reflect the average PBDE concentration of multiple species within that category. For example, “Cod” includes observations of Atlantic cod, Pacific cod, and Polar cod. Catfish, an outlier, was excluded (1008.33 ng/g ± 826.8, mean ± standard error).
We examined a number of other variables, apart from PBDE concentrations, which describe the types of fishes in the dataset. These variables can be assigned to one of two categories, pertaining to either sustainability or biological traits. Sustainability variables include (1) Bcurrent/BMSY (current available biomass/biomass available if harvested at MSY); (2) ucurrent/uMSY (current harvest rate/harvest rate at MSY); (3) sustainable seafood guide rankings from the Monterey Bay Aquarium (MBA); and (4) vulnerability values published by Cheung, Pitcher, and Pauly [20]. Bcurrent/BMSY and ucurrent/uMSY were both collected from Worm et al., calculated from information collected between 2001 and 2009 [1]. MSY, maximum sustainable yield, refers to the calculated level of harvest at which a natural resource can predictably be harvested without causing future depletion. Worm et al. use harvest rate to signify the fishing mortality rate [1]. In the second category, the biological variables are life history traits intrinsic to the species, and include depth, weight, lifespan, water zone or habitat, and trophic level. Fishbase.org and SeaLifebase.org provides these, including maximum reported depth, maximum reported weight, maximum reported age of a species of fish, zone, and trophic level, a value showing where a species is found in the transfer of energy of the food web. Zone refers to different layers of water, such as demersal, pelagic, or benthic.
Bcurrent/BMSY and ucurrent/uMSY have been estimated and reflect the conditions of the current population (data recorded 2001–2009) compared to the conditions of the stock under specific management scenarios that are assumed to be sustainable [1]. From a single-species perspective, a biomass ratio (Bcurrent/BMSY) that is greater than 1 indicates better ecological sustainability, whereas a harvest ratio (ucurrent/uMSY) that is less than 1 indicates better sustainability [1]. Vulnerability values [20] take inherent biological characteristics into account, such as reproductive history, lifespan, and resilience under stress, while public seafood guides, including the MBA [21], evaluate sustainability mainly by considering the environmental impact of current stock-specific harvesting techniques. Vulnerability rankings [20] are assigned on a scale of 0 to 100, with 100 being most vulnerable (and least sustainable, in context of this study), while the Monterey Bay Aquarium seafood guide provides a numerical value with two decimal places from 0 to 10, with 10 being the ‘best choice’. MBA values are designed to reflect sustainability of specific fishing practices in specific locations. In order to disentangle the relationships between ecological sustainability, flame retardant concentration, and life history traits, we constructed a range of regression models to investigate three key relationships: (1) the relationship between PBDE concentrations and metrics of sustainability; (2) the links between PBDE concentrations of a species and its innate biological traits; and (3) the relationship between sustainability metrics and these biological life history variables (Table 1). We used the four variables as indices for sustainability (Bcurrent/BMSY, ucurrent/uMSY, vulnerability, and MBA seafood guides rankings) from the most informative and robust regression scenarios possible given the size of the dataset. For biological life history traits we consider the species trophic level in the food chain, which can be a useful, but noisy, predictor of fishery sustainability. This is because many species at the top of the food chain exhibit vulnerable life history traits, such as increased longevity and body size, and lower reproductive rate, and may be harvested vigorously due to their often high market value [22]. Aquatic zone is also considered since flame retardants released into the environment are sourced from highly-populated human centers of both production and use, suggesting contaminant concentrations may be higher in fish populations located nearest to land.

Table 1.
Multivariate regression models chosen with respect to available data and sample size.
The models in Table 1 were chosen because these combinations of covariates helped illuminate possible trends and how these trends fluctuate with varying sets of control variables, while also acknowledging the need to conserve statistical power given the limited degrees of freedom present in our data. For example, we did not include controls for region when focusing on the Worm et al. values, biomass and harvest rate, or on the MBA seafood guide values, because these indices are composed mainly of North American observations, and also because the sample size was small. In fitting linear models to variables in various tests, we employed a weighted least squares approach that weighs an observation, in the case of multiples of that fish type in the same region, by the inverse of the number of total observations of the fish type in the region. We utilize this approach to mitigate excessive influence in our estimates from highly studied regional fish stocks; these stocks may be more likely to be studied (or published) precisely due to concerns over potential contamination. Our approach hopes to limit the reach of this potential selection bias. To demonstrate: if multiple authors reported contamination levels in common carp from Southern Europe, we needed to reduce the influence each observation carried in the regression so the information would remain comparable to, for example, Northern European cod reported by only one source.
In addition to multivariate regression modeling, we also utilize simple bivariate statistical estimates to explore the pairwise correlations between ecological sustainability, flame retardant concentration, and life history traits. We used a categorical approach to investigate these broad estimates, and assigned three categories to depth, weight, lifespan, zone, and trophic level. The cutoffs for these categories were established by choosing commonly-used classifications while also taking into account the sample size within each category. We ultimately chose boundaries for three categories so that each category has a roughly comparable sample sizes.
3. Results
Our analyses suggest a complex relationship between PBDE concentrations and seafood sustainability. At first glance, shallower analyses support our educated assumptions that PBDE concentrations correlate to species characteristics which facilitate uptake of chemicals (Figure 2). Trophic level displays a broadly indirect relationship with PBDE (Figure 2). These results concerning the trophic level were in contrast to what we originally hypothesized based on our knowledge of market drivers, as we assumed many large and long-lived species are found at higher trophic levels.
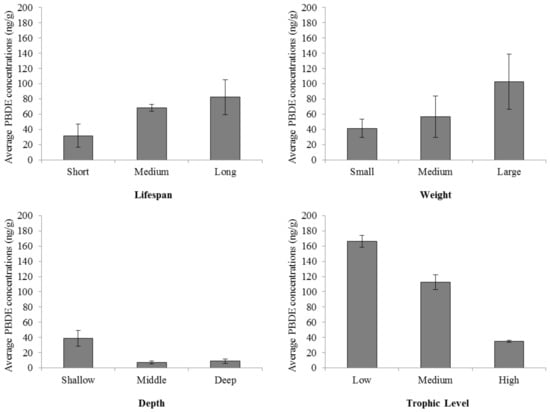
Figure 2.
PBDE concentrations and biological characteristics. Depth refers to the maximum recorded depth a fish of that species was caught at historically; Weight, the maximum weight; and Lifespan, the oldest recorded age (mean ± SE).
We then further explored the statistical power within the relationships between PBDE concentrations, sustainability metrics, and life history traits, revealing complications and less clear conclusions (Table 2, Table 3 and Table 4). Table 2 addresses the first of our hypotheses, that sustainability quantifiers may correctly predict PBDE concentration levels. None of the four measures of sustainability (biomass ratio Bcurrent/BMSY, harvest rate ratio ucurrent/uMSY, vulnerability, and MBA seafood guide values) showed strong relationships to PBDE contamination rates found in seafood sampled between 2002 and 2013 (Table 2). While Models 1, 4, and 6 include sustainability variables bearing significant p-values, the sample sizes available to each of these regression models are unreliably small.
Table 2.
Examining sustainability metrics as predictors of PBDE concentration in seafood. Estimates (t-statistic), with significance indicated by † for 0.05 < p < 0.1, * for 0.01 < p < 0.05, ** for 0.001 < p < 0.01, and *** for 0 < p < 0.001.
Table 3.
Examining biological characteristics as predictors of PBDE concentration. Estimates (t-statistic), with significance indicated by * for 0.01 < p < 0.05, ** for 0.001 < p < 0.01, and *** for 0 < p < 0.001. For categorical variables (Zone, Interactions), the coefficient with the highest t value was chosen for display in the table.
Table 4.
Examining biological characteristics as predictors of sustainability. Estimates (t-statistic), with significance indicated by † for 0.05 < p < 0.1, * for 0.01 < p < 0.05, ** for 0.001 < p < 0.01, and *** for 0 < p < 0.001. For variables which included multiple estimates (Zone), the coefficient with the highest t value was chosen for display in the table. Fish length is omitted from Model 15 to retain sample size.
In our analyses of the relationships between PBDE and sustainability, we were limited by data availability (small sample size) and low R-squared values (Table 2). However, the practical relationships between the variables discussed here (sustainability, PBDEs in fish tissue, and species differences) suggest that PBDE concentrations are influenced by spatial and biological characteristics of regional stocks, if not by ecological sustainability. We show this broadly in Figure 2 and now delve further into the statistical power behind these relationships in Table 3.
Table 3 supports the idea that larger fish require more energy for survival (i.e., more prey) and, therefore, will show more biomagnification of contaminants, and longer-lived species have more time to accumulate chemicals (Model 12, R-squared = 0.7617). Further, larger and longer-lived species are often found at higher trophic levels, as exemplified by tuna and other sportfish. The influence of trophic level as illuminated by the regression scenarios here are not as simple as that, however. After controlling for region of capture, we found a strong negative relationship between trophic level and PBDE contamination (p = 1.63 × 10⁻⁶; Table 3). Although we might have expected lower trophic level species such as shrimp or mussels to have relatively lower contaminant levels due to biomagnification of flame retardants, this result to the contrary may be explained by the fact that such species spend much, or all, of their time at the bottom in the sediment near land. PBDEs generally enter the aquatic environment via runoff from land, and can accumulate in coastal sediments [23]. Where external variables such as increased exposure to sediment may interfere with trophic level-based predictions of contamination, the results more definitively show that larger and longer-lived species have potentially greater capacity for contamination accumulation (Model 12).
Finally, we found intrinsic biological traits of fishes to have the most influence on quantified sustainability (Table 4). Although sample size is limited by availability of sustainability metrics, multiple R-squared values are high when all biological traits and trophic level are considered. Life history traits represent an indirect link between sustainability and PBDE contamination, predicting both sustainability and PBDE concentrations.
4. Discussion
Our analyses suggest that the link between PBDE concentrations and stock sustainability are indirect and complex. We cannot conclude that sustainability adequately predicts PBDE contamination, given small sample sizes, larger p, and small R-squared values. However, we do find that intrinsic biological factors such as lifespan and body size can predict both PBDE concentrations and sustainability rankings, a conclusion supported by high R-squared values and, at times, larger sample sizes. Interestingly, trophic level was significantly linked to PBDE concentrations, though showing an indirect correlation in contrast with our prior expectations. We predicted higher concentrations of chemical contamination would be found at higher trophic levels, where typically larger, longer-lived species might have more opportunity to bioaccumulate PBDE. Our collected dataset indicates the opposite: that smaller prey species at lower trophic levels are more likely to bear high contaminant loads. This is perhaps because many lower trophic level species of fish and shellfish are also bottom dwellers living nearer to or within coastal sediments [23]. This could also indicate further complications in our use of depth as a factor, as a species’ depth range does not, alone, determine its proximity to sediment or to human-populated areas. In summary, while we did not find that perceived fishery sustainability can predict PBDE contamination of fish tissue in general, our results, however, do show that life history traits of individual fish species predict both PBDE levels and our chosen sustainability metrics. The same intrinsic biological and ecological traits which facilitate the uptake of PBDEs also contribute to how species respond to fishing pressures, albeit in sufficiently distinct ways, such that stock sustainability is not a consistent indicator of PBDE contamination.
Our results should be interpreted with caution. A large number of studies reporting concentrations of PBDEs in fish were recorded in the United States, China, and the United Kingdom. It is possible that seafood PBDE contamination levels are low in South America, Africa, and India, but it is also probable that they are underrepresented in scientific studies. The costs of conducting trace contaminant analyses, including obtaining pure PBDE standards for detection and quantification and/or difficulties transporting biotic samples across country lines may be factors behind the regional skew of the collected data. We can infer from limited environmental contaminant studies that brominated flame retardants are likely present in marine and aquatic resources around the globe [24,25,26]. Based on analyses of our findings, in general, PBDE concentrations increase as the estimated lifespan and weight of the fish increased, and as the habitat depth decreased (Figure 2). Most research on flame retardants in fish is performed on species caught near the coast, making it difficult to statistically examine the effect of proximity to land, but we can indirectly examine this using the depth zone. We find that larger, longer-lived, and bottom-dwelling fish harvested near land are more likely to have elevated flame retardant concentrations. Pooling data on marine and freshwater fish and shellfish did not strongly influence any of our conclusions.
Another reason for caution in interpreting our findings is that the Worm et al. and MBA sustainable seafood guide information reflect relatively current fishery activities and need to be reevaluated or updated often [1]. The nature of quantifying sustainability and connections to documented PBDE concentrations creates scenarios in which the necessary variables (i.e., species included, regions represented, etc.) overlap in relatively few places, heavily limiting the sample size. The observations reported here do not represent species composition of the market; rather, they represent the composition of the literature concerning brominated flame retardants, which is limited by available resources to conduct these types of analyses. Sampling could be skewed in systematic ways—especially toward areas where contamination is likely, given the pressure to publish toxicologically meaningful results. We also excluded all farmed fish from our analysis because three of the four selected sustainability indicators apply only to wild-caught species, though aquaculture is an increasingly large part of seafood consumption. Additionally, due to inadequate data we did not examine the relationship between body fat percentage of fish in our sample and PBDE concentrations—a potentially relevant variable since PBDE and other compounds are known to accumulate in fat stores [27].
The vulnerability data values available from Fishbase.org and SeaLifebase.org are useful because they are provided for many of the world’s identified fish species. However, these vulnerability values are often criticized by fishery scientists because they represent an inaccurate scaling across different species. Vulnerability is calculated by a fuzzy logic system based on 10–20 life history traits per species [18]. Most of these data do not exist for many under-studied species, leaving holes in the dataset which are glossed over by the fuzzy logic evaluation model. Despite these flaws, the vulnerability values are often considered the best broadly available index for ecological resilience across a significant number of species, provided the scientifically valid concerns are kept in mind.
Understanding the functioning of biological effects on species response to fishing pressures and uptake of chemical contaminants will become increasingly important in the Anthropocene. In light of the nuanced relationship between ecological sustainability and public health in context of flame retardant contamination, it is clear that those wishing to utilize marketing techniques to nudge seafood consumption in more sustainable directions cannot rely upon science to consistently support the finding that healthful and sustainable seafood consumption are one and the same. Instead, more nuanced and carefully calibrated messaging will be needed on the part of NGOs and government policy-makers in order to foster market-driven incentives for sustainability in the seafood supply chain while sending accurate signals to consumers about the implications of their choices for their private health and well-being.
Acknowledgments
We are grateful for the advice of S. Bentley, T. Burch, T. P. Fitzgerald, T. Gancos Crawford, S. Geren, R. Karimi, A. Kinzig, B. Lawhorn, E. Laxamana, J. Maienschein, B. Minteer, C. Perrings, S. Pratt, S. Sifferman, A. Smith, J. Tucker, R. Wildermuth, and for support from the Lighthouse Foundation.
Author Contributions
L.R.G. conceived the investigation; A.J.N. analyzed the data; and L.R.G., B.P. and J.K.A. structured the analysis.
Conflicts of Interest
The authors declare no conflict of interest. The founding sponsors had no role in the design of the study; in the collection, analyses, or interpretation of data; in the writing of the manuscript; or in the decision to publish the results.
References
- Worm, B.; Hilborn, R.; Baum, J.K.; Branch, T.A.; Collie, J.S.; Costello, C.; Fogarty, M.J.; Fulton, E.A.; Hutchings, J.A.; Jennings, S.; et al. Rebuilding global fisheries. Science 2009, 325, 578–585. [Google Scholar] [CrossRef] [PubMed]
- Pinsky, M.L.; Jensen, O.P.; Ricard, D.; Palumbi, S.R. Unexpected patterns of fisheries collapse in the world’s oceans. Proc. Natl. Acad. Sci. USA 2011, 108, 8317–8322. [Google Scholar] [CrossRef] [PubMed]
- Gaines, S.D.; Costello, C. Forecasting fisheries collapse. Proc. Natl. Acad. Sci. USA 2013, 110, 15859–15860. [Google Scholar] [CrossRef] [PubMed]
- Hilborn, R. Faith-based fisheries. Fisheries 2006, 31, 554–555. [Google Scholar]
- Bouzan, C.; Cohen, J.T.; Connor, W.E.; Kris-Etherton, P.M.; Gray, G.M.; König, A.; Lawrence, R.S.; Savitz, D.A.; Teutsch, S.M. A quantitative analysis of fish consumption and stroke risk. Am. J. Prev. Med. 2005, 29, 347–352. [Google Scholar] [CrossRef] [PubMed]
- König, A. A quantitative analysis of fish consumption and coronary heart disease mortality. Am. J. Prev. Med. 2005, 29, 335–346. [Google Scholar] [CrossRef] [PubMed]
- Domingo, J.L. Omega-3 fatty acids and the benefits of fish consumption: Is all that glitters gold? Environ. Int. 2007, 33, 993–998. [Google Scholar] [CrossRef] [PubMed]
- Brunner, E.J.; Jones, P.J.S.; Friel, S.; Bartley, M. Fish, human health, and marine ecosystem health: Policies in collision. Int. J. Epidemiol. 2008, 38, 93–100. [Google Scholar] [CrossRef] [PubMed]
- Stapleton, H.M. Instrumental methods and challenges in quantifying polybrominated diphenyl ethers in environmental extracts: A review. Anal. Bioanal. Chem. 2006, 386, 807–817. [Google Scholar] [CrossRef] [PubMed]
- Bakker, M.I.; de Winter-Sorkina, R.; de Mul, A.; Boon, P.E.; van Donkersgoed, G.; van Klaveren, J.D.; Baumann, B.A.; Hijman, W.C.; van Leeuwen, S.P.; de Boer, J.; et al. Dietary intake and risk evaluation of polybrominated diphenyl ethers in The Netherlands. Mol. Nutr. Food Res. 2008, 52, 204–216. [Google Scholar] [CrossRef] [PubMed]
- Brown, P.; Cordner, A. Lessons learned from flame retardant use and regulation could enhance future control of potentially hazardous chemicals. Health Aff. 2011, 30, 906–914. [Google Scholar] [CrossRef] [PubMed]
- Domingo, J.L. Polybrominated diphenyl ethers in food and human dietary exposure: A review of the recent scientific literature. Food Chem. Toxicol. 2012, 50, 238–249. [Google Scholar] [CrossRef] [PubMed]
- Cordner, A.; Mulcahy, M.; Brown, P. Chemical regulation on fire: Rapid policy advances on flame retardants. Environ. Sci. Technol. 2013, 47, 7067–7076. [Google Scholar] [CrossRef] [PubMed]
- Voorspoels, S.; Covaci, A.; Neels, H.; Schepens, P. Dietary PBDE intake: A market-based study in Belgium. Environ. Int. 2007, 33, 93–97. [Google Scholar] [CrossRef] [PubMed]
- Costa, L.G.; Giordano, G. Developmental neurotoxicity of polybrominated diphenyl ether (PBDE) flame retardants. Neurotoxicology 2007, 28, 1047–1067. [Google Scholar] [CrossRef] [PubMed]
- Darnerud, P.O. Brominated flame retardants as possible endocrine disrupters. Int. J. Androl. 2008, 31, 152–160. [Google Scholar] [CrossRef] [PubMed]
- Gerber, L.R.; Karimi, R.; Fitzgerald, T.P. Sustaining seafood for public health. Front. Ecol. Environ. 2012, 10, 487–493. [Google Scholar] [CrossRef]
- Agency for Toxic Substances and Disease Registry (ATSDR). Toxicological Profile for Polybrominated Biphenyls and Polybrominated Diphenyl Ethers; U.S. Department of Health and Human Services: Atlanta, GA, USA, 2004.
- Goodson, W.H.; Lowe, L.; Carpenter, D.O.; Gilbertson, M.; Manaf Ali, A.; Lopez de Cerain Salsamendi, A.; Lasfar, A.; Carnero, A.; Azqueta, A.; Amedei, A.; et al. Assessing the carcinogenic potential of low-dose exposures to chemical mixtures in the environment: The challenge ahead. Carcinogenesis 2015, 36, 254–296. [Google Scholar] [CrossRef] [PubMed]
- Cheung, W.W.L.; Pitcher, T.J.; Pauly, D. A fuzzy logic expert system to estimate intrinsic extinction vulnerabilities of marine fishes to fishing. Biol. Conserv. 2005, 124, 97–111. [Google Scholar] [CrossRef]
- Monterey Bay Aquarium Seafood Watch. Available online: https://www.seafoodwatch.org/seafood-recommendations (accessed on 1 March 2014).
- Sethi, S.A.; Branch, T.A.; Watson, R. Global fishery development patterns are driven by profit but not trophic level. Proc. Natl. Acad. Sci. USA 2010, 107, 12163–12167. [Google Scholar] [CrossRef] [PubMed]
- Zegers, B.N.; Lewis, W.E.; Booij, K.; Smittenberg, R.H.; Boer, W.; De Boer, J.; Boon, J.P. Levels of polybrominated diphenyl ether flame retardants in sediment cores from Western Europe. Environ. Sci. Technol. 2003, 37, 3803–3807. [Google Scholar] [CrossRef] [PubMed]
- Odusanya, D.O.; Okonkwo, J.O.; Botha, B. Polybrominated diphenyl ethers (PBDEs) in leachates from selected landfill sites in South Africa. Waste Manag. 2009, 29, 96–102. [Google Scholar] [CrossRef] [PubMed]
- Sepúlveda, A.; Schluep, M.; Renaud, F.G.; Streicher, M.; Kuehr, R.; Hagelüken, C.; Gerecke, A.C. A review of the environmental fate and effects of hazardous substances released from electrical and electronic equipments during recycling: Examples from China and India. Environ. Impact Assess. 2010, 30, 28–41. [Google Scholar] [CrossRef]
- Daso, A.P.; Fatoki, O.S.; Odendaal, J.P.; Olujimi, O.O. Polybrominated diphenyl ethers (PBDEs) and 2,2′,4,4′,5,5′-hexabromobiphenyl (BB-153) in landfill leachate in Cape Town, South Africa. Environ. Monit. Assess. 2013, 185, 431–439. [Google Scholar] [CrossRef] [PubMed]
- De Wit, C.A. An overview of brominated flame retardants in the environment. Chemosphere 2002, 46, 583–624. [Google Scholar] [CrossRef]
© 2018 by the authors. Licensee MDPI, Basel, Switzerland. This article is an open access article distributed under the terms and conditions of the Creative Commons Attribution (CC BY) license (http://creativecommons.org/licenses/by/4.0/).