Assessment of Building Damage Risk by Natural Disasters in South Korea Using Decision Tree Analysis


Abstract

1. Introduction
2. Methods and Data
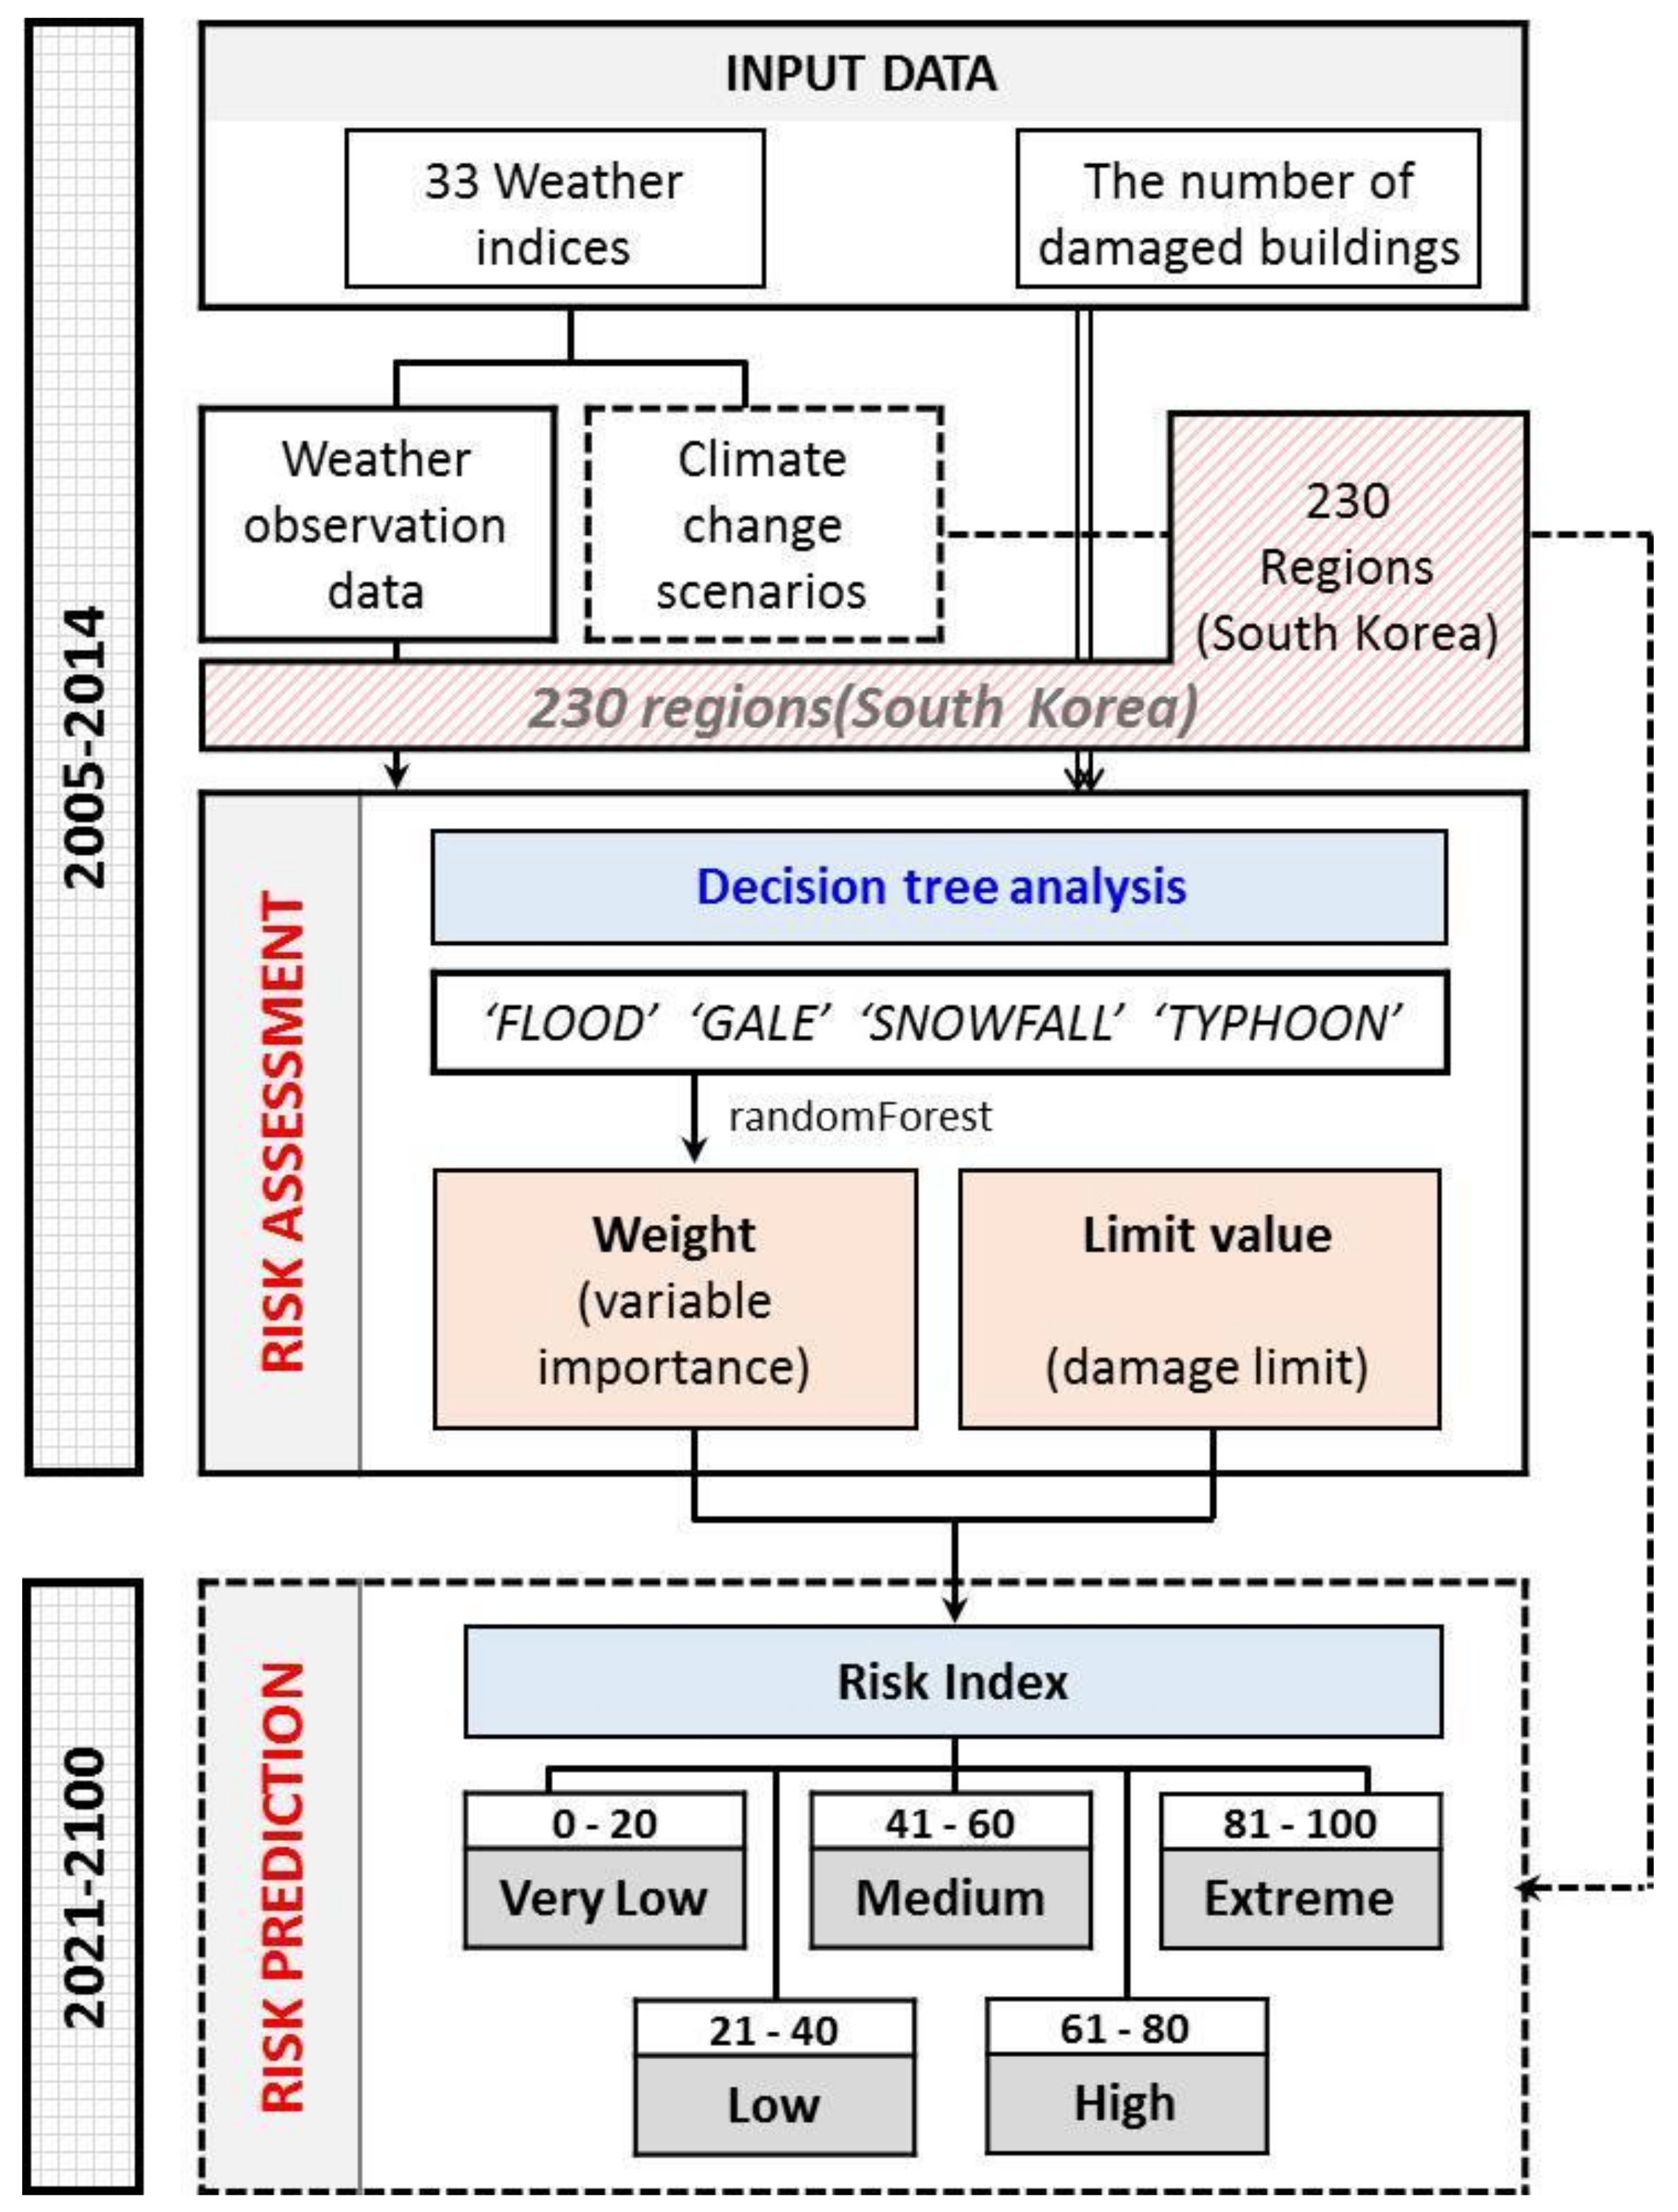
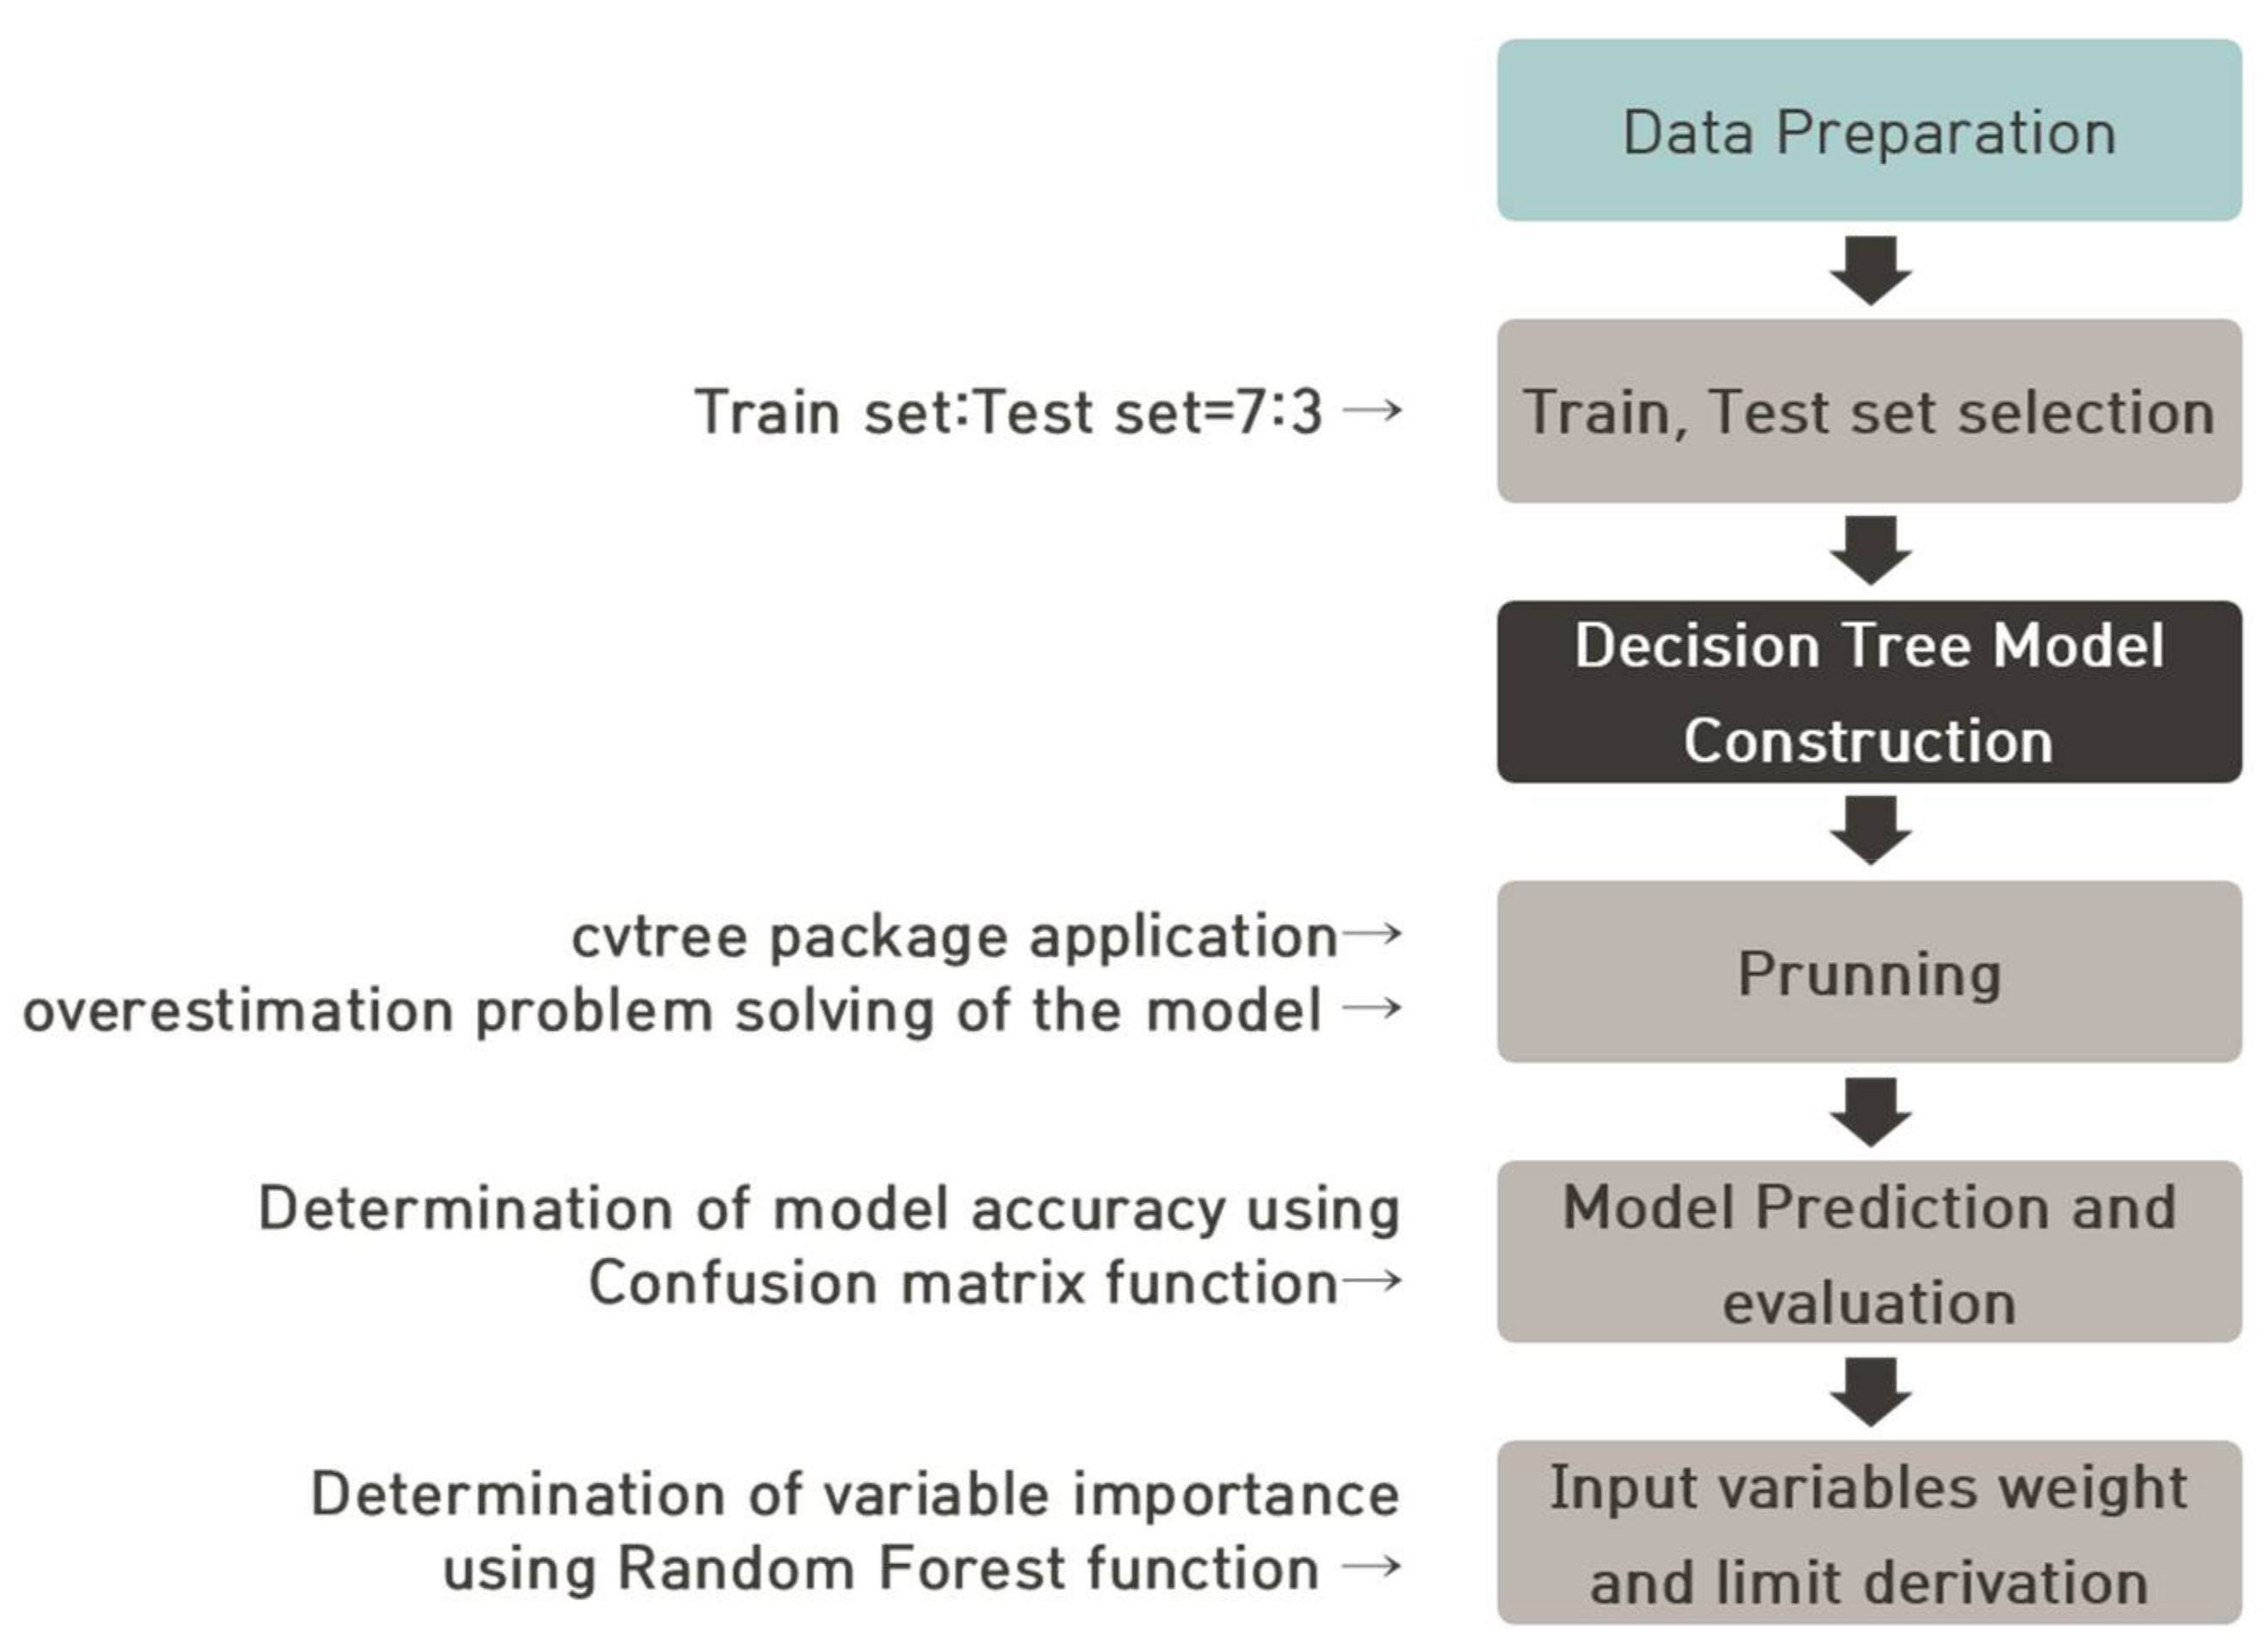
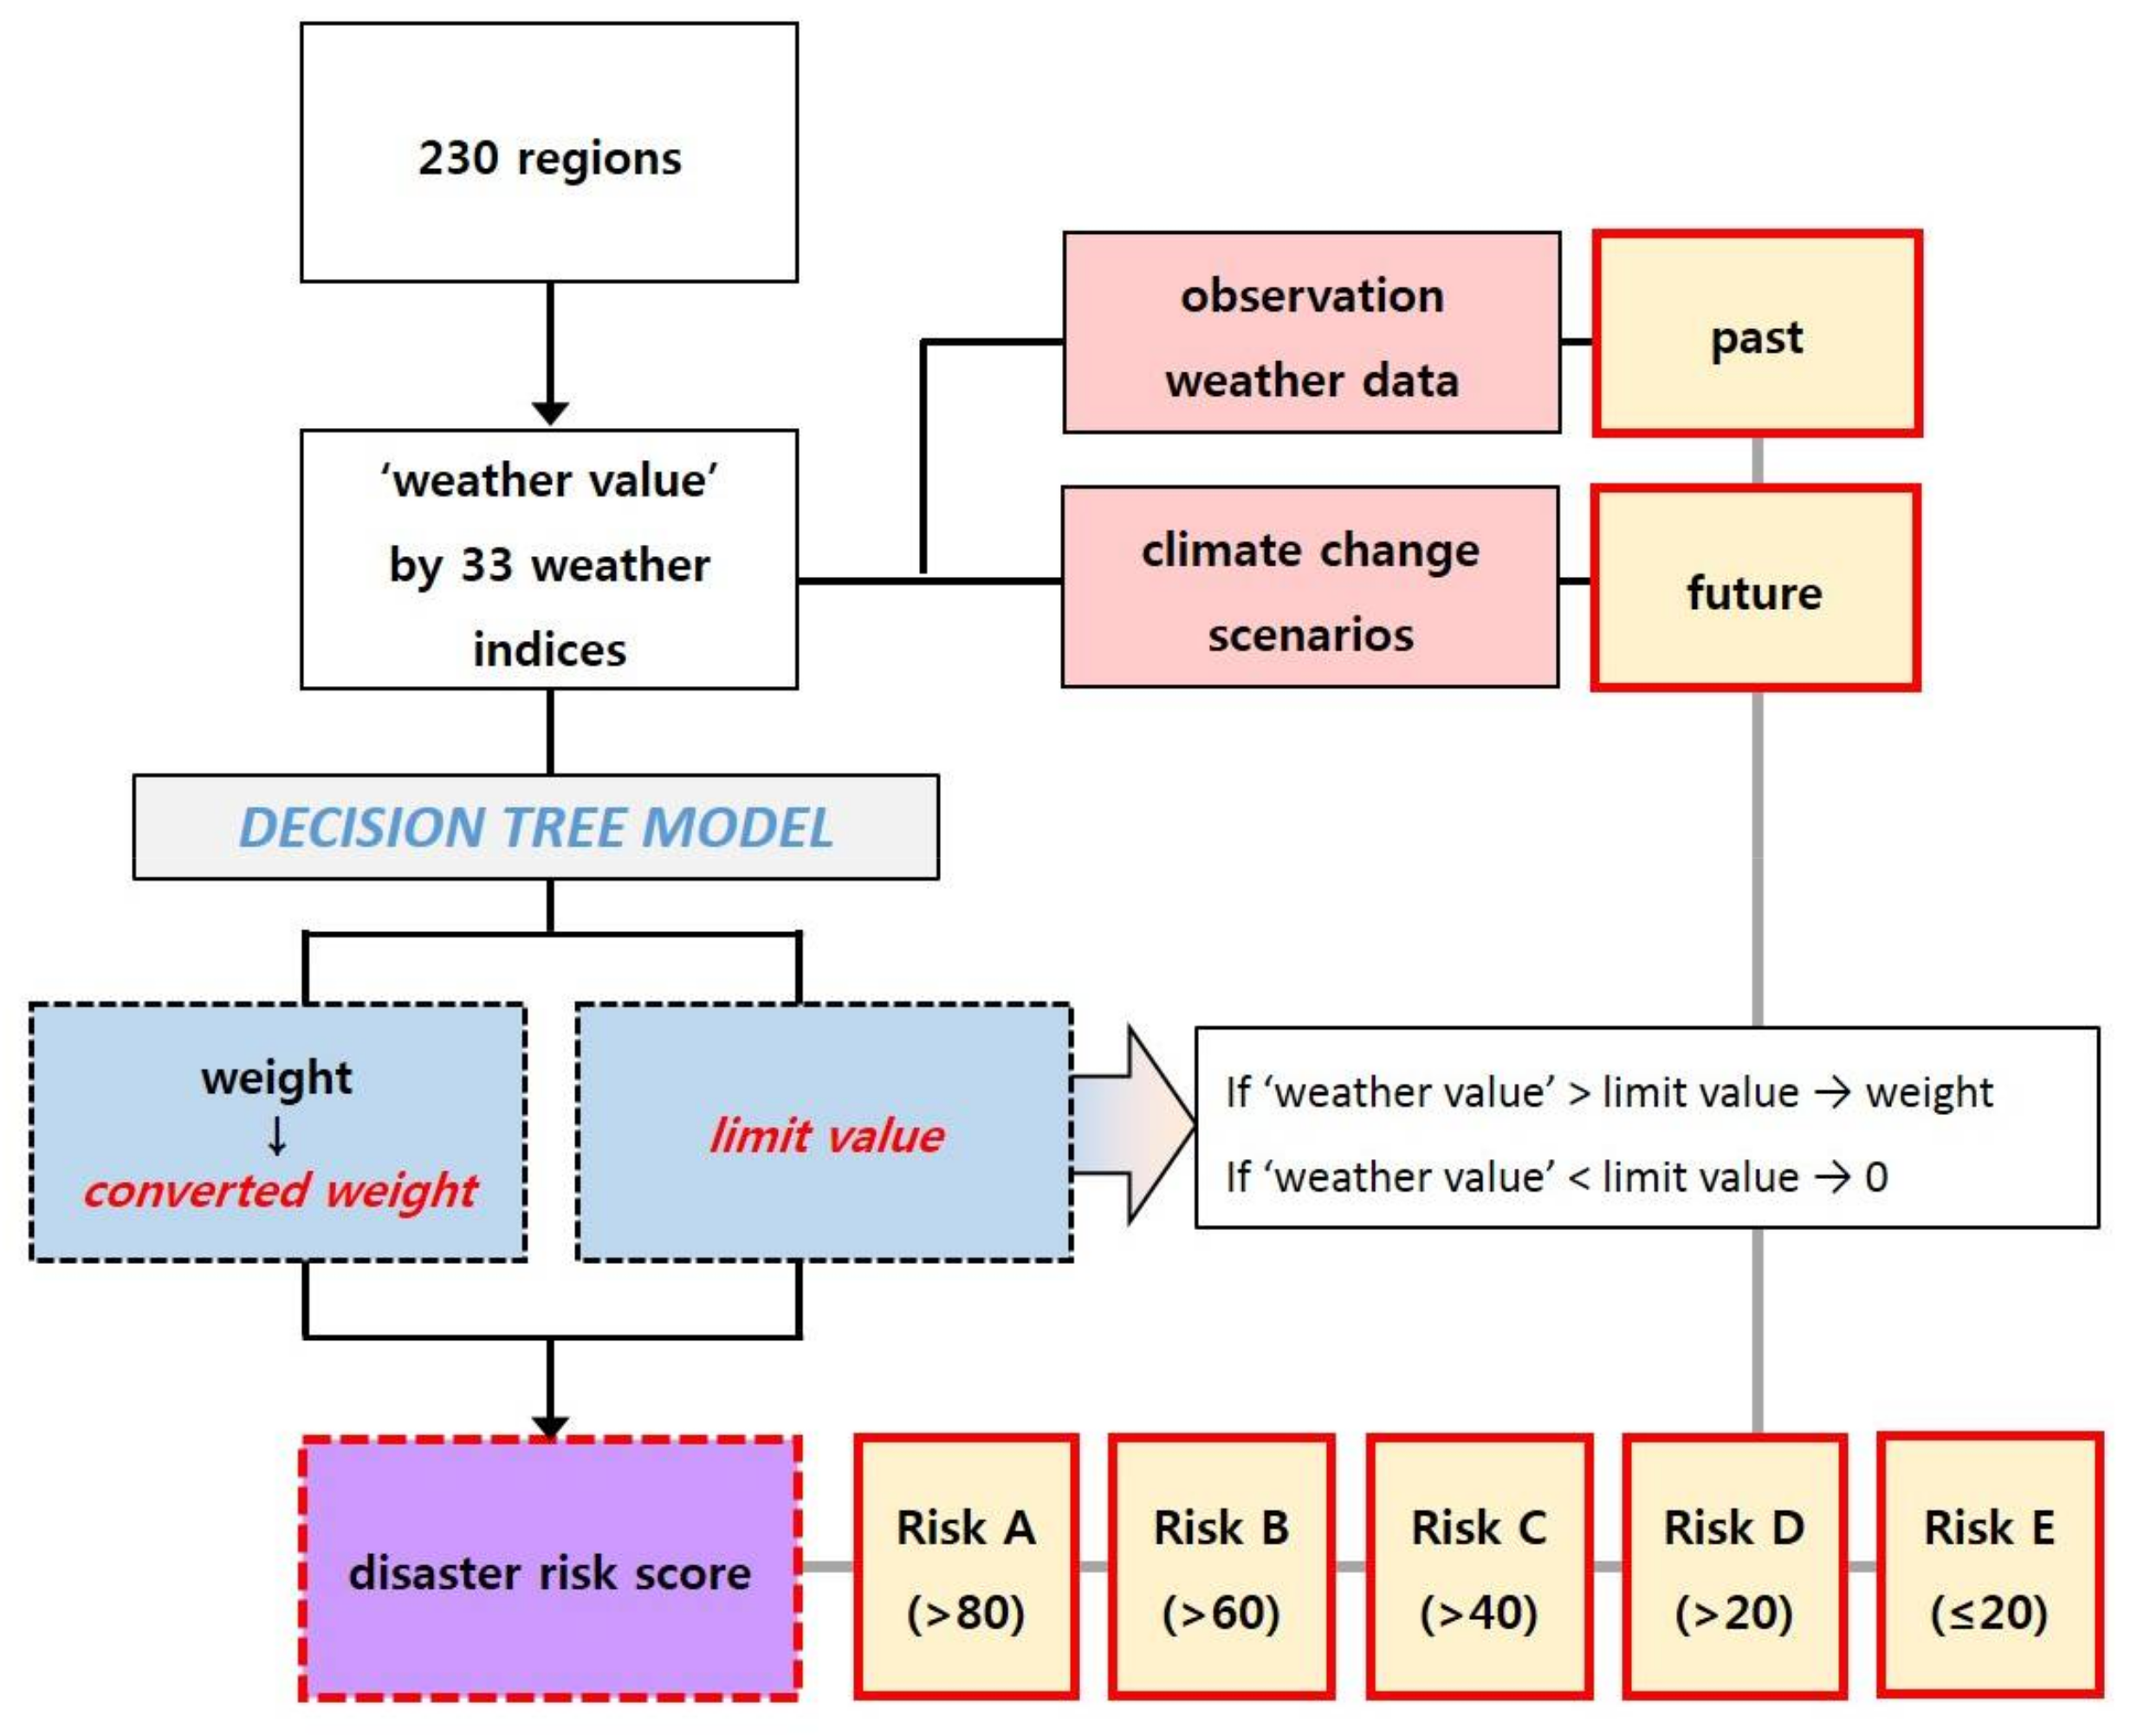
2.1. Overall Methodology
2.2. Decision Tree Analysis
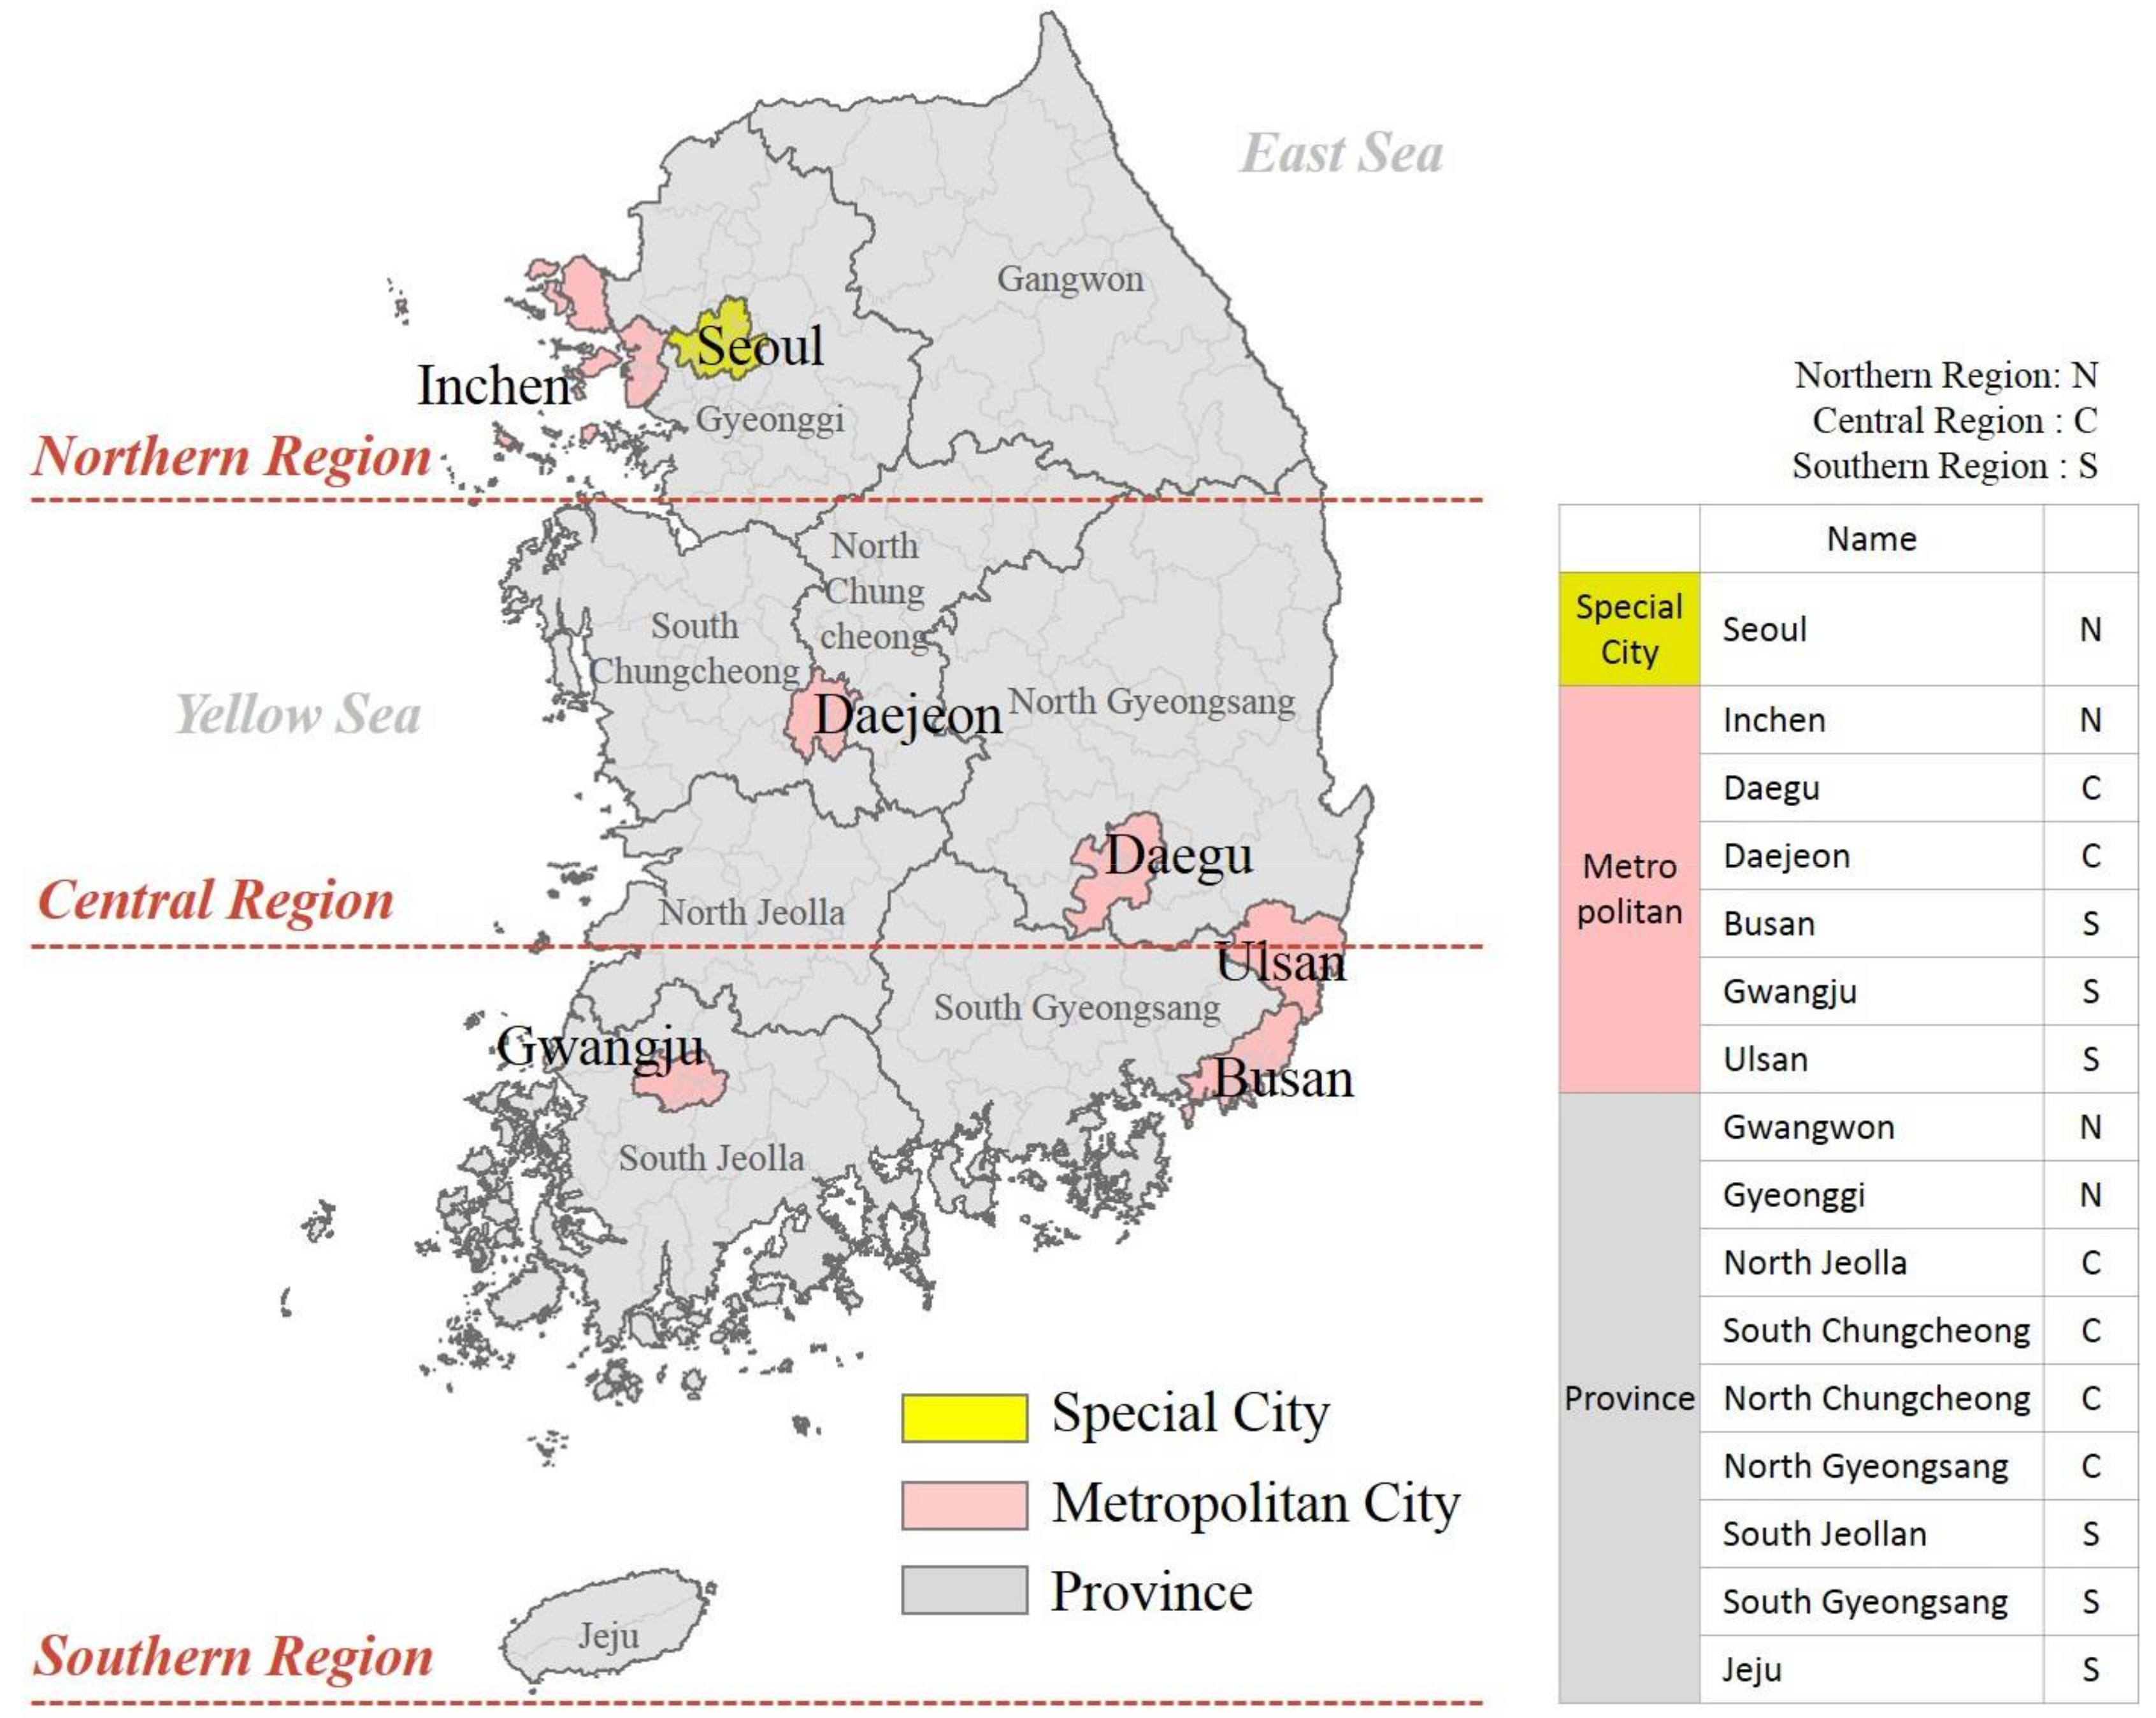
2.3. Study Area
2.4. Data
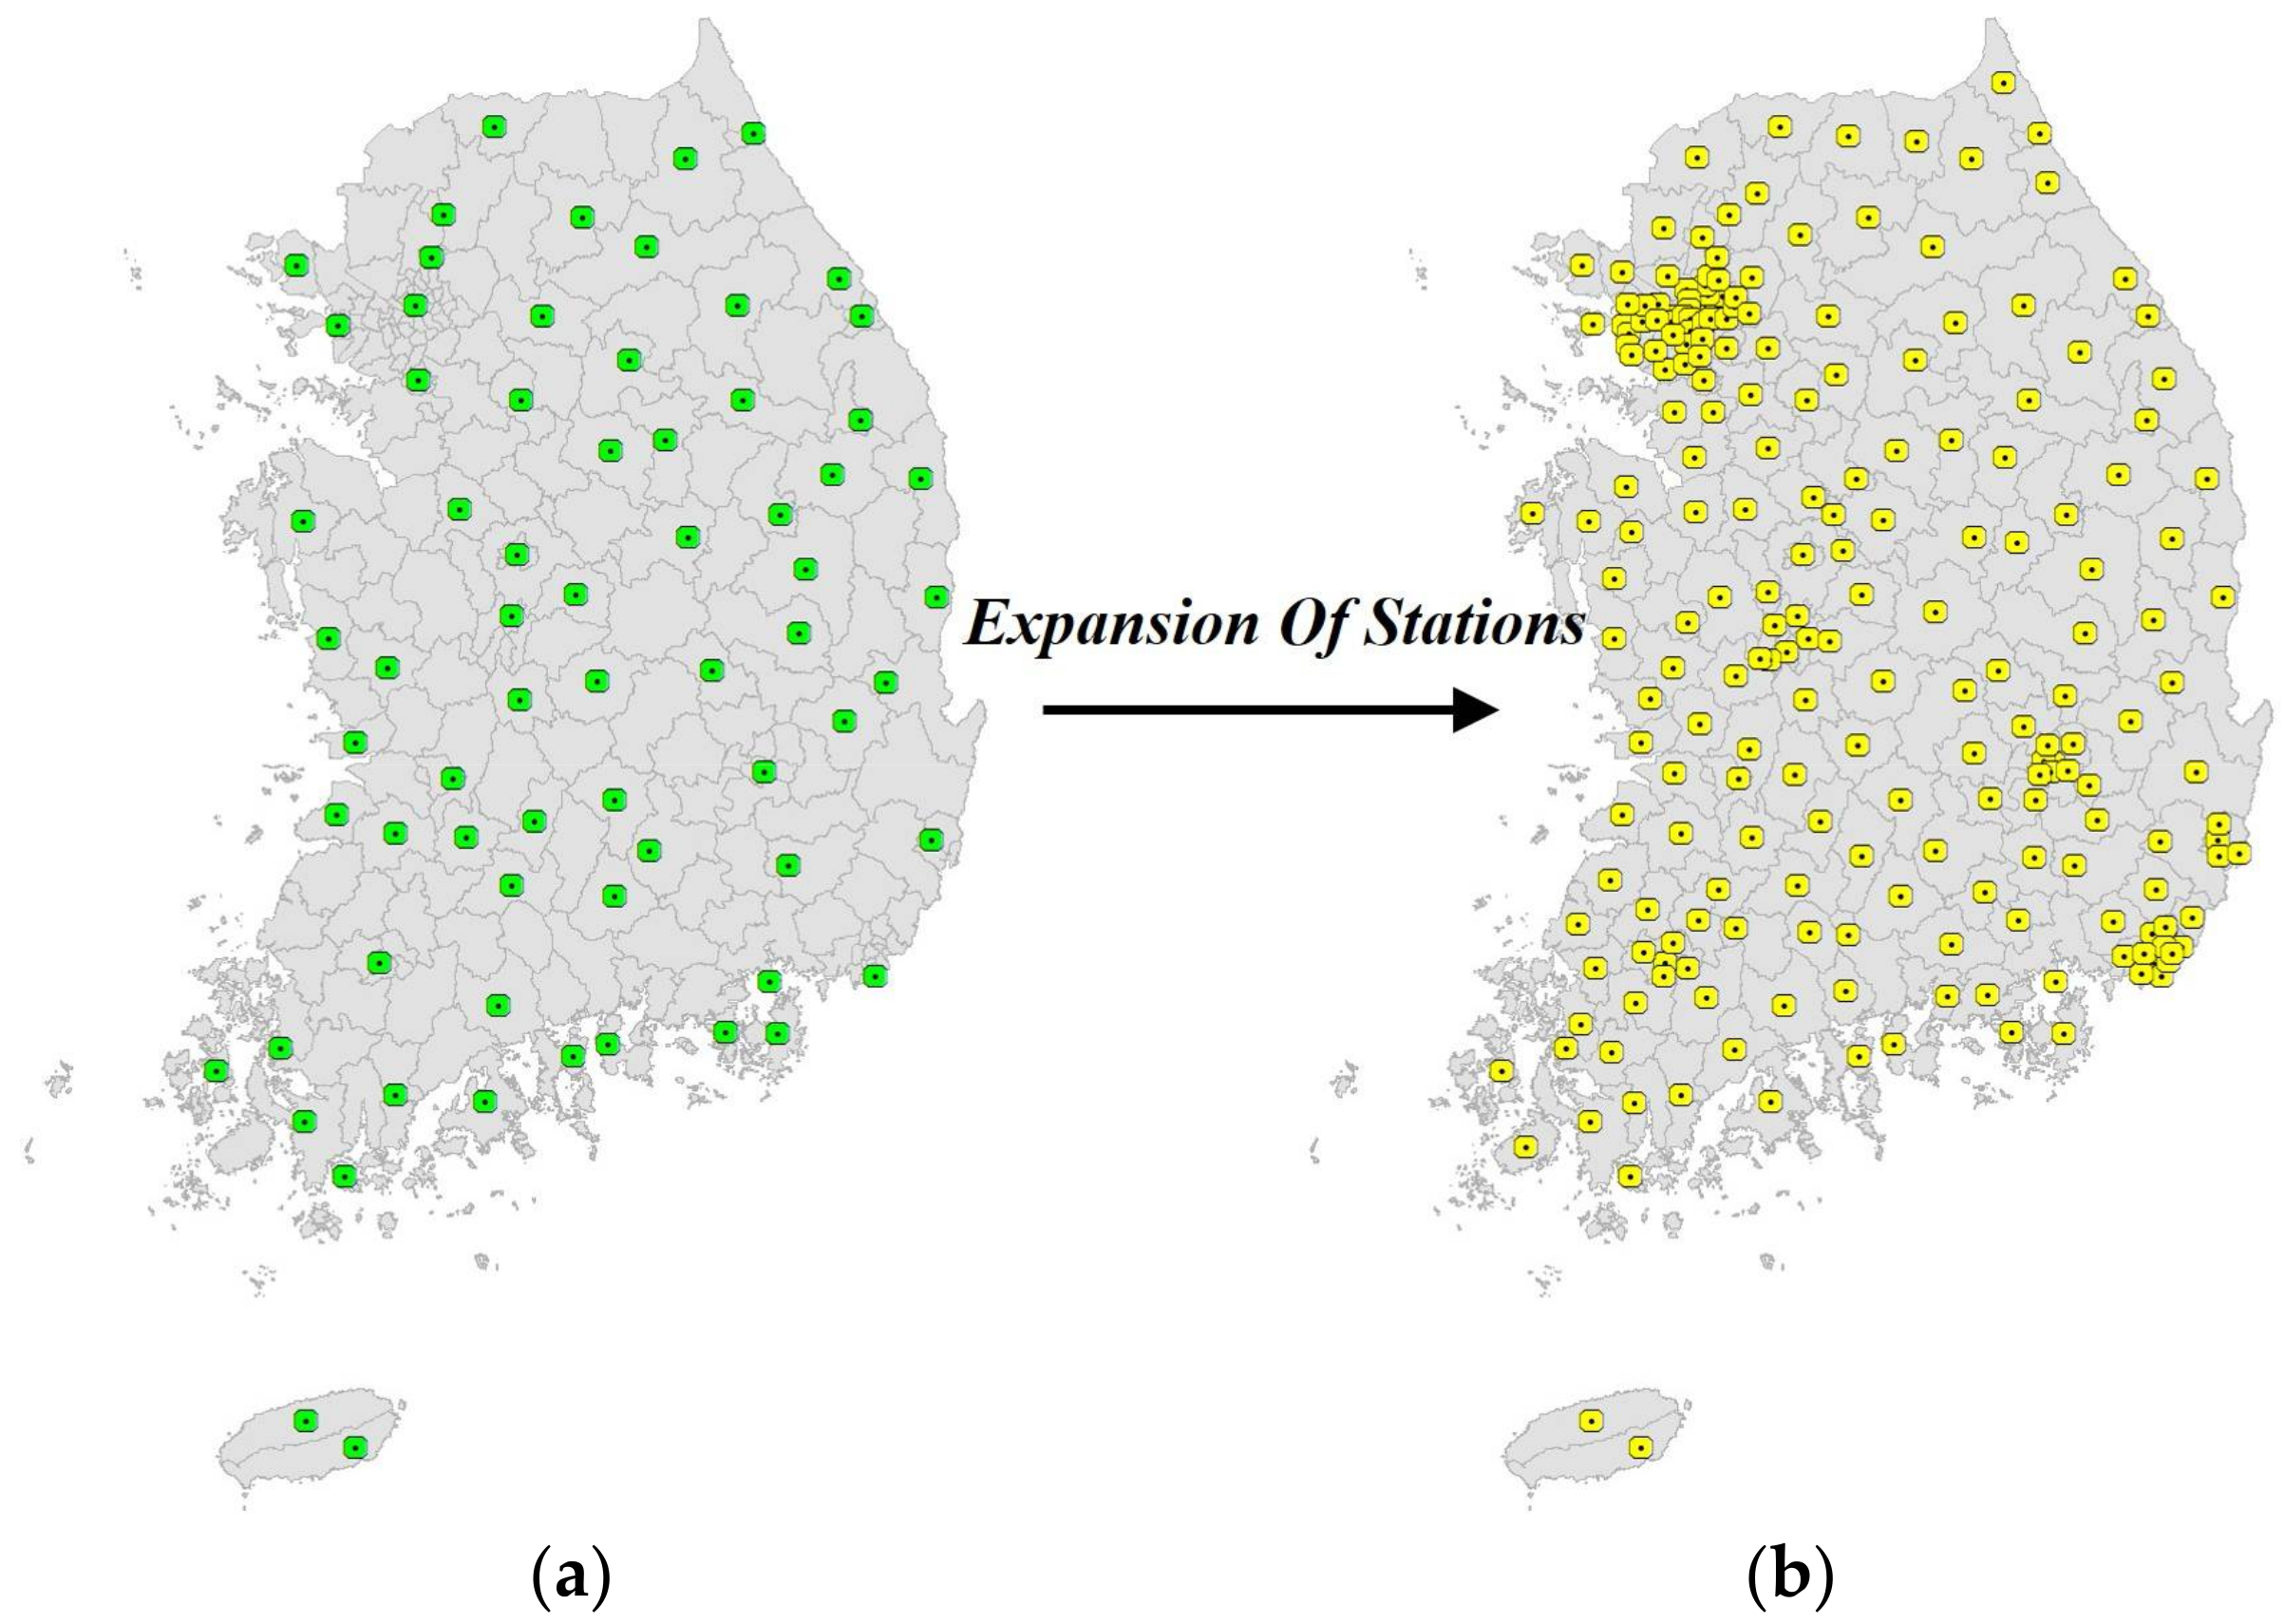
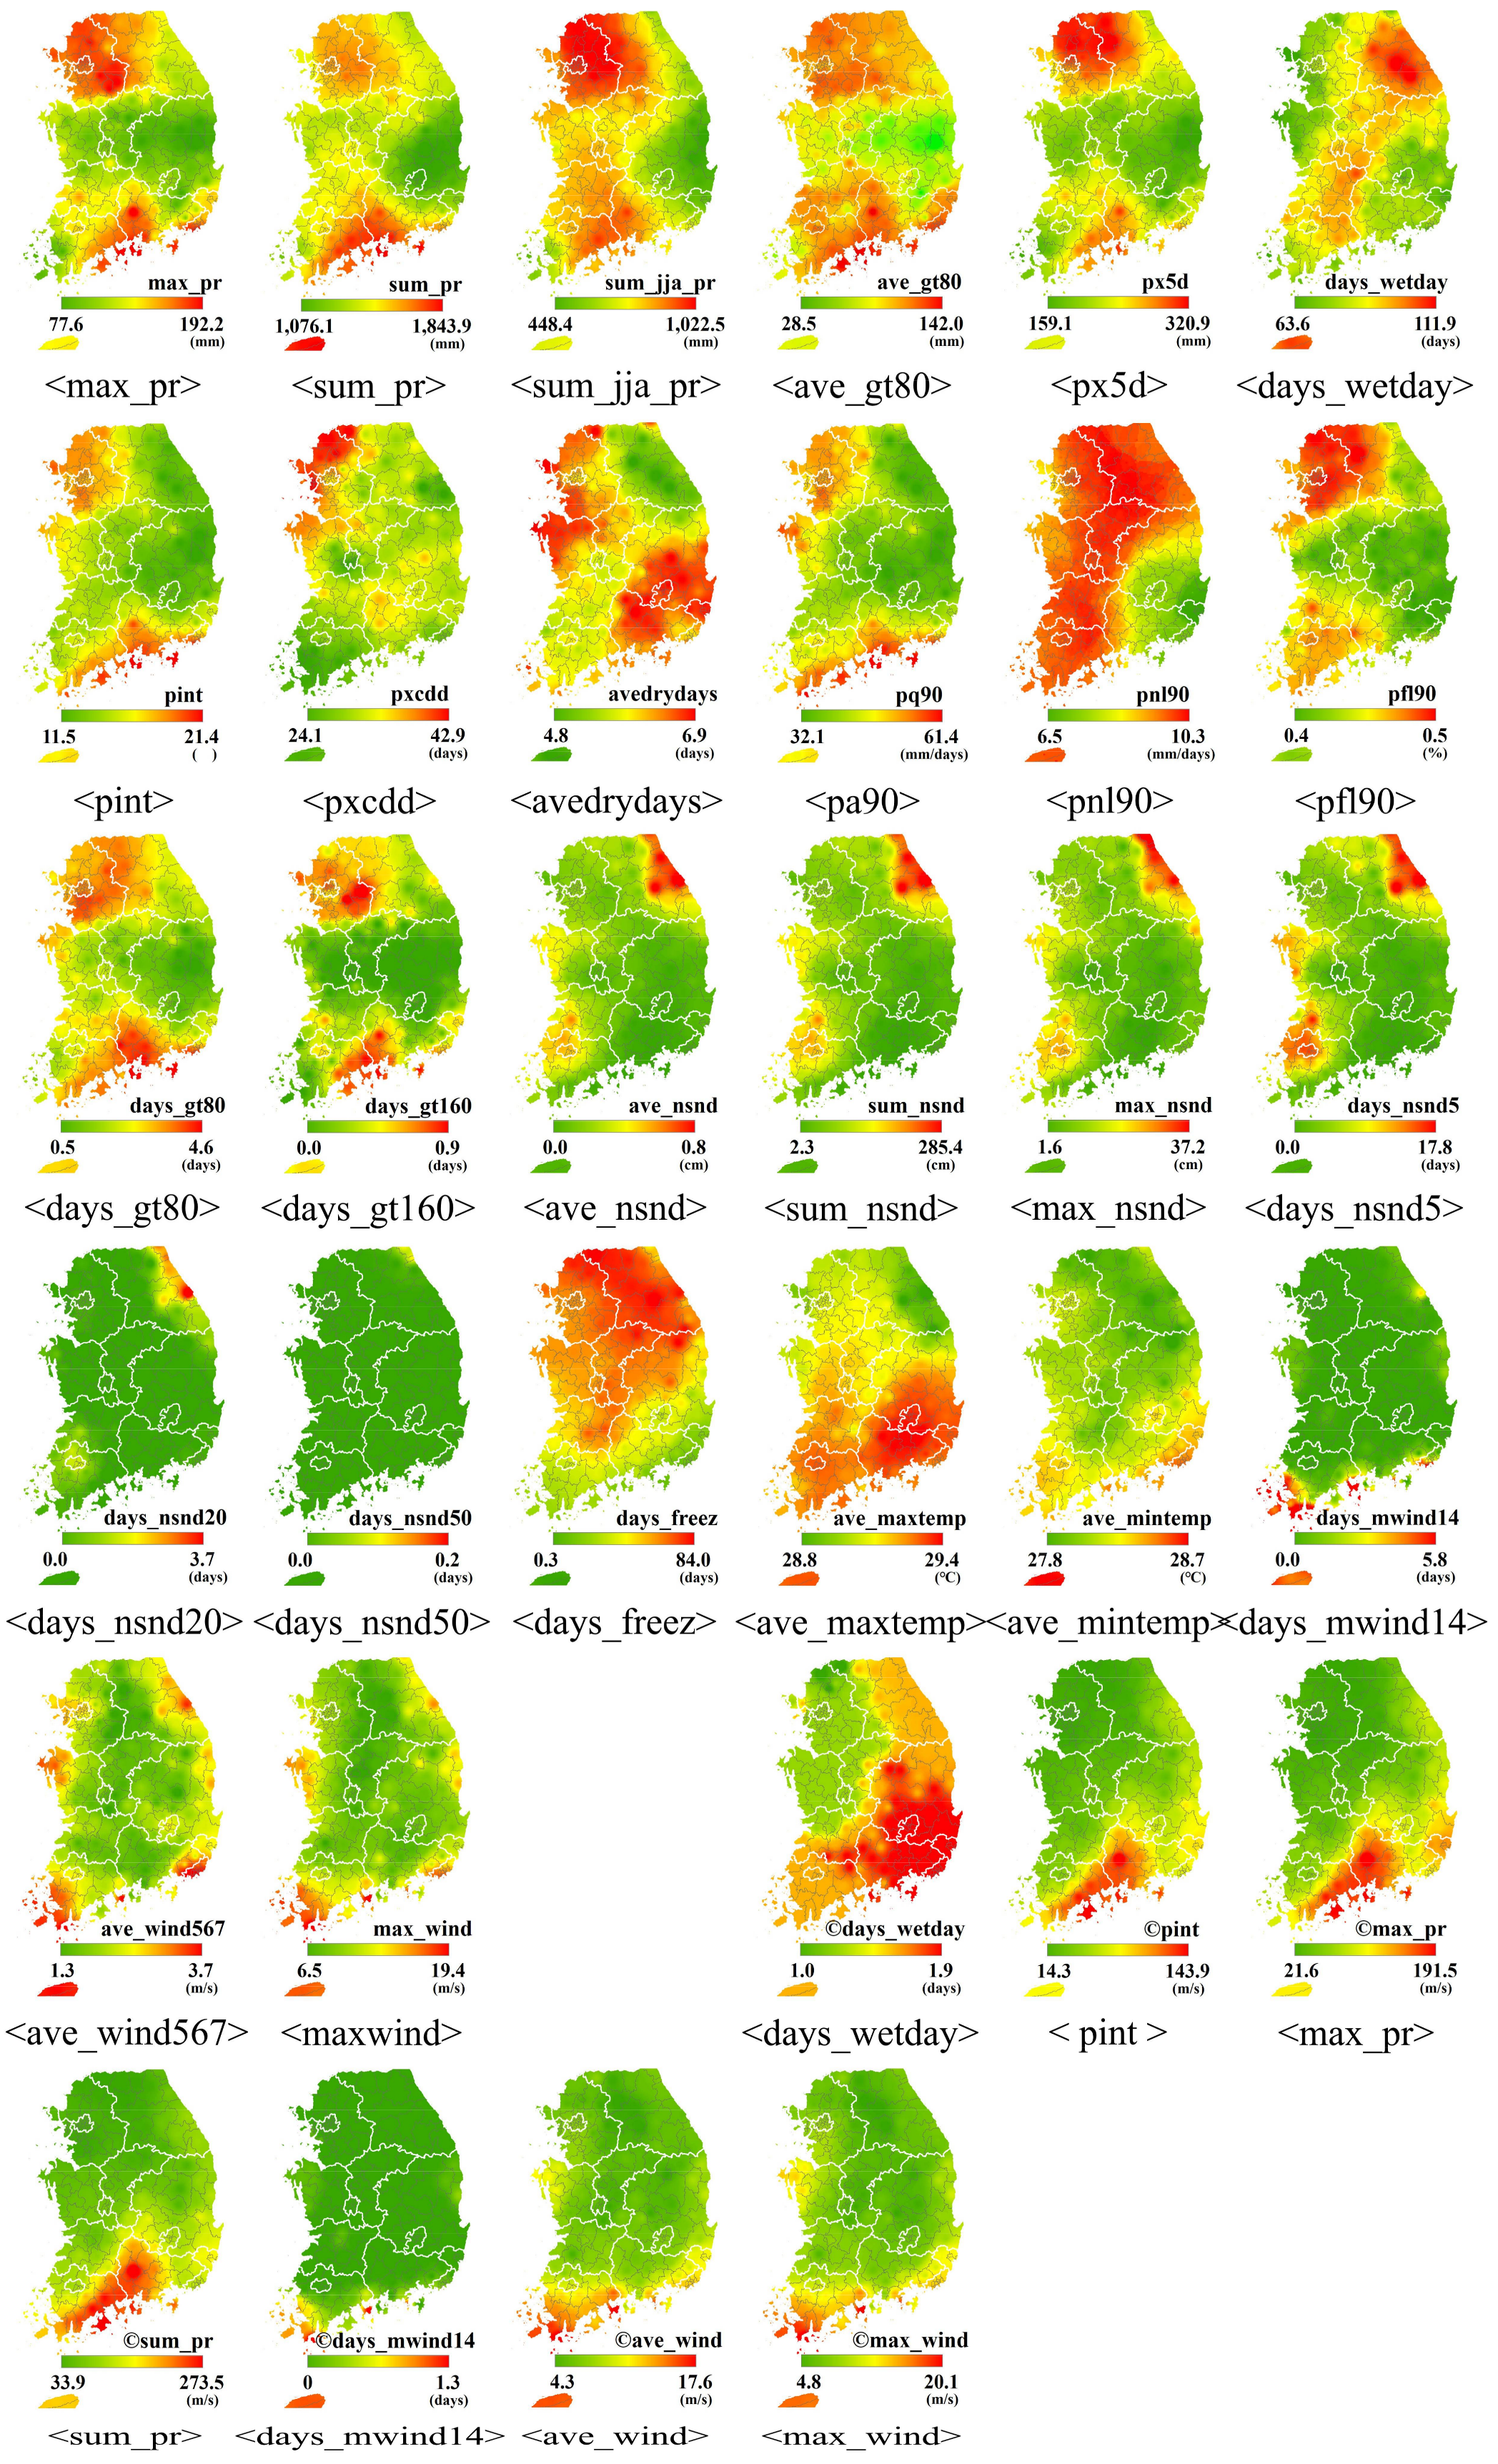
2.4.1. Weather
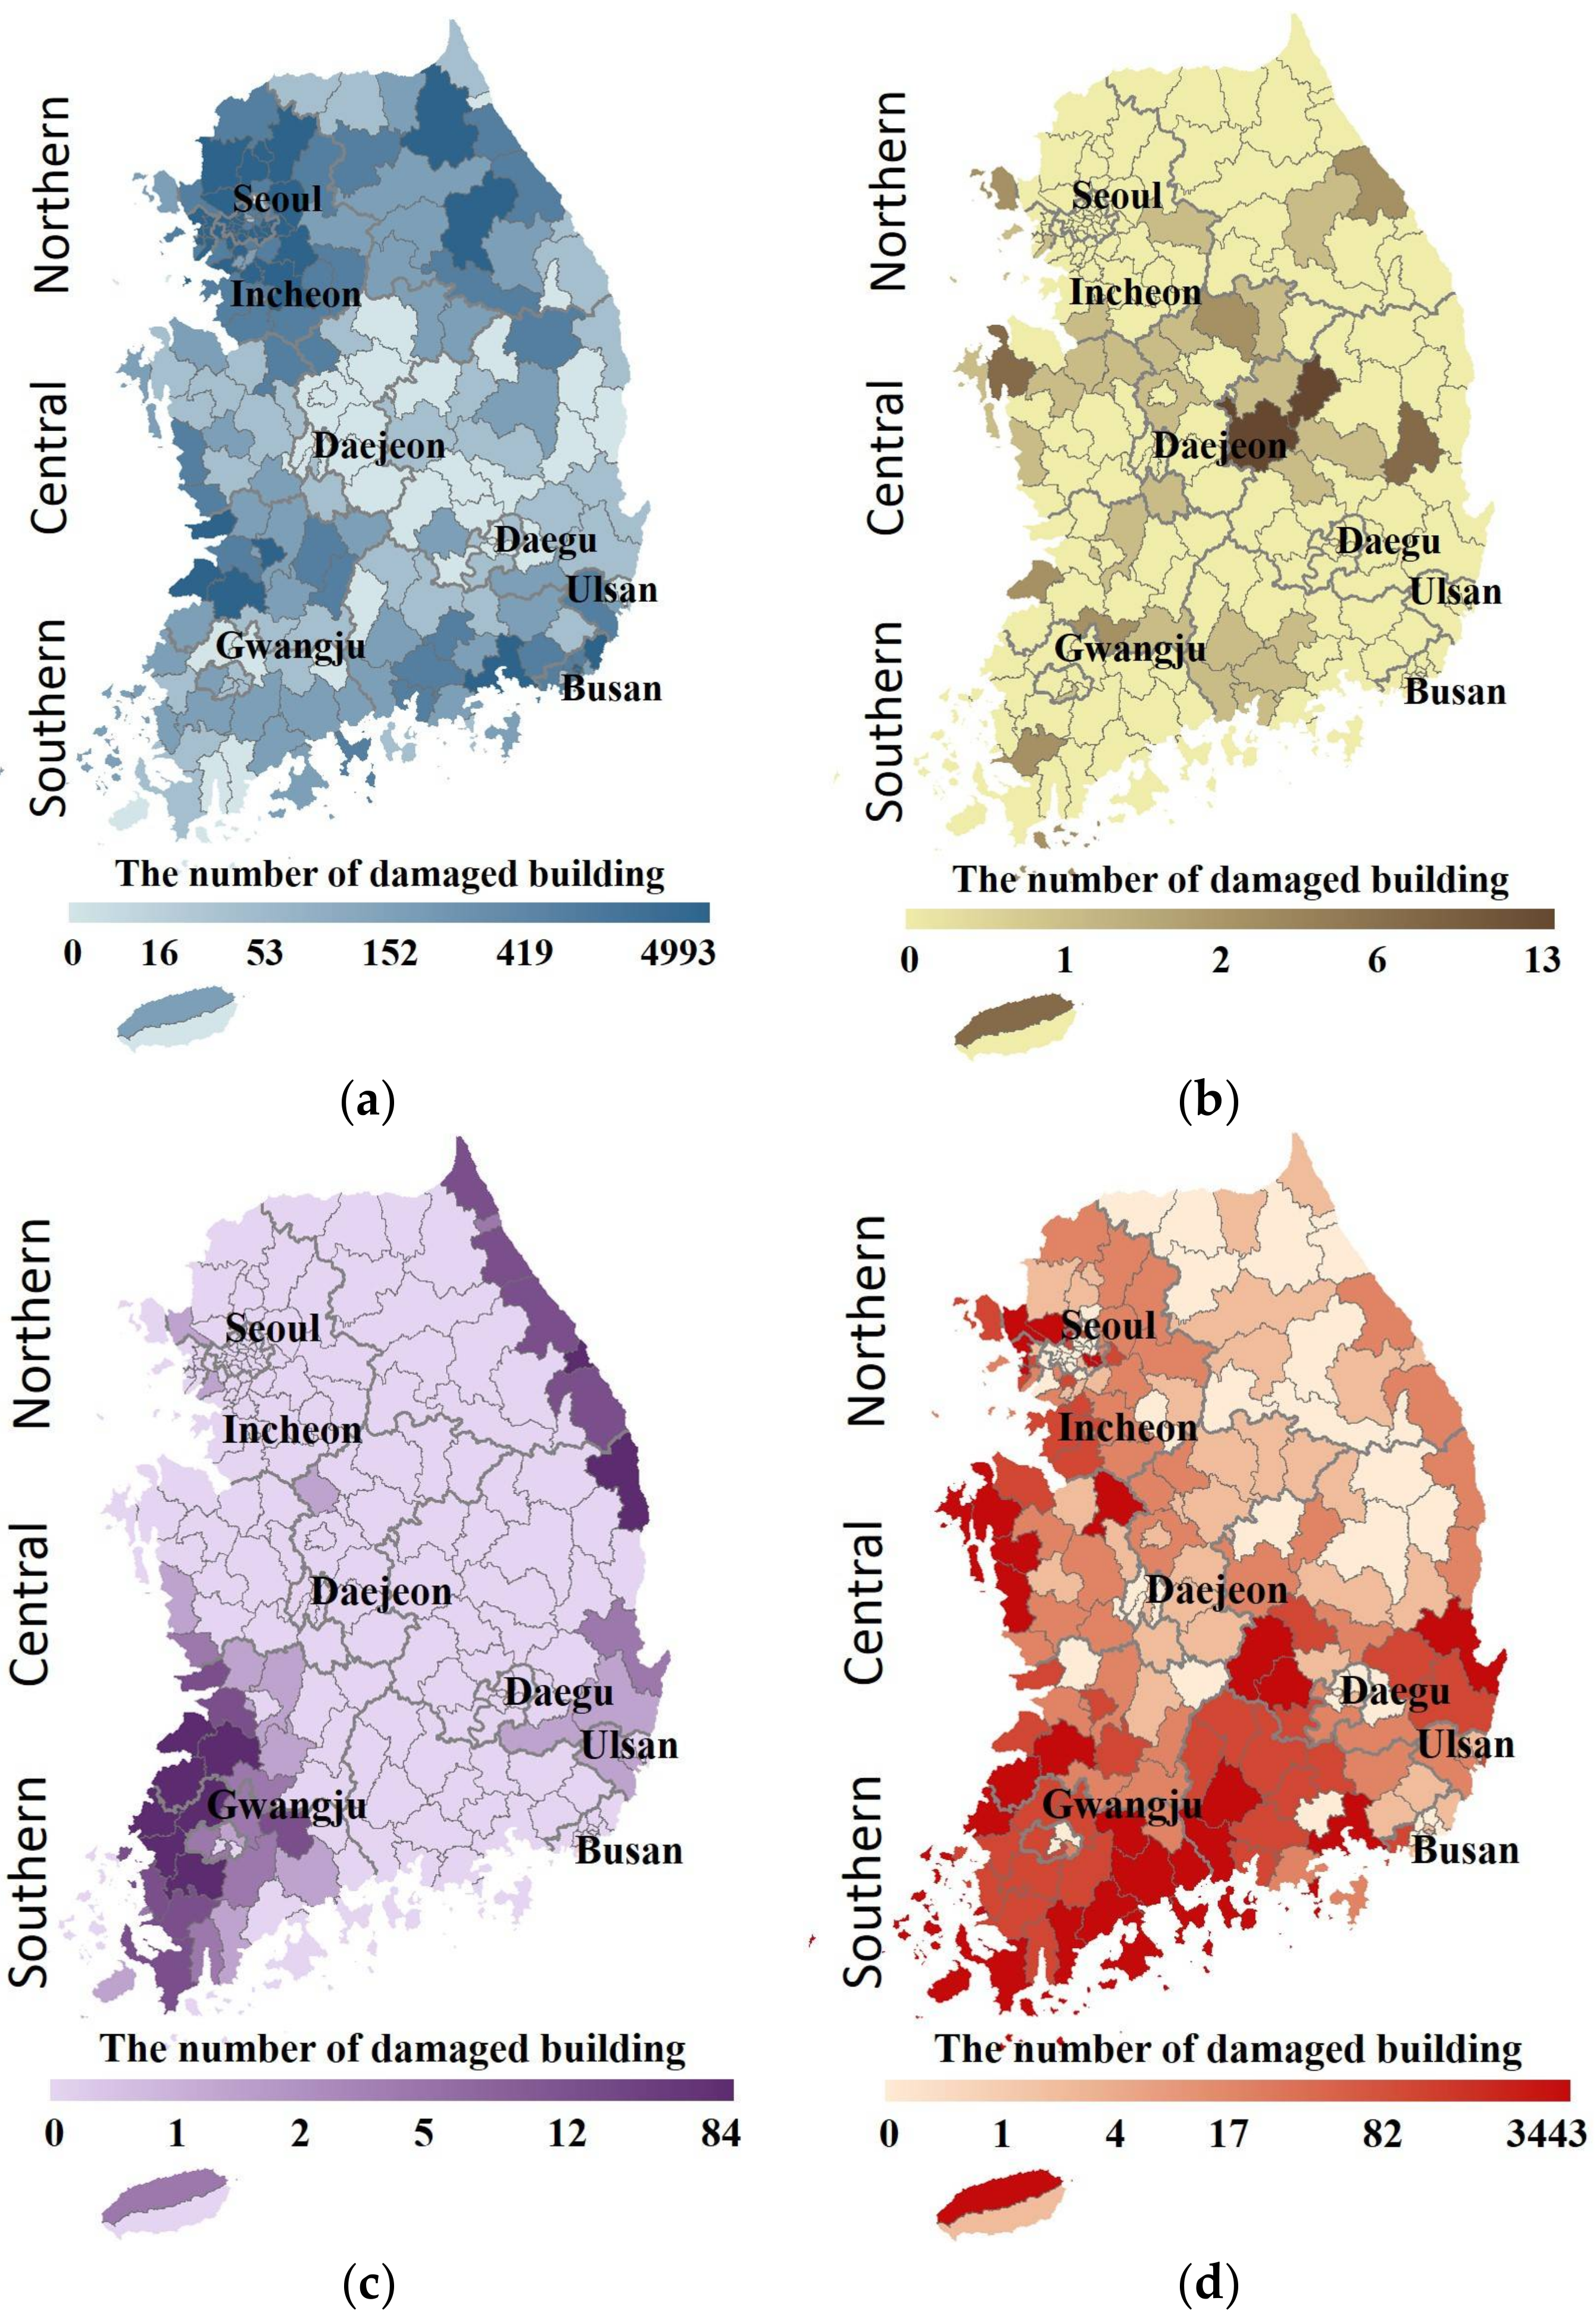
2.4.2. Building Damage History
3. Results
3.1. Selection of Input Variables
3.2. Assessment of Building Damage Using Decision Tree Analysis
3.2.1. Accuracy of the Decision Tree Model
3.2.2. Deriving the Weight and Limit Value from Input Variables
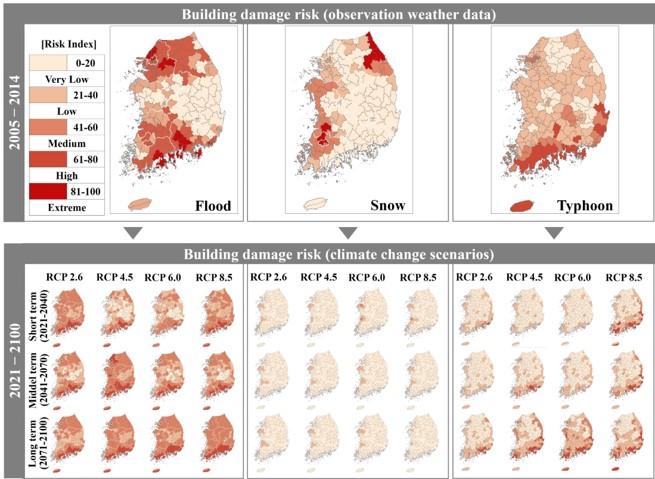
3.3. Predictions of Future Damage to Buildings
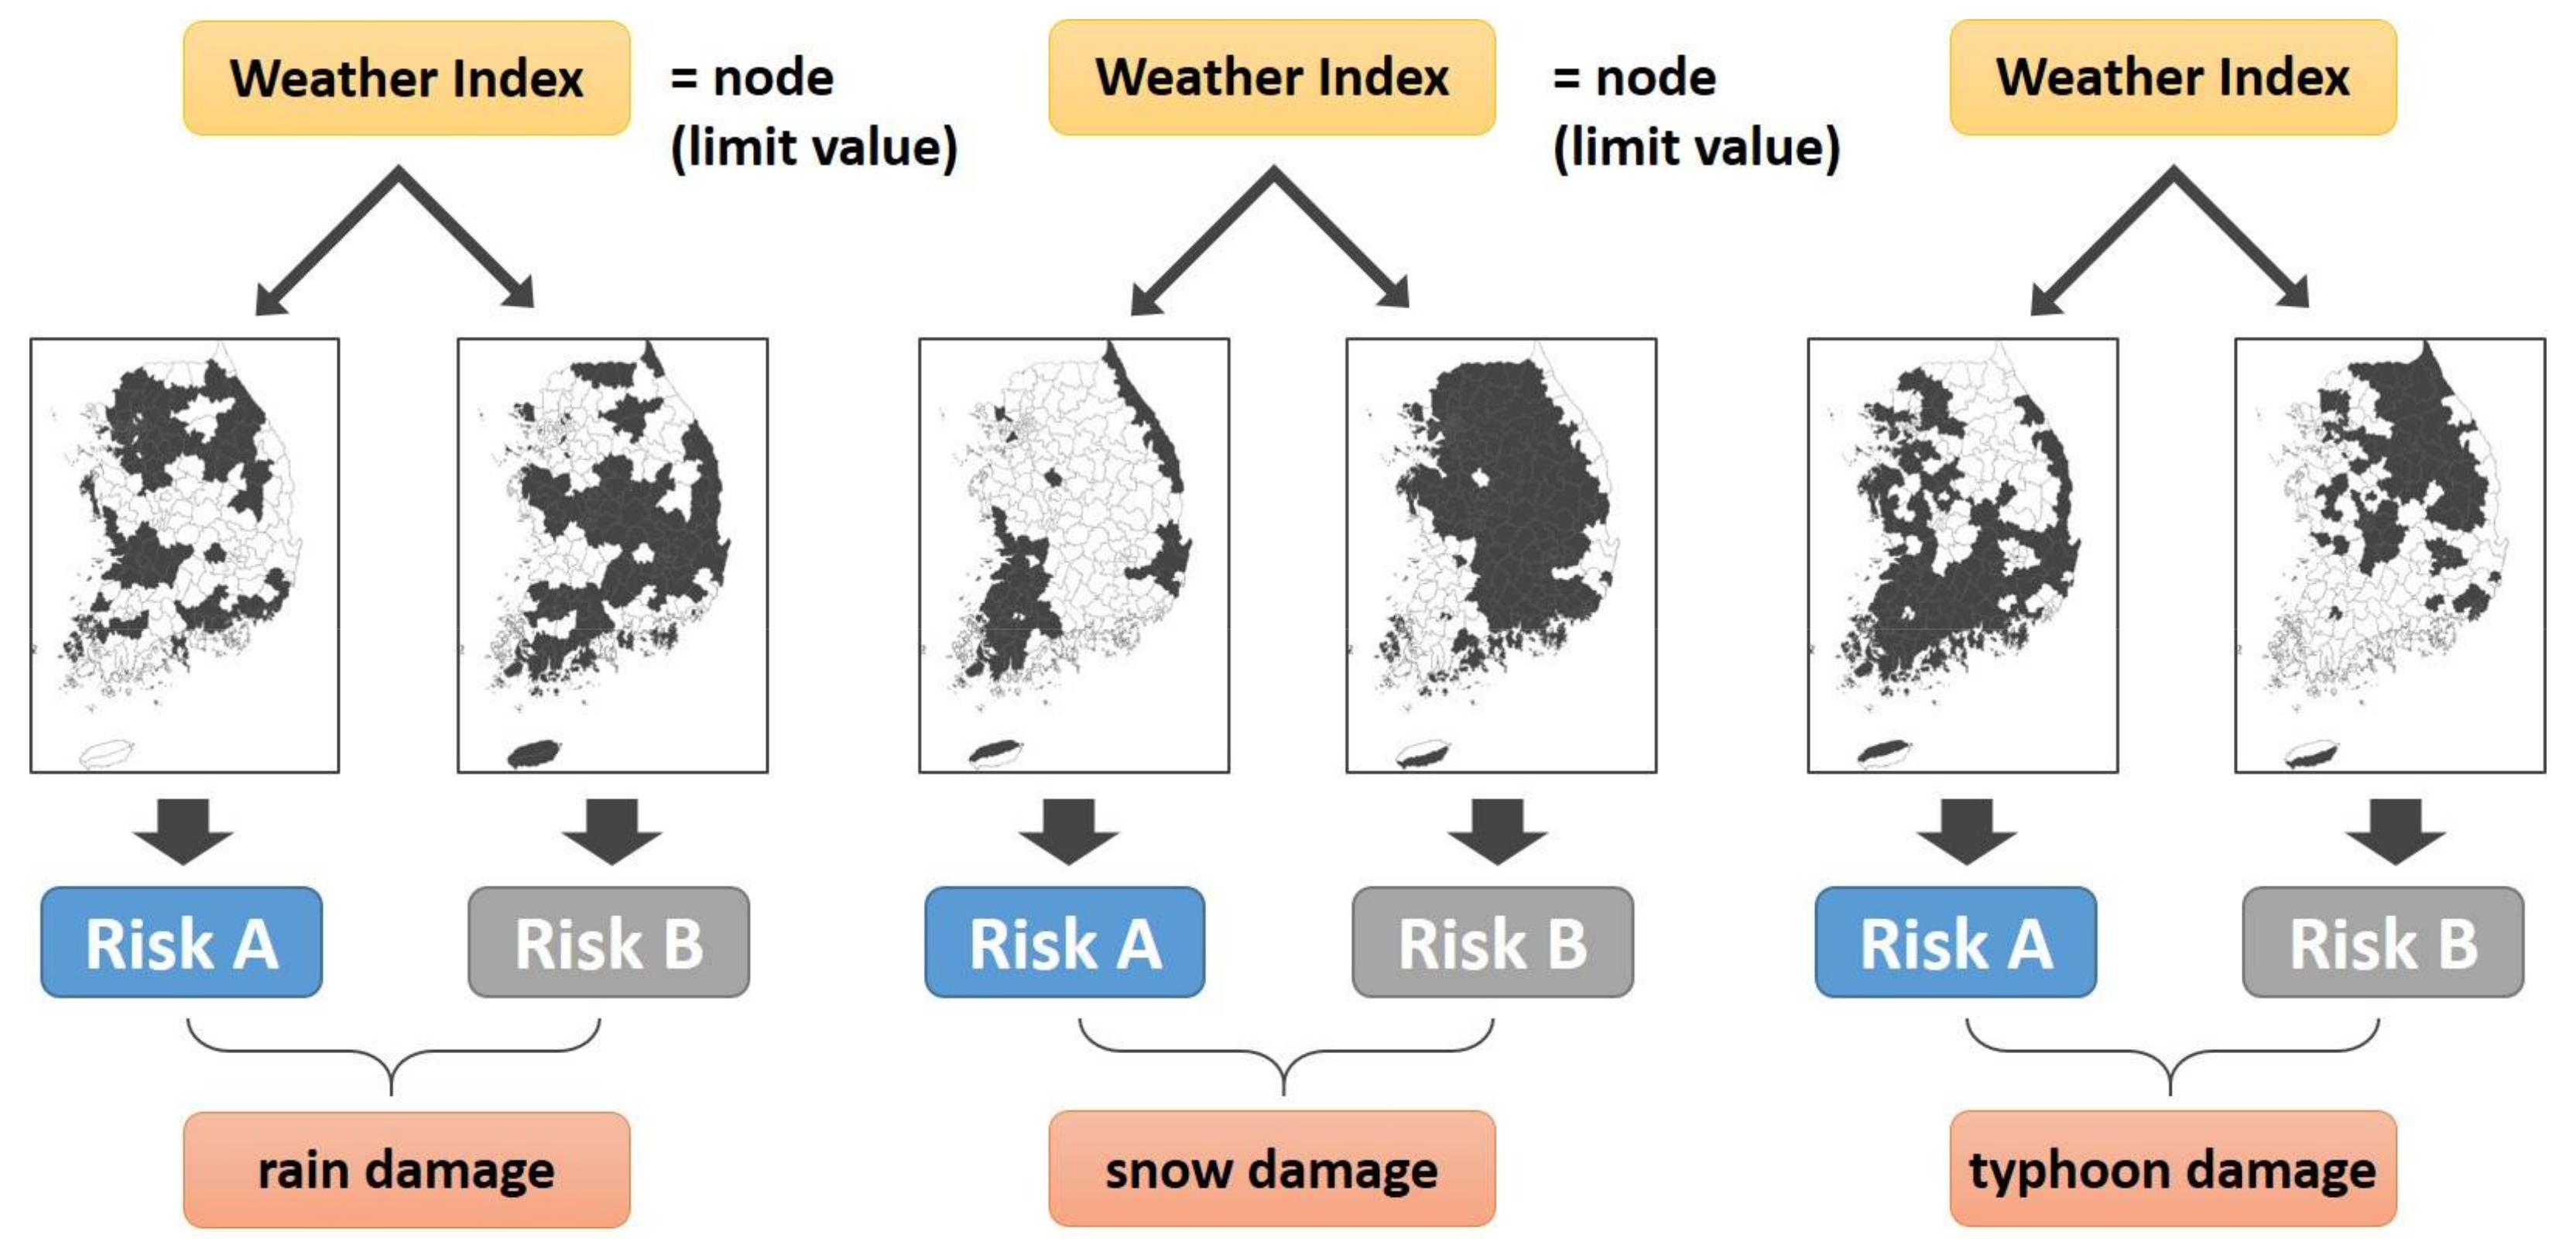
3.3.1. Risk Assessment Based on Weights and Limit Values
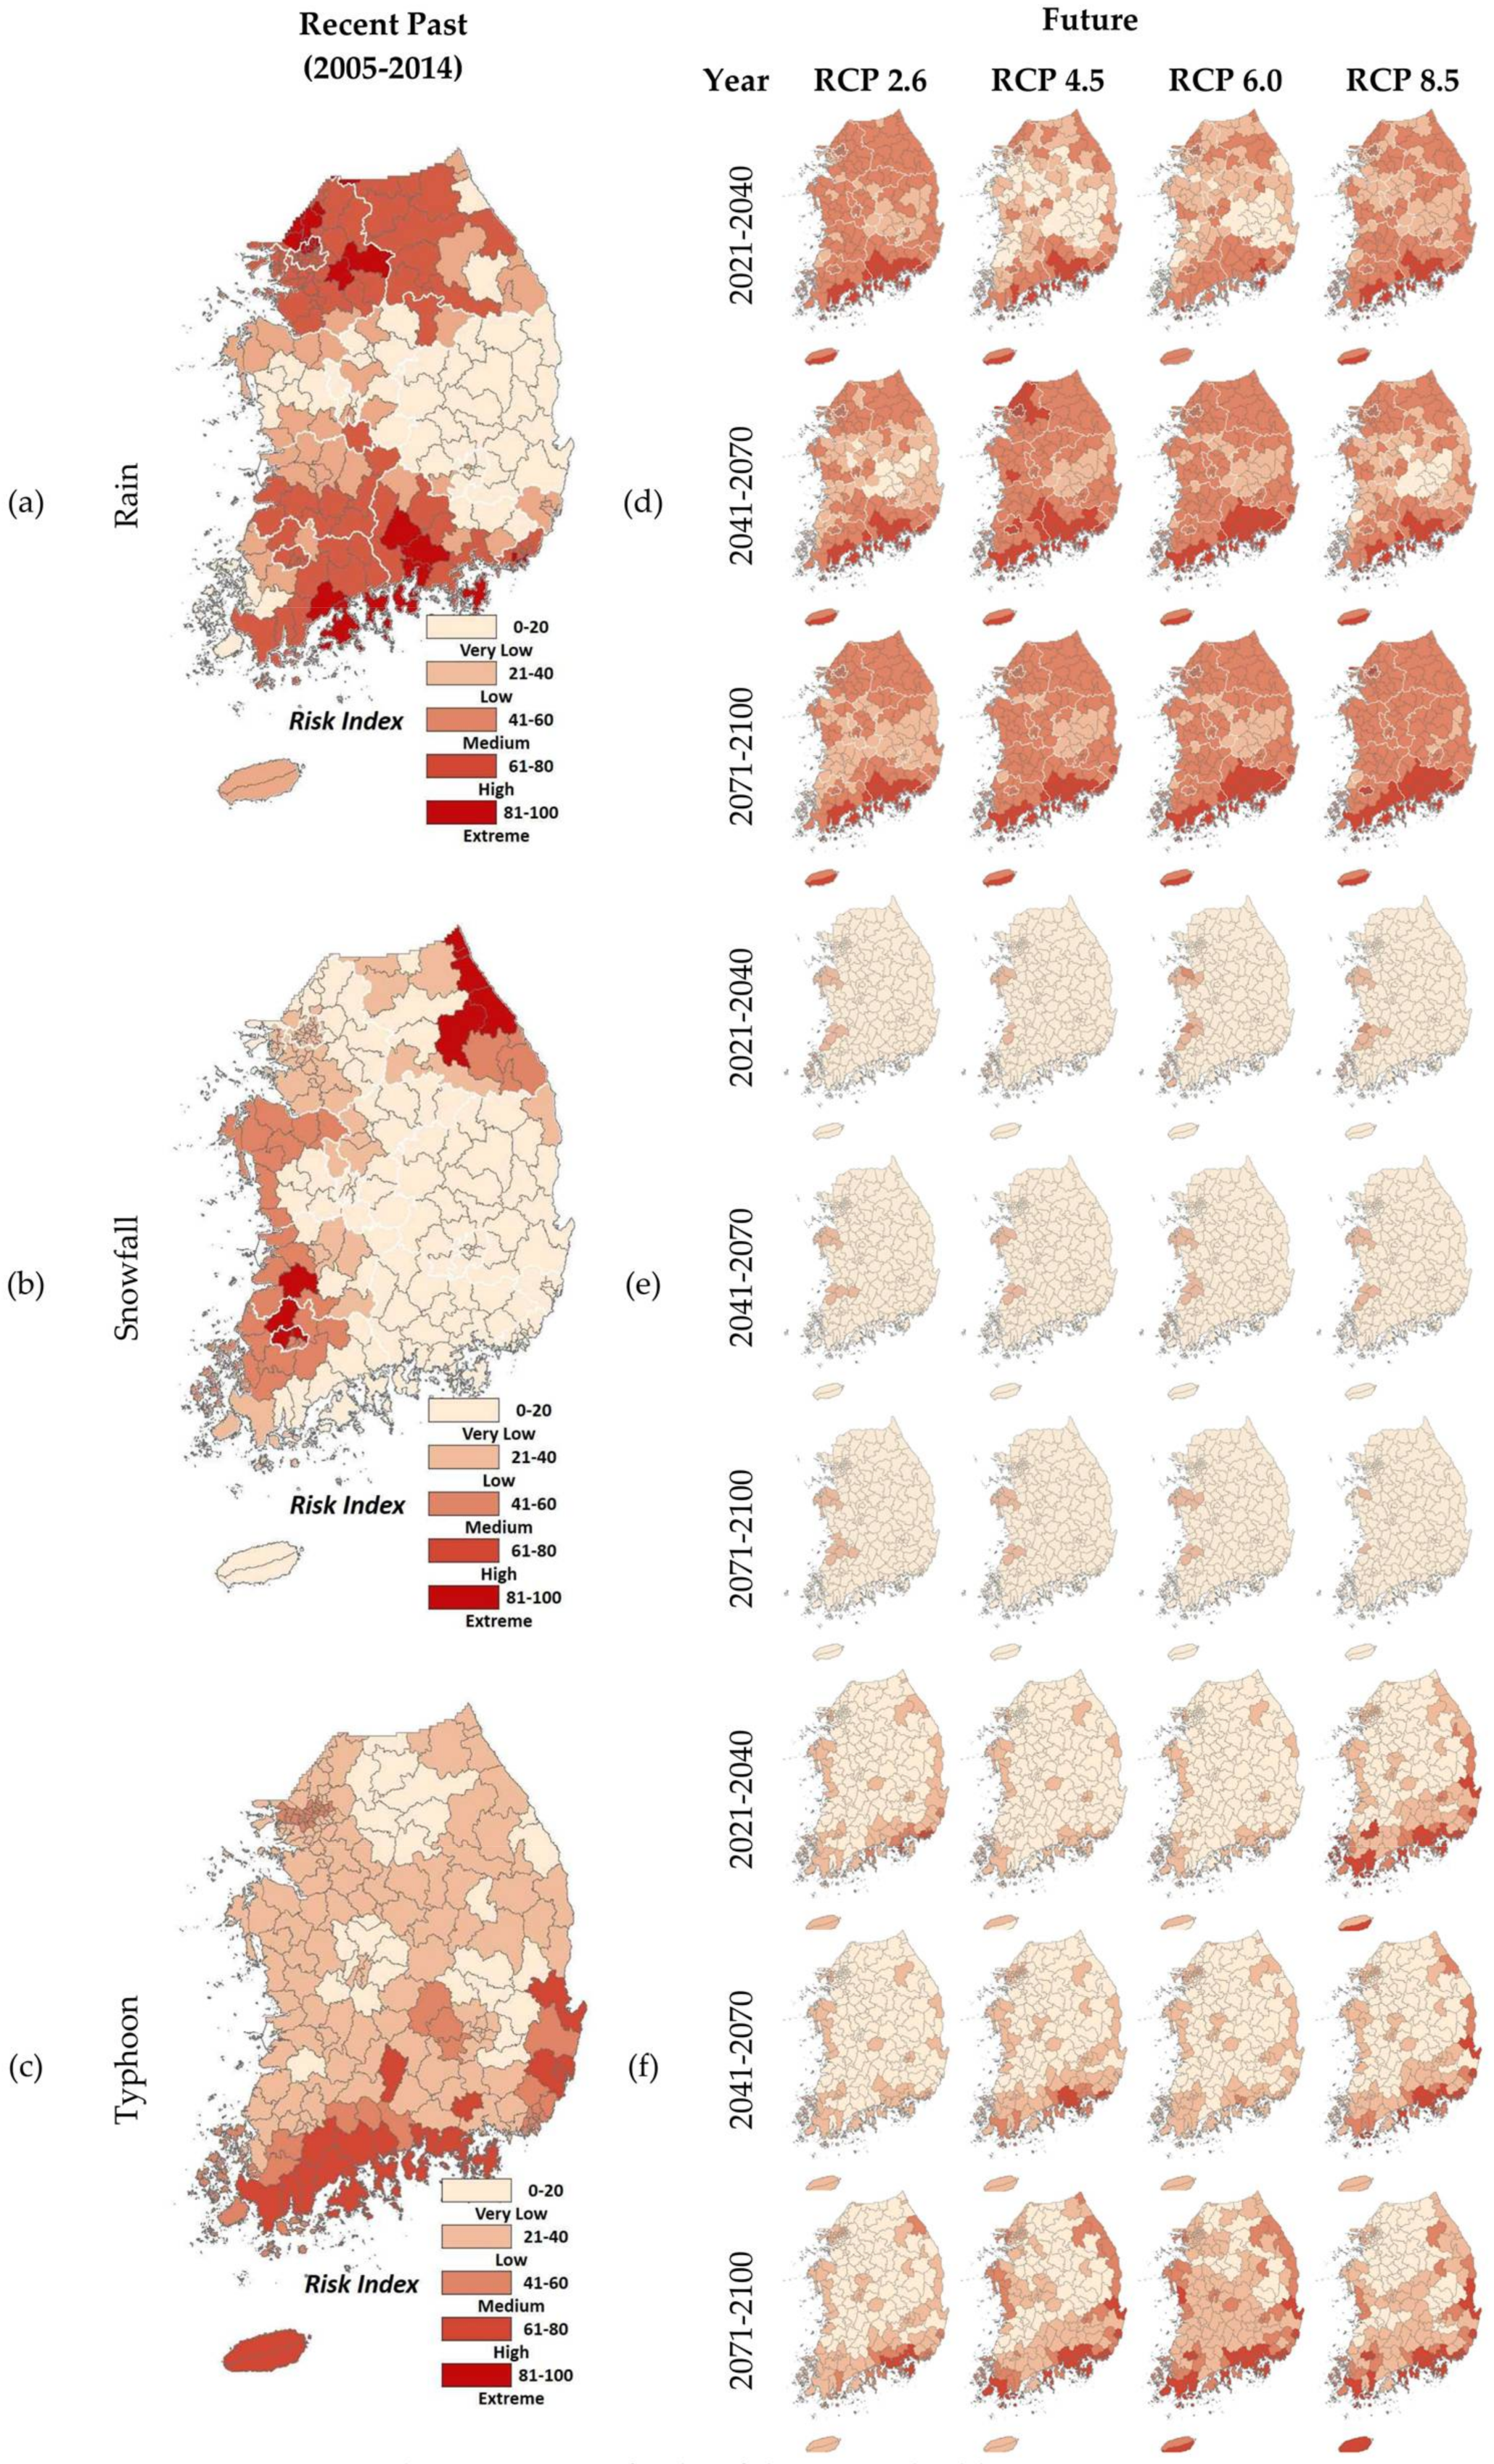
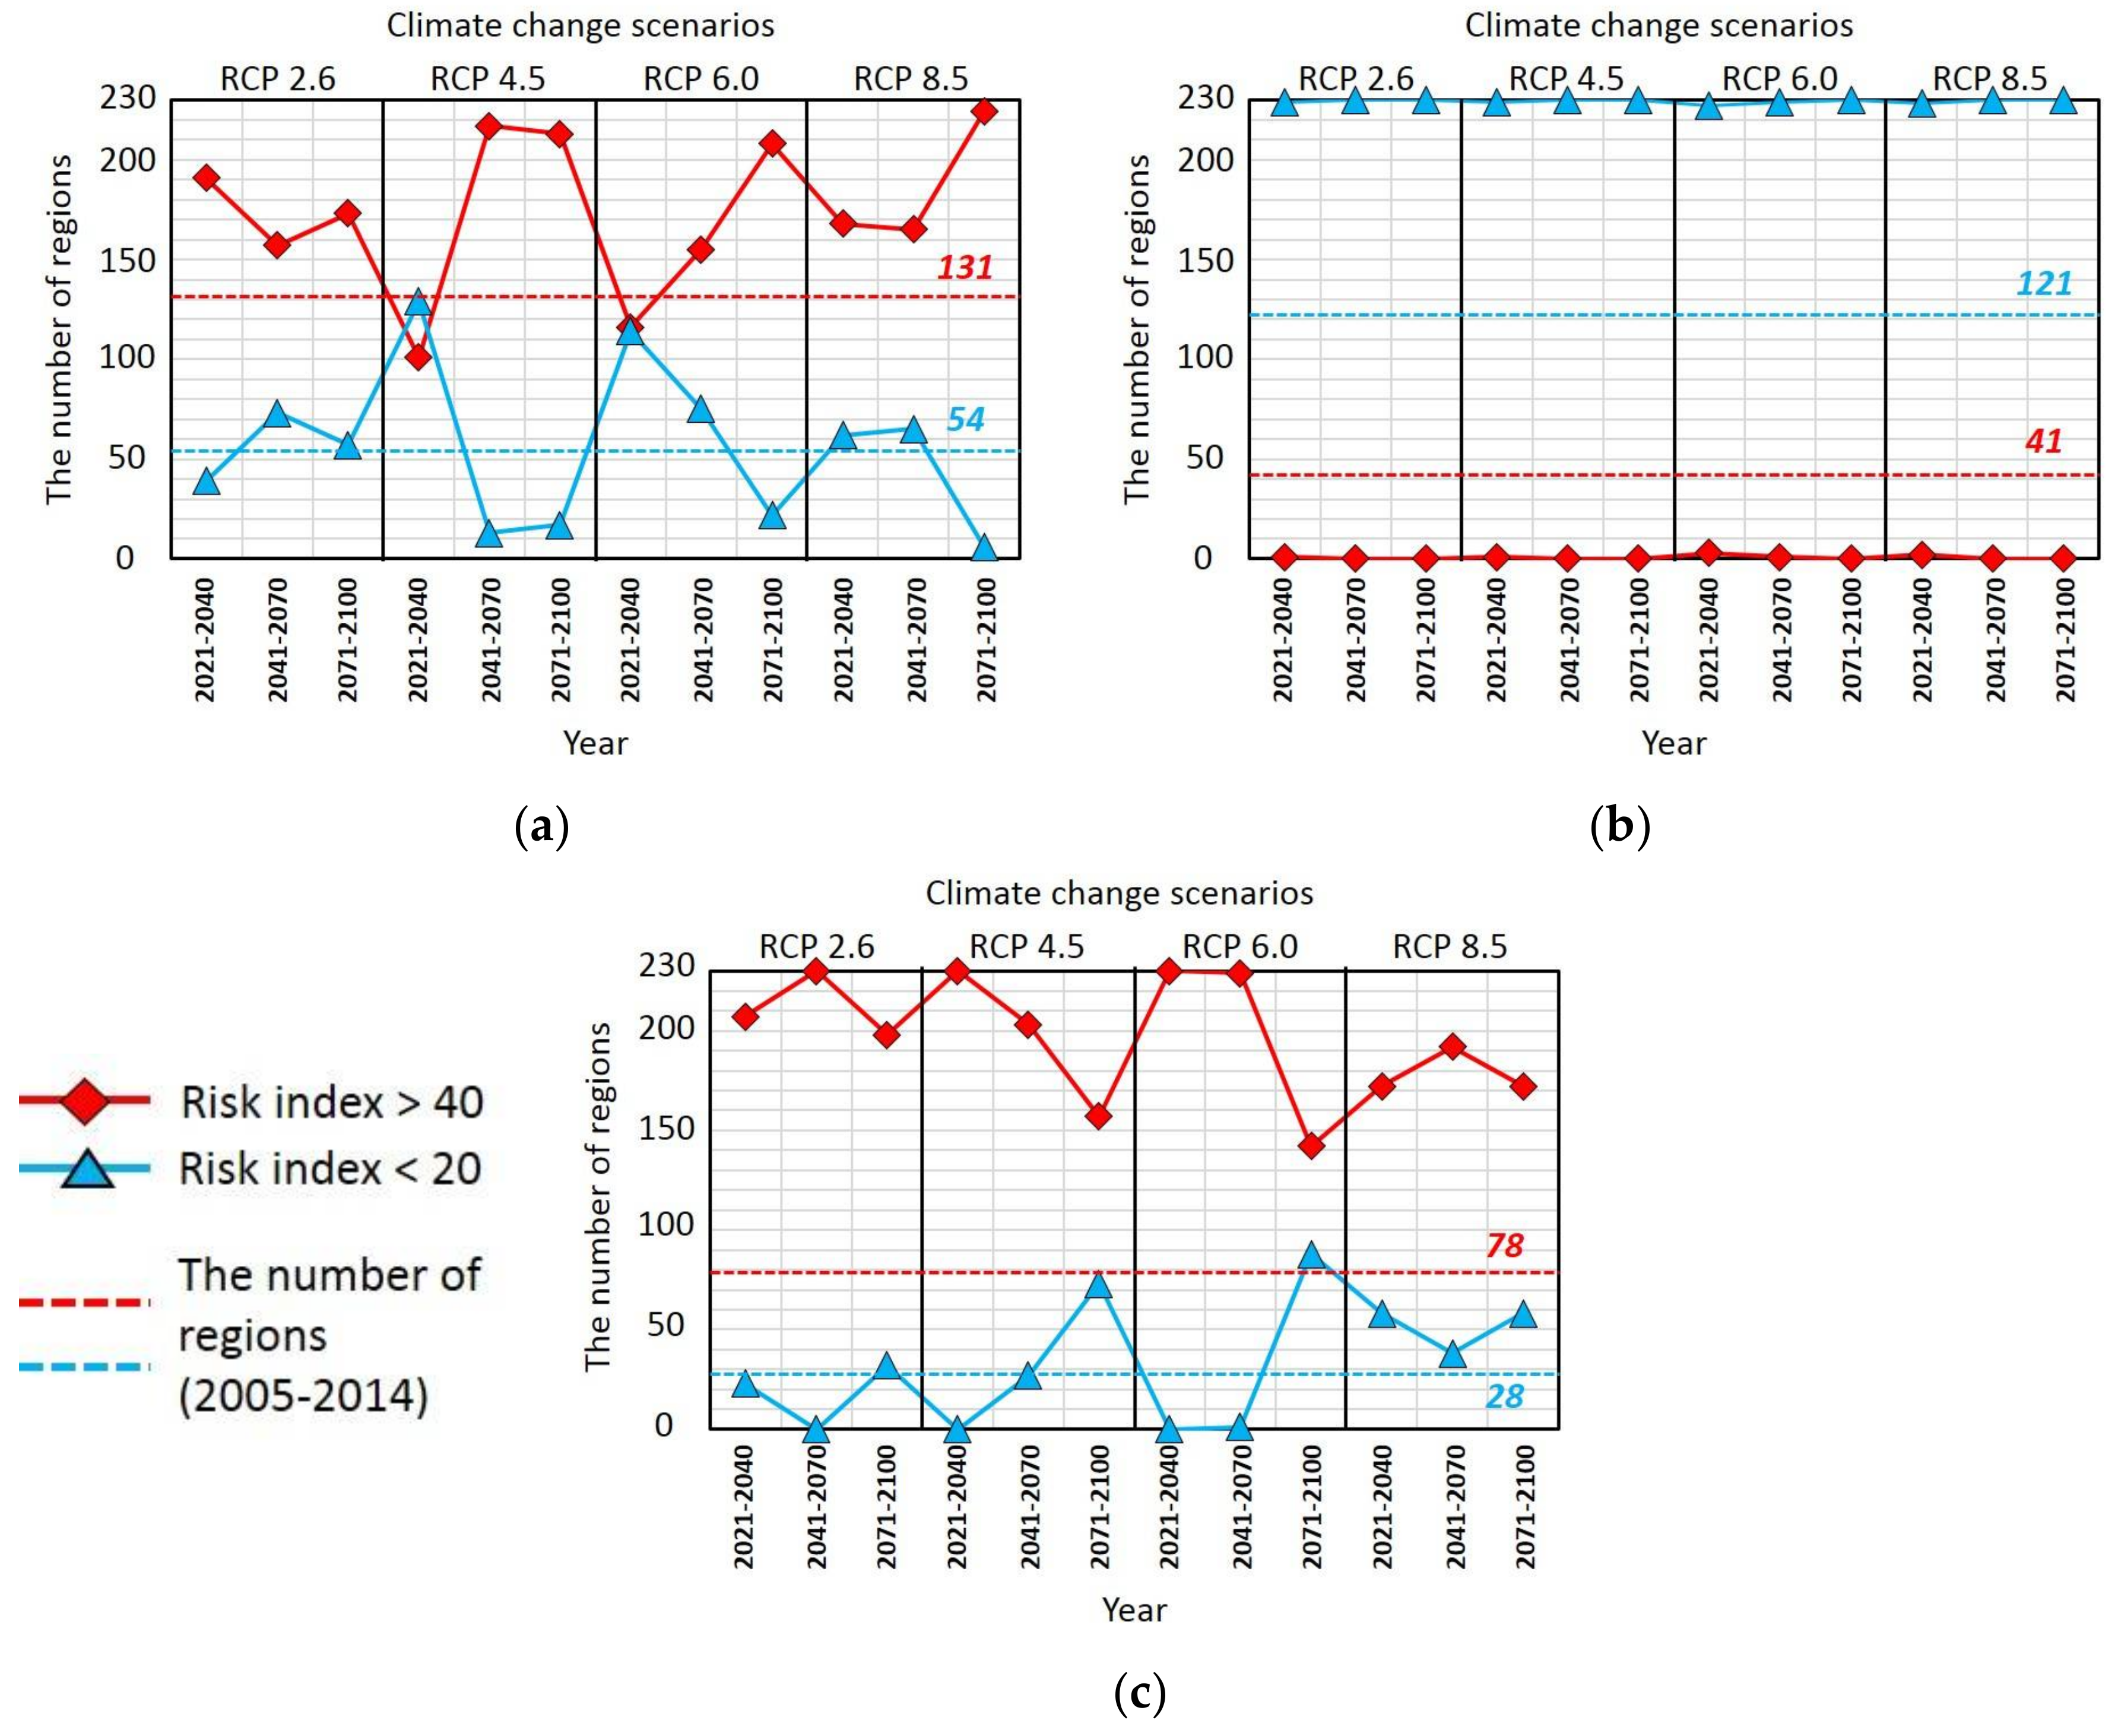
3.3.2. Predictions of Future Risk of Building Damage
4. Discussion
5. Conclusions
Acknowledgments
Author Contributions
Conflicts of Interest
References
- Climate Change 2014—Synthesis Report; Intergovernmental Panel of Climate Change: Geneva, Switzerland, 2014; pp. 1–2.
- Hardy, J.T. Climate Change: Causes, Effects, and Solutions; Wiley: Hoboken, NJ, USA, 2003. [Google Scholar]
- Our World in Data. Available online: http://www.webcitation.org/6xvRYDjlc (accessed on 14 March 2018).
- Cimellaro, G.P. Urban Resilience for Emergency Response and Recovery; Springer: Berlin/Heidelberg, Germany, 2016. [Google Scholar]
- Laframboise, N.; Loko, B. Natural Disasters: Mitigating Impact, Managing Risks; International Monetary Fund: Washington, DC, USA, 2012. [Google Scholar]
- Annual Disaster Statistical Review 2016; Centre for Research on the Epidemiology of Disasters (CRED): Brussels, Belgium, 2017; pp. 1–80.
- Overview of Natural Disasters and Their Impacts in Asia and the Pacific 1970–2014; Economic and Social Commission for Asia and the Pacific: Bangkok, Thailand, 2015; pp. 1–32.
- Mirza, M.M.Q. Climate change and extreme weather events: Can developing countries adapt? Clim. Policy 2003, 3, 233–248. [Google Scholar] [CrossRef]
- Disasters in Asia and the Pacific_2015 Year in Review; Economic and Social Commission for Asia and the Pacific: Bangkok, Thailand, 2015; pp. 1–21.
- Radulescu, C.V.; Ioan, I.; Andreica, M. International Mechanism for Loss and Damage Caused by Climate Change; Babes Bolyai University: Cluj-Napoca, Romania, 2016; pp. 82–85. [Google Scholar]
- Cimellaro, G.P.; Solari, D.; Bruneau, M. Physical infrastructure interdependency and regional resilience index after the 2011 tohoku earthquake in japan. Earthq. Eng. Struct. Dyn. 2014, 43, 1763–1784. [Google Scholar] [CrossRef]
- Blong, R. Residential building damage and natural perils: Australian examples and issues. Build. Res. Inf. 2004, 32, 379–390. [Google Scholar] [CrossRef]
- Bank, T.W. Building Regulation for Resilience_Managing Risks for Safer Cities; Global Facility for Disaser Reduction and Recovery; World Bank Group: Washington, DC, USA, 2016; pp. 1–136. [Google Scholar]
- Chmutina, K.; Bosher, L. Disaster risk reduction or disaster risk production: The role of building regulations in mainstreaming drr. Int. J. Disaster Risk Reduct. 2015, 13, 10–19. [Google Scholar] [CrossRef]
- Chandler, A.M.; Jones, E.J.W.; Patel, M.H. Property loss estimation for wind and earthquake perils. Risk Anal. Int. J. 2001, 21, 235–250. [Google Scholar] [CrossRef]
- Konukcu, B.; Karaman, H.; Şahin, M. Building damage analysis for the updated building dataset of istanbul. Nat. Hazards 2016, 84, 1981–2007. [Google Scholar] [CrossRef]
- Yazdani, N.; Dowgul, R.W.; Manzur, T. Deficiency analysis of coastal buildings toward storm damage reduction. J. Perform. Constr. Facil. 2010, 24, 128–137. [Google Scholar] [CrossRef]
- Luo, J.; Liang, D.; Weiss, C. Reconstruction of a near-surface tornado wind field from observed building damage. Wind Struct. 2015, 20, 389–404. [Google Scholar] [CrossRef]
- Pita, G.; Pinelli, J.P.; Cocke, S.; Gurley, K.; Mitrani-Reiser, J.; Weekes, J.; Hamid, S. Assessment of hurricane-induced internal damage to low-rise buildings in the florida public hurricane loss model. J. Wind Eng. Ind. Aerodyn. 2012, 104–106, 76–87. [Google Scholar] [CrossRef]
- Atillah, A.; El Hadani, D.; Moudni, H.; Lesne, O.; Renou, C.; Mangin, A.; Rouffi, F.; Didenkulova, I.; Dominey-Howes, D.; Papathoma-Koehle, M.; et al. Tsunami vulnerability and damage assessment in the coastal area of rabat and salé, morocco. Nat. Hazards Earth Syst. Sci. 2011, 11, 3397–3414. [Google Scholar] [CrossRef]
- Cole, S.W.; Xu, Y.; Burton, P.W. Seismic hazard and risk in shanghai and estimation of expected building damage. Soil Dyn. Earthq. Eng. 2008, 28, 778–794. [Google Scholar] [CrossRef]
- Cimellaro, G.P.; Reinhorn, A.M. Multidimensional performance limit state for hazard fragility functions. J. Eng. Mech. 2011, 137, 47–60. [Google Scholar] [CrossRef]
- Nadal, N.C.; Zapata, R.E.; Pagán, I.; López, R.; Agudelo, J. Building damage due to riverine and coastal floods. J. Water Resour. Plan. Manag. 2010, 136, 327–336. [Google Scholar] [CrossRef]
- José María, B.; Carolina, G.-A.; Estefanía, A.-J.; Miguel Ángel, E.; María Lorena, M.-C. Flood damage analysis: First floor elevation uncertainty resulting from lidar-derived digital surface models. Remote Sens. 2016, 8, 604. [Google Scholar]
- Unnikrishnan, V.U.; Barbato, M. Performance-based comparison of different storm mitigation techniques for residential buildings. J. Struct. Eng. 2016, 142, 04016011. [Google Scholar] [CrossRef]
- Goswami, S.; Chakraborty, S.; Ghosh, S.; Chakrabarti, A.; Chakraborty, B. A review on application of data mining techniques to combat natural disasters. Ain Shams Eng. J. 2016. [Google Scholar] [CrossRef]
- Chen, S.; Wang, Y.; Tsou, I. Using artificial neural network approach for modelling rainfall-runoff due to typhoon. J. Earth Syst. Sci. 2013, 122, 399–405. [Google Scholar] [CrossRef]
- Radhika, S.; Tamura, Y.; Matsui, M. Cyclone damage detection on building structures from pre- and post-satellite images using wavelet based pattern recognition. J. Wind Eng. Ind. Aerodyn. 2015, 136, 23–33. [Google Scholar] [CrossRef]
- Fawzy, D.E.; Arslan, G. Development of building damage functions for big earthquakes in turkey. Procedia Soc. Behav. Sci. 2015, 195, 2290–2297. [Google Scholar] [CrossRef][Green Version]
- Tehrany, M.S.; Pradhan, B.; Jebur, M.N. Flood susceptibility mapping using a novel ensemble weights-of-evidence and support vector machine models in gis. J. Hydrol. 2014, 512, 332–343. [Google Scholar] [CrossRef]
- Liu, Y.; Li, L.; Chen, Q.; Shu, M.; Zhang, Z.; Liu, X. Building Damage Assessment of Compact Polarimetric Sar Using Statistical Model Texture Parameter. In Proceedings of the SAR in Big Data Era: Models, Methods and Applications (BIGSARDATA), Beijing, China, 13–14 November 2017; IEEE: Piscataway, NJ, USA, 2017; pp. 1–4. [Google Scholar]
- Reese, S.; Bradley, B.A.; Bind, J.; Smart, G.; Power, W.; Sturman, J. Empirical building fragilities from observed damage in the 2009 south pacific tsunami. Earth-Sci. Rev. 2011, 107, 156–173. [Google Scholar] [CrossRef]
- Easterling, D.R.; Meehl, G.A.; Parmesan, C.; Changnon, S.A.; Karl, T.R.; Mearns, L.O. Climate extremes: Observations, modeling, and impacts. Science 2000, 289, 2068–2074. [Google Scholar] [CrossRef] [PubMed]
- Spekkers, M.H.; Clemens, F.H.L.R.; Veldhuis, J.A.E.T. On the occurrence of rainstorm damage based on home insurance and weather data. Nat. Hazards Earth Syst. Sci. 2015, 15, 261–272. [Google Scholar] [CrossRef]
- Tamura, H.; Yamamoto, K.; Tomiyama, S.; Hatono, I. Modeling and analysis of decision making problem for mitigating natural disaster risks. Eur. J. Oper. Res. 2000, 122, 461–468. [Google Scholar] [CrossRef]
- Ragettli, S.; Zhou, J.; Wang, H.; Liu, C.; Guo, L. Research papers: Modeling flash floods in ungauged mountain catchments of china: A decision tree learning approach for parameter regionalization. J. Hydrol. 2017, 555, 330–346. [Google Scholar] [CrossRef]
- Wang, Z.; Lai, C.; Chen, X.; Yang, B.; Zhao, S.; Bai, X. Flood hazard risk assessment model based on random forest. J. Hydrol. 2015, 527, 1130–1141. [Google Scholar] [CrossRef]
- Quanlong, F.; Jianhua, G.; Jiantao, L.; Yi, L. Flood mapping based on multiple endmember spectral mixture analysis and random forest classifier—The case of yuyao, China. Remote Sens. 2015, 7, 12539–12562. [Google Scholar]
- Yan-yan, S.; Ying, L.U. Decision tree methods: Applications for classification and prediction. Shanghai Arch. Psychiatry 2015, 27, 130–135. [Google Scholar]
- Friedl, M.A.; Brodley, C.E. Decision tree classification of land cover from remotely sensed data. Remote Sens. Environ. 1997, 61, 399–409. [Google Scholar] [CrossRef]
- Chiang, D.A.; Chen, W.; Wang, Y.F.; Hwang, L.J. Rules generation from the decision tree. J. Inf. Sci. Eng. 2001, 17, 325–340. [Google Scholar]
- Kim, K.-J.; Seo, J.-B.; Yoon, S.-H. Analysis and prediction of urban thermal environment using rcp scenarios. J. Reg. Assoc. Archit. Inst. Korea 2017, 19, 107–114. [Google Scholar]
- Prasad, N.; Patro, K.R.; Naidu, M.M. A Gini Index Based Elegant Decision Tree Classifier to Predict Precipitation; IEEE: Piscataway, NJ, USA, 2013; pp. 46–54. [Google Scholar]
- Gislason, P.O.; Benediktsson, J.A.; Sveinsson, J.R. Random forests for land cover classification. Pattern Recognit. Lett. 2006, 27, 294–300. [Google Scholar] [CrossRef]
- Quanlong, F.; Jiantao, L.; Jianhua, G. Urban flood mapping based on unmanned aerial vehicle remote sensing and random forest classifier—A case of yuyao, China. Water 2015, 7, 1437–1455. [Google Scholar]
- Lai, C.; Shao, Q.; Chen, X.; Wang, Z.; Zhou, X.; Yang, B.; Zhang, L. Flood risk zoning using a rule mining based on ant colony algorithm. J. Hydrol. 2016, 542, 268–280. [Google Scholar] [CrossRef]
- Kim, G.; Cha, D.; Lee, G.; Jin, C.; Lee, D.; Suh, M.; Ahn, J.; Min, S.; Hong, S.; Kang, H. Impact of horizontal resolution on precipitation simulation over south korea with multi regional climate models. J. Clim. Res. 2016, 11, 169–181. [Google Scholar] [CrossRef]
- Arnell, N.W.; Hudson, D.A.; Jones, R.G. Climate change scenarios from a regional climate model: Estimating change in runoff in southern africa. J. Geophys. Res. Atmos. 2003, 108. [Google Scholar] [CrossRef]
- Kim, J.; Kim, T.; Lee, B. An analysis of typhoon damage pattern type and development of typhoon damage forecasting function. Korean Soc. Hazard Mitig. 2017, 17, 339–347. [Google Scholar] [CrossRef]
- A Study on Enhancing the Community Capacity for Hazard Mitigation in Climate Change; Ministry of the Interior and Safety: Seoul, Korea, 2017.
- Suh, M.S.; Oh, S.G.; Lee, D.K.; Cha, D.H.; Choi, S.J.; Jin, C.S.; Hong, S.Y. Development of new ensemble methods based on the performance skills of regional climate models over south korea. J. Clim. 2012, 25, 7067–7082. [Google Scholar] [CrossRef]
- Kim, G.; Kim, J.; Kim, C.; Jin, C.; Cha, D.; Suh, M.; Park, S. Climate change projections over cordex east asia domain using multi-rcms. J. Clim. Res. 2014, 9, 257–268. [Google Scholar] [CrossRef]
- Teutschbein, C.; Seibert, J. Bias correction of regional climate model simulations for hydrological climate-change impact studies: Review and evaluation of different methods. J. Hydrol. 2012, 456–457, 12–29. [Google Scholar] [CrossRef]
- Tehrany, M.S.; Pradhan, B.; Jebur, M.N. Flood susceptibility analysis and its verification using a novel ensemble support vector machine and frequency ratio method. Stoch. Environ. Res. Risk Assess. 2015, 29, 1149–1165. [Google Scholar] [CrossRef]
- Heiser, M.; Scheidl, C.; Eisl, J.; Spangl, B.; Hübl, J. Process type identification in torrential catchments in the eastern alps. Geomorphology 2015, 232, 239–247. [Google Scholar] [CrossRef]
- Tehrany, M.S.; Pradhan, B.; Jebur, M.N. Spatial prediction of flood susceptible areas using rule based decision tree (dt) and a novel ensemble bivariate and multivariate statistical models in gis. J. Hydrol. 2013, 504, 69–79. [Google Scholar] [CrossRef]
- Aven, T. Risk assessment and risk management: Review of recent advances on their foundation. Eur. J. Oper. Res. 2016, 253, 1–13. [Google Scholar] [CrossRef]
- Jaume, B.-S.; Montserrat, G.; Miguel, S. The use of flexible quantile-based measures in risk assessment. Commun. Stat. Theory Methods 2015, 20, 1670–1681. [Google Scholar]
- Febrianto, H.; Fariza, A.; Nur Hasim, J.A. Urban Flood Risk Mapping Using Analytic Hierarchy Process and Natural Break Classification (Case Study: Surabaya, East Java, Indonesia). In Proceedings of the International Conference on Knowledge Creation and Intelligent Computing (KCIC), Manado, Indonesia, 15–17 November 2016; IEEE: Piscataway, NJ, USA, 2016; pp. 148–154. [Google Scholar]
- Van Westen, C.J.; Van Westen, C.J. Remote Sensing and Gis for Natural Hazards Assessment and Disaster Risk Management; Elsevier Inc.: Amsterdam, The Netherlands, 2013; Volume 3, pp. 259–298. [Google Scholar]


| Weather Data | Period | Space | Data | Purpose |
|---|---|---|---|---|
| Observation weather data | 2005–2014 (10 years) | 230 regions | 33 indices | Building disaster Assessment in the Past |
| climate change scenarios (RCP 2.6, 4.5, 6.0, 8.5) | 2021–2100 (80 years) | Building disaster Prediction in the Future |
| HadGEM3-RA | RegCM4 | SNURCM | WRF | |
|---|---|---|---|---|
| Institution | Korea Meteorological Administration | Kongju National Univ. | Seoul National Univ. | Weather Research and Forecasting |
| Number of Grid (Lat. × Lon.) | 12.5 km horizontal resolution | |||
| 184 × 164 | 198 × 178 | 199 × 179 | 201 × 180 | |
| Vertical Coordination | 38 hydrid | 18 sigma | 24 sigma | 27 sigma |
| radiation | General 2-stream radiation | NCAR CCM3 | CCM2 package | RRTM and Dudhia |
| A Single Disaster Variables | |||
| Precipation | max_pr | mm∙day−1 | daily maximum precipitation |
| sum_pr | mm year−1 | accumulated precipitation | |
| sum_jjapr | mm 92 days−1 | accumulated precipitation during summer | |
| ave_gt80 | mm | average precipitation when more than 80 mm | |
| px5d | mm∙5 days−1 | greatest 5-day total rainfall | |
| days_wetday | days | days of rain | |
| pint | mm day−1 | simple daily intensity(rain per rainday) | |
| pxcdd | days | max number of consecutive dry days | |
| ave_drydays | days | average number of consecutive dry days | |
| pq90 | mm day−1 | 90th percentile of rainday amounts | |
| pnl90 | - | number of events > long term 90th percentile | |
| pfl90 | % | percent of total rainfall from events > long-term 90th percentile | |
| days_gt80 | days | number of days more than 80 mm precipitation | |
| days_gt160 | days | number of days more than 160 mm precipitation | |
| snow | ave_nsnd | cm∙day−1 | average fresh snow cover per day |
| sum_nsnd | cm day−1 | accumulated fresh snow cover per day | |
| max_nsnd | cm∙day−1 | maximum fresh snow cover | |
| days_nsnd5 | days | number of days more than 5 cm fresh snow cover | |
| days_nsnd20 | days | number of days more than 20 cm fresh snow cover | |
| days_nsnd50 | days | number of days more than 50 cm fresh snow cover | |
| temperature | days_freez | days | number of days below 0 °C |
| ave_maxtemp | °C | daily maximum temperature | |
| ave_mintemp | °C | daily minimum temperature | |
| wind speed | days_mwind14 | days | number of days more than 14 m/s maximum wind speed |
| ave_wind567 | m/s | average wind speed during May–July | |
| max_wind | m/s | maximum wind speed | |
| Complex Disaster Variables | |||
| precipitation | ©days_wetday | days | days of rain |
| ©pint | mm∙day−1 | Simple daily intensity(rain per rainday) | |
| ©max_pr | mm | daily maximum precipitation | |
| ©sum_pr | mm | accumulated precipitation | |
| gale | ©days_mwind14 | days | number of days more than 14 m/s maximum wind speed |
| ©ave_wind | mm | average wind speed | |
| ©max_wind | mm | maximum wind speed | |
| Weather Indices | Building Damage | |||
|---|---|---|---|---|
| Rain | Gale | Snowfall | Typhoon | |
| max_pr | 0.3462 ** | |||
| sum_pr | 0.2309 ** | |||
| sum_jjapr | 0.3943 ** | |||
| ave_gt80 | 0.2076 ** | |||
| px5d | 0.3393 ** | |||
| days_wetday | −0.1216 | |||
| pint | 0.2889 ** | |||
| pxcdd | 0.3728 ** | |||
| ave_drydays | −0.0041 | |||
| pq90 | 0.2778 ** | |||
| pnl90 | 0.1152 | |||
| pfl90 | 0.4005 ** | |||
| days_gt80 | 0.2076 ** | |||
| days_gt160 | 0.3640 ** | |||
| ave_nsnd | 0.2864 ** | |||
| sum_nsnd | 0.2865 ** | |||
| max_nsnd | 0.3053 ** | |||
| days_nsnd5 | 0.2925 ** | |||
| days_nsnd20 | 0.1827 ** | |||
| days_nsnd50 | 0.0215 | |||
| days_freez | 0.2864 ** | 0.402 | −0.0932 | −0.3017 ** |
| ave_maxtemp | 0.2865 ** | −0.0360 | 0.0193 | 0.1192 |
| ave_mintemp | 0.3053 ** | −0.0784 | 0.0867 | 0.3250 ** |
| days_mwind 14 | 0.0744 | |||
| ave_wind567 | −0.00.335 | |||
| max_ wind | 0.0281 | |||
| ©days_wetday | 0.0059 | |||
| ©pint | 0.2622 ** | |||
| ©max_pr | 0.2349 ** | |||
| ©sum_pr | 0.3110 ** | |||
| ©days_mwind14 | 0.5139 ** | |||
| ©ave_wind | 0.3769 ** | |||
| ©max_wind | 0.3539 ** | |||
| Class | Risk | Rain | Gale | Snowfall | Typhoon | ||||
|---|---|---|---|---|---|---|---|---|---|
| Building Damage | Number of Regions | Building Damage | Number of Regions | Building Damage | Number of Regions | Building Damage | Number of Regions | ||
| 5 | E | 0–16 | 46 | 0 | 188 | 0 | 183 | 0 | 61 |
| D | 17–49 | 46 | 1 | 29 | 1 | 17 | 1–3 | 47 | |
| C | 50–149 | 46 | 2 | 7 | 2–4 | 11 | 4–16 | 45 | |
| B | 150–403 | 46 | 3 | 3 | 5–12 | 10 | 17–82 | 39 | |
| A | 404–4993 | 46 | 4–13 | 3 | 13–84 | 9 | 83–1724 | 38 | |
| 4 | D | 0–25 | 58 | 0 | 188 | 0 | 183 | 0 | 61 |
| C | 26–99 | 59 | 1 | 29 | 1 | 17 | 1–6 | 122 | |
| B | 100–326 | 57 | 2 | 7 | 2–6 | 17 | 7–51 | 54 | |
| A | 212–4993 | 56 | 3–13 | 6 | 7–84 | 13 | 52–1724 | 54 | |
| 3 | C | 0–38 | 77 | 0 | 188 | 0 | 183 | 0–1 | 85 |
| B | 39–211 | 77 | 1 | 29 | 1–3 | 26 | 2–21 | 75 | |
| A | 212–4993 | 76 | 2–13 | 13 | 4–84 | 21 | 22–1724 | 70 | |
| 2 | B | 0–97 | 115 | 0 | 188 | 0 | 183 | 0–5 | 115 |
| A | 98–4993. | 115 | 1–13 | 42 | 1–84 | 47 | 6–1724 | 115 | |
| Disaster | Decision Tree Model | Class | Accuracy | Error | Graph of Misclass |
|---|---|---|---|---|---|
| Rain | Input Variables | day_gt80, day_gt160, pq90, px5d, pint, pxcdd, pfl90, ave_Gt80, max_pr, sum_pr, sum_jjapr, days_freez, ave_maxtemp | |||
| Model R-1 | 2 | 0.65 ** | 26.5 |  | |
| Model R-2 | 3 | 0.56 ** | 39.6 | ||
| Model R-3 | 4 | 0.52 ** | 53.4 | ||
| Model R-4 | 5 | 0.29 | 31.3 | ||
| Snowfall | Input Variables | days_nsnd5, days_nsnd20, ave_nsnd, sum_nsnd, max_nsnd | |||
| Model S-1 | 2 | 0.85 | 17.4 |  | |
| Model S-2 | 3 | 0.79 | 22.6 | ||
| Model S-3 | 4 | 0.81 | 22.6 | ||
| Model S-4 | 5 | 0.78 | 23.0 | ||
| Typhoon | Input Variables | ©pint, ©max_pr, ©sum_pr, ©days_mgale_14, ©ave_gale, ©max_gale, days_freez, ave_mintemp | |||
| Model T-1 | 2 | 0.71 ** | 33.0 |  | |
| Model T-2 | 3 | 0.55 ** | 50.0 | ||
| Model T-3 | 4 | 0.46 ** | 58.3 | ||
| Model T-4 | 5 | 0.36 ** | 60.9 | ||
| Rain Damage Model (Model R-1) | |||
|---|---|---|---|
| Variables | Weight (a) | Limit Value (b) | Mean Decrease in Accuracy & Gini Impurity |
| ave_gt80 | 16.03 | 97.56 mm |  |
| sum_pr | 14.09 | 1344.90 mm | |
| sum_jjapr | 12.80 | 961.10 mm | |
| px5d | 12.30 | 217.38 mm | |
| max_pr | 12.19 | 104.83 mm | |
| pfl90 | 11.22 | 0.43% | |
| pint | 10.48 | 17.01 mm | |
| ave_maxtemp | 9.98 | 29.10 °C | |
| days_gt160 | 9.21 | 0.35 days | |
| days_gt80 | 6.32 | 2.00 days | |
| Snowfall Damage Model (Model S-1) | |||
| sum_nsnd | 26.20 | 69.7 cm |  |
| ave_nsnd | 24.06 | 0.12 cm | |
| max_nsnd | 18.98 | 7.15 cm | |
| days_nsnd5 | 18.68 | 0.25 days | |
| Typhoon Damage Model (Model T-1) | |||
| ©sum_pr | 19.56 | 118.01 mm |  |
| ©max_wind | 17.22 | 7.29 m/s | |
| ©ave_mintemp | 12.81 | 28.12 °C | |
| ©days_freez | 12.72 | 54.05 days | |
| ©max_pr | 12.12 | 86.59 mm | |
| ©ave_wind | 12.04 | 5.25 m/s | |
© 2018 by the authors. Licensee MDPI, Basel, Switzerland. This article is an open access article distributed under the terms and conditions of the Creative Commons Attribution (CC BY) license (http://creativecommons.org/licenses/by/4.0/).
Share and Cite
Kim, K.; Yoon, S. Assessment of Building Damage Risk by Natural Disasters in South Korea Using Decision Tree Analysis. Sustainability 2018, 10, 1072. https://doi.org/10.3390/su10041072
Kim K, Yoon S. Assessment of Building Damage Risk by Natural Disasters in South Korea Using Decision Tree Analysis. Sustainability. 2018; 10(4):1072. https://doi.org/10.3390/su10041072
Chicago/Turabian StyleKim, KeumJi, and SeongHwan Yoon. 2018. "Assessment of Building Damage Risk by Natural Disasters in South Korea Using Decision Tree Analysis" Sustainability 10, no. 4: 1072. https://doi.org/10.3390/su10041072
APA StyleKim, K., & Yoon, S. (2018). Assessment of Building Damage Risk by Natural Disasters in South Korea Using Decision Tree Analysis. Sustainability, 10(4), 1072. https://doi.org/10.3390/su10041072