Article

Long-Term Impacts of China’s New Commercial Harvest Exclusion Policy on Ecosystem Services and Biodiversity in the Temperate Forests of Northeast China

1
School of Geographical Sciences, Northeast Normal University, Changchun 130024, China
2
Northeast Institute of Geography and Agroecology, Chinese Academy of Sciences, Changchun 130102, China
3
CAS Key Laboratory of Forest and Soil Ecology, Institute of Applied Ecology, Chinese Academy of Sciences, Shenyang 110016, China
4
School of Natural Resources, University of Missouri, Columbia, MO 65211, USA
5
Key Lab of Land Resources Evaluation and Monitoring in Southwest China, Ministry of Education, Sichuan Normal University, Chengdu 610066, China
*
Authors to whom correspondence should be addressed.
Sustainability 2018, 10(4), 1071; https://doi.org/10.3390/su10041071
Submission received: 18 January 2018 / Revised: 18 March 2018 / Accepted: 19 March 2018 / Published: 4 April 2018

Abstract

:
Temperate forests in Northeast China have been severely exploited by timber harvesting in the last century. To reverse this trend, China implemented the Classified Forest Management policy in the Natural Forest Conservation Program in 1998 to protect forests from excessive harvesting. However, the policy was unable to meet the 2020 commitment of increasing growing stock (set in the Kyoto Protocol) because of high-intensity harvesting. Accordingly, China banned all commercial harvesting in Northeast China in 2014. In this study, we investigated the long-term impacts of the no commercial harvest (NCH) policy on ecosystem services and biodiversity using a forest landscape model, LANDIS PRO 7.0, in the temperate forests of the Small Khingan Mountains, Northeast China. We designed three management scenarios: The H scenario (the Classified Forest Management policy used in the past), the NCH scenario (the current Commercial Harvest Exclusion policy), and the LT scenario (mitigation management, i.e., light thinning). We compared total aboveground forest biomass, biomass by tree species, abundance of old-growth forests, and diversity of tree species and age class in three scenarios from 2010 to 2100. We found that compared with the H scenario, the NCH scenario increased aboveground forest biomass, abundance of old-growth forests, and biomass of most timber species over time; however, it decreased the biomass of rare and protected tree species and biodiversity. We found that the LT scenario increased the biomass of rare and protected tree species and biodiversity in comparison with the NCH scenario, while it maintained aboveground forest biomass and abundance of old-growth forests at a high level (slightly less than the NCH scenario). We concluded there was trade-off between carbon storage and biodiversity. We also concluded that light thinning treatment was able to regulate the trade-off and alleviate the negative effects associated with the NCH policy. Our results highlighted limitations of the NCH policy and provided new insights into sustainable forest management and the interdependence between human society and the forest ecosystem.

1. Introduction

Forests provide many ecosystem services that benefit the population, such as carbon storage and timber. Forests are managed with multiple objectives, such as carbon storage, timber harvesting, and biodiversity conservation [1,2,3]. However, these goals are often conflicting [4,5]. A recent study showed that there was trade-off between mitigation (high carbon storage) and adaptation (high biodiversity) strategies for climate change [6].
Forest management is the process of reducing the undesirable impacts of forest disturbances or increasing the output of desirable forest products, amenities, and ecosystem services [7]. In the past, timber production was the main purpose of forest management in some countries and regions [8,9,10]. In some cases, forest management policies brought severe ecological consequences, such as forest degradation, carbon storage loss, and biodiversity loss, which resulted in a decrease in ecosystem services [11]. It is necessary to restore the forest ecosystem to enhance the provision of ecosystem services. A suite of ecological and human factors should be considered in an assessment of framework before selecting a restoration approach. Then, the manager should choose the best restoration method based on the assessment [12,13,14]. Ecological restoration has been widely used to reverse the environmental degradation caused by human activities [15]. A recent study also showed that landscape-scale conservation management increased the provision of ecosystem services [16].
In the late 1990s, China shifted the primary purpose of forest management from timber production to forest sustainability, and thus ecological restoration and protection became a focus of management. The Natural Forest Conservation Program was enacted in 1998 to promote natural forest resource rehabilitation and recovery, sustain natural forests, and maintain healthy forest industries. The program adopted the Classified Forest Management (H) policy that divided forests into two types: those that are completely protected, and those for commercial harvest, to ensure the supply of wood while improving carbon storage and biodiversity [17]. Recent studies showed that the program promoted natural forest resource rehabilitation and recovery [18,19,20]. China was committed to increasing the national forest area by 40 million hectares and increasing forest growing stock by 1.3 billion cubic meters by 2020, in accordance with the Kyoto Protocol [9]. However, commercial harvest goals in the Classified Forest Management policy contradicted the high commitment of increasing growing stock. Accordingly, China implemented the Commercial Harvest Exclusion (NCH) policy in 2014 to increase forest stock in Northeast China [21]. While the NCH policy may maximize the increase of aboveground forest carbon, it may also result in some potential negative consequences [22]. For instance, Brandt [23] found that protected areas effectively conserved old-growth forests, but there were negative impacts on secondary pine forests, which consequently decreased biodiversity. Recent study also showed that banning commercial harvest had a negative effect on rare and protected species [24]. Given such potential negative impacts, a mitigation strategy needed to be developed and evaluated.
In this study, we investigated the effects of the NCH policy on ecosystem services and biodiversity over the 21st century on temperate forests of Northeast China. Specifically, we intended to determine: (i) how the NCH policy would affect forest ecosystem services as represented by forest carbon storage and abundance of old growth forests; (ii) how the NCH policy would affect biodiversity as represented by tree species diversity and age-class diversity; and (iii) whether additional thinning would effectively mitigate the negative effects associated with the NCH policy.
Assessing the long-term impacts of forest management is challenging, because it involves processes and factors that operate at multiple spatial scales across a long time span. First, forest composition and structure are affected by processes operating at multiple scales [25,26,27]. Species establishment, growth, mortality, and competition affect forest dynamics at the site scale. Meanwhile, disturbances (e.g., fire and harvest) result in landscape heterogeneity and affect forest dynamics at the landscape scale [28]. Second, forest management has lasting and cumulative effects, which will lead to changes in forest composition and stand structure [3,23,29]. Traditional field trials or direct observations have limited capacity to evaluate long-term and large-scale effects of forest management. Thus, spatially explicit forest landscape models become important to investigate these long-term and landscape-scale effects because they simulate forest changes incorporating site- and landscape-scale processes [30,31,32]. Using forest landscape models, it is possible to evaluate the impacts of forest management policy on ecosystem services and biodiversity over large spatial areas and a long time frame. Our study falls within the broad scope of social ecology, as forest management policy has long-lasting impacts on ecosystem services, which ultimately affect human well-being [33,34]. Results from this study will provide new insight into the interdependence between human society and forest ecosystems.

2. Materials and Methods
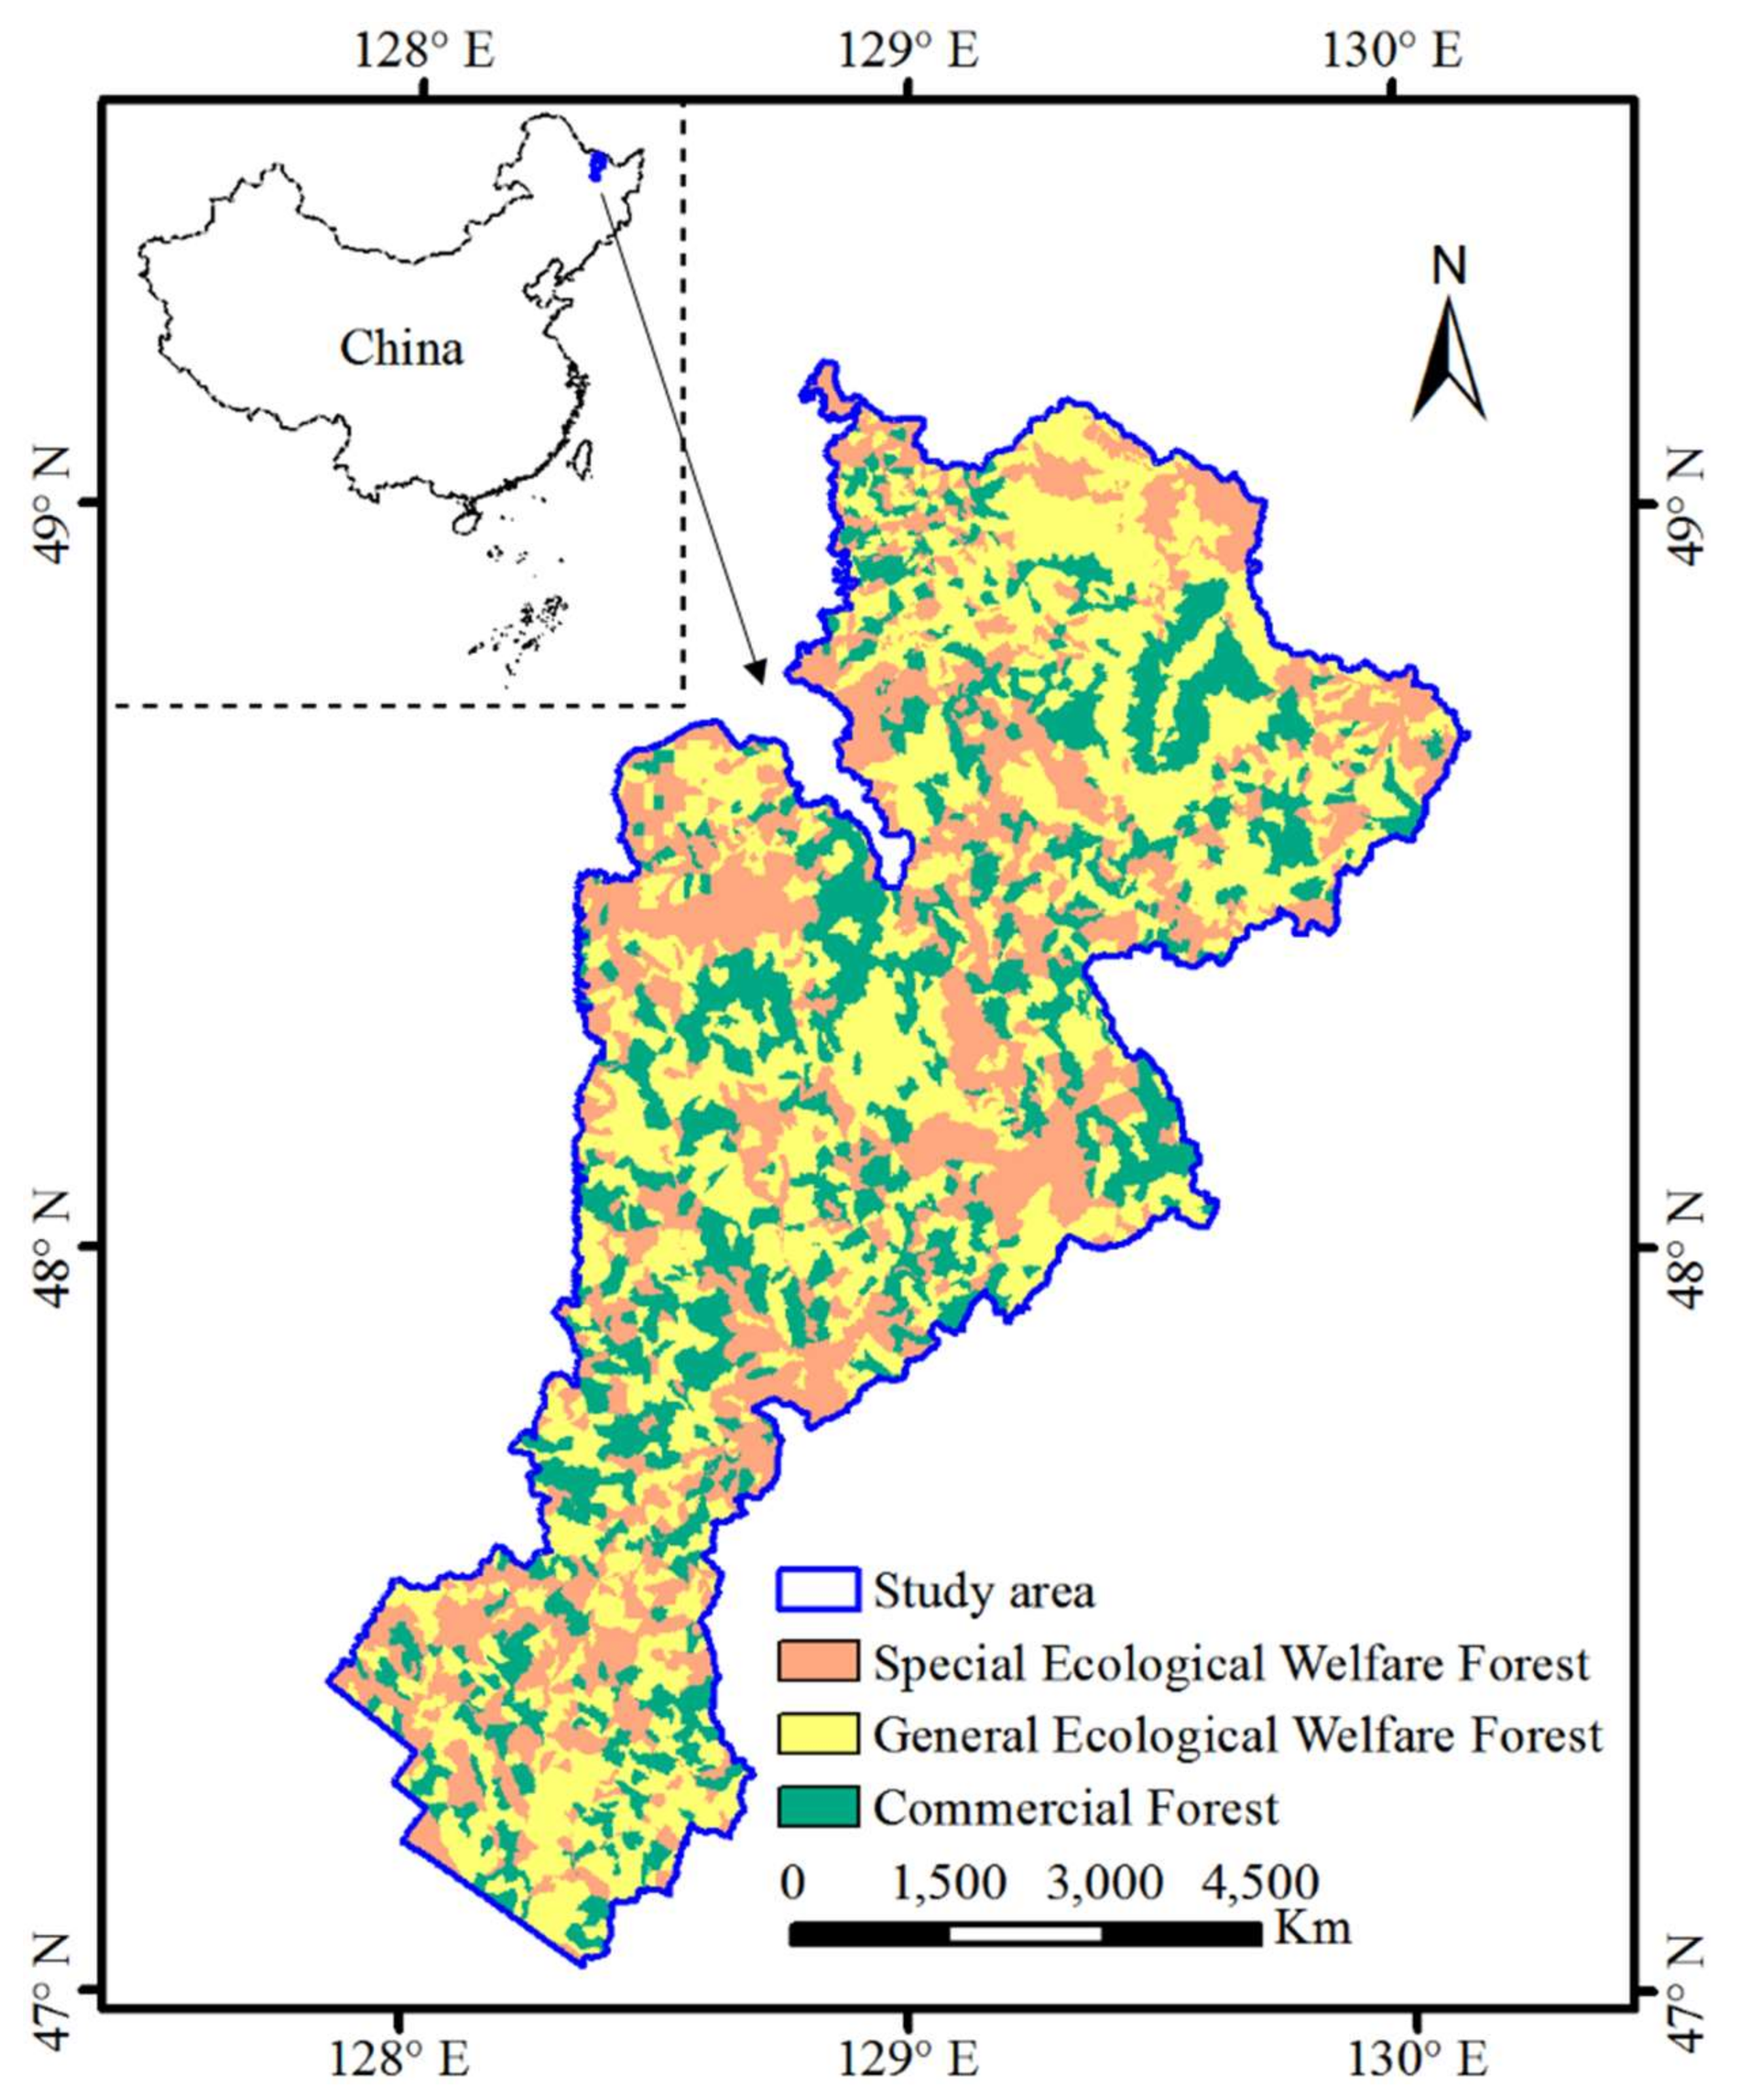
2.1. Study Area

Our study area is located in the Small Khingan Mountains in Northeastern China (47°05′–49°10′ N, 127°50′–130°10′ E), covering about 1.5 million hectares (Figure 1) and ranging in elevation from 139 m to 1429 m above sea level. The climate is temperate continental monsoon with long cold winters (mean January temperature −25 °C) and short humid summers (mean July temperature 21 °C) [35]. The mean annual precipitation increases from 485 mm in the north to 694 mm in the south, occurring mostly in summer. The dominant soil is Haplic Luvisols in this area, and Mollic Gleysols, Gleyic Phaeozems, Gleyic Luvisols, and Haplic Phaeozems soils are slightly distributed. The Small Khingan Mountains contain coniferous forests in the north, mixed coniferous-hardwood forests in the central area, and hardwood forests in the south. The most common tree species are included in Table 1. Korean pine is the regionally dominant species, while spruce and Khingan fir are dominant only in high elevation areas. Four representative communities are present in this area: mixed Korean pine hardwood forests, spruce-fir forests, mixed larch hardwood forests, and aspen-white birch forests.
The dominant clear-cutting evidently reduced forest stock and changed forest composition prior to the 1980s. The Natural Forest Conservation Program adopted the Classified Forest Management policy and regulated rare and protected tree species in 1998 [9]. The Classified Forest Management policy divided forests into two categories: Ecological Welfare Forest (including Special and General Ecological Welfare Forest) and Commercial Forest [9,36]. The Ecological Welfare Forest category was established to protect forest ecological functions, and the Commercial Forest category identified sources of forest products. We divided forests into three forest categories based on forest stand map which provided criteria for classification. Korean pine, Manchurian ash, Manchurian walnut, Amur cork tree, and Amur linden were the rare and protected tree species, and they were prohibited for timber harvesting. Korean spruce, Khingan fir, larch, Mongolian oak, black elm, mono maple, ribbed birch, Dahur birch, and white birch were timber species. Commercial harvest (thinning from above) of forests in this area is now entirely forbidden, while tending (thinning from below) still exists. Harvest was the dominant disturbance that affected forest dynamics. Fire was not a common disturbance in mixed hardwood and coniferous forests in this study area, especially under extensive fire suppression. Therefore, we did not consider fire. Additionally, we also did not consider windthrow or insect outbreaks. Because of historically extensive timber harvesting, white birch and poplar (pioneer species) were widely distributed, and their ages representatively ranged from 40 to 50 years.

2.2. Experimental Design

We designed three forest management scenarios: the H scenario, the NCH scenario, and the LT scenario (mitigation management, i.e., light thinning), which we designed to mitigate the potential negative effects associated with the NCH policy (Table 2). We compared the different outcomes between the H scenario and the NCH scenario to evaluate whether the NCH policy would achieve its goal of increasing carbon storage, and to identify the potential negative consequences of the NCH policy on biodiversity. We compared the LT scenario and the NCH scenario to explore whether the additional thinning treatment we designed through using thinning from below could alleviate the negative consequences associated with the NCH policy. We classified the forest age classes into young (0–40 years), middle-aged (40–60 years), near-mature (60–80 years), mature (80–120 years), and old-growth (>120 years) based on the Regulation for Tending of Forest [37].
We evaluated the effects of the NCH policy on ecosystem services as represented by abundance of old-growth forests and forest carbon storage using response variables including aboveground forest biomass and biomass by tree species. We assessed the effects of the NCH policy on biodiversity using response variables including diversity of tree species and age class. One of the most important services of forest ecosystems is to store carbon. Tree biomass is the direct indicator of carbon stored in forest. Thus, we can use biomass to reflect carbon storage.
We derived the harvest parameters (including minimum entering stand stocking, target stand stocking, percent area treated per decade, tree species’ preferences for harvest) for each management scenario based on the China Code of Forest Harvesting [38], the China Regulation for Tending of Forest [37], and consultation with local experts (Table 2). Forests were divided into three management areas, including Special Ecological Welfare Forest (27.9%), General Ecological Welfare Forest (43.3%), and Commercial Forest (28.8%) (Figure 1). Harvest was not simulated in Special Welfare Forest, and we harvested 10% of both General Ecological Welfare Forest and Commercial Forest management area per decade using thinning from below as background harvest for three forest management scenarios. Background harvest was used to simulate the current tending treatment that removes some small trees in dense stands to promote tree growth. In the H scenario, we harvested 15% of the General Ecological Welfare Forest management area and 25% of the Commercial Forest management area per decade using thinning from above. The NCH scenario only considered background harvest. In the LT scenario, we only simulated additional thinning from below with 5% of the management area per decade in both General Welfare Forest and Commercial Forest, except for background harvest. All three management scenarios were simulated from 2010 to 2100 using 10-year time steps with five replicates to incorporate the model stochasticity.

2.3. LANDIS PRO 7.0 Model

2.3.1. Model Description

LANDIS PRO 7.0 is a spatially explicit raster-based forest landscape model (http://landis.missouri.edu; developer, Professor Hong S. He; School of Natural Resources, University of Missouri-Columbia, 203 ABNR Building, Columbia, MO 65211, USA) that simulates species demography, competition, disturbances, and forest management over large spatial (~1 × 10⁸ ha) and temporal (~1 × 10³ years) scales with flexible resolutions [39,40]. Within each cell, the model tracks the number of tree and age cohorts by species. Species demography includes establishment, growth, and mortality, mainly driven by species life history attributes such as longevity, mature age, shade tolerance, maximum diameter at breast height (MDBH), and potential germination seeds (Table 1). The seedling establishment was controlled by local site abiotic suitability [quantified as the species establishment probability, (SEP)], biotic suitability (quantified as the available growing space), and species shade tolerance. Tree species growth was simulated using species growth rates (age–DBH relationships) that vary among different land types to capture the environmental heterogeneity. Competition was initialized once reaching the maximum growing space (MGSO). Competition-caused mortality was simulated using Yoda’s self-thinning theory where the number of trees decreases with increasing average tree size following a −3/2 rule [41,42]. Tree harvest was simulated using the management area map and the forest stand map in the LANDIS PRO Harvest module [43]. Different harvest objectives were implemented in management areas (Figure 1). Stand was the minimum treatment unit to which a harvest event was implemented and its boundaries were described by the stand map.

2.3.2. Model Parameterization

We simulated 15 major tree species in this study (Table 1) [35]. We derived the initial forest condition recorded in the forest composition map, including number of trees and DBH, by age cohort for tree species in each cell from forest stand map and forest inventory data at year 2010. The resolution of forest composition map was 100 × 100 m. The forest stand map provided forest composition and forest inventory data provided age structure (DBH). We stratified the heterogeneous landscape into relatively homogeneous land type units based on abiotic controls (e.g., topography). Thus, each land type is assumed to be homogeneous in terms of resource availability represented by MGSO, while different land types are heterogeneous [31]. We stratified landscape into eight land types based on latitude (greater or less than 48°), elevation (higher or lower than 600 m), and aspect (south slope or north slope). We derived life history attributes of tree species from the previous studies in this region [44,45]. We derived the SEP, tree species growth rates, and MGSO from previous study [35].
The main parameters in harvest module included the type of management area, harvest method, harvest rotation, the target size of harvest, and the type of regeneration. We parameterized all three management scenarios according to the specifications of the H, NCH, and LT scenarios (Table 2). The stands with highest stock level were chosen for treatment. The silvicultural harvesting system applied was thinning from above by stock ranking and thinning from below randomly. The reason we used thinning from below randomly was there was no other way to approximate so much site-level thinning from below activities across such a large region. The random treatment was also used in similar modeling studies [24]. We simulated harvest by selection cutting. Harvest priority of species in descending order was white birch, larch, Kingan fir, Korean spruce, black elm, Mongolian oak, Dahur birch, and ribbed birch. In this study, we presumed forest management plans, management units, and stand map remained unchanged. The management (Table 2) implemented in the LANDIS PRO model was intended to reflect the reality. However, there were always gaps between model simulation and harvest reality. Comparing simulated outcomes from LANDIS PRO against post-harvest field inventory could provide the validation that the model simulated the reality [46].
We iteratively adjusted species growth rates and calibrated model parameters to ensure the initial forest composition captured the real forest conditions by comparing the initiated aboveground forest biomass at the initial year 2010 with the observed estimates from inventory data in 2010 [35].

2.3.3. Model Initialization

We used 94 forest inventory plots and extracted the corresponding biomass from initiated biomass map (LANDIS output). To compare the initiated aboveground forest biomass with forest inventory data for year 2010, we used a scatter plot of observed biomass with initiated biomass and made a linear fit (Figure 2). A significant (p < 0.05, R2 = 0.80) linear correlation existed between field inventory biomass and initiated biomass in 2010 of the inventory plots, while the t-test result showed no significant (p = 0.92 > 0.05) difference between observed biomass and initiated biomass.

2.4. Data Analysis

We calculated the basal area of tree species by age class. To determine the forest age class for a certain cell, we set the age class with the largest basal area as the cell’s age class. Basal area was derived from model outcomes. We evaluated diversity of species using Shannon–Wiener’s index of diversity (H’). The Shannon–Wiener index incorporates both species richness and the evenness of species abundance. The Shannon–Wiener index is calculated as:
H = p i × ln ( p i )
where pi is the percent cover of tree species i that refers to the percentage of pixels of each species/age class in total number of pixels of our study area [47]. Likewise, forest age-class diversity also was calculated using Equation (1).
We averaged the simulation results including aboveground forest biomass, biomass by tree species, abundance of forest age classes (percent of the landscape by age class), and diversity of tree species and age class for the whole area from the five replicates for each scenario. To capture the forest dynamics, we averaged the simulation results at the time periods 2020–2030, 2040–2060, and 2070–2100 to represent the short-, medium-, and long-term results. We then compared the simulation results among three forest management scenarios using ANOVA and Duncan test in the short-, medium-, and long-term, respectively.

3. Results

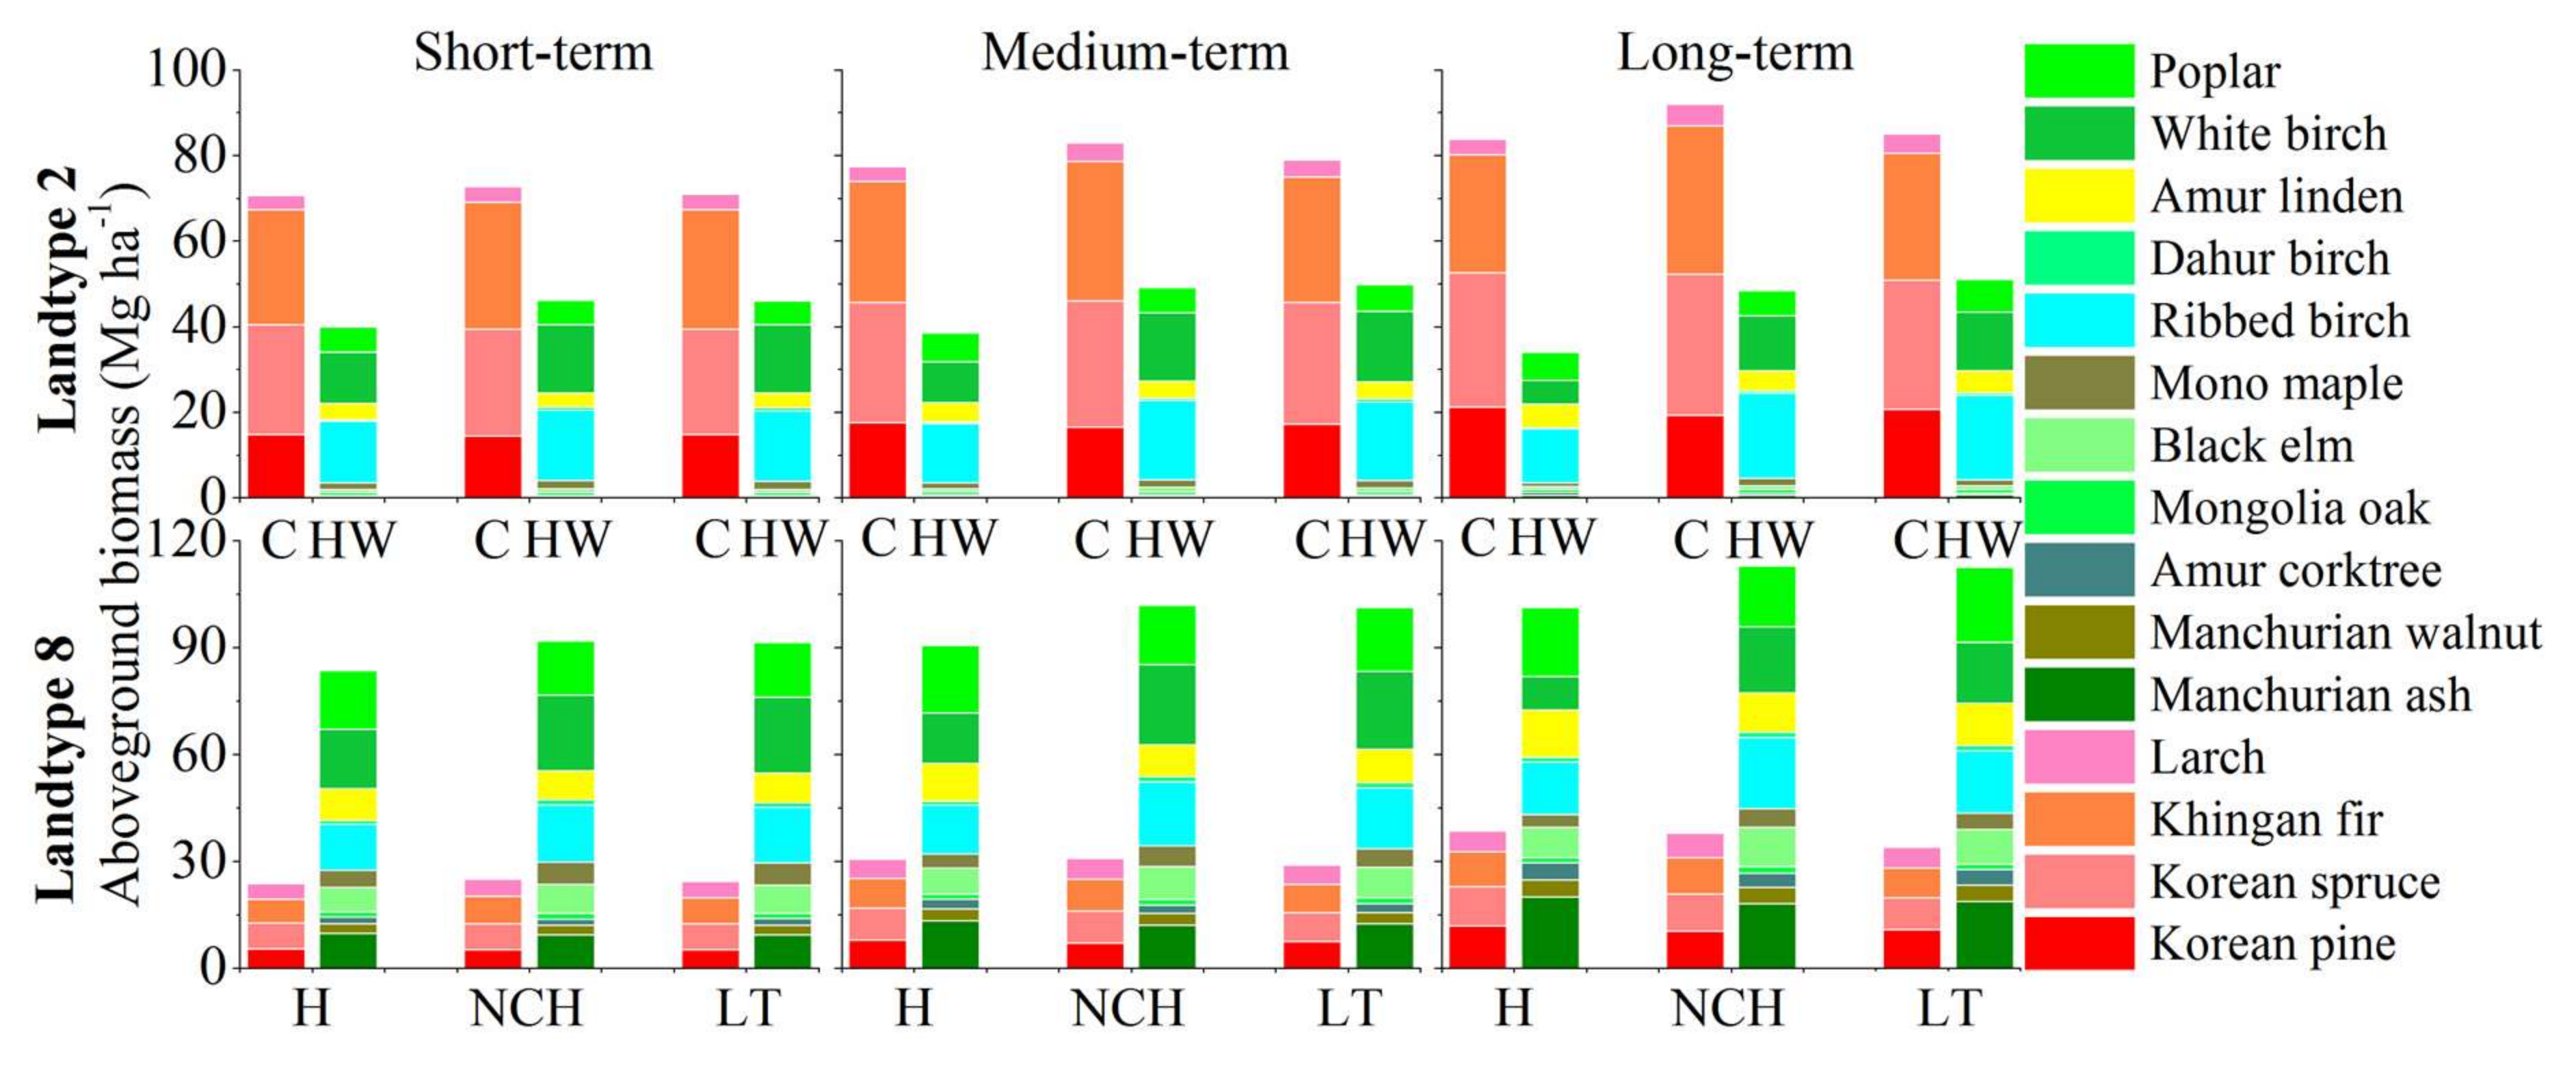
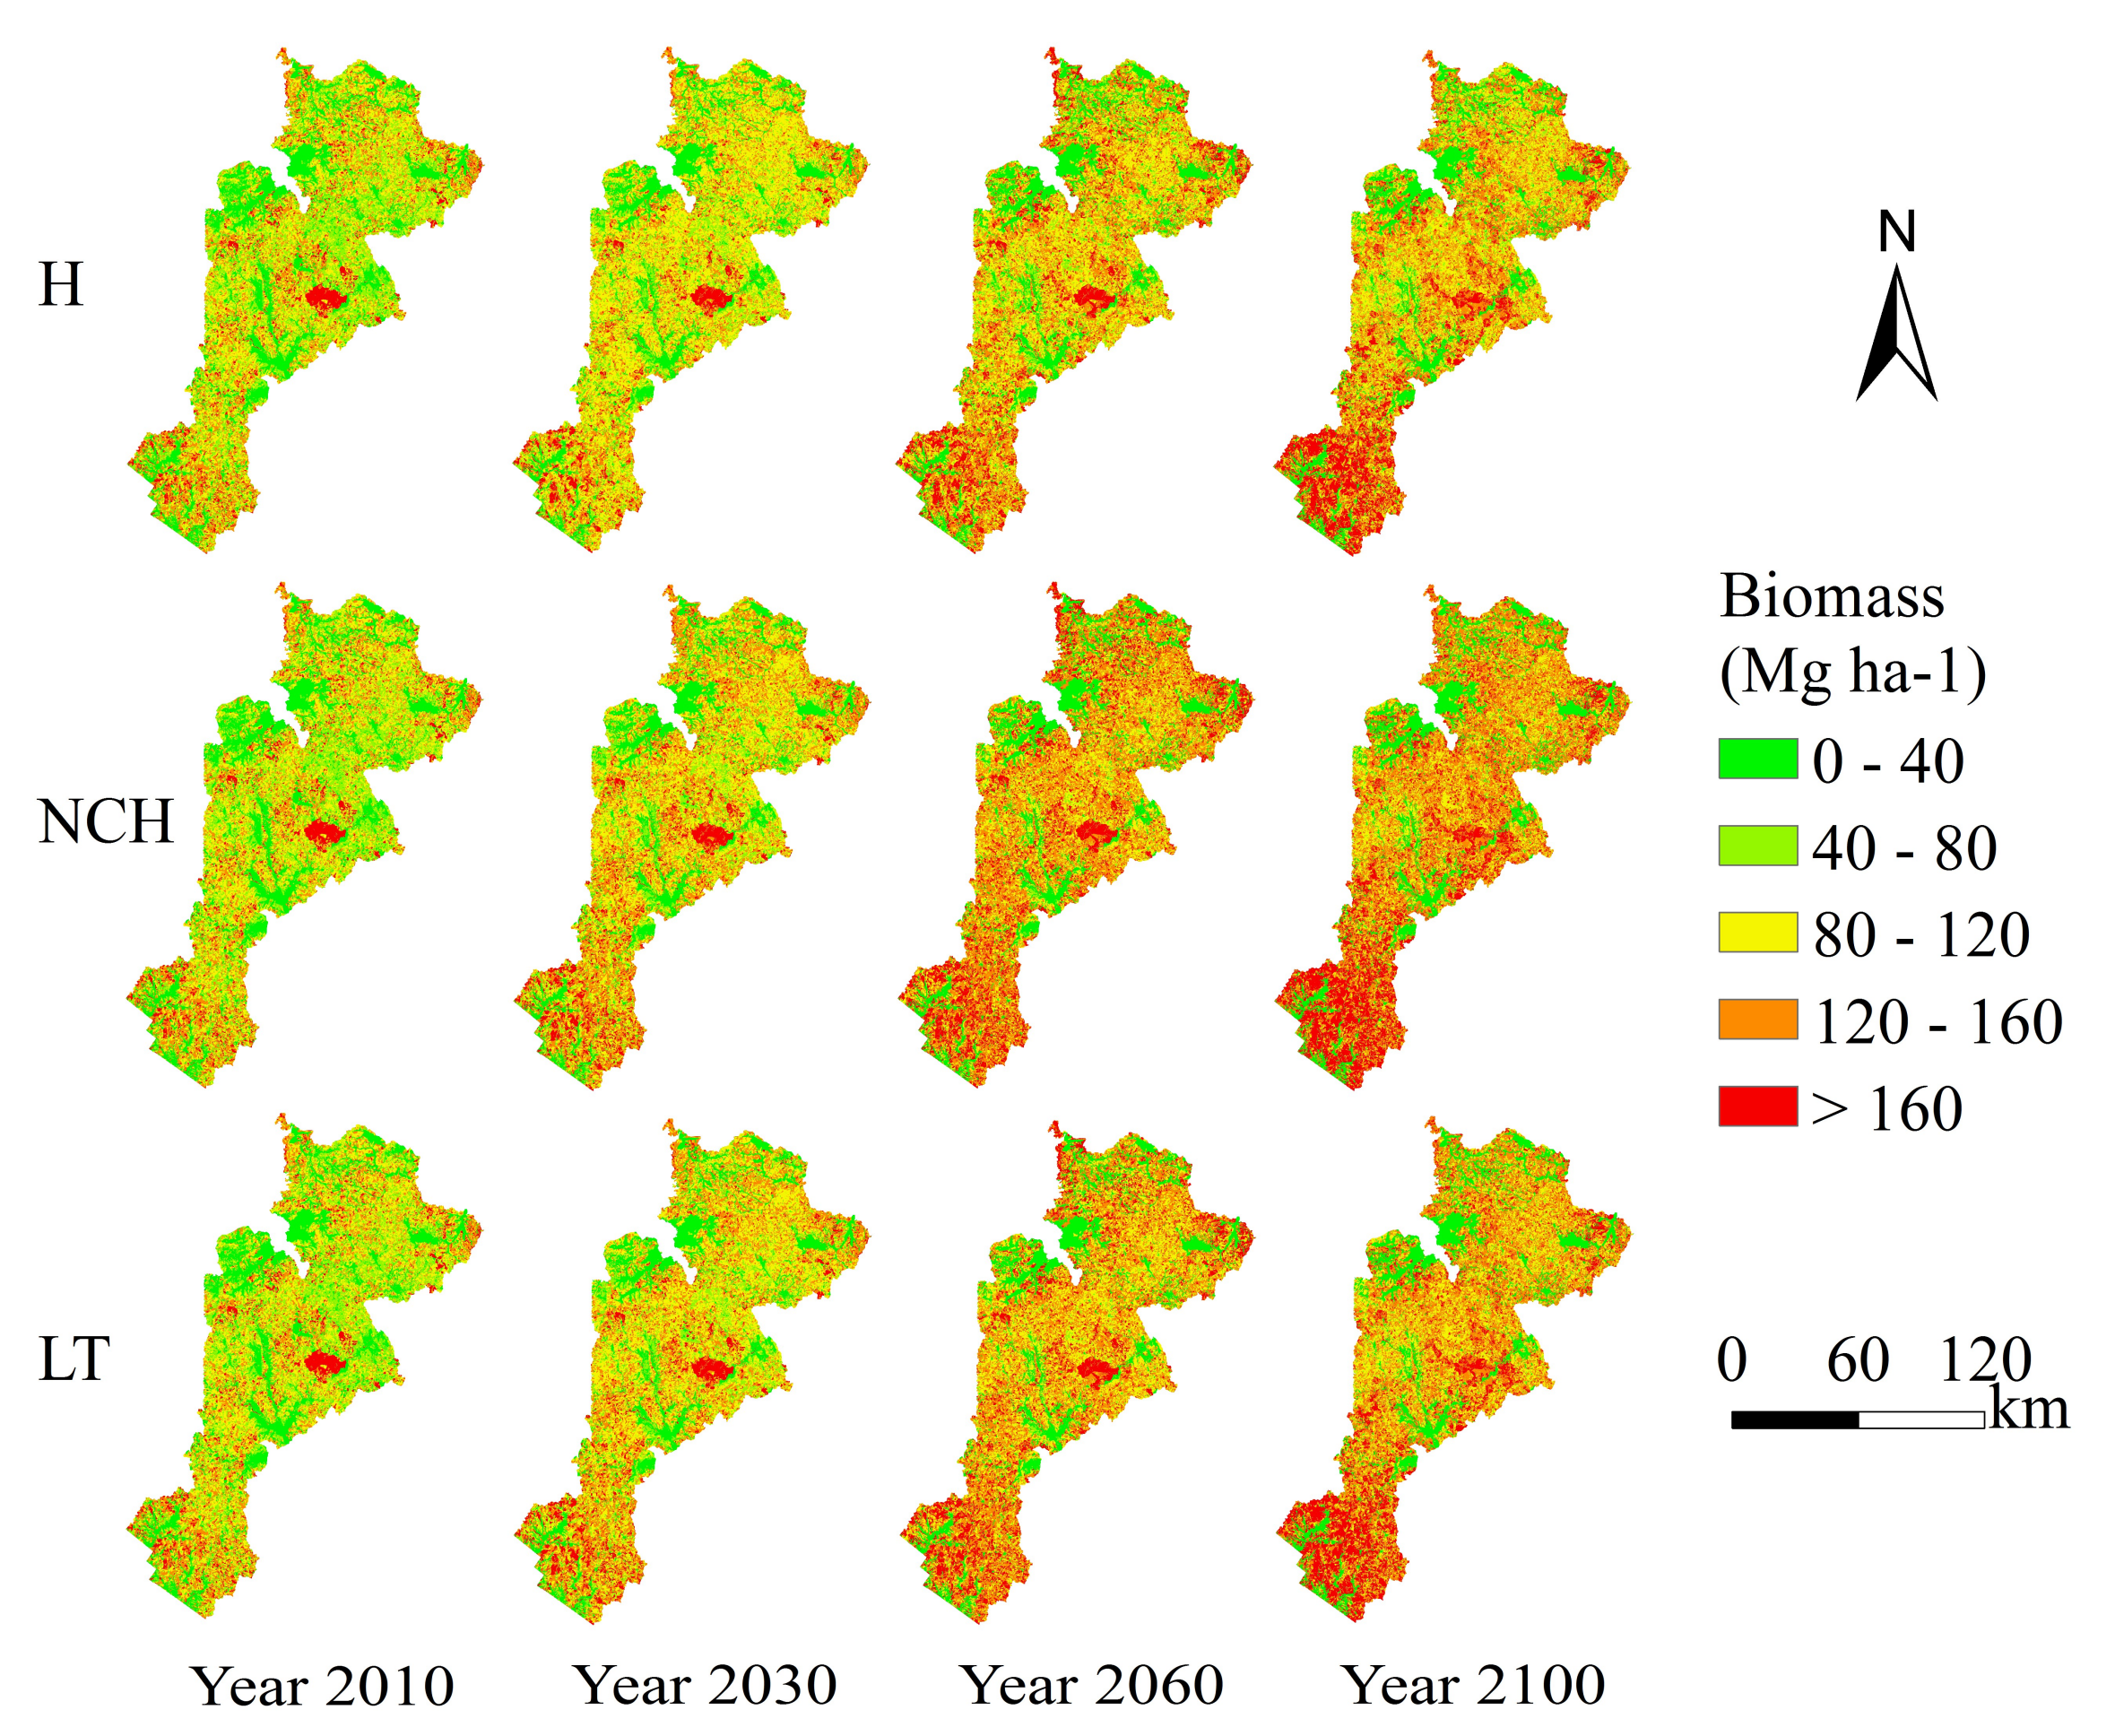
3.1. Aboveground Biomass

Aboveground forest biomass increased rapidly at the short- and medium-term and then gradually slowed at the long-term, regardless of management scenarios (Figure 3). Compared with year 2010, aboveground forest biomass increased by 30.7%, 41.3%, and 37.1% at year 2100 in the H, NCH and LT scenarios, respectively. Aboveground forest biomass in the NCH and LT scenarios was higher than that in the H scenario by 8.1% and 4.9% at 2100, respectively. The differences in aboveground forest biomass among three scenarios increased significantly over time (p < 0.05).
At the individual species level, the biomass of most tree species increased from 2010 to 2100 irrespective of management scenarios, except for the biomass of maple and white birch, which decreased on average (Figure 4). The biomass for the rare and protected tree species was the highest in the H scenario and the lowest in the NCH scenario. Most timber species had the largest biomass in the NCH scenario, especially white birch. Differences in biomass by tree species among three scenarios increased significantly over time (p < 0.05).
At the land-type level, aboveground forest biomass also showed increasing trends (Figure 5). Aboveground forest biomass in the NCH scenario was the highest, followed by the LT and H scenarios, regardless of terms and land types. In the land type of the northern slope with elevation higher than 600 m and latitude greater than 48° (i.e., Land type 2), biomass of conifer species were higher than for hardwood species, and Korean spruce and Khingan fir showed the greatest biomass of the conifer. In the land type of the northern slope with elevation lower than 600 m and latitude less than 48° (i.e., Land type 8), biomass of hardwood species were higher than for conifer species.
The spatial distribution of aboveground forest biomass showed similar patterns over time regardless of management scenarios (Figure 6). In the initial year (2010), the high area value of aboveground forest biomass was mainly concentrated in the central area (Feng Lin National Nature Reserve). Aboveground forest biomass evidently increased in the whole region over time, especially in the south. The larger managed area led to less area with high biomass. The area with high biomass was the greatest in the NCH scenario, followed by the LT and H scenarios.
Abundance of forest age classes showed similar responses among the H, NCH, and LT scenarios (Figure 7). Age classes concentrated around middle-aged cohorts at 2010 and then gradually shifted toward the older age cohorts and reached old-growth cohorts at 2100. Old-growth forests were most abundant in the NCH scenario, followed by the LT and H scenarios at 2100, occupying 66.7%, 61.5%, and 51.6%, respectively. Differences in abundance of old-growth forests between the three management scenarios increased significantly over time (p < 0.05).

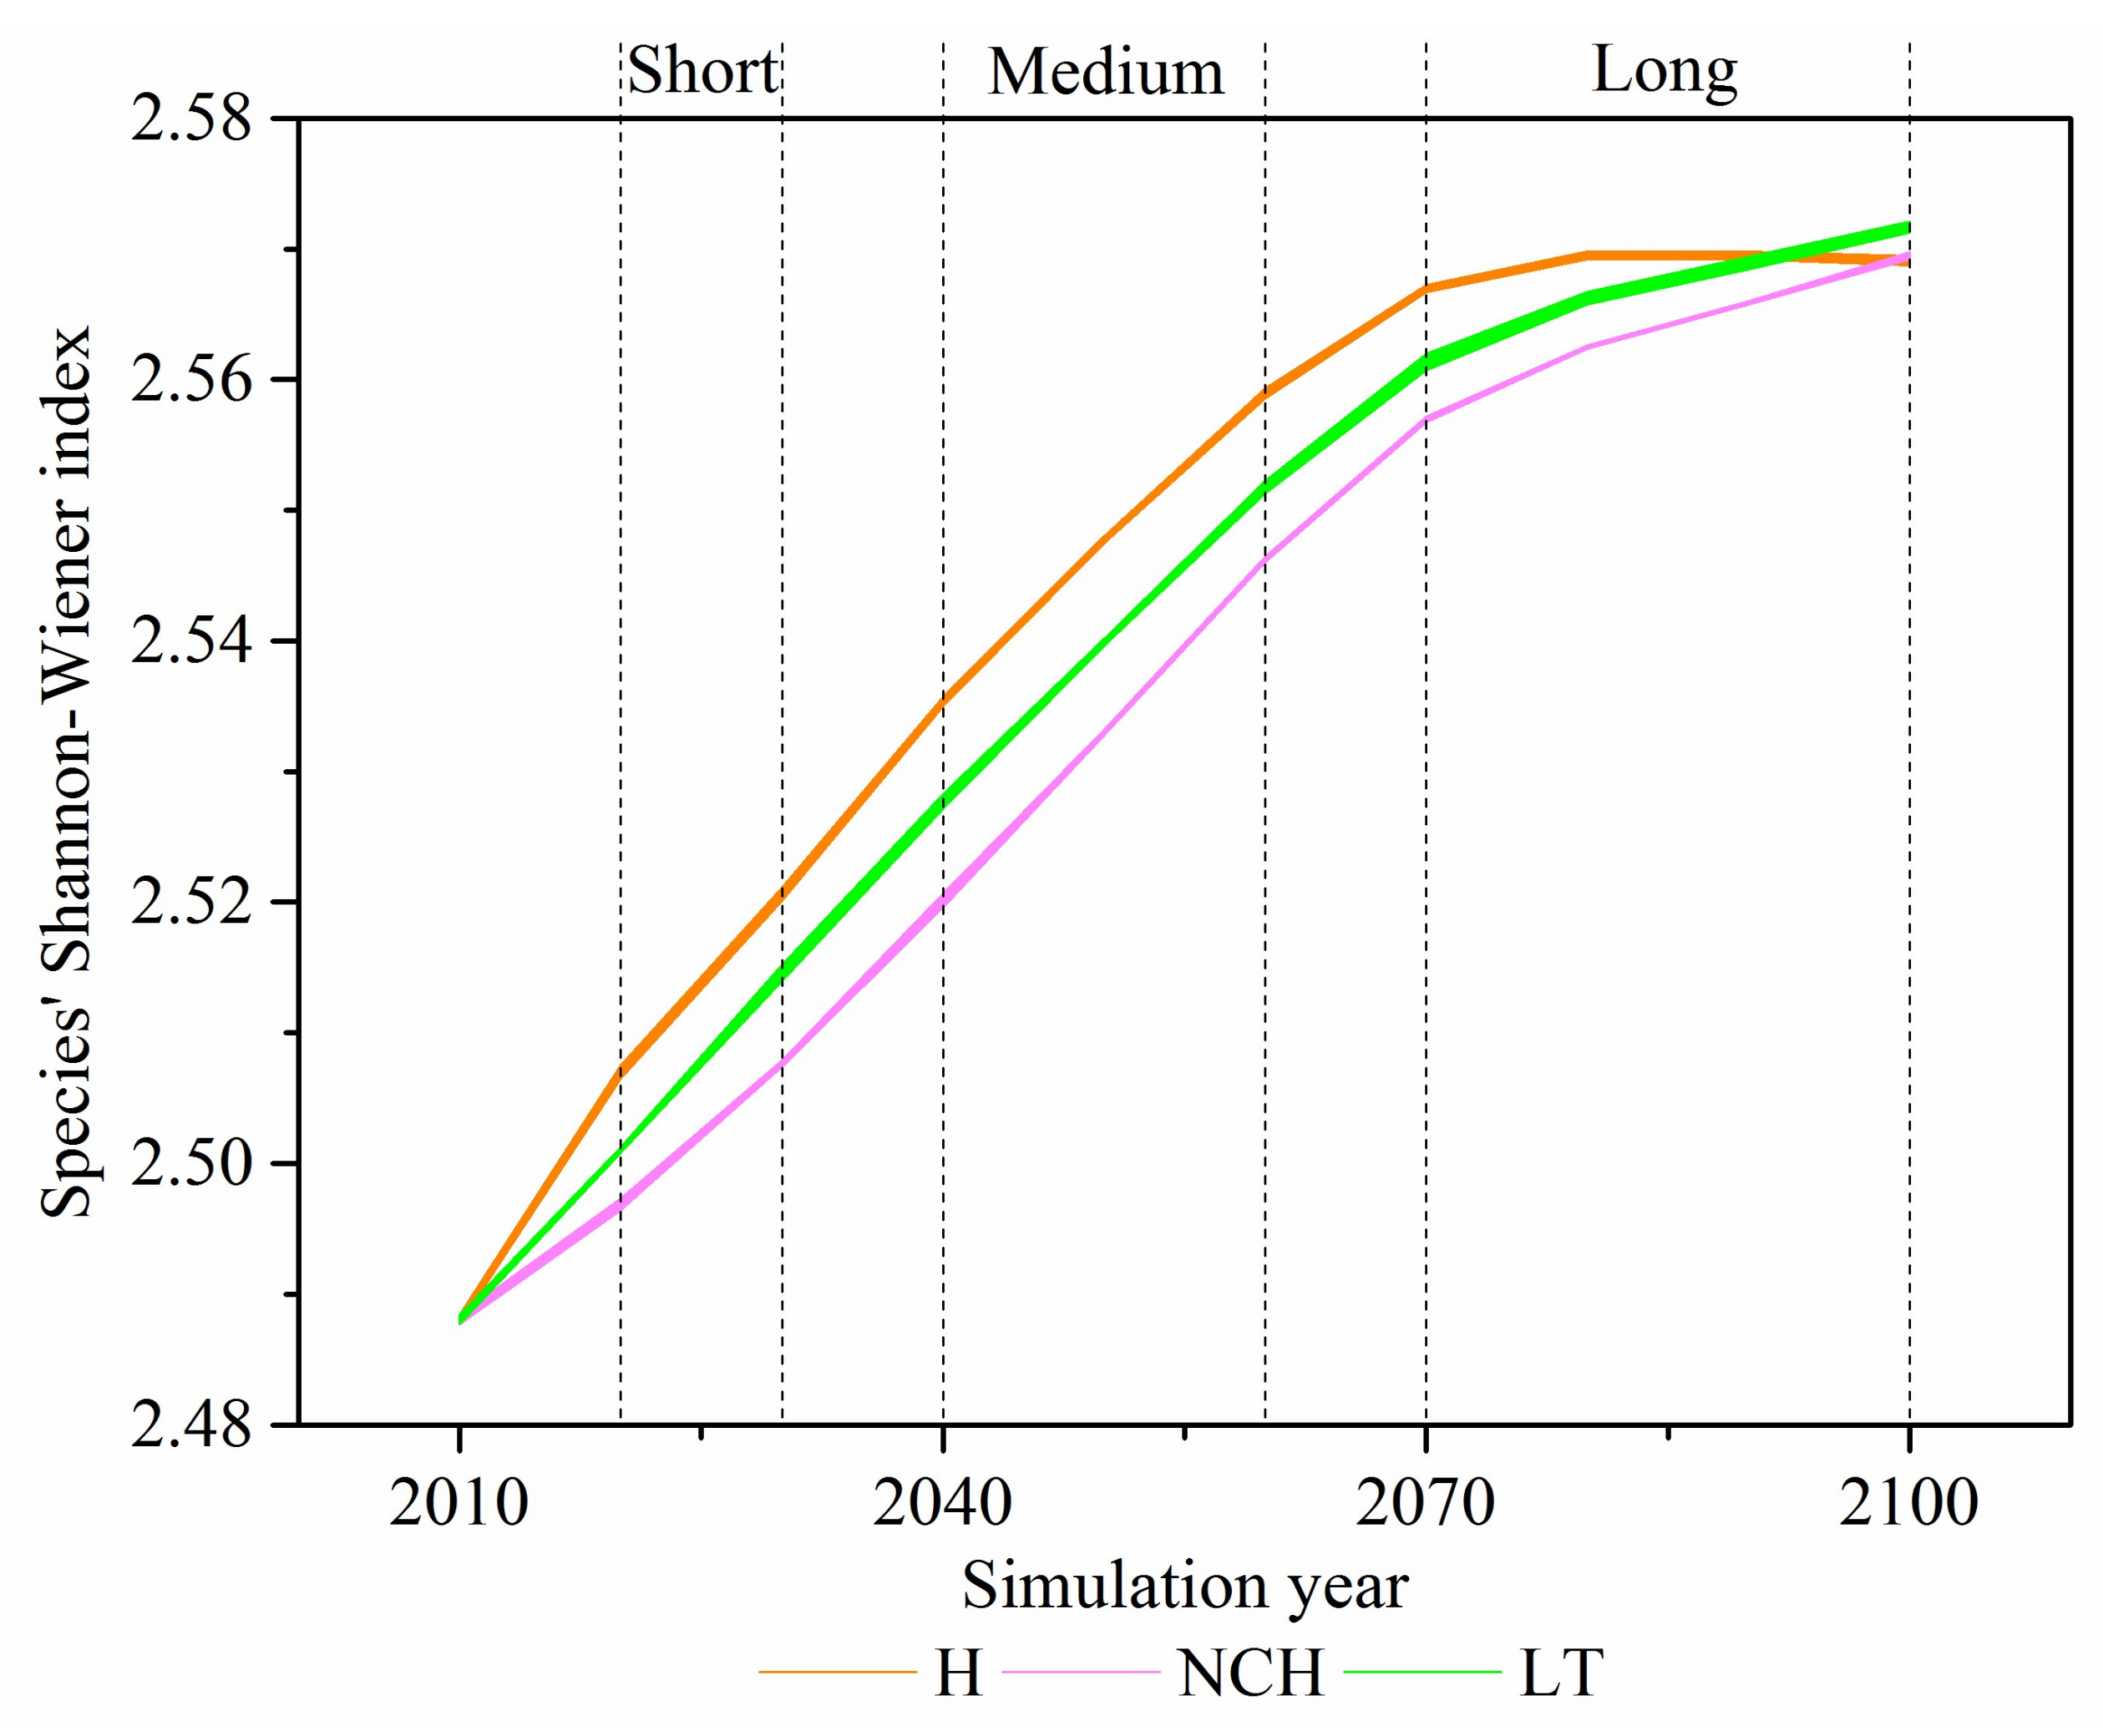
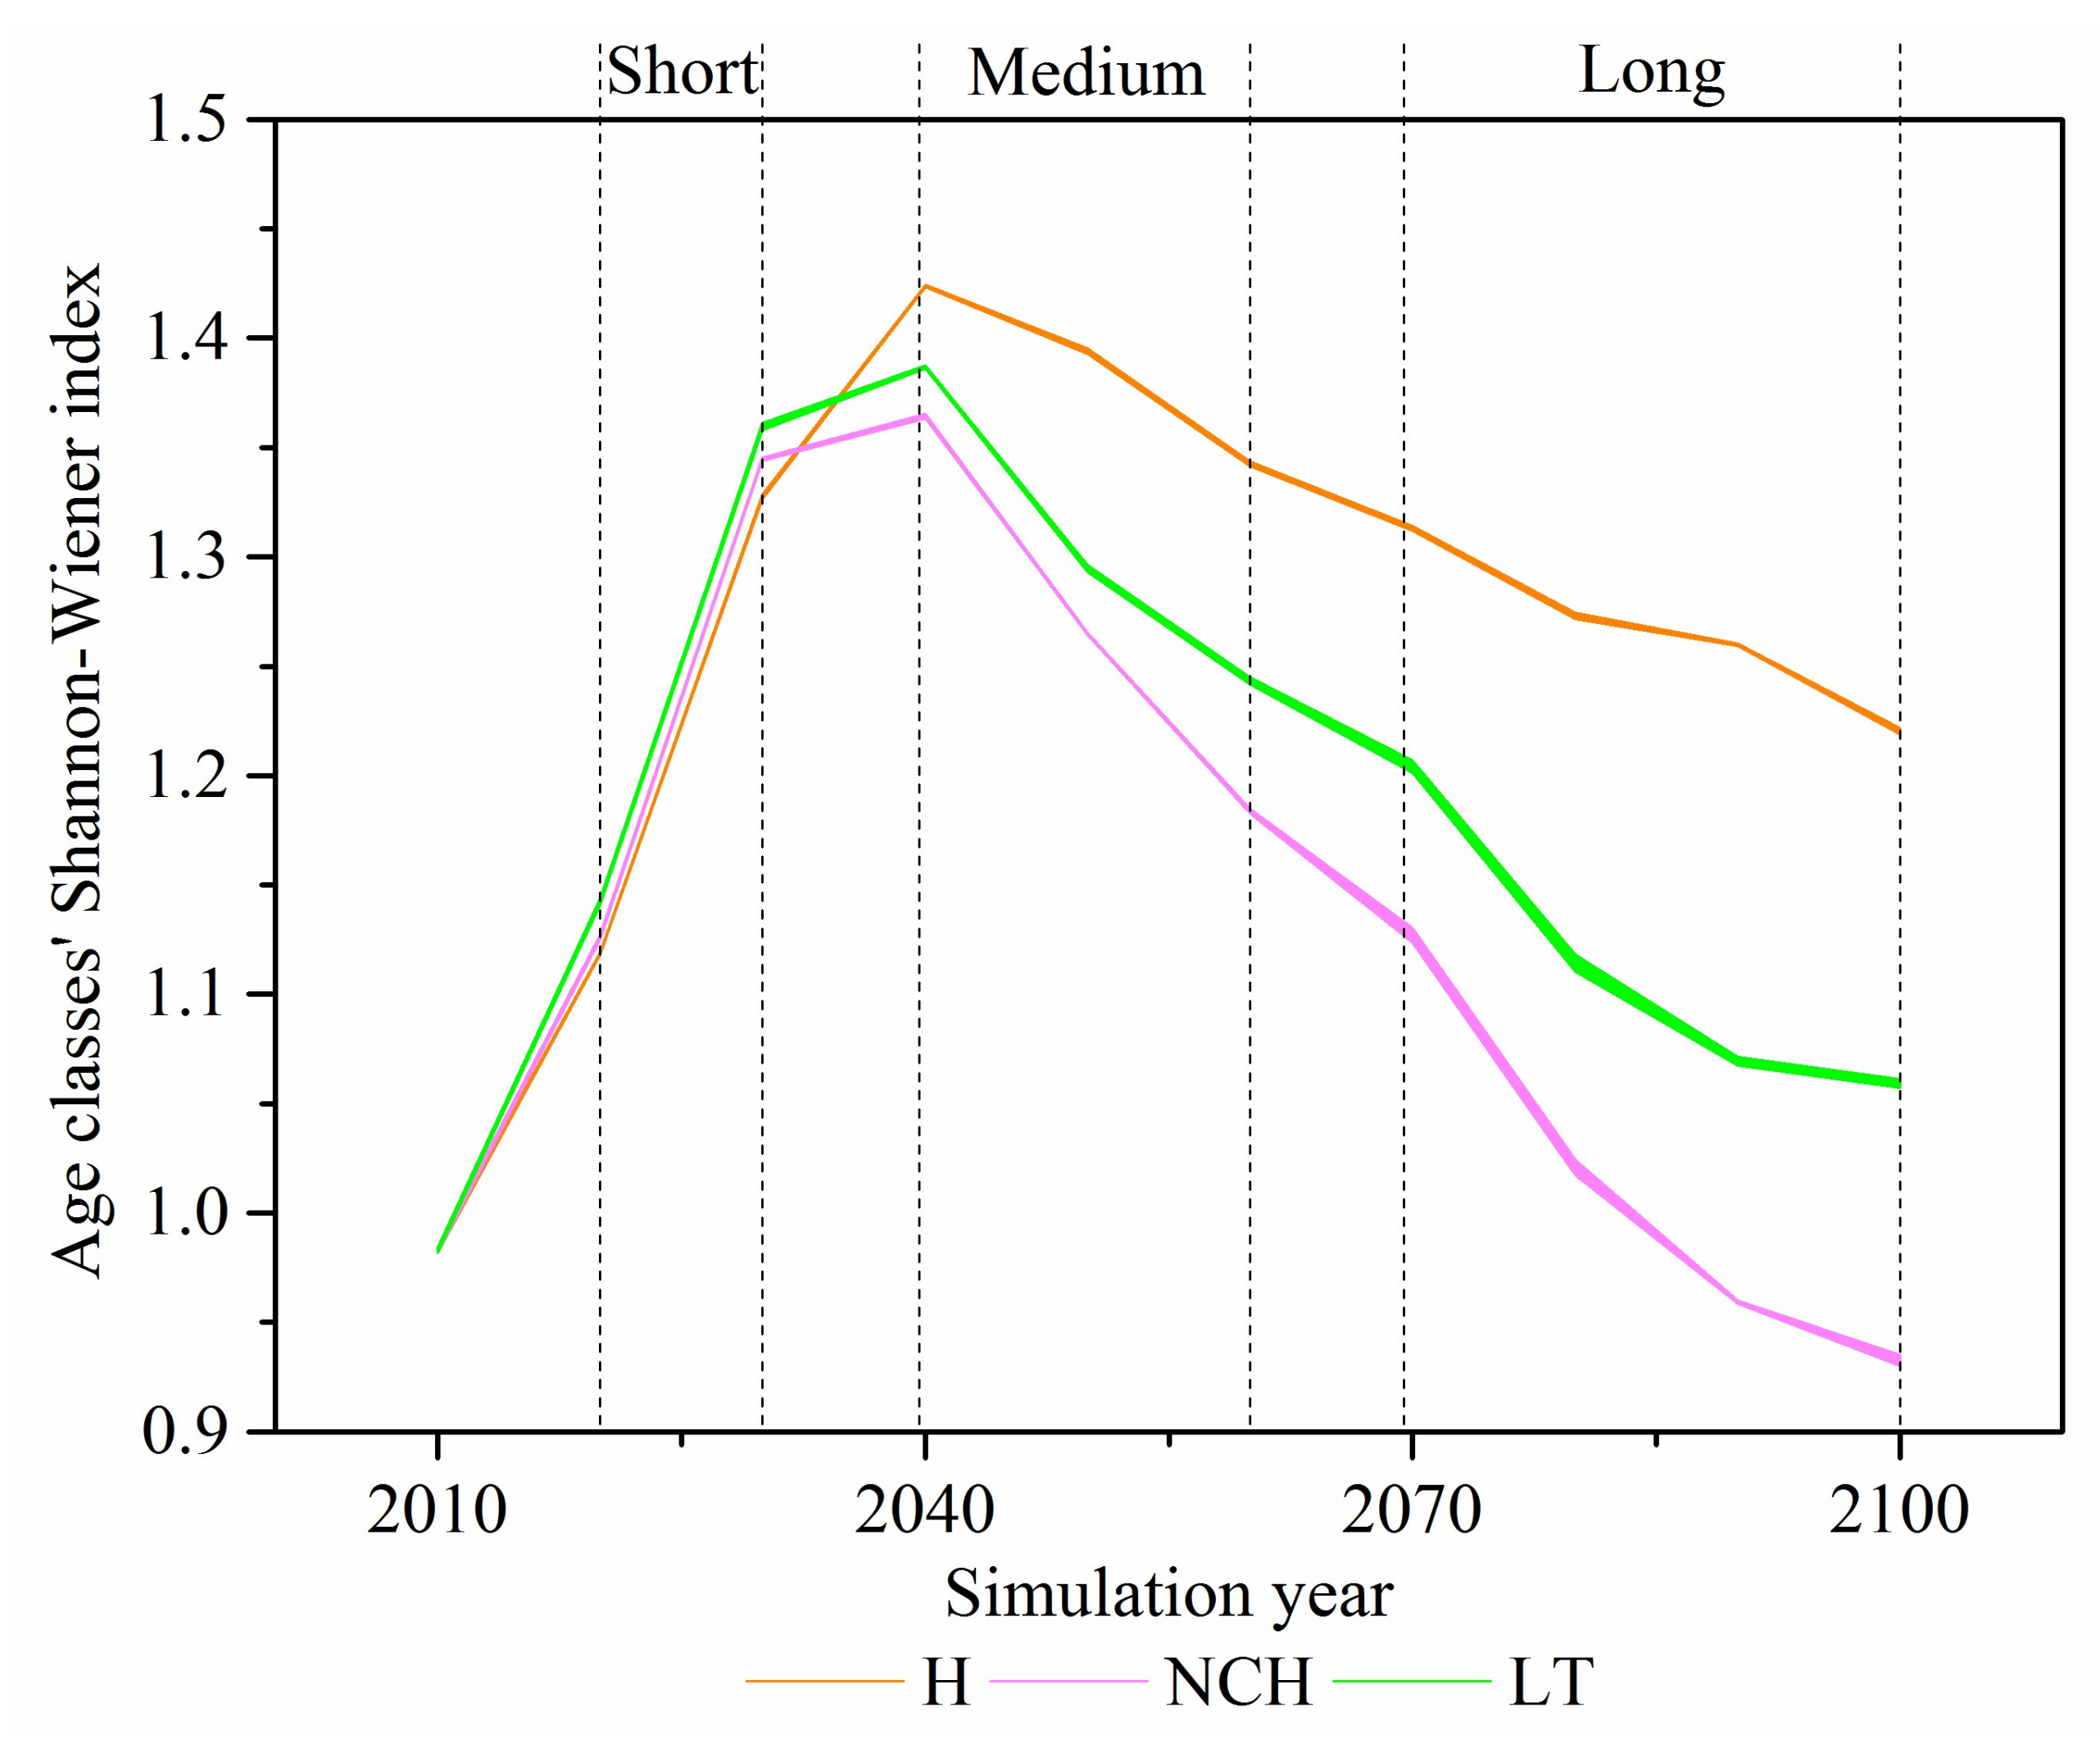
3.2. Diversity of Tree Species and Forest Age Class

The tree species diversity index gradually increased in the short- and medium-term and then slowed in the long-term irrespective of the management scenario, ranging from 2.47 to 2.57 (Figure 8). Tree species diversity was highest in the H scenario and lowest in the NCH scenario during the period, except for 2100. The differences in diversity between the three management scenarios increased at first and then decreased over time (p < 0.05).
The forest age-class diversity index rapidly increased to a peak in 2040 and then gradually declined regardless of the management scenario, ranging from 0.91 to 1.42 (Figure 9). Forest age-class diversity was the highest in the LT scenario and the lowest in the H scenario at the short-term, but it was highest in the H scenario and lowest in the NCH scenario in the medium- and long-term. The differences in diversity between the three management scenarios increased significantly over time (p < 0.05).

4. Discussion

The management scenario had long-term effects on ecosystem services. Forest management not only impacted aboveground forest carbon storage but altered tree species composition and age classes, which subsequently impacted aboveground forest carbon dynamics [48,49]. Our results showed that the NCH scenario significantly increased aboveground forest biomass and abundance of old-growth forests by banning harvest over the simulation period compared with the H scenario (Figure 3 and Figure 7). Because old-growth forests were able to sequester the greatest amount of carbon [50] compared with the other age-class forests [23], the Commercial Harvest Exclusion policy improved ecosystem services. Furthermore, the Commercial Harvest Exclusion policy favored increasing forest carbon storage, a commitment set in the Kyoto protocol.
Forest management may have unintended impacts. Our results showed that maximizing individual ecosystem services such as carbon storage might reduce the biodiversity of some taxa, as reported in a prior study [22]. Although the NCH scenario had greatest aboveground forest carbon and abundance of old-growth forests, it decreased the biomass of the rare and protected tree species and tree species diversity compared with the H scenario (Figure 3, Figure 4, Figure 7 and Figure 8). This was because banning harvest in the NCH scenario reduced growing space, exacerbated the competition against rare and protected tree species, and limited tree species regeneration. Additionally, we found that age-class diversity increased in the short-term but decreased in the medium- and long-term in the NCH scenario compared with the H scenario (Figure 9). This was because banning harvest in the NCH scenario promoted forest shifts into older stages, and forest age classes became diverse in the short-term but singular in the medium- and long-term. We found the LT scenario kept aboveground forest carbon storage and abundance of old-growth forests at a high level while maintaining the rare and protected tree species and diversity of tree species and age class. This was because the LT scenario released growing space to promote the growth and regeneration of tree species [51,52,53] while simultaneously retaining large individuals.
Our results showed that aboveground forest biomass increased regardless of management scenarios because current forests were relatively young, recovered from the historically extensive timber harvesting, and continued sequestering carbon [9,54]. Additionally, model parameterization (e.g., growth rate) might also contribute to the similar forest dynamics in three management scenarios. The predicted increase of aboveground forest biomass was lower than the other model predictions (e.g., LANDIS II) in this region. This was because Ma et al., (2017) did not simulate harvest and different growth rates also impacted on the increase of biomass [55]. Notably, we found aboveground forest biomass increases were partly offset by the mortality of short-lived species (e.g., white birch and poplar). These results reinforced the notion that succession was the dominant mechanism driving aboveground forest biomass dynamics throughout the remainder of the 21st century [56,57], even though harvest reduced aboveground forest biomass.
Our results showed that the effects of forest management increased over time, aligning with prior studies that identified harvest as the major driver of change. For instance, harvest significantly altered forest composition over time in South-Central Siberia [26] and Northeast China [58] because forest management had cumulative effects on forest ecosystem [3,29], and repeated harvest led to changes in forest composition and stand structure.
Our results showed that species’ ecological characteristics and disturbance (i.e., harvest) together determined landscape heterogeneity. Since conifer tree species had good cold tolerance, they were mainly distributed in the north and in high altitude regions. However, hardwood tree species were mostly distributed in the south and low altitude regions. These results suggested species’ ecological characteristics determined landscape heterogeneity. Since conifer tree species were prioritized for harvest due to high cutting priority, the value for aboveground forest biomass in the north is lower than that in the south. This confirmed the view that harvest could influence the spatial distribution of aboveground forest biomass [46,48].
Our results had implications for sustainable forest management in the context of climate change. Forest management is increasingly viewed as a central component to regional and global strategies for climate-change mitigation and adaptation in the face of changing global conditions [59]. A recent study showed that managing to maximize one objective (either mitigation or adaptation) may inadvertently compromise another [6]. The NCH scenario, for instance, enhanced the mitigation for climate change and disturbances by causing carbon storages, while decreasing the landscape-level compositional and structural complexity (reducing adaptation potential), represented by decrease in biodiversity. In contrast, the H scenario showed better adaptation but less mitigation. Nevertheless, the LT scenario with the medium-level carbon storage and biodiversity may be a feasible way to regulate the trade-off between mitigation and adaptation in a broad array of forest systems.
Our predictions are subject to a number of uncertainties. We did not consider climate change in our simulation. Given the recent evidence on climate change, temperature will increase and precipitation will decrease in the future [44]. Ma et al., (2014) predicted that carbon sequestration rates of rare and protected tree species under future climate will be higher than those under the current climate [60]. A warming climate would increase the biomass of the rare and protected tree species and might alleviate the negative effects of the NCH policy on them. We also did not consider fire, windthrow, and insect outbreaks, which may increase under a warming climate and increasing drought events. In this study, we presumed that forest management plans, management units, and stand map would remain unchanged. However, forest management plans will adapt to change over time, and management unit boundaries might be redrawn in response to changing management objectives and future climate. We only tested the relative performance of management scenarios. If there was an overexploitation scenario as baseline scenario, we could evaluate the absolute effectiveness of the management scenarios. Although there were many limitations in this study, our results still provided insight into sustainable forest management and the interdependence between humans, society, and the forest ecosystem.

5. Conclusions

The forest landscape model LANDIS PRO 7.0 was capable of modeling forest dynamics under specific management scenarios. Based on the simulated results, several conclusions can be drawn as follows. The past Classified Forest Management policy would lead to the lowest carbon storage with the highest biodiversity, however the current Commercial Harvest Exclusion (NCH) policy would result in the highest carbon storage with the lowest biodiversity. There was trade-off between carbon storage and biodiversity. Light thinning treatment was feasible to regulate the trade-off in the context of banning commercial harvest. The NCH policy reduced the biomass of the rare and protected species, while light thinning treatment alleviated the negative effects. We also concluded that species’ ecological characteristics and disturbance (i.e., harvest) together determined landscape heterogeneity.

Acknowledgments

This study was supported by the National Key R & D Program of China (2016YFA0602301 and 2017YFA0604403-3), the Hundred-Talent Program (Y7H7031001) from the Chinese Academy of Sciences, and the National Natural Science Foundation of China (No. 41501089 and 41601052). We thank Guohua Song for providing harvest specifications. We are grateful to Dandan Zhao, Shaofei Jin, and Wenru Xu for their suggestions that improved the manuscript.

Author Contributions

K.L. and H.H. conceived and designed the experiments. K.L. analyzed the data, did the scenario analysis and wrote the first draft of the manuscript; Y.L., H.H., and W.W. greatly improved the experimental design and the manuscript; C.H. and J.X. helped with model runs, statistics results and their interpretation; S.Z., L.W., and H.D. supervised the analysis and manuscript writing.

Conflicts of Interest

The authors declare no conflict of interest.

References

  1. Heinonen, T.; Pukkala, T.; Mehtätalo, L.; Asikainen, A.; Kangas, J.; Peltola, H. Scenario analyses for the effects of harvesting intensity on development of forest resources, timber supply, carbon balance and biodiversity of Finnish forestry. For. Policy Econ. 2017, 80, 80–98. [Google Scholar] [CrossRef]
  2. Kline, J.D.; Harmon, M.E.; Spies, T.A.; Morzillo, A.T.; Pabst, R.J.; McComb, B.C.; Schnekenburger, F.; Olsen, K.A.; Csuti, B.; Vogeler, J.C. Evaluating carbon storage, timber harvest, and potential habitat possibilities for a western Cascades (US) forest landscape. Ecol. Appl. 2016, 26, 2044–2059. [Google Scholar] [CrossRef] [PubMed]
  3. Shifley, S.R.; Thompson, F.R.; Dijak, W.D.; Fan, Z. Forecasting landscape-scale, cumulative effects of forest management on vegetation and wildlife habitat: A case study of issues, limitations, and opportunities. For. Ecol. Manag. 2008, 254, 474–483. [Google Scholar] [CrossRef]
  4. Gustafsson, L.; Baker, S.C.; Bauhus, J.; Beese, W.J.; Brodie, A.; Kouki, J.; Lindenmayer, D.B.; Lõhmus, A.; Pastur, G.M.; Messier, C. Retention forestry to maintain multifunctional forests: A world perspective. BioScience 2012, 62, 633–645. [Google Scholar] [CrossRef]
  5. Zanchi, G.; Belyazid, S.; Akselsson, C.; Yu, L. Modelling the effects of management intensification on multiple forest services: A Swedish case study. Ecol. Model. 2014, 284, 48–59. [Google Scholar] [CrossRef]
  6. D’Amato, A.W.; Bradford, J.B.; Fraver, S.; Palik, B.J. Forest management for mitigation and adaptation to climate change: Insights from long-term silviculture experiments. For. Ecol. Manag. 2011, 262, 803–816. [Google Scholar] [CrossRef]
  7. Shifley, S.R.; Aguilar, F.X.; Song, N.; Stewart, S.; Nowak, D.; Gormanson, D.; Moser, K.; Wormstead, S.; Greenfield, E.J. Forest of North America Executive summary. In Forests of the Northern United States; U.S. Department of Agriculture, Forest Service, Northern Research Station: Newtown Square, PA, USA, 2012; 40p. [Google Scholar]
  8. Barreto, P.; Amaral, P.; Vidal, E.; Uhl, C. Costs and benefits of forest management for timber production in eastern Amazonia. For. Ecol. Manag. 1998, 108, 9–26. [Google Scholar] [CrossRef]
  9. Yu, D.; Zhou, L.; Zhou, W.; Ding, H.; Wang, Q.; Wang, Y.; Wu, X.; Dai, L. Forest management in Northeast China: History, problems, and challenges. Environ. Manag. 2011, 48, 1122–1135. [Google Scholar] [CrossRef] [PubMed]
  10. Sodhi, N.S.; Koh, L.P.; Brook, B.W.; Ng, P.K. Southeast Asian biodiversity: An impending disaster. Trends Ecol. Evol. 2004, 19, 654–660. [Google Scholar] [CrossRef] [PubMed]
  11. Ciccarese, L.; Mattsson, A.; Pettenella, D. Ecosystem services from forest restoration: Thinking ahead. New For. 2012, 43, 543–560. [Google Scholar] [CrossRef]
  12. Modica, G.; Merlino, A.; Solano, F.; Mercurio, R. An index for the assessment of degraded Mediterranean forest ecosystems. For. Syst. 2015, 24, 13–2171. [Google Scholar] [CrossRef]
  13. Oliet, J.A.; Jacobs, D.F. Restoring forests: Advances in techniques and theory. New For. 2012, 43, 535–541. [Google Scholar] [CrossRef]
  14. Holl, K.D.; Aide, T.M. When and where to actively restore ecosystems? For. Ecol. Manag. 2011, 261, 1558–1563. [Google Scholar] [CrossRef]
  15. Schulte, D.M.; Burke, R.P.; Lipcius, R.N. Unprecedented Restoration of a Native Oyster Metapopulation. Science 2009, 325, 1124–1128. [Google Scholar] [CrossRef] [PubMed]
  16. Hodder, K.H.; Newton, A.C.; Cantarello, E.; Perrella, L. Does landscape-scale conservation management enhance the provision of ecosystem services? Int. J. Biodivers. Sci. Ecosyst. Serv. Manag. 2014, 10, 71–83. [Google Scholar] [CrossRef]
  17. Dai, L.; Wang, Y.; Su, D.; Zhou, L.; Yu, D.; Lewis, B.J.; Qi, L. Major forest types and the evolution of sustainable forestry in China. Environ. Manag. 2011, 48, 1066–1078. [Google Scholar] [CrossRef] [PubMed]
  18. Deng, H.; Bu, R.; Liu, X.; He, W.; Hu, Y.; Huang, N. Simulating the effects of forestry classified management on forest biomass in Xiao Xing’an Mountains. Acta Ecol. Sin. 2012, 32, 6679–6687. [Google Scholar] [CrossRef]
  19. Wei, Y.; Zhou, W.; Yu, D.; Zhou, L.; Fang, X.; Zhao, W.; Bao, Y.; Meng, Y.; Dai, L. Carbon storage of forest vegetation under the Natural Forest Protection Program in Northeast China. Acta Ecol. Sin. 2014, 34, 5696–5705. [Google Scholar] [CrossRef]
  20. Yu, D.; Zhou, W.; Bao, Y.; Qi, L.; Zhou, L.; Dai, L. Forest management of Korean pine and broadleaf mixed forest in northeastern China since the implementation of Natural Forest Protection Project. Acta Ecol. Sin. 2015, 35, 10–17. [Google Scholar]
  21. Yuan, S.; Shen, Q.; Tian, J.; Bai, X. Research Report of the Full Stop Forest Commercial Cutting in Heilongjiang Forest Area. For. Econ. 2015, 2, 47–51. [Google Scholar]
  22. Dickie, I.A.; Yeates, G.W.; John, M.G.S.; Stevenson, B.A.; Scott, J.T.; Rillig, M.C.; Peltzer, D.A.; Orwin, K.H.; Kirschbaum, M.U.F.; Hunt, J.E. Ecosystem service and biodiversity trade-offs in two woody successions. J. Appl. Ecol. 2011, 48, 926–934. [Google Scholar] [CrossRef]
  23. Brandt, J.S.; Butsic, V.; Schwab, B.; Kuemmerle, T.; Radeloff, V.C. The relative effectiveness of protected areas, a logging ban, and sacred areas for old-growth forest protection in southwest China. Biol. Conserv. 2015, 181, 1–8. [Google Scholar] [CrossRef]
  24. Xu, W.R.; He, H.S.; Luo, X.; Huang, C.; Tang, Z.Q.; Liu, K.; Cong, Y.; Gu, X.N.; Zong, S.W.; Du, H.B. Long-term effects of commercial harvest exclusion on forest structure and aboveground biomass in the Great Xing’ an Mountains, China. Acta Ecol. Sin. 2017, 38, 1203–1215. [Google Scholar]
  25. Schumacher, S.; Bugmann, H. The relative importance of climatic effects, wildfires and management for future forest landscape dynamics in the Swiss Alps. Glob. Chang. Biol. 2006, 12, 1435–1450. [Google Scholar] [CrossRef]
  26. Gustafson, E.J.; Shvidenko, A.Z.; Sturtevant, B.R.; Scheller, R.M. Predicting global change effects on forest biomass and composition in south-central Siberia. Ecol. Appl. 2010, 20, 700–715. [Google Scholar] [CrossRef] [PubMed]
  27. He, H.S.; Gustafson, E.J.; Lischke, H. Modeling forest landscapes in a changing climate: Theory and application. Landsc. Ecol. 2017, 32, 1–7. [Google Scholar] [CrossRef]
  28. He, H.S. Forest landscape models: Definitions, characterization, and classification. For. Ecol. Manag. 2008, 254, 484–498. [Google Scholar] [CrossRef]
  29. Zhang, Y.; He, H.S.; Shifley, S.R.; Yang, J.; Palik, B.J. Evaluating the effects of alternative forest management plans under various physiographic settings using historical records as a reference. J. Environ. Manag. 2011, 92, 1618–1627. [Google Scholar] [CrossRef] [PubMed]
  30. Scheller, R.M.; Mladenoff, D.J. An ecological classification of forest landscape simulation models: Tools and strategies for understanding broad-scale forested ecosystems. Landsc. Ecol. 2007, 22, 491–505. [Google Scholar] [CrossRef]
  31. Liang, Y.; He, H.S.; Wang, W.J.; Fraser, J.S.; Wu, Z.; Xu, J. The site-scale processes affect species distribution predictions of forest landscape models. Ecol. Model. 2015, 300, 89–101. [Google Scholar] [CrossRef]
  32. Shifley, S.R.; He, H.S.; Lischke, H.; Wang, W.J.; Jin, W.; Gustafson, E.J.; Thompson, J.R.; Thompson, F.R.; Dijak, W.D.; Yang, J. The past and future of modeling forest dynamics: From growth and yield curves to forest landscape models. Landsc. Ecol. 2017, 32, 1–19. [Google Scholar] [CrossRef]
  33. Schleyer, C.; Lux, A.; Mehring, M.; Görg, C. Ecosystem Services as a Boundary Concept: Arguments from Social Ecology. Sustainability 2017, 9, 1107. [Google Scholar] [CrossRef]
  34. Carpenter, S.R.; Mooney, H.A.; Agard, J.; Capistrano, D.; Defries, R.S.; Díaz, S.; Dietz, T.; Duraiappah, A.K.; Oteng-Yeboah, A.; Pereira, H.M.; et al. Science for managing ecosystem services: Beyond the Millennium Ecosystem Assessment. Proc. Natl. Acad. Sci. USA 2009, 106, 1305–1312. [Google Scholar] [CrossRef] [PubMed]
  35. Xiao, J.; Liang, Y.; He, H.S.; Thompson, J.R.; Wang, W.J.; Fraser, J.S.; Wu, Z. The formulations of site-scale processes affect landscape-scale forest change predictions: A comparison between LANDIS PRO and LANDIS-II forest landscape models. Landsc. Ecol. 2016, 32, 1347–1363. [Google Scholar] [CrossRef]
  36. Ji, L.; Wang, Z.; Wang, X.; An, L. Forest insect pest management and forest management in China: An overview. Environ. Manag. 2011, 48, 1107–1121. [Google Scholar] [CrossRef] [PubMed]
  37. Standardization Administration of the People’s Republic of China. Regulation for Tending of Forest. People’s Republic of China Industry Standard: GB/T 15781-2009. Available online: http://www.zbgb.org/2/StandardDetail499132.htm (accessed on 12 May 2009).
  38. Standardization Administration of the People’s Republic of China. Code of Forest Harvesting. People’s Republic of China Industry Standard: LY/T 1646-2005. Available online: http://www.zbgb.org/25/StandardDetail2046575.htm (accessed on 16 August 2005).
  39. Wang, W.J.; He, H.S.; Spetich, M.A.; Shifley, S.R.; Thompson, F.R.; Dijak, W.D.; Wang, Q. A framework for evaluating forest landscape model predictions using empirical data and knowledge. Environ. Model. Softw. 2014, 62, 230–239. [Google Scholar] [CrossRef]
  40. Wang, W.J.; He, H.S.; Fraser, J.S.; Thompson, F.R., III; Shifley, S.R.; Spetich, M.A. LANDIS PRO: A landscape model that predicts forest composition and structure changes at regional scales. Ecography 2014, 37, 225–229. [Google Scholar] [CrossRef]
  41. Yoda, K. Self-thinning in overcrowded pure stands under cultivated and natural conditions (Intraspecific competition among higher plants. XI). J. Biol. Osaka City Univ. 1963, 14, 107–129. [Google Scholar]
  42. Wang, W.J.; He, H.S.; Spetich, M.A.; Shifley, S.R.; Thompson, F.R.; Larsen, D.R.; Fraser, J.S.; Yang, J. A large-scale forest landscape model incorporating multi-scale processes and utilizing forest inventory data. Ecosphere 2013, 4, 1–22. [Google Scholar] [CrossRef]
  43. Fraser, J.S.; He, H.S.; Shifley, S.R.; Wang, W.J.; Thompson, F.R., III. Simulating stand-level harvest prescriptions across landscapes: LANDIS PRO harvest module design. Can. J. For. Res 2013, 43, 972–978. [Google Scholar] [CrossRef]
  44. Bu, R.; He, H.S.; Hu, Y.; Chang, Y.; Larsen, D.R. Using the LANDIS model to evaluate forest harvesting and planting strategies under possible warming climates in Northeastern China. For. Ecol. Manag. 2008, 254, 407–419. [Google Scholar] [CrossRef]
  45. He, H.S.; Hao, Z.; Mladenoff, D.J.; Shao, G.; Hu, Y.; Chang, Y. Simulating forest ecosystem response to climate warming incorporating spatial effects in north-eastern China. J. Biogeogr. 2005, 32, 2043–2056. [Google Scholar] [CrossRef]
  46. Luo, X.; He, H.S.; Liang, Y.; Wang, W.J.; Wu, Z.; Fraser, J.S. Spatial simulation of the effect of fire and harvest on aboveground tree biomass in boreal forests of Northeast China. Landsc. Ecol. 2014, 29, 1187–1200. [Google Scholar] [CrossRef]
  47. Elliott, K.J.; Knoepp, J.D. The effects of three regeneration harvest methods on plant diversity and soil characteristics in the southern Appalachians. For. Ecol. Manag. 2005, 211, 296–317. [Google Scholar] [CrossRef]
  48. Huang, C.; He, H.S.; Hawbaker, T.J.; Liang, Y.; Gong, P.; Wu, Z.; Zhu, Z. A coupled modeling framework for predicting ecosystem carbon dynamics in boreal forests. Environ. Model. Softw. 2017, 93, 332–343. [Google Scholar] [CrossRef]
  49. Shanin, V.; Komarov, A.; Mäkipää, R. Tree species composition affects productivity and carbon dynamics of different site types in boreal forests. Eur. J. For. Res. 2014, 133, 273–286. [Google Scholar] [CrossRef]
  50. Zhou, G.; Liu, S.; Li, Z.; Zhang, D.; Tang, X.; Zhou, C.; Yan, J.; Mo, J. Old-growth forests can accumulate carbon in soils. Science 2006, 314, 1417. [Google Scholar] [CrossRef] [PubMed]
  51. Burton, J.I.; Ares, A.; Mulford, S.E.; Olson, D.H.; Puettmann, K.J. Above-ground carbon storage, down wood, and understory plant species richness after thinning in western Oregon. USDA For. Serv. Gen. Tech. Rep. PNW 2013, 880, 91–100. [Google Scholar]
  52. Gray, A.N.; Spies, T.A.; Easter, M.J. Microclimatic and soil moisture responses to gap formation in coastal Douglas-fir forests. Can. J. For. Res 2002, 32, 332–343. [Google Scholar] [CrossRef]
  53. Jin, W.; He, H.S.; Shifley, S.R.; Wang, W.J.; Kabrick, J.M.; Davidson, B.K. How can prescribed burning and harvesting restore shortleaf pine-oak woodland at the landscape scale in central United States? Modeling joint effects of harvest and fire regimes. For. Ecol. Manag. 2018, 410, 201–210. [Google Scholar] [CrossRef]
  54. Hu, H.-Q.; Luo, B.-Z.; Wei, S.-J.; Wei, S.-W.; Sun, L.; Luo, S.-S.; Ma, H.-B. Biomass carbon density and carbon sequestration capacity in seven typical forest types of the Xiaoxing’an Mountains, China. Chin. J. Plant Ecol. 2015, 39, 140–158. [Google Scholar]
  55. Ma, J.; Xiao, X.; Bu, R.; Doughty, R.; Hu, Y.; Chen, B.; Li, X.; Zhao, B. Application of the space-for-time substitution method in validating long-term biomass predictions of a forest landscape model. Environ. Model. Softw. 2017, 94, 127–139. [Google Scholar] [CrossRef]
  56. Thompson, J.R.; Foster, D.R.; Scheller, R.; Kittredge, D. The influence of land use and climate change on forest biomass and composition in Massachusetts, USA. Ecol. Appl. 2011, 21, 2425–2444. [Google Scholar] [CrossRef] [PubMed]
  57. Wang, W.J.; He, H.S.; Thompson, F.R.; Fraser, J.S.; Dijak, W.D. Changes in forest biomass and tree species distribution under climate change in the northeastern United States. Landsc. Ecol. 2017, 32, 1399–1413. [Google Scholar] [CrossRef]
  58. Li, X.; He, H.S.; Wu, Z.; Liang, Y.; Schneiderman, J.E. Comparing effects of climate warming, fire, and timber harvesting on a boreal forest landscape in northeastern China. PLoS ONE 2013, 8. [Google Scholar] [CrossRef] [PubMed]
  59. Robertw, M.; Patrick, H.; Steve, B.; Douglas, C.; Fred, D.; Christopher, G.; Edmund, G.; Johna, H.; Nathan, M.C.; Michael, M. Forest management solutions for mitigating climate change in the United States. J. For. 2008, 106, 115–118. [Google Scholar]
  60. Ma, J.; Hu, Y.; Bu, R.; Chang, Y.; Deng, H.; Qin, Q. Predicting impacts of climate change on the aboveground carbon sequestration rate of a temperate forest in northeastern China. PLoS ONE 2014, 9. [Google Scholar] [CrossRef] [PubMed]
Figure 1. The location of the study area and forest management area map in the Classified Forest Management policy. The study area follows the borders of forestry bureaus.
Sustainability 10 01071 g001
Figure 2. Comparison between initiated and observed aboveground biomass at year 2010. Observed aboveground biomass was estimated by forest inventory data. N, the number of sampling plots.
Sustainability 10 01071 g002
Figure 3. Aboveground forest biomass in the H, NCH, and LT scenarios across the simulation period at the landscape level. Error bands represent the variance among the five replicates. H, the Classified Forest Management policy; NCH, the Commercial Harvest Exclusion policy; LT, mitigation management.
Sustainability 10 01071 g003
Figure 4. Changes in species’ biomass in the H, NCH, and LT scenarios over the simulation period at the landscape level. S, M, L represent the short-, medium-, and long-term, respectively. Error bands represent the variance among the five replicates. H, the Classified Forest Management policy; NCH, the Commercial Harvest Exclusion policy; LT, mitigation management.
Sustainability 10 01071 g004
Figure 5. Aboveground biomass by tree species for different land types under the H, NCH, and LT scenarios. Land type 2 represents the land type of the northern slope with an elevation greater than 600 m and latitude over 48°. Land type 8 represents the land type of the northern slope with elevation less than 600 m and latitude less than 48°. C, conifer species; HW, hardwood species. H, the Classified Forest Management policy; NCH, the Commercial Harvest Exclusion policy; LT, mitigation management.
Sustainability 10 01071 g005
Figure 6. The spatial patterns of aboveground forest biomass for the years 2010, 2030, 2060, and 2100 in the H, NCH, and LT scenarios. H, the Classified Forest Management policy; NCH, the Commercial Harvest Exclusion policy; LT, mitigation management.
Sustainability 10 01071 g006
Figure 7. Abundance of each age class in the H, NCH, and LT scenarios across the simulation period at the landscape level. H, the Classified Forest Management policy; NCH, the Commercial Harvest Exclusion policy; LT, mitigation management.
Sustainability 10 01071 g007
Figure 8. Changes in tree species’ Shannon–Wiener index in the H, NCH, and LT scenarios over the simulation period at the landscape level. Error bands represent the variance among the five replicates. H, the Classified Forest Management policy; NCH, the Commercial Harvest Exclusion policy; LT, mitigation management.
Sustainability 10 01071 g008
Figure 9. Changes of forest age class’ Shannon–Wiener index in the H, NCH, and LT scenarios throughout the simulation period at the landscape level. Error bands represent the variance among the five replicates. H, the Classified Forest Management policy; NCH, the Commercial Harvest Exclusion policy; LT, mitigation management.
Sustainability 10 01071 g009
Table 1. The life history attributes for major species in the Small Khingan Mountains, Northeastern China.
Common Name and SpeciesMT/LongSTMDMDBHMSDINPGS
Korean pine, Pinus koraiensis40/300415011055020
Korean spruce, Picea koraiensis and Picea jezoensis30/30041509060020
Khingan fir, Abies nephrolepis30/30041508565020
Larch, Larix gmelinii20/30023009565030
Manchurian ash, Fraxinus mandschurica30/250330010060025
Manchurian walnut, Juglans mandshurica20/25022009065025
Amur corktree, Phellodendron amurense20/25033009565025
Mongolian oak, Quercus mongolica20/30022009560020
Black elm, Ulmus davidiana20/25038009060025
Mono maple, Acer mono20/20032006070025
Ribbed birch, Betula costata20/25038009065025
Dahur birch, Betula dahurica15/15028005075025
Amur linden, Tilia amurensis30/30032008565020
White birch, Betula platyphylla15/150120005080030
Poplar, Populus davidiana15/150120006080030
MT, mature, age of sexual maturity of tree species (years); Long, longevity, mean maximum age of tree species (years); ST, shade tolerance class (including 1–5, 1 and 5 refer to the least and the most tolerance, respectively); MD, maximum dispersal distance (m); MDBH, maximum diameter at breast height (cm); MSDI, maximum stand density index (number of standard trees per ha, with respect to 10-inch trees); NPGS, number of potential germination seeds per mature tree (number/single cell).
Table 2. The harvest parameters of forest management scenarios in LANDIS PRO.
Forest Management ScenariosRemoval MethodPercent Area Treated, Minimum/Target Stand Stocking (m3 ha−1)
SEWFGEWFCF
HThinning from above15%, 52/4625%, 57/46
Thinning from below10%, 46/4410%, 46/44
NCHThinning from below10%, 46/4410%, 46/44
LTThinning from below15%, 46/4415%, 46/44
H, the Classified Forest Management policy; NCH, the Commercial Harvest Exclusion policy; LT, mitigation management; SEWF, Special Ecological Welfare Forest; GEWF, General Ecological Welfare Forest; CF, Commercial Forest.

