Analysis of Heating and Cooling Loads of Electrochromic Glazing in High-Rise Residential Buildings in South Korea

1
Sustainable Building Research Center, Hanyang University, 55 Hanyangdaehak-ro, Sangrok-gu, Ansan-si 15588, Gyeonggi-do, Korea
2
School of Architecture & Architectural Engineering, Hanyang University, 55 Hanyangdaehak-ro, Sangrok-gu, Ansan-si 15588, Gyeonggi-do, Korea
3
Research Center of Technology, ALU ENC Co., 10, Baekjegobun-ro 9-gil, Songpa-gu 05562, Seoul, Korea
*
Author to whom correspondence should be addressed.
Sustainability 2018, 10(4), 1121; https://doi.org/10.3390/su10041121
Submission received: 22 February 2018
/
Revised: 30 March 2018
/
Accepted: 31 March 2018
/
Published: 9 April 2018
(This article belongs to the Special Issue Advanced Innovative Solutions for Final Design in Terms of Energy Sustainability of Nearly/Net Zero Energy Buildings (nZEB))
Abstract
:This study compares the impact of the recently developed electrochromic glazing technology on load reduction by comparing it with the double-glazing and shading devices that are sold commercially for high-rise residential buildings in Korea. These buildings are similar to large office buildings in terms of their high window-to-wall ratio. The energy consumption of such buildings was simulated using an analytical model of a high-rise residential building. The patterns between the heating and cooling loads were found to be similar to that of office buildings, in that the cooling load was considerably higher than the heating load. This study hypothesizes that the load reduction performance of electrochromic glazing with variable solar control and high solar radiation rejection is superior to that of existing double-glazing products and shading devices. This hypothesis was tested by analyzing the cooling and heating loads of buildings with different types of double glazings. Bleached electrochromic glazing exhibited lower transmittance than colored glass double glazing, low-e double glazing, and double glazing with a shading device, and is thus not effective in reducing heating load. Colored electrochromic glazing provided higher solar radiation rejection than colored glass double glazing and low-e double glazing, and thus is effective in reducing cooling load.
1. Introduction
1.1. Research Background and Objective
Windows and doors are the only glazing systems that can capture solar energy. They can also serve as a medium that reduces building load and improves the indoor environment through appropriate inflow and the rejection of solar radiation [1]. As glazing systems, windows and doors require separate shading devices for solar control, such as roll shades or blinds. However, smart glass, which does not need any separate shading device to control the optical properties of glass and, thus, solar radiation, has recently been actively researched in the literature. Types of smart glass include electrochromic, PDLC (polymer-dispersed liquid crystal) [2], and SPD (suspended particle device) [3]. Of these, this study analyzes the optical properties of electrochromic glazing and its effect on HVAC (Heating, ventilation, air conditioning) load reduction in buildings [4,5].
Regarding the main characteristics of electrochromic glazing, which are dealt with in this study, transmittance can be controlled in stages depending on the amount of electricity that is supplied to either the cathode (−) or the anode (+), and the scope of transmittance control covers the area of visible and near-infrared rays, which account for the largest portion of energy in the solar spectrum [6]. Therefore, with appropriate control according to changes in the outdoor environment using the characteristics of selective transmittance control, it is possible to contribute significantly to a reduction in heating and cooling loads as well as the energy used for lighting [7,8]. Based on these characteristics, studies have been actively conducted on electrochromic glazing control to reduce the amount of energy consumed by buildings using such data as indoor–outdoor temperatures and the amount of solar radiation and illumination. Moreover, the daylight glare index and lighting energy have been investigated in the context of indoor light to represent the characteristics that can control the range of visible rays [6,9]. According to the results of simulations of office buildings in the United States (US), 10–20% of the energy saving effect is obtained at the perimeters of buildings [10], and at least 54% of the energy can be saved in a Mediterranean climate [11]. A study showed that 37–48% more lighting energy can be saved compared with manual control-type blinds [12]. Furthermore, several simulations and experimental studies are ongoing on the performance of electrochromic glazing technology [13]. A few recent studies have examined electrochromic glazing that can intensively control near-infrared (NIR) rays. It maintains a visually clear state and secures visible rays related to lighting energy while controlling only the NIR rays that influence cooling and heating energy [14]. Moreover, photovoltaic-related electrochromic glazing is being developed, which is colored using power charged on batteries and produced using photovoltaic energy. Thus, it does not require a separate power supply, and is an eco-friendly product that is easy to build and does not consume operation energy [15]. Furthermore, electrochromic glazing can be controlled on smartphones using Wi-Fi in association with the Internet of Things. This provides convenient functions compared with existing shading devices [16]. Further, apart from electrochromic glazing with a glass substrate, electrochromic films with a web-coated flexible polyester (PET) substrate have also been developed, and have various applications [17].
Another advantage of electrochromic glazing is that unlike the blinds or roll shades installed indoors, it blocks solar radiation through glass, which is the outermost part of an insulated glazing unit. As a result, it is more effective at reducing the cooling load, owing to its high solar radiation rejection. Moreover, it has a memory effect whereby it maintains its state once supplied with electric power once, without requiring any further power once it is colored or bleached. This minimizes the operation energy that is needed. However, the drawback of most electrochromic glazing products is their low speed of response. It requires five minutes for a 10 cm × 30 cm glass [18] to be colored, and eight minutes and 12 min for a 1.2 m × 0.8 m glass to be colored and bleached, respectively [19]. On the contrary, a few recently released electrochromic glazing products can be colored within three minutes. These products show promise in enhancing the performance of commercialized products in the future [20].
The objective of this study is to analyze the optical properties of test products for the commercialization of large-area electrochromic glazing for the first time in Korea, to the best of the authors’ knowledge, and determine whether the optical properties are effective at reducing the energy consumed by buildings. High-rise residential buildings in Korea with high window-to-wall ratios were assessed to this end. For performance comparison, this study analyzed the building load performance of existing double-glazing and shading devices that are available for commercial use in Korea.
1.2. Research Method and Scope
We created electrochromic glazing specimens to obtain the transmittance, reflectance, and absorptance for each range of spectra through measurements using a spectrum analyzer. Using raw data, we obtained the input data for WindowMaterial:Glazing, which is a component of structural glass on EnergyPlus, by employing the LBNL Optic 5.1 tool. We thus formed the double glazing, and obtained heat and optical data. The data for commercially available glass were obtained from the data for glass that is distributed in Korea on IGDB provided by LBNL Window 7.4.
To analyze building loads using the heat and optical data, we used EnergyPlus8.5, a dynamic building energy analysis program, to model a high-rise residential building with a high window-to-wall ratio because of curtain walls, located in Seoul, Korea. We then applied 10 cases, including colored double glazing, low-e double glazing, double glazing with a shading device, and electrochromic double glazing on EnergyPlus, and comparatively analyzed building load performance through a parametric study.
We focused on window heat gain, window heat loss, and hourly load change on typical days of winter and summer based on a design day. We hence analyzed the effects of the characteristics of heat flow of each glazing on the load. We ultimately analyzed monthly and annual loads, which we used to comparatively analyze the performance of electrochromic glazing and commercially available double-glazing and shading devices in terms of building load. Figure 1 show the research guideline and flowchart.
2. Analysis of Optical Properties of Electrochromic Glazing
Electrochromic glazing consists of a transparent conductive object, a colored layer, an ion storage layer, and an electrolyte. In this study, we used TEC 10 (manufactured by Pilkington) as a transparent conductive object with glass on which electric current can be applied. We coated the colored layer with tungsten oxide (WO3) and the ion storage layer with nickel tungsten (NiW) using a sputtering device that could coat areas of up to 1500 mm × 1800 mm. We used LICLO4 in gel form for electrolytes for ion movement, and formed a silver paste and bus bar electrodes to provide electrical power.
Specimens of size of 50 mm × 50 mm were fabricated as shown in Figure 2 to analyze the optical properties of electrochromic glazing. We then measured transmittance and reflectance at a solar spectrum wavelength of 0.3–2.5 µm (0.005-µm intervals) using a spectrum analyzer. These measurements were performed with electrochromic glazing in the bleached and colored states at a voltage of 2 V in each state.
To enter the raw data of transmittance and reflectance extracted through the spectrum analyzer for the WindowMaterial:Glazing component of EnergyPlus, we imported the data on the LBNL Optic 5.1 program, and extracted the spectral average data of solar transmittance, solar reflectance, visible transmittance, and visible reflectance, as shown in Table 1.
Optical properties were analyzed using spectroscopic analysis and the Optic 5.1 tool, and we found a considerable difference in the solar transmittance (Tsol) and visible transmittance (Tvis) between the bleached and colored states. As shown in Table 1, solar transmittance (Tsol) could be adjusted by 41.6%, from 48.1% when bleached to 6.5% when colored, and visible transmittance (Tvis) could be adjusted by 52.8%, from 64.8% when bleached to 12% when colored.
Figure 3, Figure 4 and Figure 5 show the results of a spectroscopic analysis of electrochromic glazing and the spectral data of clear glass and single low-e glass provided by Optic5.1.
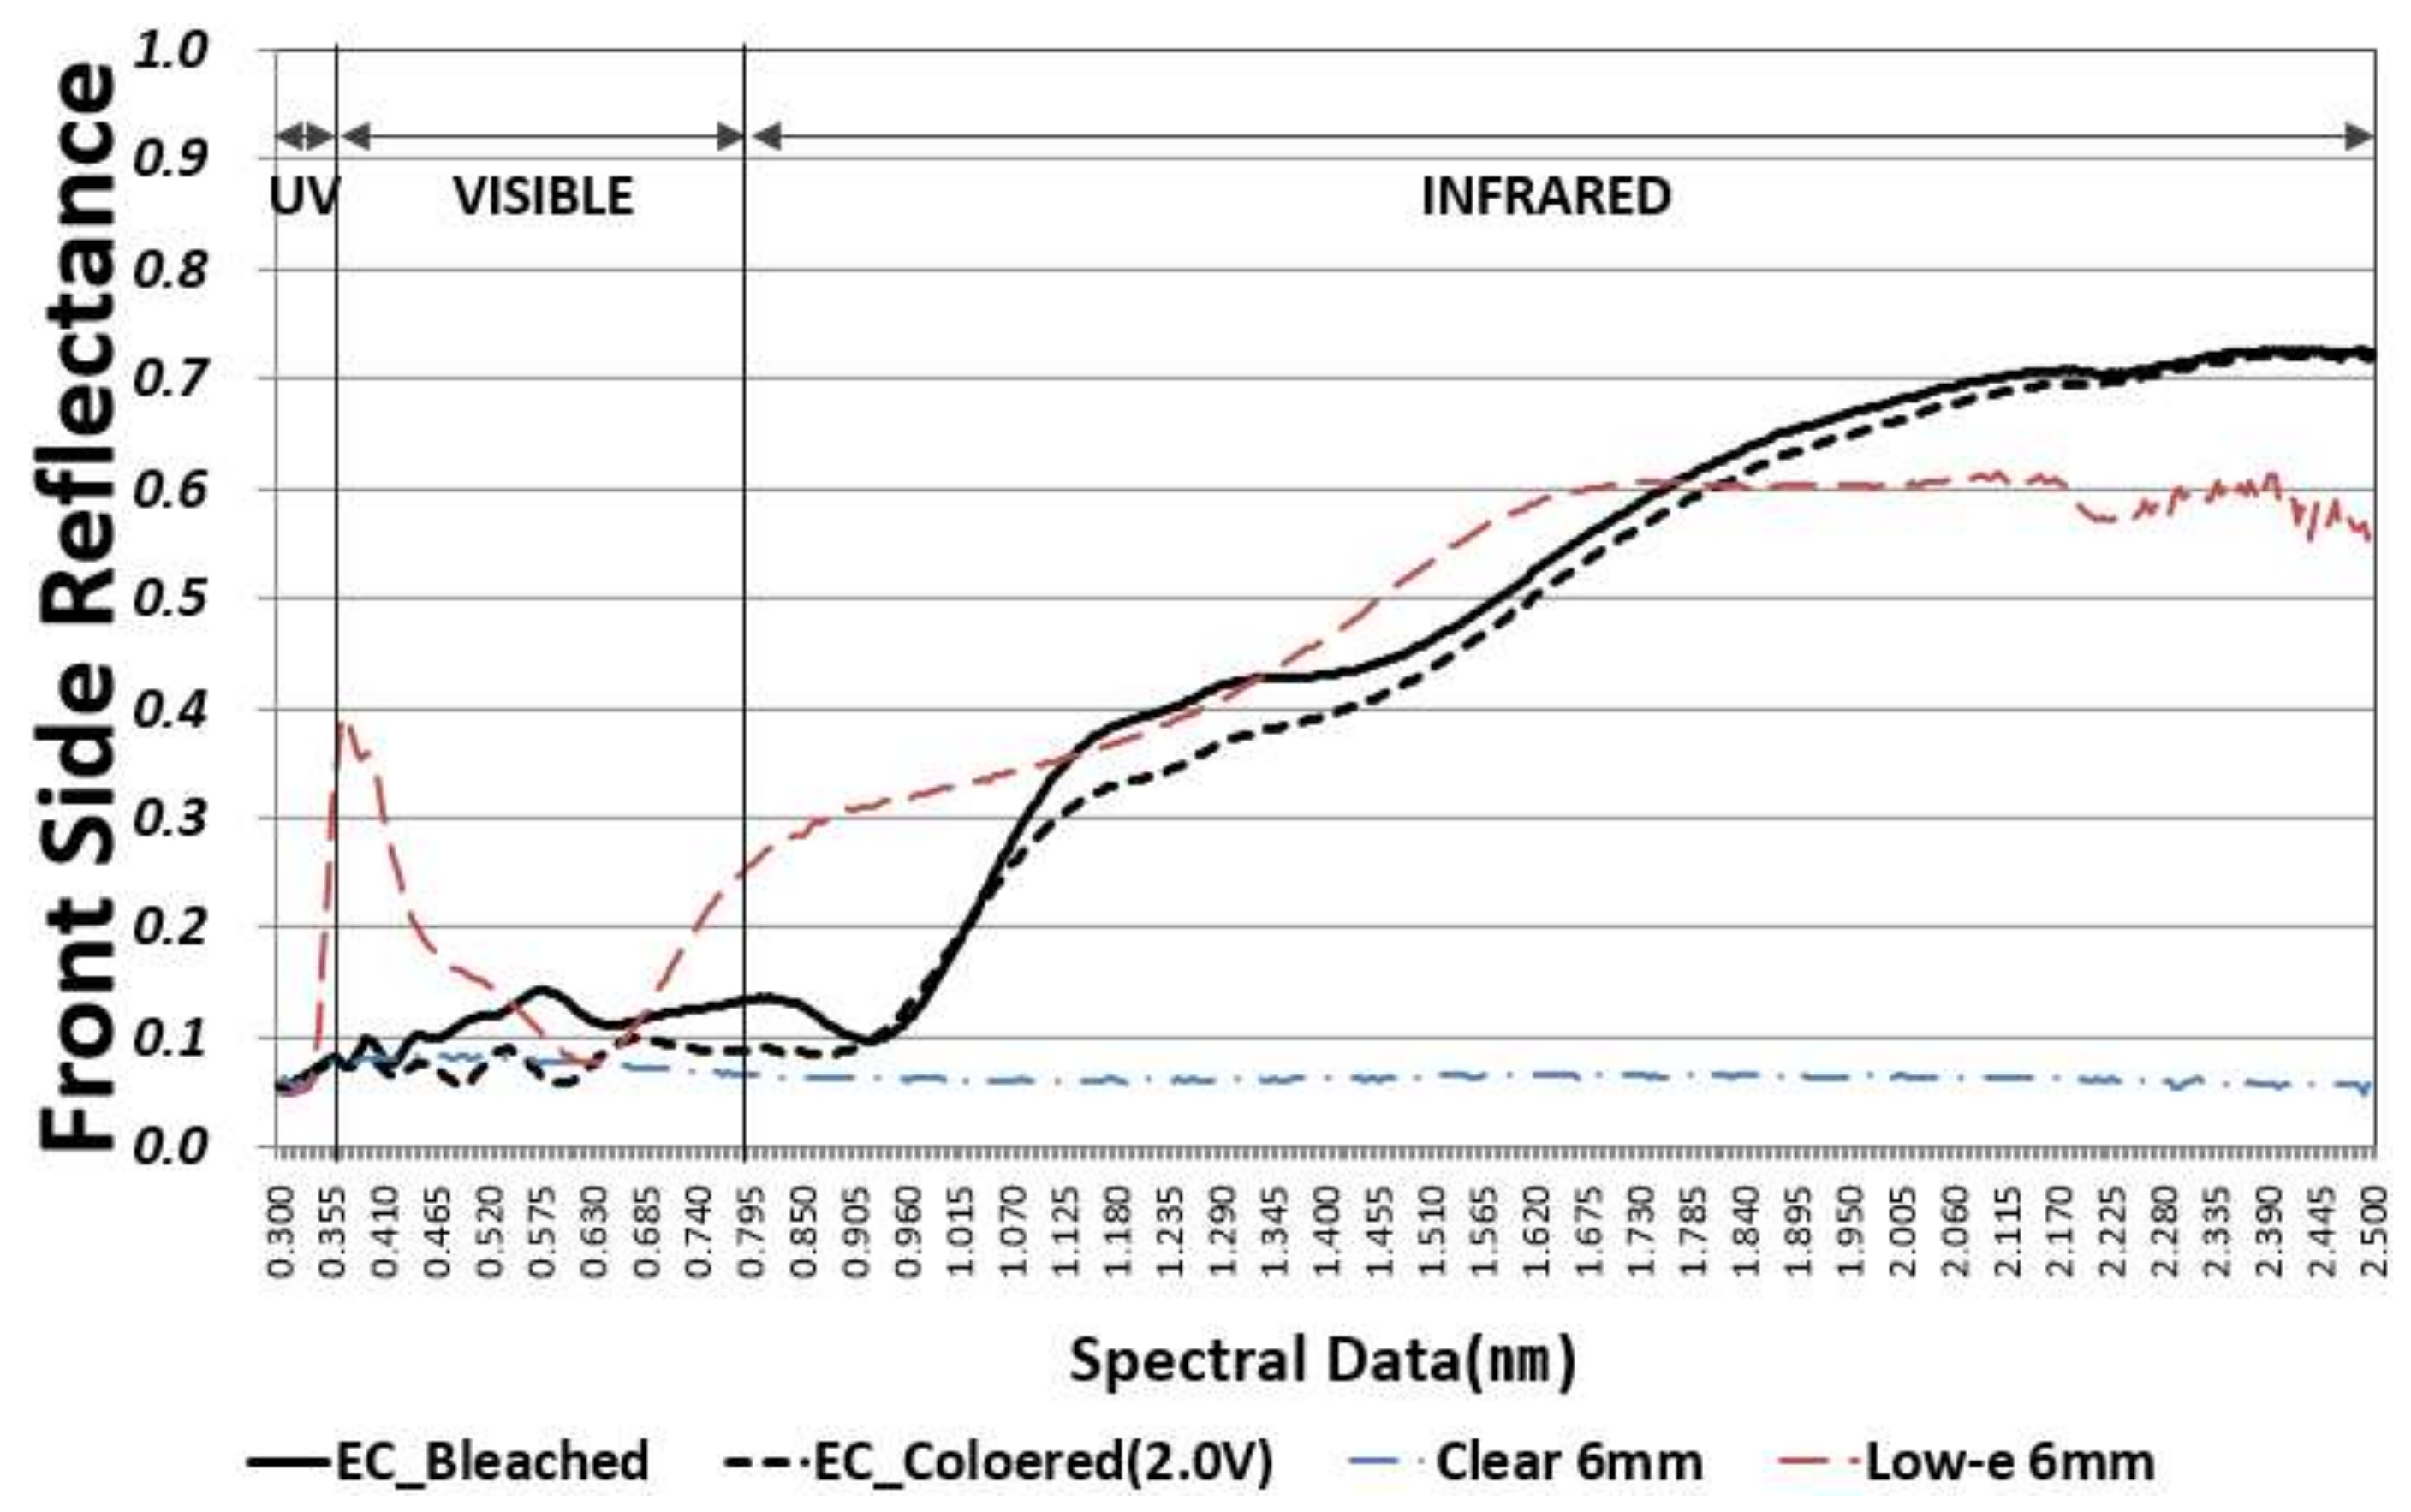
Building load can be predicted using spectral data. According to the transmittance graph shown in Figure 3, electrochromic glazing exhibited a higher visible ray rejection in the colored state than in the clear glass or single low-e glass state, and similar rejection to that of single low-e glass in the NIR range. Its total solar transmittance (Tsol) was low, and thus, it is effective in terms of cooling load reduction in the summer. In bleached state, its visible ray and NIR transmittance was higher than that of single low-e glass, and thus it is more likely to reduce heating load. However, its transmittance was lower than that of clear glass, and thus it is less likely to reduce heating load. Moreover, the front and back-side reflectance graphs provided in Figure 4 and Figure 5 show that even though the reflectance of electrochromic glazing was lower than that of single low-e glass in the colored state, transmittance was low primarily due to absorption.
Optical properties and building load can be predicted through spectroscopic analysis. However, for more accurate predictions, it is necessary to analyze the solar heat gain coefficient of the glazing system by considering the penetration, absorption, and reflection of glass, and to conduct analyses based on dynamic building energy simulations, which are described in the following section.
3. Simulation Conditions
3.1. Overview of Analytical Simulation Model
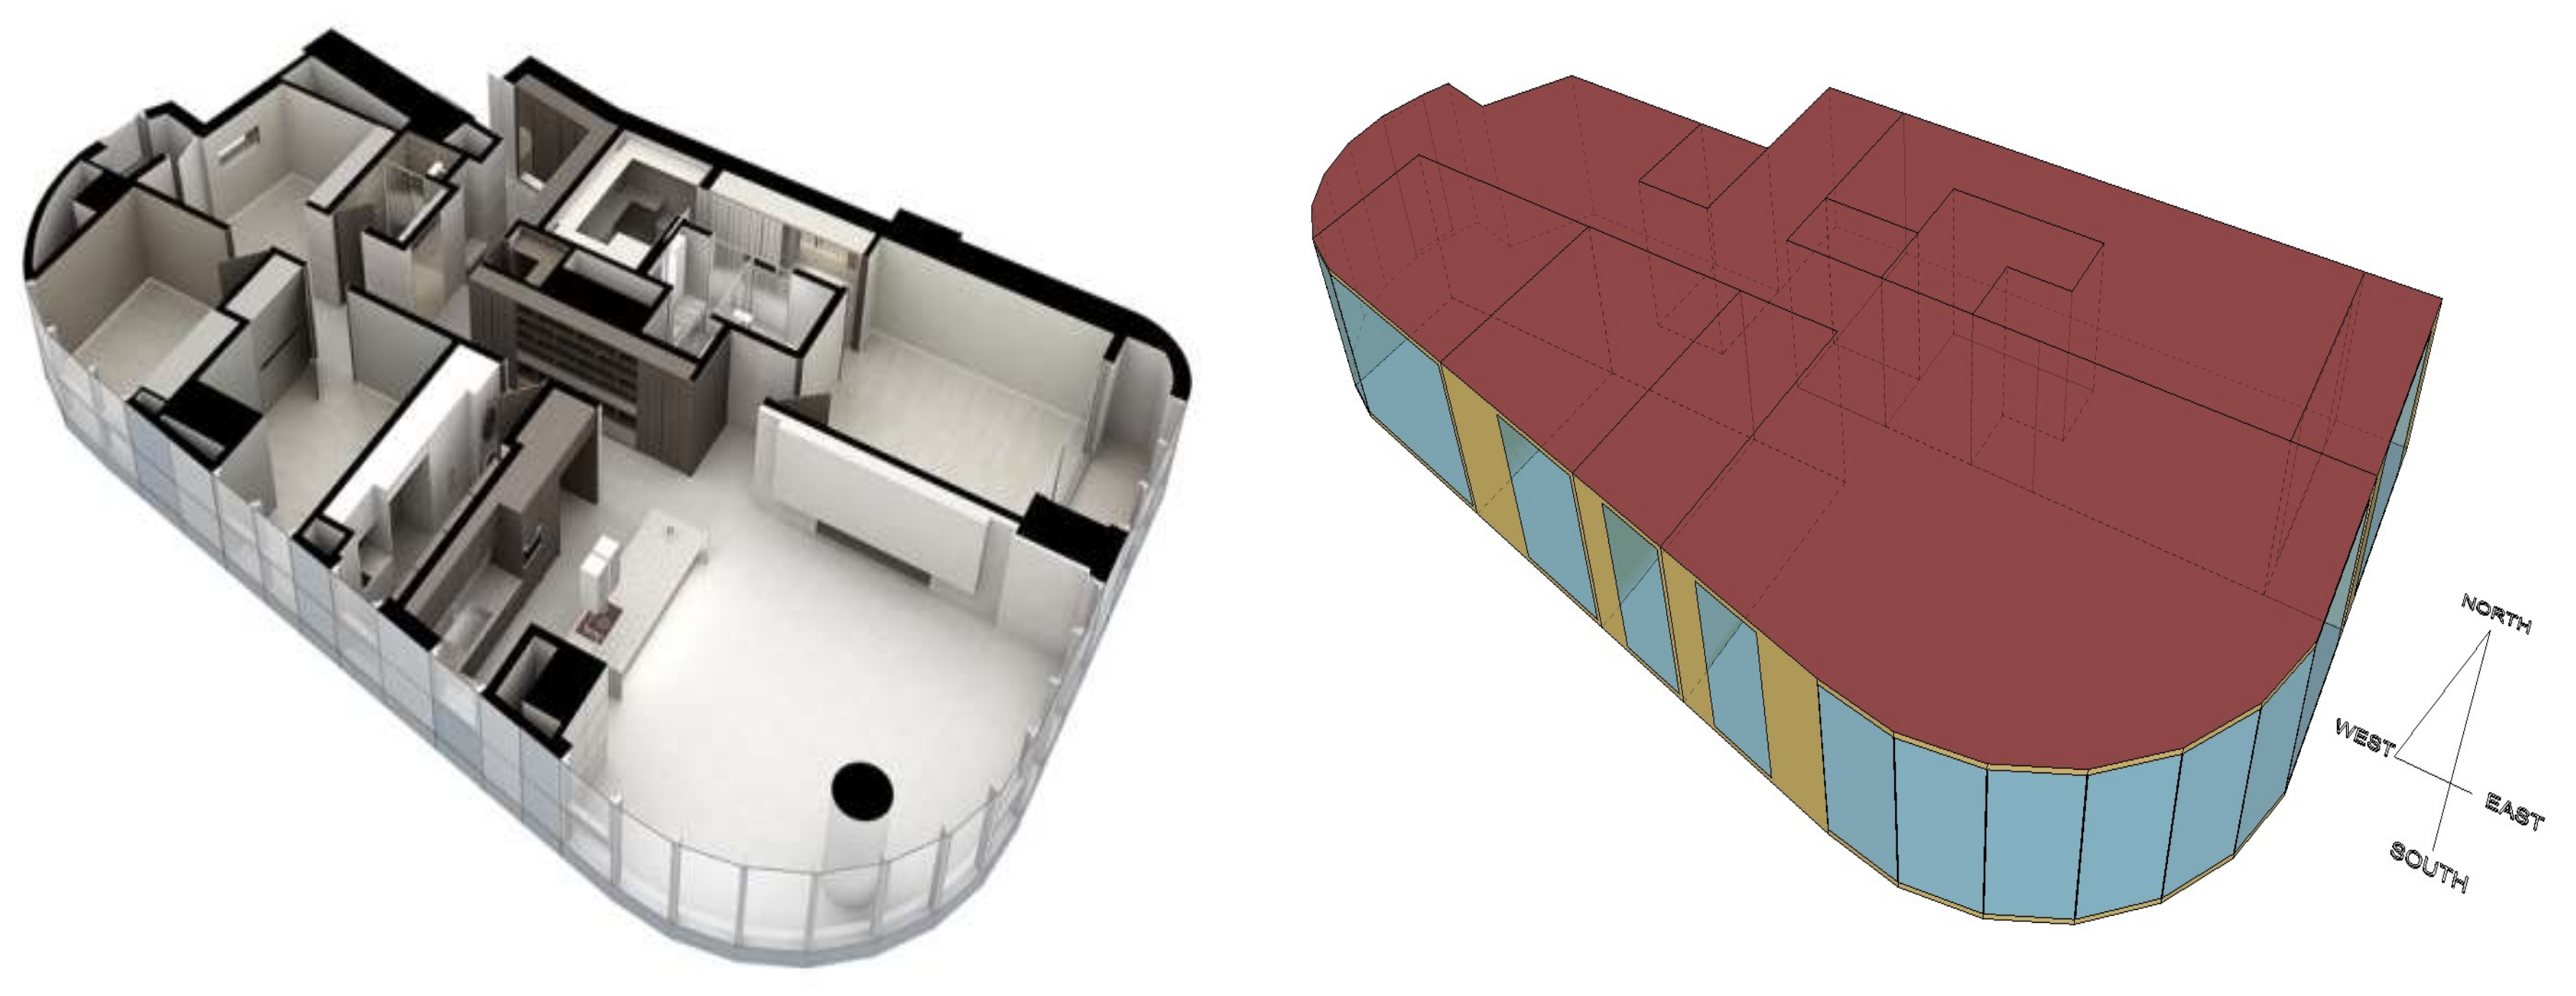
The facades of recently constructed high-rise residential buildings in Korea are similar to those of office buildings, as they use curtain wall windows and doors with high window-to-wall ratios in order to provide a view. We set as our hypothesis the claim that high-rise residential buildings have high cooling loads, and by applying electrochromic glazing with variable solar control and high solar radiation rejection, this load can be significantly reduced in comparison with the reduction obtained by using double-glazing products or shading devices. Accordingly, we selected a high-rise residential building recently constructed in Seoul as an analytical model, as shown in Figure 6.
EnergyPlus 8.5 (developed by the DOE (Department of Energy)) was used as simulation tool [21]. EnergyPlus is based on the heat balance equation, and thus can calculate heat transfer by using the conduction, convection, and radiation of windows and doors as well as the penetration, reflection, and absorption of solar radiation [22,23,24,25,26,27,28]. It also allows for a detailed analysis of heat transfer between the shading device, and doors and windows [29].
The floor area of the analytical model was 215.12 m2, the air conditioning area was 181.63 m2 (84.4%), the height of the living space was 2.9 m, and the area occupied by the windows was 67.7 m2 on an exterior wall with an area of 106.5 m2. Thus, the window-to-wall ratio was 63.5%.
The analytical mode was constructed based on a typical floor. The ceilings, floors, and northern side wall were set as adiabatic boundaries. The southern, eastern, and unclear western exterior walls followed the insulation standards set by the Standard for Energy Saving Design in Buildings (2016), as shown in Table 2. The southern, eastern, and western windows had clear double glazing (6 mm clear + 12 mm air + 6 mm clear), with a heat transmission coefficient of 2.685 W/m2 K, a solar heat gain coefficient of 0.714, and a visible ray transmittance of 0.790. Clear double glazing was applied to analyze the load of the baseline, and the following section describes the application of different types of glass.
The temperatures set for the model were 22 °C and 28 °C, based on the indoor temperature standard for the cooling and heating systems in the Standard for Energy Saving Design in Buildings [30]. The heating period was assumed to span from October to March, and the cooling period was assumed to span from May to September. Weather data for Seoul were used. The city has a continental climate where the annual variation in temperature is as high as 30 °C, as high pressure from the Eurasian continent dominates the winter season, and oceanic air masses at high temperature and humidity significantly influence the weather in the summer. The IdealLoadsAirSystem (provided by EnergyPlus) was applied for load analysis of the HVAC system to eliminate interference by system variables as much as possible. Using the IdealLoadsAirSystem, the cooling and heating loads required in the zone were processed by a virtual air conditioning system with infinite capacity, and load calculation was performed using only the difference in enthalpy between the specified air supply and the mixed (ventilation + outside) air.
The internal heat gain is shown in Table 3 with reference to the standard of ASHRAE (American Society of Heating, Refrigerating and Air-Conditioning Engineers, Inc.) fundamentals (2009) [31]. Multifamily two-zone (bedroom and other rooms) provided by the schedules of the datasets in EnergyPlus was applied for the internal heat gain schedules of the body, the lighting, and the equipment [32]. Outdoor air volume was set to 1.1 m3/m2 h, which is in accordance with building energy rating certificate guidelines [30].
3.2. Analysis of Building Load Characteristics of Analytical Model
As stated earlier, we hypothesize that the facades of high-rise residential buildings in Korea are similar to those of office buildings, and thus have high cooling loads. We found through the building load simulation that the heating load was 4285.1 kWh/year (16.0%), and the cooling load was 22,490.0 kWh/year (84%), as shown in Figure 7, Table 4.
The energy consumption for heating and cooling may be different depending on the operating conditions or efficiency of the systems. However, as the systems are operated using IdealLoadsAirSystem, and their performance and relevant conditions are excluded, the load that is needed to continuously maintain the optimum temperature in light of indoor comfort was larger for cooling, as presumed in the hypothesis.
The cooling load was high, because glass constitutes a large portion of the exterior wall, and thus the internal heat gain owing to solar penetration was dominant. On the contrary, in the analytical model, the heating load was reduced by increasing the internal heat gain through solar penetration. This is explained further in Section 4.
Thus, for Korean high-rise residential buildings with high window-to-wall ratios, solar control may be key to reducing the building’s energy consumption. We aim to test the second hypothesis, that electrochromic glazing with variable solar control and high solar radiation rejection is more effective at reducing the load on buildings compared with existing double-glazing and shading devices.
3.3. Composition of Double-Glazing and Shading Devices for Comparative Analysis
We collected data concerning the heat and optical properties of commercialized double-glazing and shading devices to analyze the building performance of electrochromic glazing in terms of reducing the energy consumption of buildings. IGDB (LBNL) was used for data collection, and Window 7.2 (LBNL) was used to obtain the data through double-glazing composition.
For the first category, green, blue, and gray-colored glass was layered with clear glass to form ALT-01, 02, and 03 to compare with the colored glass that was already installed in the given building. To compare its performance with electrochromic glazing on equal terms, the glazing was layered with clear glass to form ALT-08.
To compare with low-e glass, which was the second category, single low-e and double low-e glass was layered with clear glass to form ALT-04 and 05, respectively. “Single” and “double” here represent the number of soft low-e coatings. Emissivity decreased as the number of coatings increased; this lowered the solar heat gain coefficient (SHGC) and the heat transmission coefficient. We used ALT-08 data to compare the performance on equal terms with low-e glass.
We selected Venetian blinds and roll shades as the shading devices for the third category. These devices are used in high-rise residential buildings in Korea. We formed ALT-06 and 07 by integrating them with the double glazing, which was a combination of single low-e glass and clear glass. Both shading devices were assumed to be installed indoor, open in winter (October–March), and closed in summer (May–September), with a focus on energy reduction. Moreover, the slats of the Venetian blinds were completely shut in the closed state. The reflectance of the blinds and roll shades was set to 80%, and their transmittance was set to 0%. For transmittance, we selected the condition where load reduction for cooling was the highest based on the results of past studies [33]. Electrochromic glazing consisted of the double glazing that was a combination of electrochromic glazing and single low-e glass for the comparative analysis of performance on equal terms with the shading devices. It was assumed that the electrochromic glazing was bleached in the winter and colored in the summer for energy reduction. Table 5 and Figure 8 show data concerning the heat and the optical properties of each type of double glazing for the comparative evaluation of load reduction performance.
4. Results and Discussion
4.1. Performance Evaluation of Hourly Heating and Cooling Loads
For the evaluation of hourly heating and cooling loads, we analyzed the hourly changes in heating load according to the type of double glazing under the conditions obtained on the design day using meteorological data for Seoul. As described above, the indoor cooling and heating temperatures were set to 22 °C and 28 °C, respectively, using the IdealLoadsAirSystem. This was done to calculate the heating and cooling loads that were necessary to reach the indoor temperature, based on which we can check for the reduction in heating and cooling loads according to type of double glazing.
4.1.1. Comparative evaluation of hourly heating load performance
Figure 9 and Table 6 show a comparison of the performance of different types of double glazing that are listed in Table 5 in terms of reducing heating load. Figure 10, Figure 11 and Figure 12 show the changes in heating load for each type of double glazing. This load is always high when electrochromic glazing is applied, regardless of time.
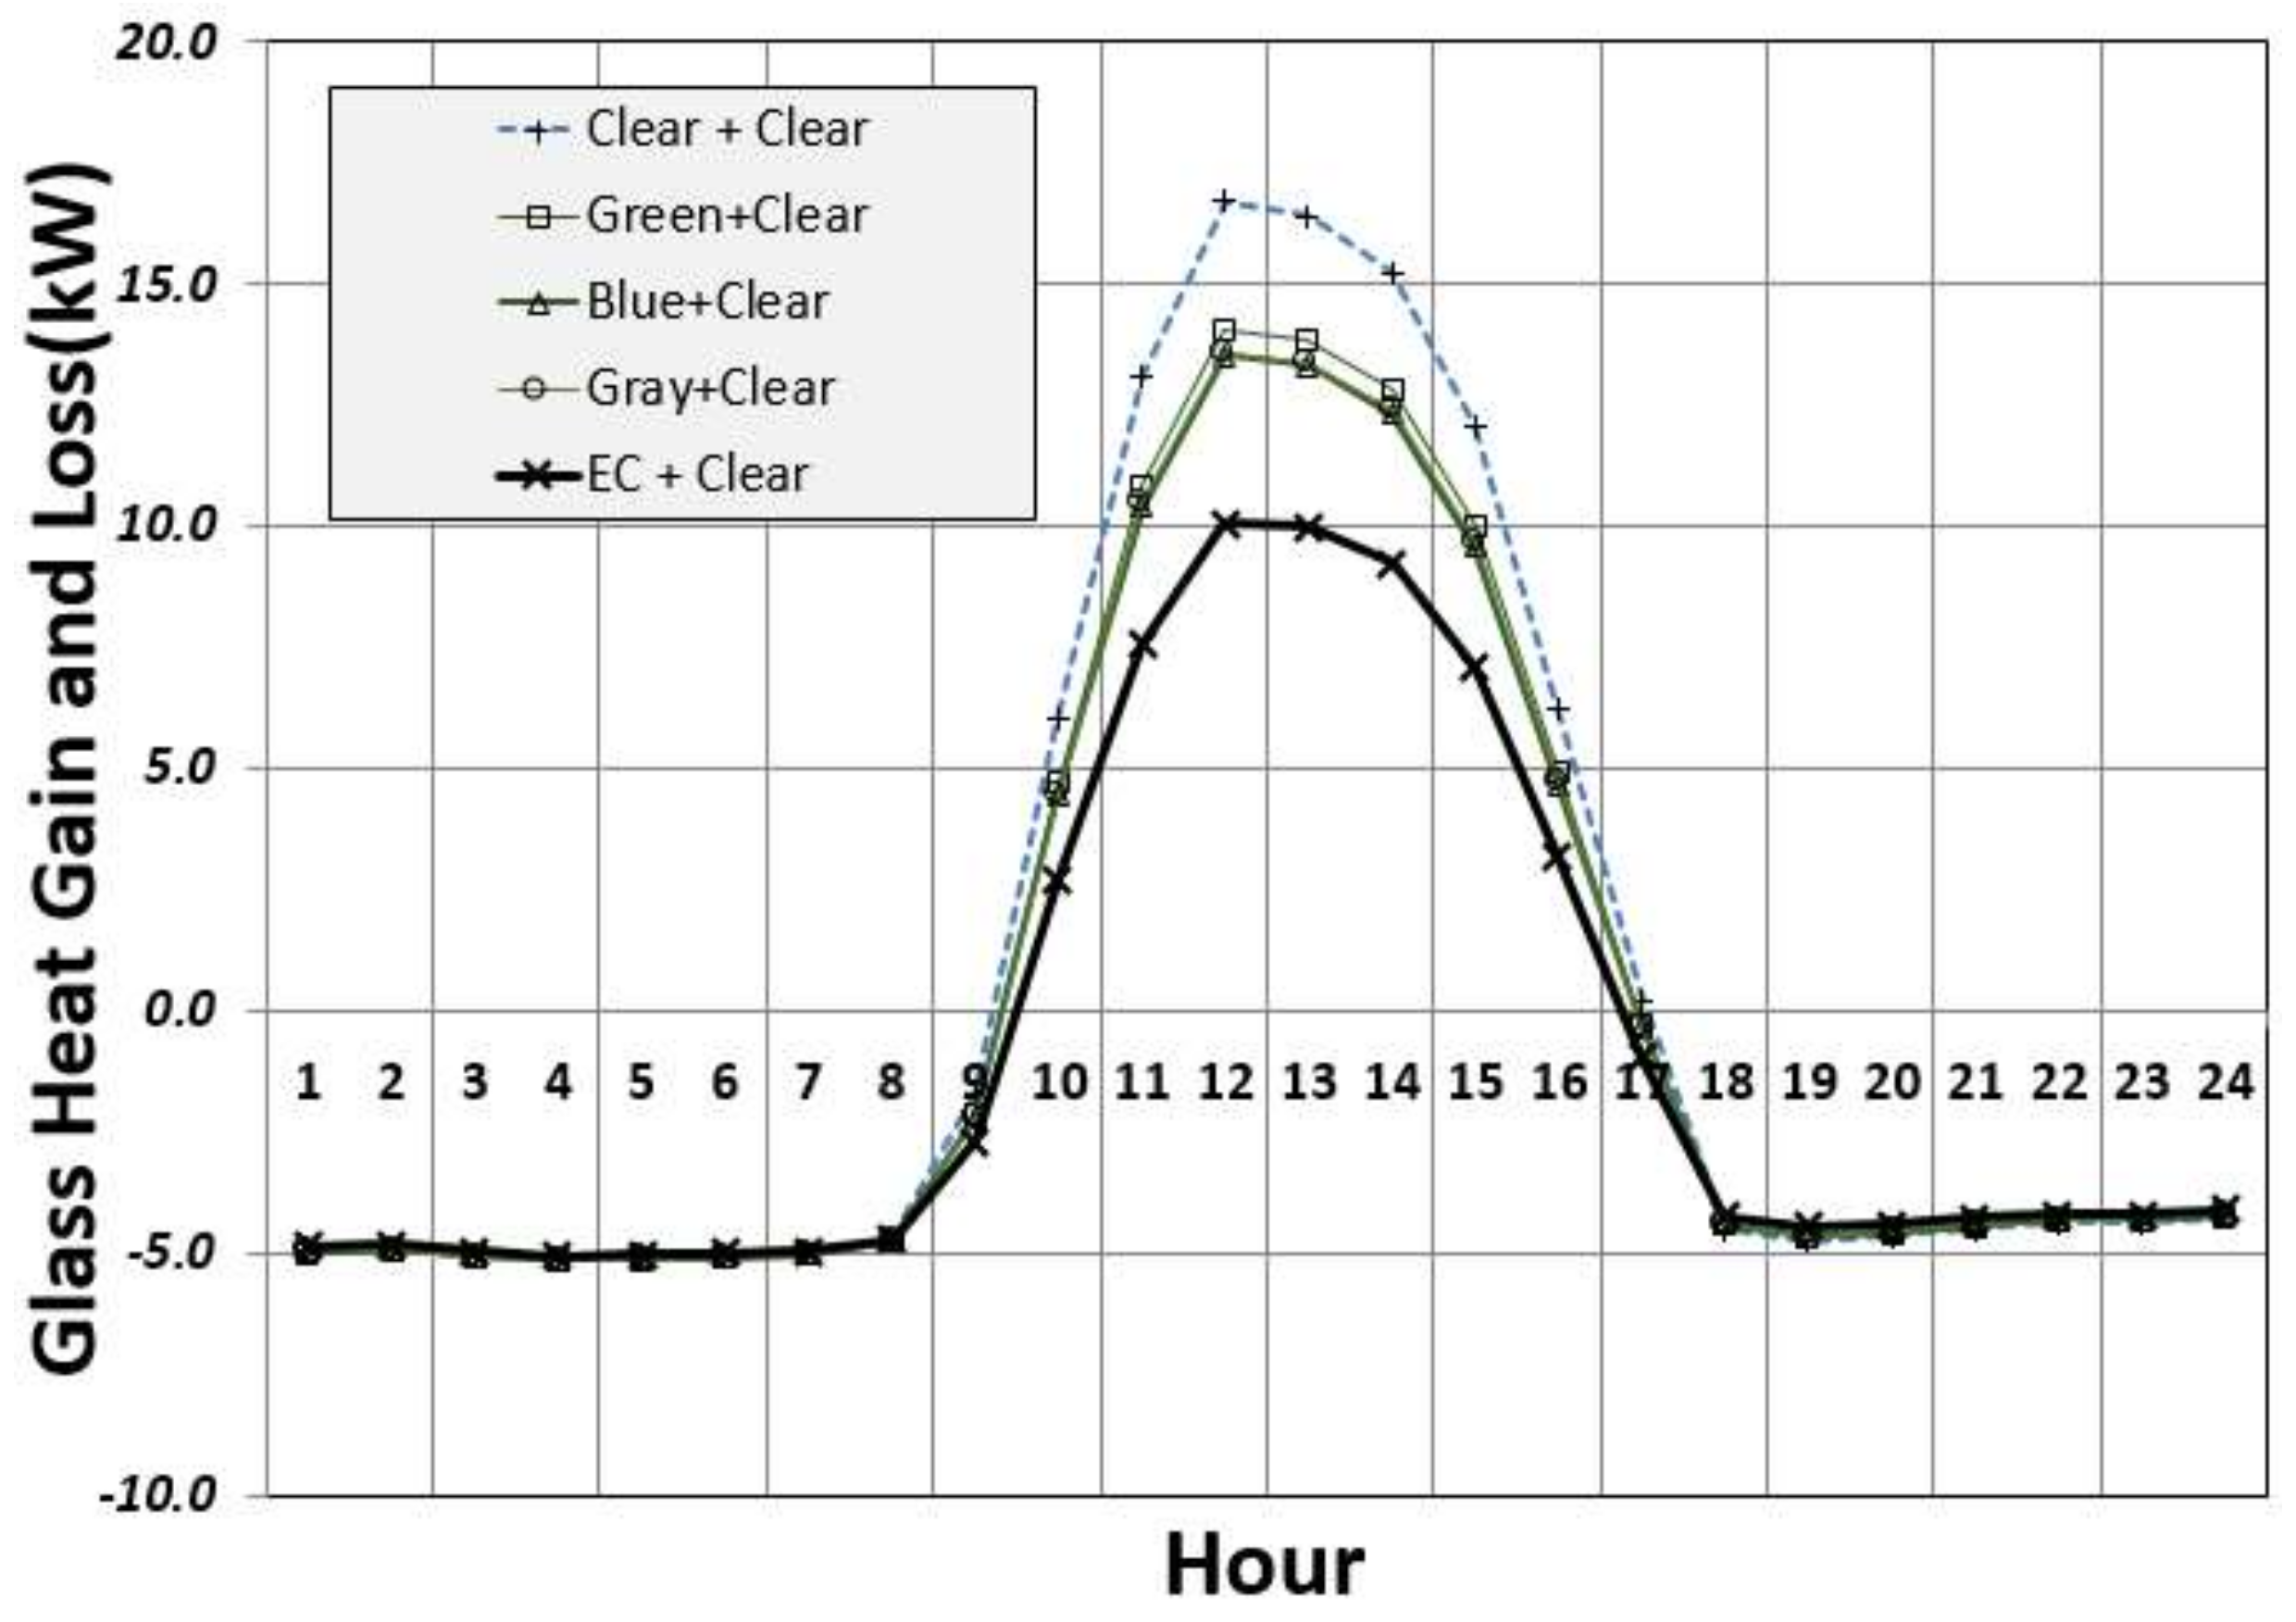
We analyzed heat flow through glass to determine the factors directly affecting heating load, and the relevant graph is shown in Figure 9, Table 7. We selected Display AdvancedReportVarialbles of Output:Dignostics as the data output of the EnergyPlus simulation tool, which supports a detailed analysis of the heat gain and heat loss of glass. The formula for calculating heat flow is given in Equation (1):
where Q indicates the accumulated heat flow through the glass over time (), which is calculated by subtracting the hourly accumulation of short-wave radiation back out () from the hourly accumulation of transmitted solar (), convective heat flow (), and net IR heat flow (). A positive value (+) implied heat gain, whereas a negative value (−) indicated heat loss. is the transfer of short-wave radiation from the zone back out the window in watts. This is a measure of the diffuse short-wave light (from reflected solar and electric lighting) that leaves the zone through the window.
Figure 9 shows no significant difference in heat loss for double glazing during the night when there was no solar radiation. This is because the heat transfer coefficient of each type of double glazing was similar. However, the low solar heat gain coefficient of electrochromic glazing resulted in low solar penetration during the day; this had the strongest impact on the increase in heating load.
In other words, compared with clear double glazing and colored glass, electrochromic glazing has unfavorable heat and optical properties in terms of reducing heating load. Therefore, based on the cumulative heat flow in Table 6, it appears necessary to achieve as much solar penetration as that for clear double glazing, or to increase the heat transmission coefficient to minimize the heat loss and compensate for the heat lost overnight to improve the performance of electrochromic glazing.
Figure 11, Table 8 compares the performance of electrochromic glazing with that of low-e double glazing in terms of reducing heating load, and shows that the heating load of electrochromic glazing was the highest. Table 8 shows the daily cumulative heating load for each type of double glazing.
The heat flow shown in Figure 13 was analyzed to determine the cause of the increase in the heating load of electrochromic glazing. The heat transmission coefficient of single and double low-e double glazings is lower than that of clear double glazing and electrochromic glazing. Thus, heating load was low at night when there was no solar radiation. It should be noted here that after 10:00 a.m. (Figure 11), the heating load of double low-e glazing increased to a greater extent than that of clear glass. This might have been because the heat transmission coefficient of double low-e glazing was low, as shown in Figure 13, Table 9 and, thus, heat loss was low at night. However, the heat gain became the lowest as solar penetration decreased compared with clear glass when the solar radiation began. Thus, it appears that a combination of double glazing with single low-e glass, which can suitably maintain transmittance while increasing heat insulation, is more effective at reducing building energy in the winter in light of the variable solar radiation of electrochromic glazing.
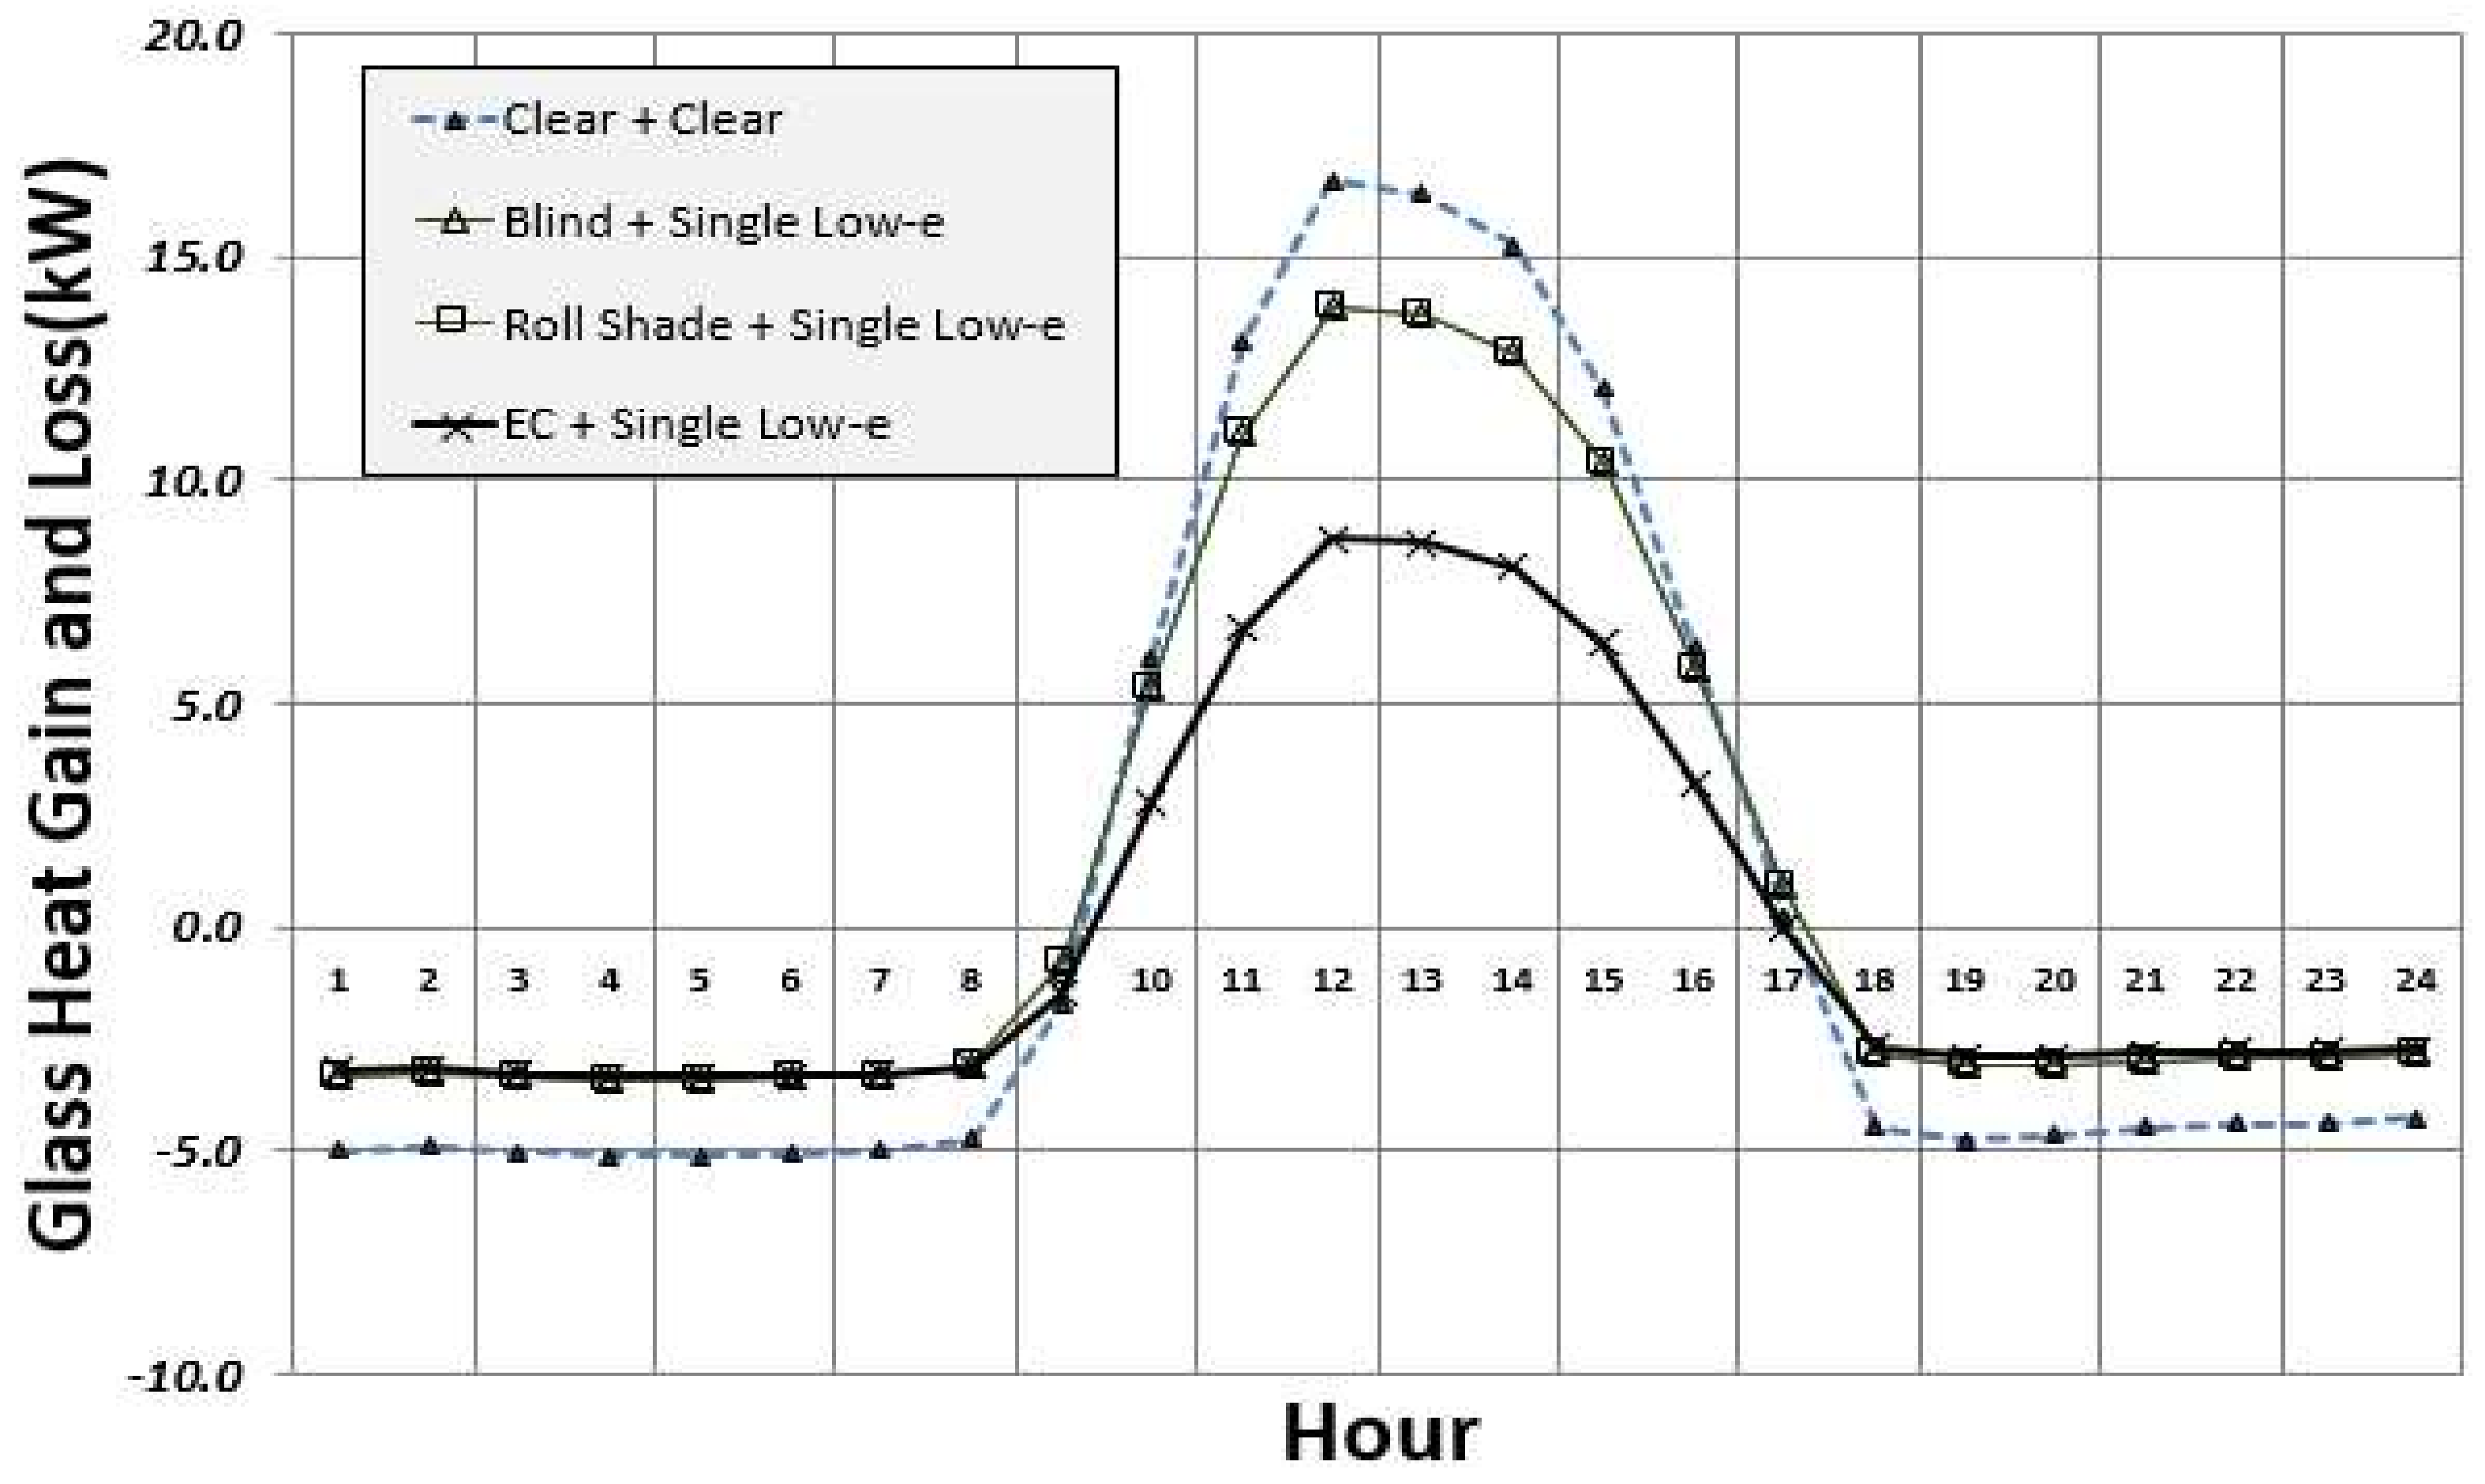
Figure 12, Table 10 compares the performance of electrochromic glazing with that of shading devices in terms of reducing heating load. The double glazing was formed by combining single low-e glass with all shading devices and electrochromic glazing, based on the results of a comparative analysis with low-e glass. It can be seen that the heating load of electrochromic glazing decreased to a greater extent than that of clear glass, because applying single low-e glass reduced the heat transmission coefficient, which in turn reduced the heat lost overnight, as shown in Figure 14, Table 11.
The blinds and roll shades were kept open in winter and, thus, heating load and heat flow were the same as those for single low-e glazing. As the solar heat gain coefficient of electrochromic glazing is lower than that of single low-e glazing, its heating load was still higher than that of double glazing when the blinds and roll shades were open.
In summary, transmittance was low when the electrochromic glazing was bleached, and hence, was not effective in terms of reducing heating load. Therefore, work is needed to increase transmittance in the bleached state when developing electrochromic glazing in the future.
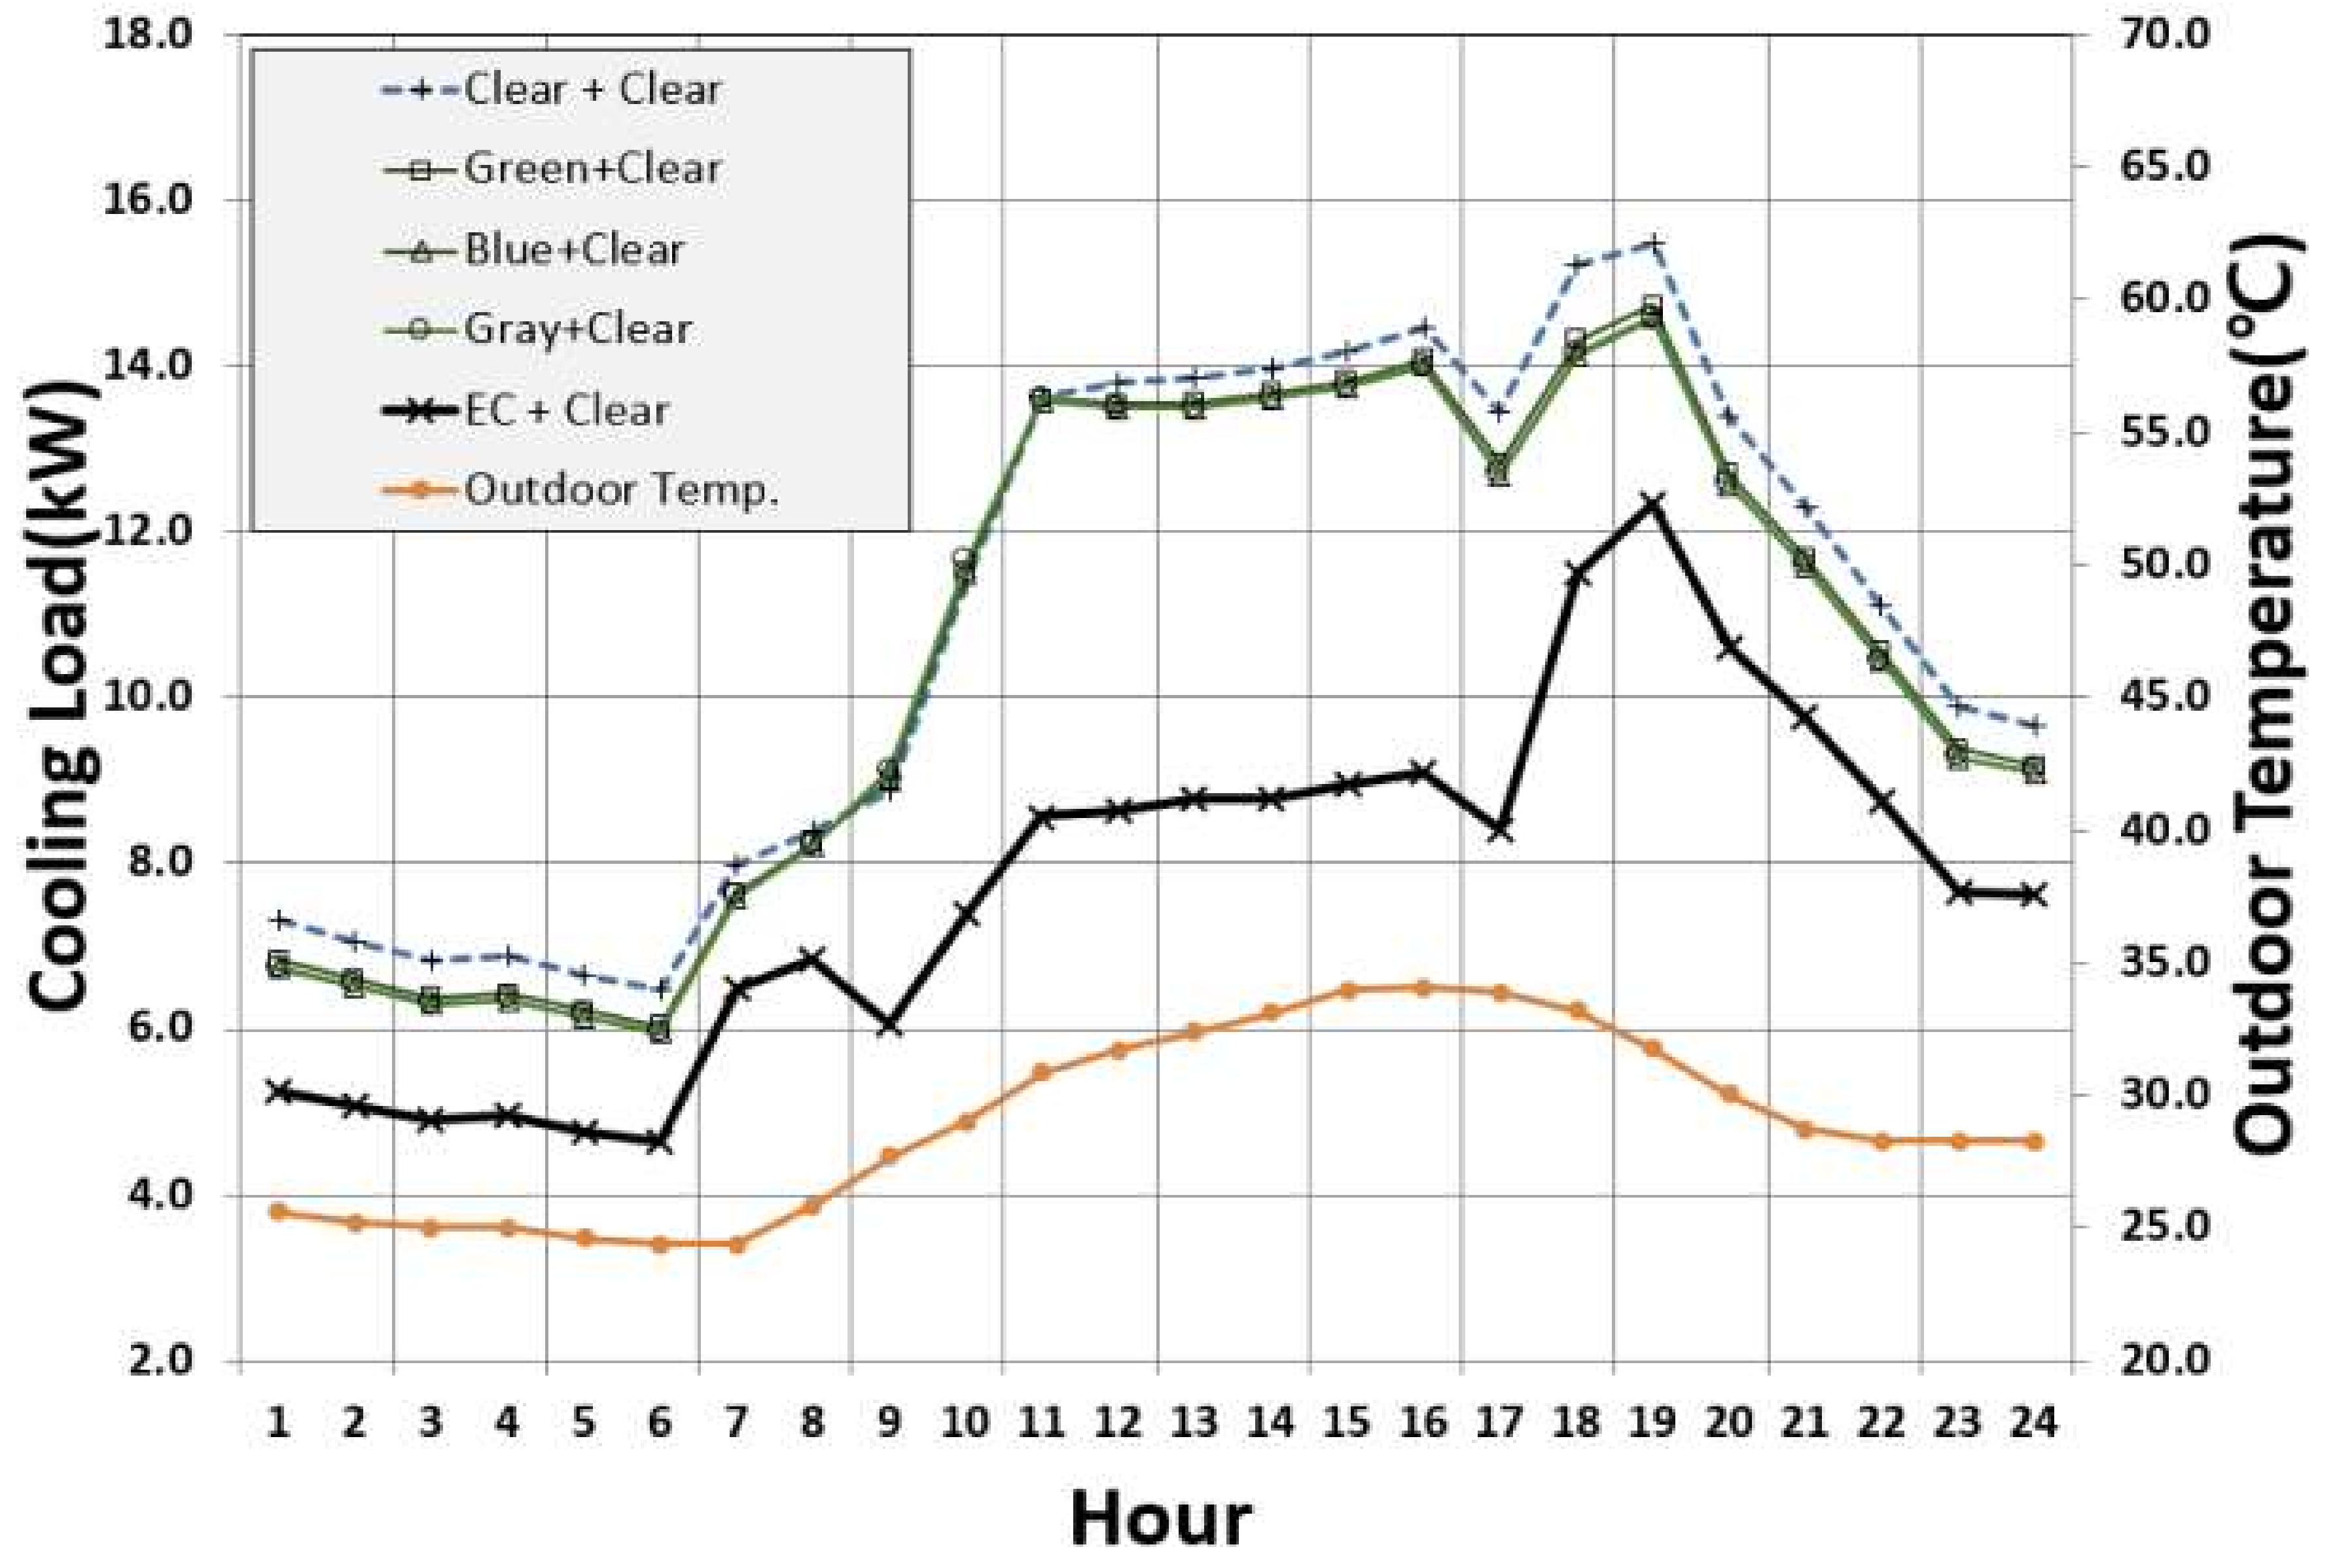
4.1.2. Comparative Evaluation of Hourly Cooling Load Performance
Figure 15, Table 12 compares the performance of electrochromic glazing in terms of cooling load with that of colored glass double glazing. Cooling load is always low when electrochromic glazing is applied, regardless of time. The daily cumulative cooling load for each type of double glazing is provided in Table 12. The magnitude of reduction in cooling load was larger than the increase in the heating load.
Such a reduction in the cooling load of electrochromic glazing occurred because, as shown in Figure 16, Table 13, there was no considerable difference between the overnight heat loss for double glazing. This is because the heat transmission coefficients were similar and solar penetration was low owing to the nature of electrochromic glazing, which has a low solar heat gain coefficient. In other words, compared with clear double glazing and colored glass, electrochromic glazing has favorable heat and optical properties in terms of reducing cooling load.
Figure 17, Table 14 shows a comparison of the performance of electrochromic glazing in terms of cooling load with that of low-e double glazing. It is clear that the cooling load of electrochromic glazing was lower.
The analysis of heat flow in Figure 18, Table 15 shows no significant difference in overnight heat loss due to the difference in the heat transmission coefficient in summer. The heat gain due to the difference in the solar heat gain coefficient during the day had the strongest impact on the reduction in the cooling load. In other words, unlike in winter, where there was a complex impact of the heat transmission coefficient and solar heat gain coefficient, only the effect of the solar heat gain coefficient was dominant in summer. Therefore, as shown in Figure 17, electrochromic glazing with the lowest solar heat gain coefficient was the most effective in terms of reducing the cooling load.
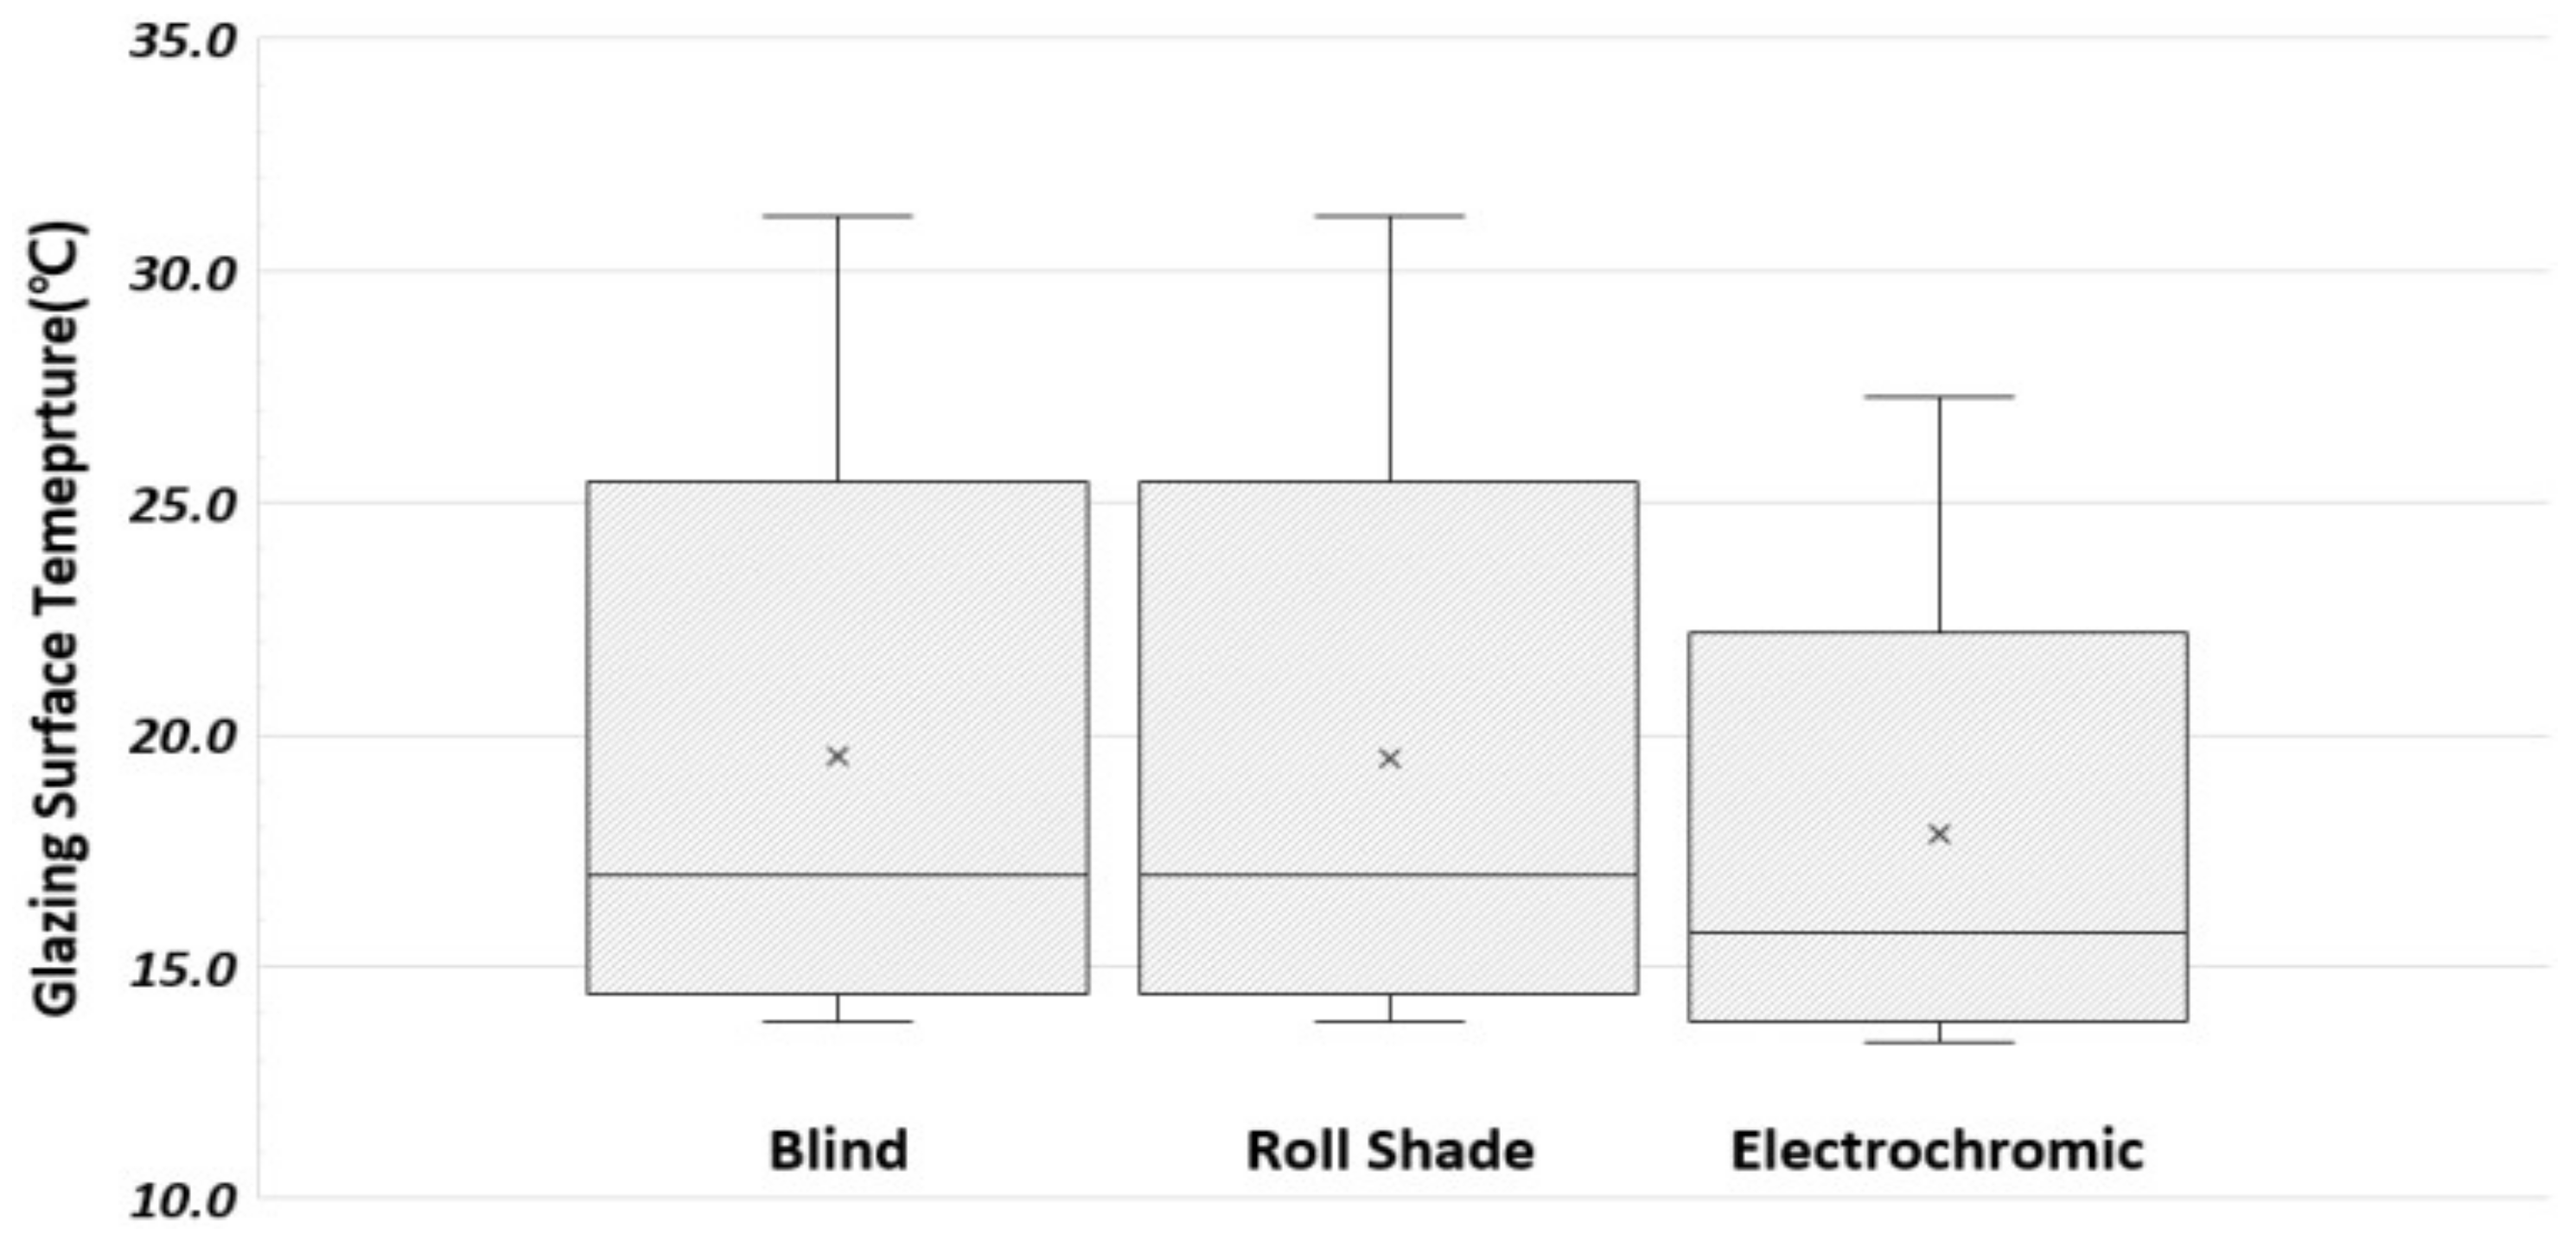
Figure 19, Table 16 compares the performance of electrochromic glazing with that of the shading devices in terms of the cooling load. Similar to the case in winter, single low-e glass was combined with all of the shading devices and electrochromic glazings to form double glazing; blinds and roll shades were closed, and the electrochromic glazing was bleached. A reflectance of 90% and a transmittance of 0% were applied to the blinds and rolls shades to achieve the highest reduction in cooling load in the summer, and the slats of the blinds were assumed to be completely closed. We observed that electrochromic glazing yielded an excellent performance in terms of reducing cooling load. While shading devices block solar radiation, they are installed indoors, and thus, the solar radiation that penetrates through the glass is partly absorbed by them, and flows indoors in the form of long-wave radiation, thereby affecting the heat gain. Table 17 shows that the heat gain of the blinds and roll shades was high because of the convection and radiation between the double glazing and the blinds. Figure 20 shows that the indoor temperature of the glass surface was higher than that of the electrochromic glazing. Therefore, electrochromic glazing is more effective than the currently used shading devices as a solar control system that blocks solar radiation. As shown in Figure 15, Figure 20 and Figure 21, a comprehensive analysis of hourly heating and cooling loads revealed that the low transmittance values of the colored electrochromic glazing resulted in the largest reduction in solar gain from 07:00 a.m. h to 17:00 p.m., and was thus more effective at reducing cooling loads than the colored, low-e, and shading devices.
4.2. Monthly and Annual Changes in Heating and Cooling Loads
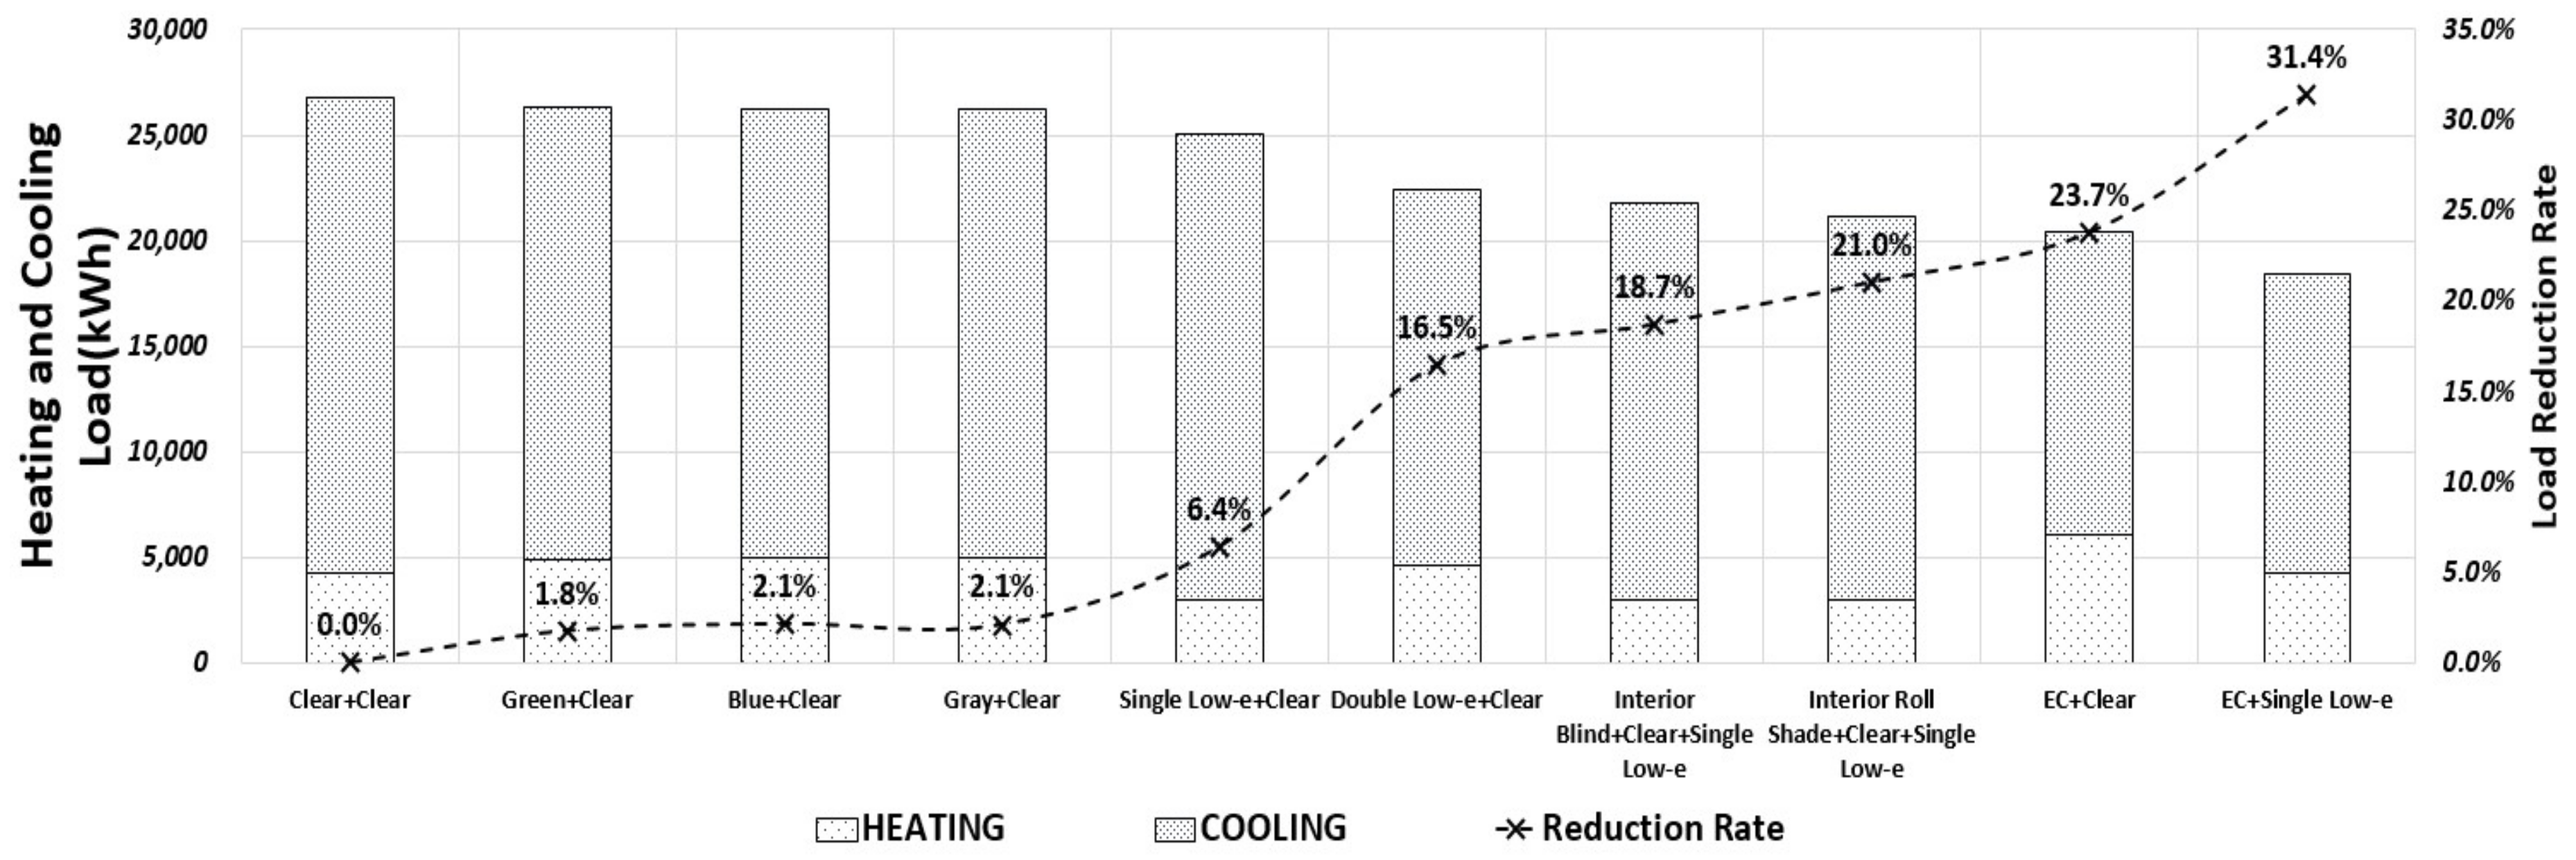
Figure 22 and Table 18 show the total annual cooling and heating loads. Even though electrochromic glazing is sub-optimal at reducing heating loads, it was the most effective at reducing the total annual load in buildings with the cooling load being dominant, which is similar to the analytical model in this study. In particular, compared with shading devices that are mainly used in high-rise residential buildings using the baseline, electrochromic glazing significantly reduced the total load by up to 12.7–14.9%. This implies that electrochromic glazing has potential for use in next-generation structural glass.
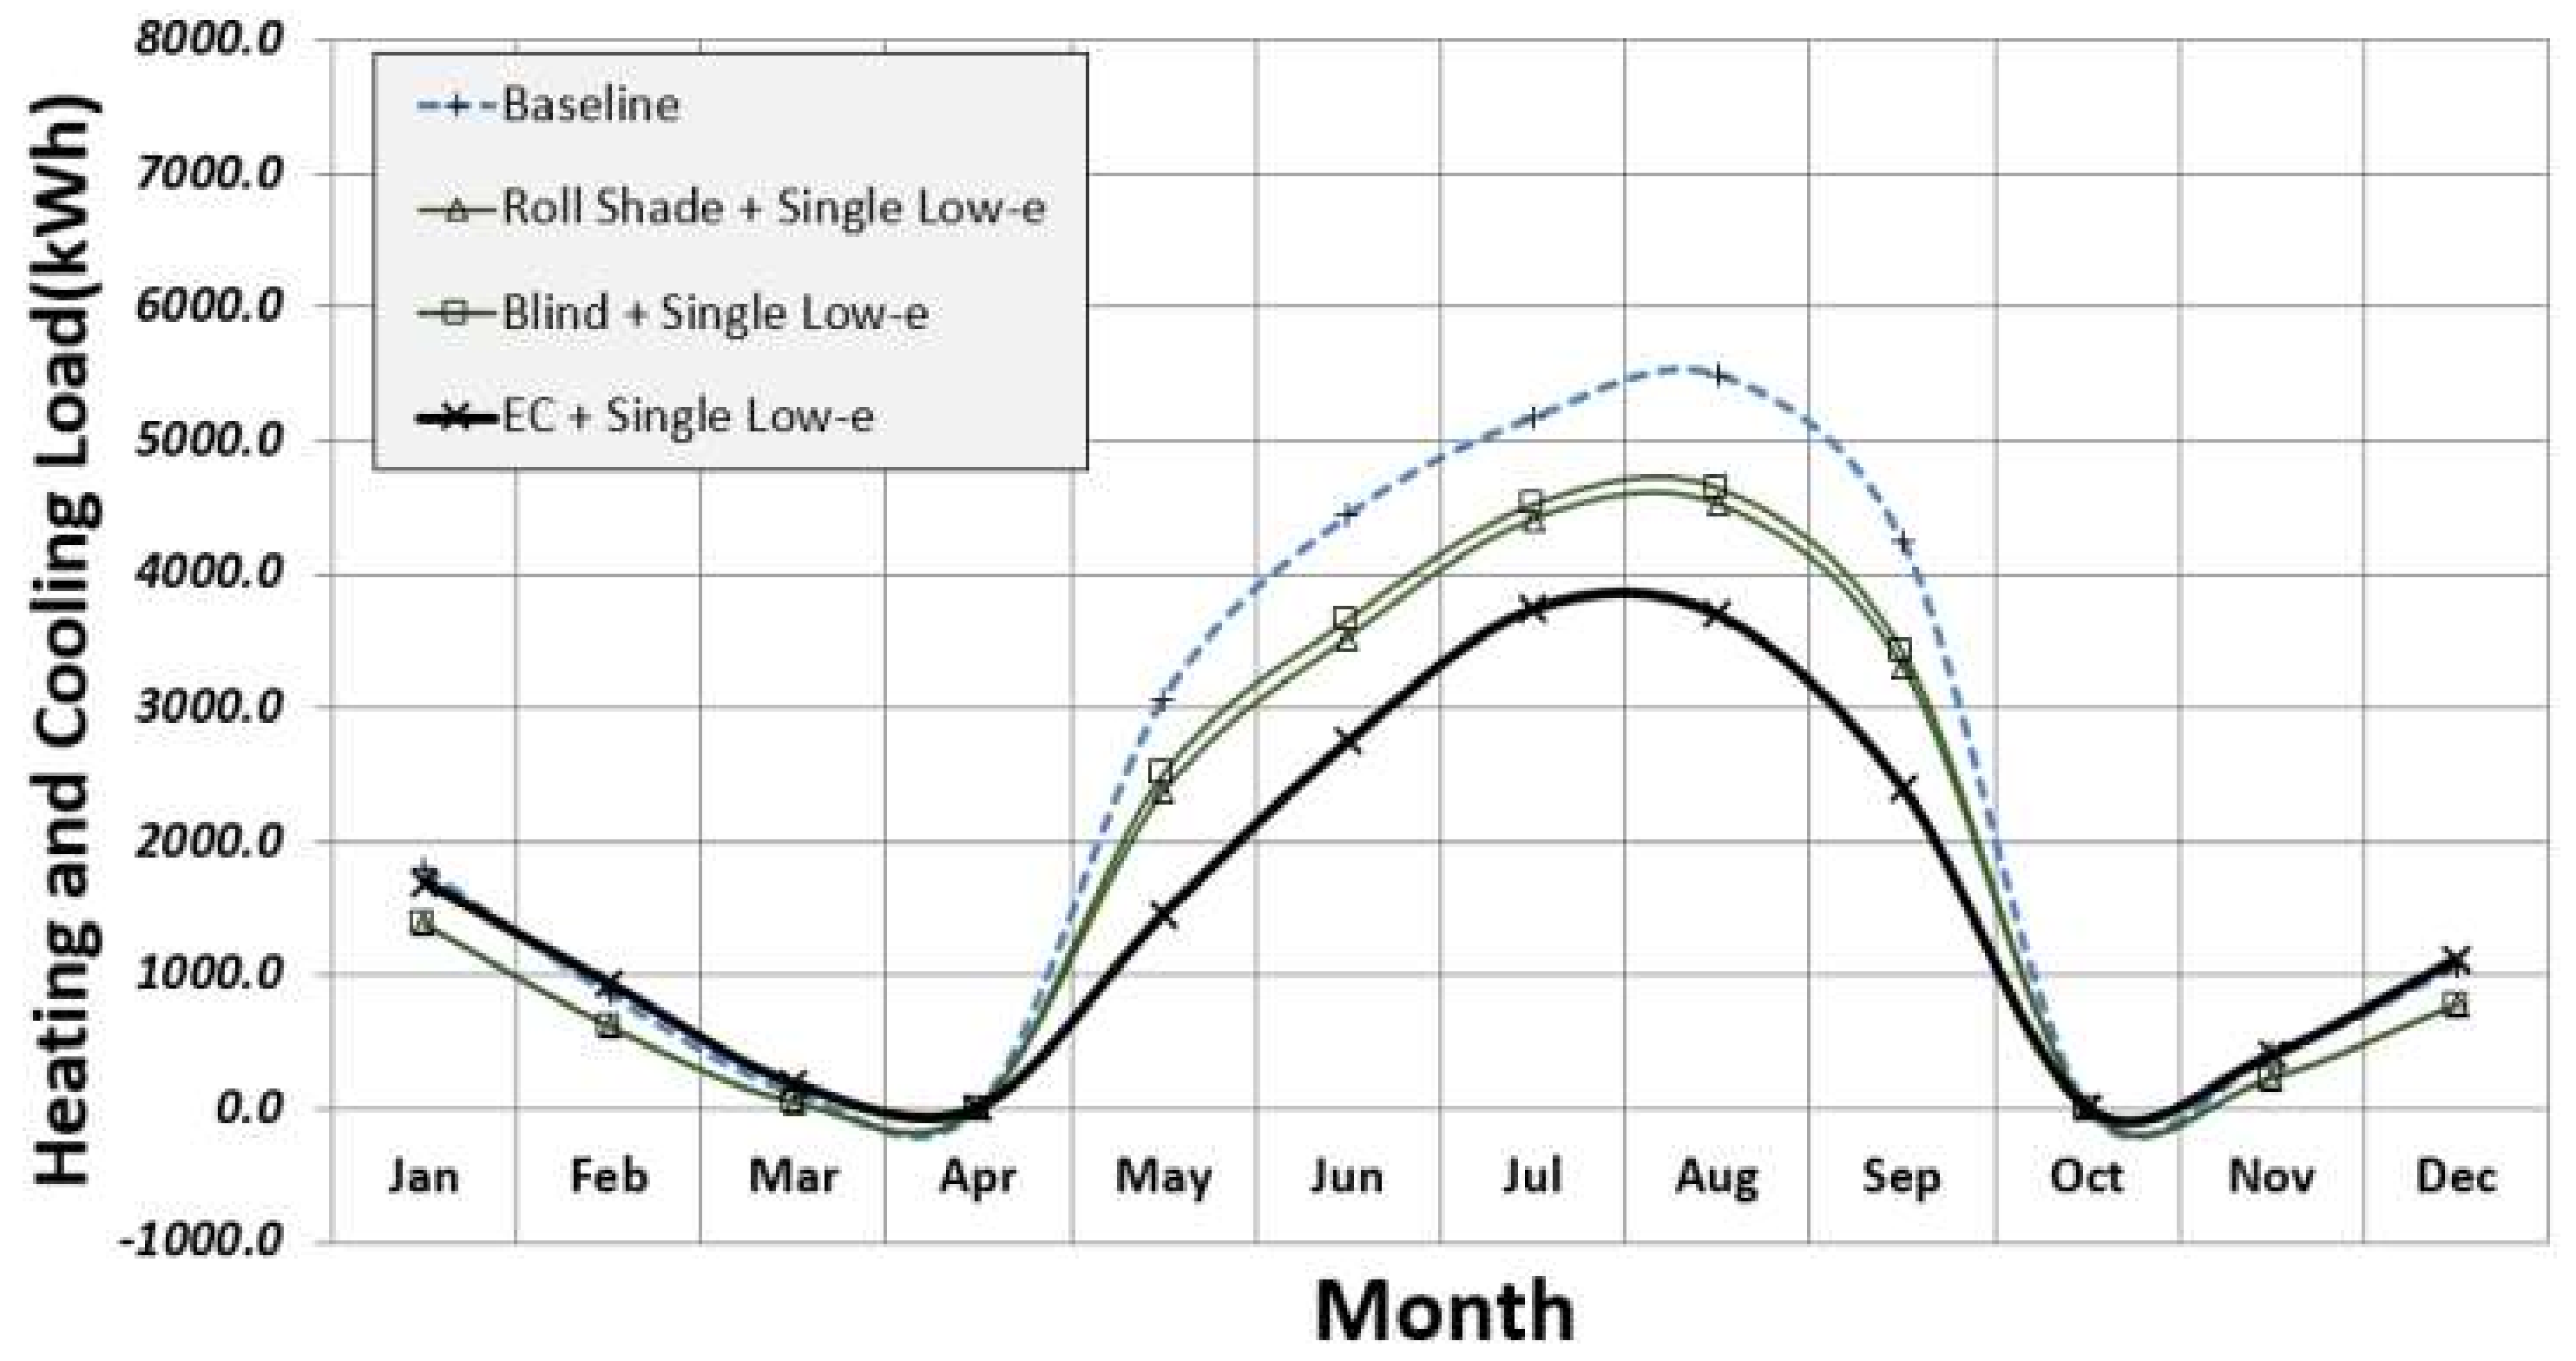
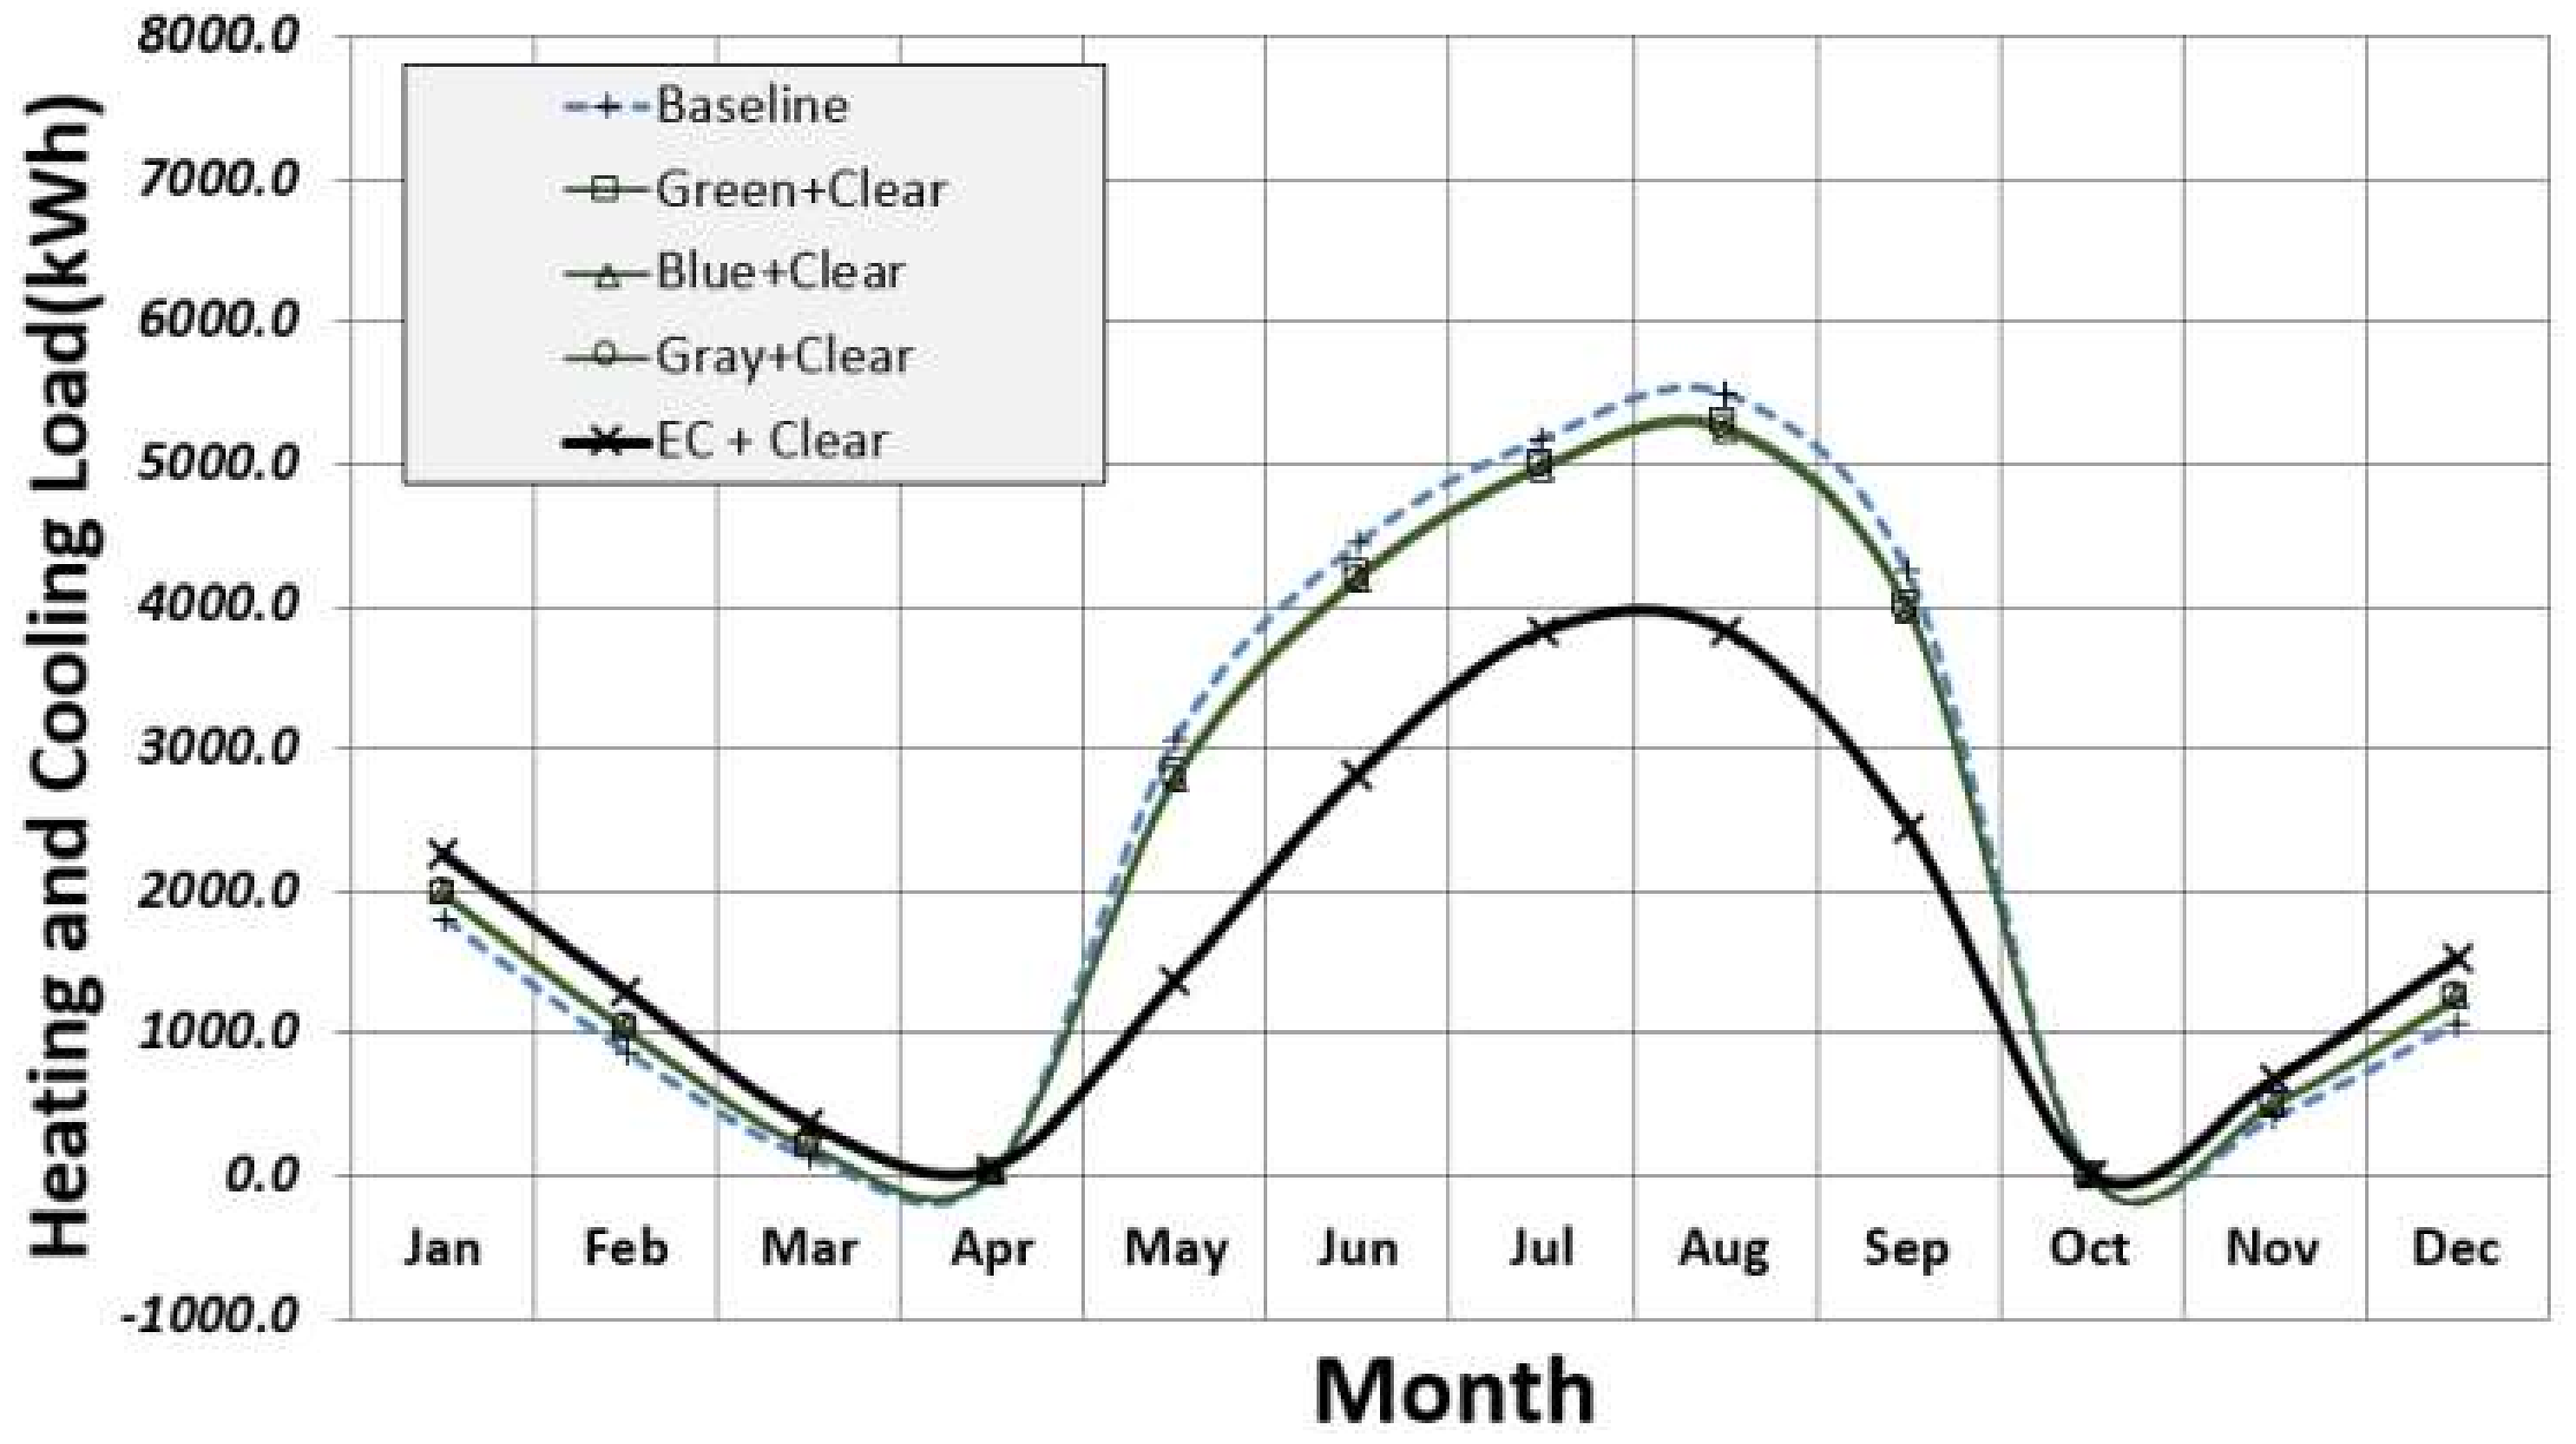
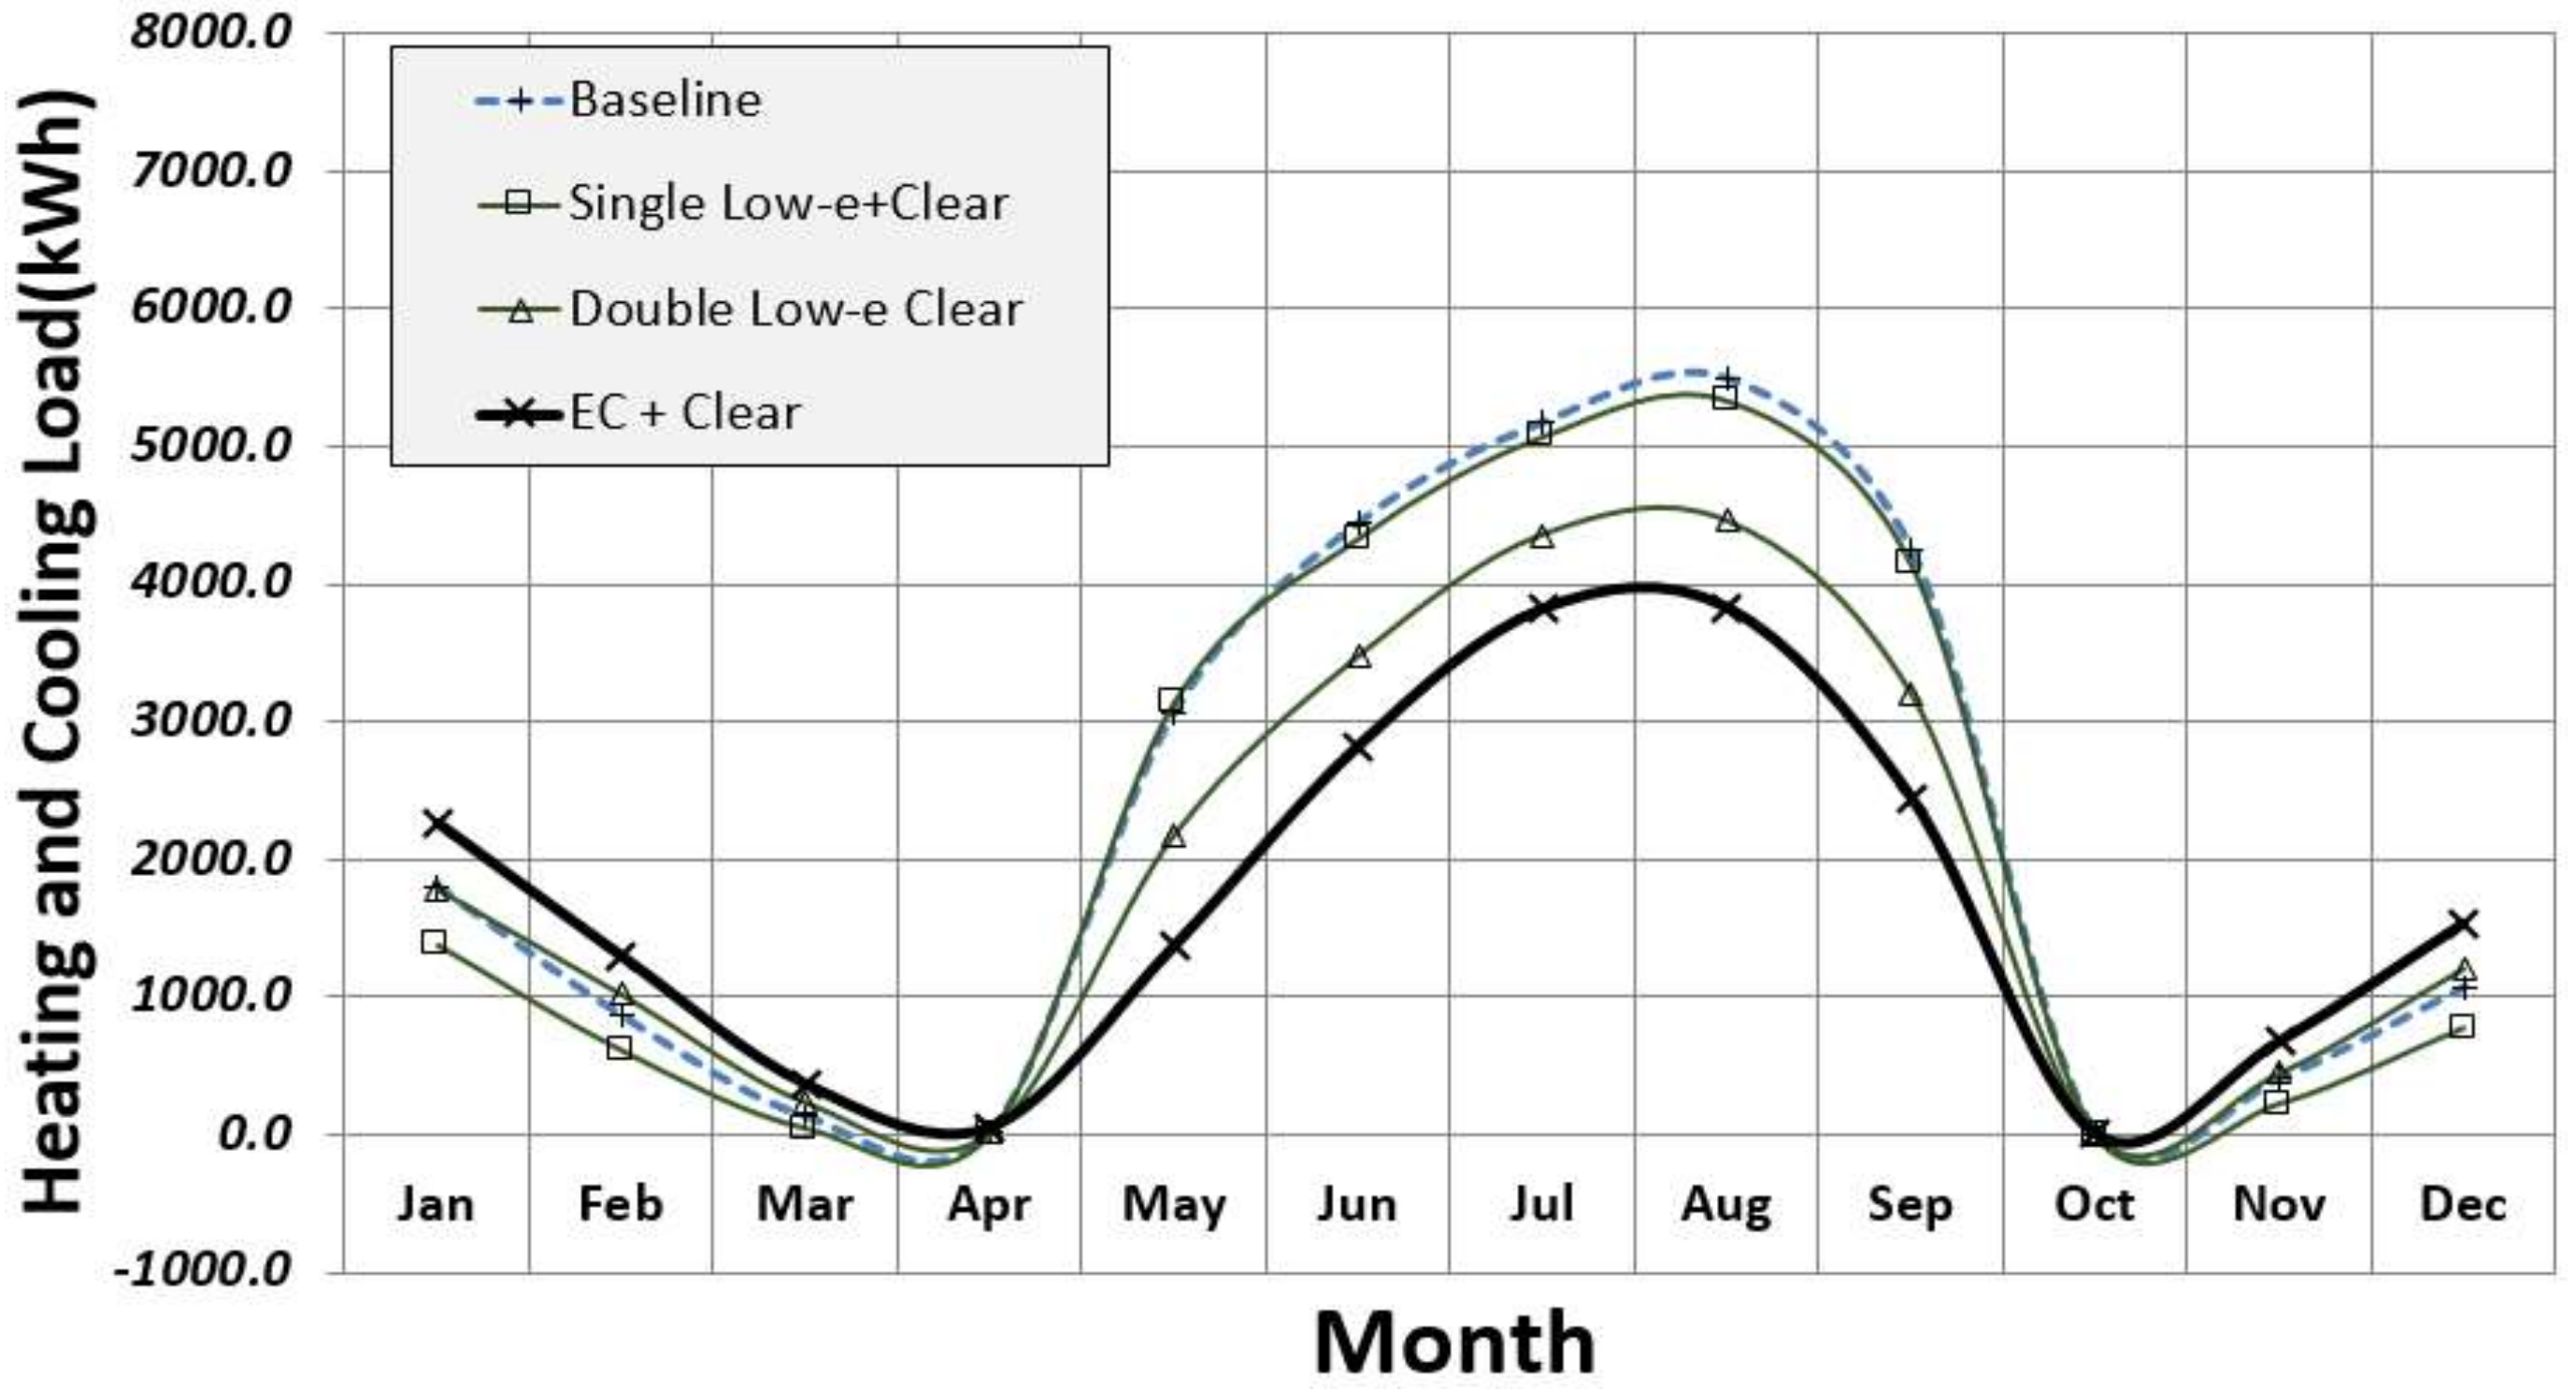
Figure 23, Figure 24 and Figure 25 show the monthly cumulative changes in heating and cooling loads, according to the type of double glazing. The same trend as that in the analysis of hourly cooling and heating loads was observed. Compared with all of the other types of double glazing, the heating load of electrochromic glazing was high in winter even when bleached, and this contributed to a reduction in cooling load in the colored state in the summer. In other words, applying double glazing is more effective for buildings with high cooling loads.
5. Conclusions
To assess the load reduction performance of the recently developed domestic electrochromic glazing, this study conducted a comparative analysis of the double-glazing and shading devices that are used for high-rise residential buildings in Korea. The results of the analysis can be summarized as follows:
- (1)
- To test the hypothesis that the cooling load of the high-rise residential buildings was high, we analyzed the annual load using an analytical model on the EnergyPlus simulation tool. Heating and cooling loads comprised 84.0% and 16.0% of the total load, respectively, with the load pattern focused more on cooling.
- (2)
- We hypothesized that the load reduction performance of electrochromic glazing with variable solar control and high solar radiation rejection is better than that of double-glazing products and shading devices, and analyzed the cooling and heating loads for each type of double glazing.
- (3)
- In South Korea, which has different weather conditions in summer and winter, controlling solar radiation is important. The analysis of optical properties of electrochromic glazing showed that the solar transmittance values were 48.1% and 6.5% in the bleached and colored states, respectively. This indicates that allowing and blocking solar radiation during winter and summer, respectively, are effective for reducing the heating and cooling loads in buildings.
- (4)
- Colored electrochromic glazing had a higher solar radiation rejection than colored glass double glazing and low-e double glazing. Thus, it is effective for reducing cooling load. Moreover, it was observed to be excellent in terms of cooling load reduction compared with shading devices (blinds and roll shades), because such devices are installed indoors. Thus, the solar radiation that penetrates through the glass is partly absorbed by the shading devices, and flows indoors in the form of long-wave radiation, thereby reducing the heat gain due to convection and radiation. However, electrochromic glazing is applied to the outermost part to reduce the inflow of solar radiation.
- (5)
- Electrochromic glazing was found to be more effective for reducing the cooling loads compared with the heating loads. However, in buildings with dominant cooling loads, similar to the analytical model used in this study, it exhibited the best performance in terms of reducing the total annual load.
The limitations of this study are that it failed to analyze the effect of energy consumption based on the use schedule of the HVAC unit, the effect of load reduction on selecting the capacity of the HVAC system, and LCC (Life Cycle Cost) analysis according to initial investment cost and actual energy consumption. Therefore, it is necessary to examine the actual reduction in cooling and heating energy when cooling and heating systems are applied to buildings based on this study. Furthermore, we controlled transmittance by limiting the dependent variables of the control of electrochromic glazing to cooling and heating loads, and categorizing the glazing as in the colored state in summer and bleached state in winter. However, by expanding the scope of dependent variables according to changes in the environment, more significant findings can be obtained in terms of building energy and the construction environment. Furthermore, we limited the shading devices that were used to internal venetian blinds and roll shades, which are widely used in buildings in South Korea. Thus, further research is needed for a comparative analysis between external shading devices and electrochromic glazing. This study also made a simplistic distinction between the summer colored state and the winter bleached state in order to control transmission. This control strategy was chosen with the aim of analyzing the effects of the optical properties of the proposed electrochromic glazing, which exhibited bleached and discolored states, on heating and cooling loads. However, a key advantage of electrochromic glazing is that transmission can be controlled in stages. Further research is needed to examine an optical control method to integrate energy due to cooling, heating, and lighting.
Acknowledgments
This research was supported by a grant (16CTAP-C114806-01) from the Technology Advancement Research Program (TARP), funded by the Ministry of Land, Infrastructure, and Transport of the Korean government.
Author Contributions
All authors contributed substantially to all aspects of this article.
Conflicts of Interest
The authors have no conflict of interest to declare.
References
- Reilly, S.; Arasteh, D.; Selkowitz, S.E. Thermal and optical analysis of switchable window glazings. Sol. Energy Mater. 1991, 22, 1–14. [Google Scholar] [CrossRef]
- Ghosh, A.; Norton, B.; Duffy, A. Daylighting performance and glare calculation of a suspended particle device switchable glazing. Sol. Energy 2016, 132, 114–128. [Google Scholar] [CrossRef]
- Ghosh, A.; Mallick, T.K. Evaluation of colour properties due to switching behaviour of a PDLC glazing for adaptive building integration. Renew. Energy 2018, 120, 126–133. [Google Scholar] [CrossRef]
- Rezaei, S.D.; Shannigrahi, S.; Ramakrishna, S. A review of conventional, advanced, and smart glazing technologies and materials for improving indoor environment. Sol. Energy Mater. Sol. Cells 2017, 159, 26–51. [Google Scholar] [CrossRef]
- Ihara, T.; Gustavsen, A.; Jelle, B.P. Effect of facade components on energy efficiency in office buildings. Appl. Energy 2015, 158, 422–432. [Google Scholar] [CrossRef]
- Piccolo, A.; Pennisi, F. Daylighting performance of an electrochomic window in a small-scale test-cell. Sol. Energy 2009, 83, 832–844. [Google Scholar] [CrossRef]
- Tavares, P.F.; Gaspar, A.R.; Martins, A.G.; Frontini, F. Evaluation of electrochromic windows impact in the energy performance of buildings in Mediterranean climates. Energy Policy 2014, 67, 68–81. [Google Scholar] [CrossRef]
- Elizabeth, P.; Leidy, J. Passive Design Strategies for Building Envelopes in Different Orientation. Int. J. Sustain. Build. Technol. Urban Dev. 2017, 8, 201–227. [Google Scholar]
- Lee, E.S.; Tavil, A. Energy and visual comfort performance of electrochromic windows with overhangs. Build Environ. 2009, 42, 2439–2449. [Google Scholar] [CrossRef]
- Lee, E.S.; Yazdanian, M.; Selkowitz, S. The Energy-Savings Potential of Electrochromic Windows in the US Commercial Buildings Sector; University of California: Oakland, CA, USA, 2004. [Google Scholar]
- Papaefthimiou, S.; Syrrakou, E.; Yianoulis, P. Energy performance assessment of an electrochromic window. Thin Solid Films 2006, 502, 257–264. [Google Scholar] [CrossRef]
- Fernandes, L.L.; Lee, E.S.; Ward, G. Lighting energy savings potential of split-pane electrochromic windows controlled for daylighting with visual comfort. Energy Build. 2013, 61, 8–20. [Google Scholar] [CrossRef]
- Ajaji, Y.; André, P. Thermal comfort and visual comfort in an office building equipped with smart electrochromic glazing: An experimental study. Energy Proc. 2015, 78, 2464–2469. [Google Scholar] [CrossRef]
- DeForest, N.; Shehabi, A.; Garcia, G.; Greenbalt, J.; Masanet, E.; Lee, E.S.; Selkowitz, S.; Milliron, D.J. Regional performance targets for transparent near-infrared switching electrochromic window glazings. Build. Environ. 2013, 61, 160–168. [Google Scholar] [CrossRef]
- Cannavale, G.E.; Eperon, P.; Cossari, A.; Abate, H.J.; Snaith, G.; Gigli, P. Photovoltachromic cells for building integration. Energy Environ. Sci. 2015, 8, 1578–1584. [Google Scholar] [CrossRef]
- Sage Glass. Available online: https://www.sageglass.com (accessed on 22 February 2018).
- Granqvist, C.G.; Bayrak Pehlivan, I.; Niklasson, G.A. Electrochromics on a roll: Web-coating and lamination for smart windows. Surf. Coat. Technol. 2017, 6–11. [Google Scholar] [CrossRef]
- Rottmann, M.; Kraft, A.; Heckner, K.H.; Hausler, T.; Fischer, U.; Stenzel, H. Large-area electrochromic safety glass; switching behaviour and transmission control of solar radiation. In Proceedings of the 9th International Glass Conference on Glass Processing Days, Tampere, Finland, 17–20 June 2005. [Google Scholar]
- Tavares, P.; Bernardo, H.; Gaspar, A.; Martin, A. Control criteria of electrochromic glasses for energy savings in Mediterranean buildings refurbishment. Sol. Energy 2016, 134, 236–250. [Google Scholar] [CrossRef]
- HALIO Glass, Asahi Glass Co. (AGC). Available online: https://halioglass.com (accessed on 22 February 2018).
- EnergyPlus. EnergyPlus Engineering Reference. The Reference to EnergyPlus Calculation. Available online: http://www.energyplus.gov (accessed on 22 February 2018).
- Winkelmann, F. Modeling windows in EnergyPlus. In Proceedings of the 7th International IBPSA Conference, Rio di Janeiro, Brazil, 13–15 August 2001. [Google Scholar]
- Arasteh, D.K.; Reilly, M.S.; Rubin, M.D. A versatile procedure for calculating heat transfer through windows, American Society of Heating, Refrigeration and Air-Conditioning Engineers. ASHRAE Trans. 1989, 95, 755–765. [Google Scholar]
- Finlayson, E.U.; Arasteh, D.K.; Huizenga, C.; Rubin, M.D.; Reilly, M.S. WINDOW 4.0: Documentation of Calculation Procedures, Lawrence Berkeley National Laboratory Report LBL-33943; Lawrence Berkeley National Laboratory: Berkeley, CA, USA, 1993. [Google Scholar]
- Arasteh, D.K.; Kohler, J.C.; Griffith, B.T. Draft, Modeling Windows in EnergyPlus with only U, SHGC, and Optionally VT. Lawrence Berkeley National Laboratory Report; Lawrence Berkeley National Laboratory: Berkeley, CA, USA, 2009. [Google Scholar]
- Winkelmann, F.; Selkowitz, S. Day-Lighting Simulation in DOE-2: Theory, Validation and Applications. Lawrence Berkeley National Laboratory Report; Lawrence Berkeley National Laboratory: Berkeley, CA, USA, 1985. [Google Scholar]
- Lomanowski, B.A.; Wright, J.L. Modeling fenestration with shading devices in building energy simulation: a practical approach. In Proceedings of the 11th International IBPSA Conference, Glasgow, Scotland, 27–30 July 2009. [Google Scholar]
- Chantrasrisalai, C.; Fisher, D.E. Comparative analysis of one-dimensional slat type blind models. In Proceedings of the SimBuild 2004, Boulder, CO, USA, 4–6 August 2004. [Google Scholar]
- International Organization for Standardization. ISO 15099, Thermal Performance of Windows, Doors, and Shading Devices—Detailed Calculations; International Organization for Standardization: Geneva, Switzerland, 2003. [Google Scholar]
- The Korean Ministry of Land, Transport and Maritime Affairs. Standard for Energy Saving Design in Buildings; The Korean Ministry of Land, Transport and Maritime Affairs: Gwacheon, Korea, 2017.
- American Society of Heating, Refrigerating and Air-Conditioning Engineers, Inc. ASHRAE Fundamentals Handbook; American Society of Heating, Refrigerating and Air-Conditioning Engineers, Inc.: Atlanta, GA, USA, 2009. [Google Scholar]
- EnergyPlus. EnergyPlus Input Output Reference. The Encyclopedic Reference to EnergyPlus Input and Output. Available online: http://www.energyplus.gov (accessed on 22 February 2018).
- Oh, M.H.; Lee, K.H.; Yoon, J.H. Automated control strategies of inside slat-type blind considering visual comfort and building energy performance. Energy Build. 2012, 55, 728–737. [Google Scholar] [CrossRef]
Figure 1.
Research guideline and flowchart.
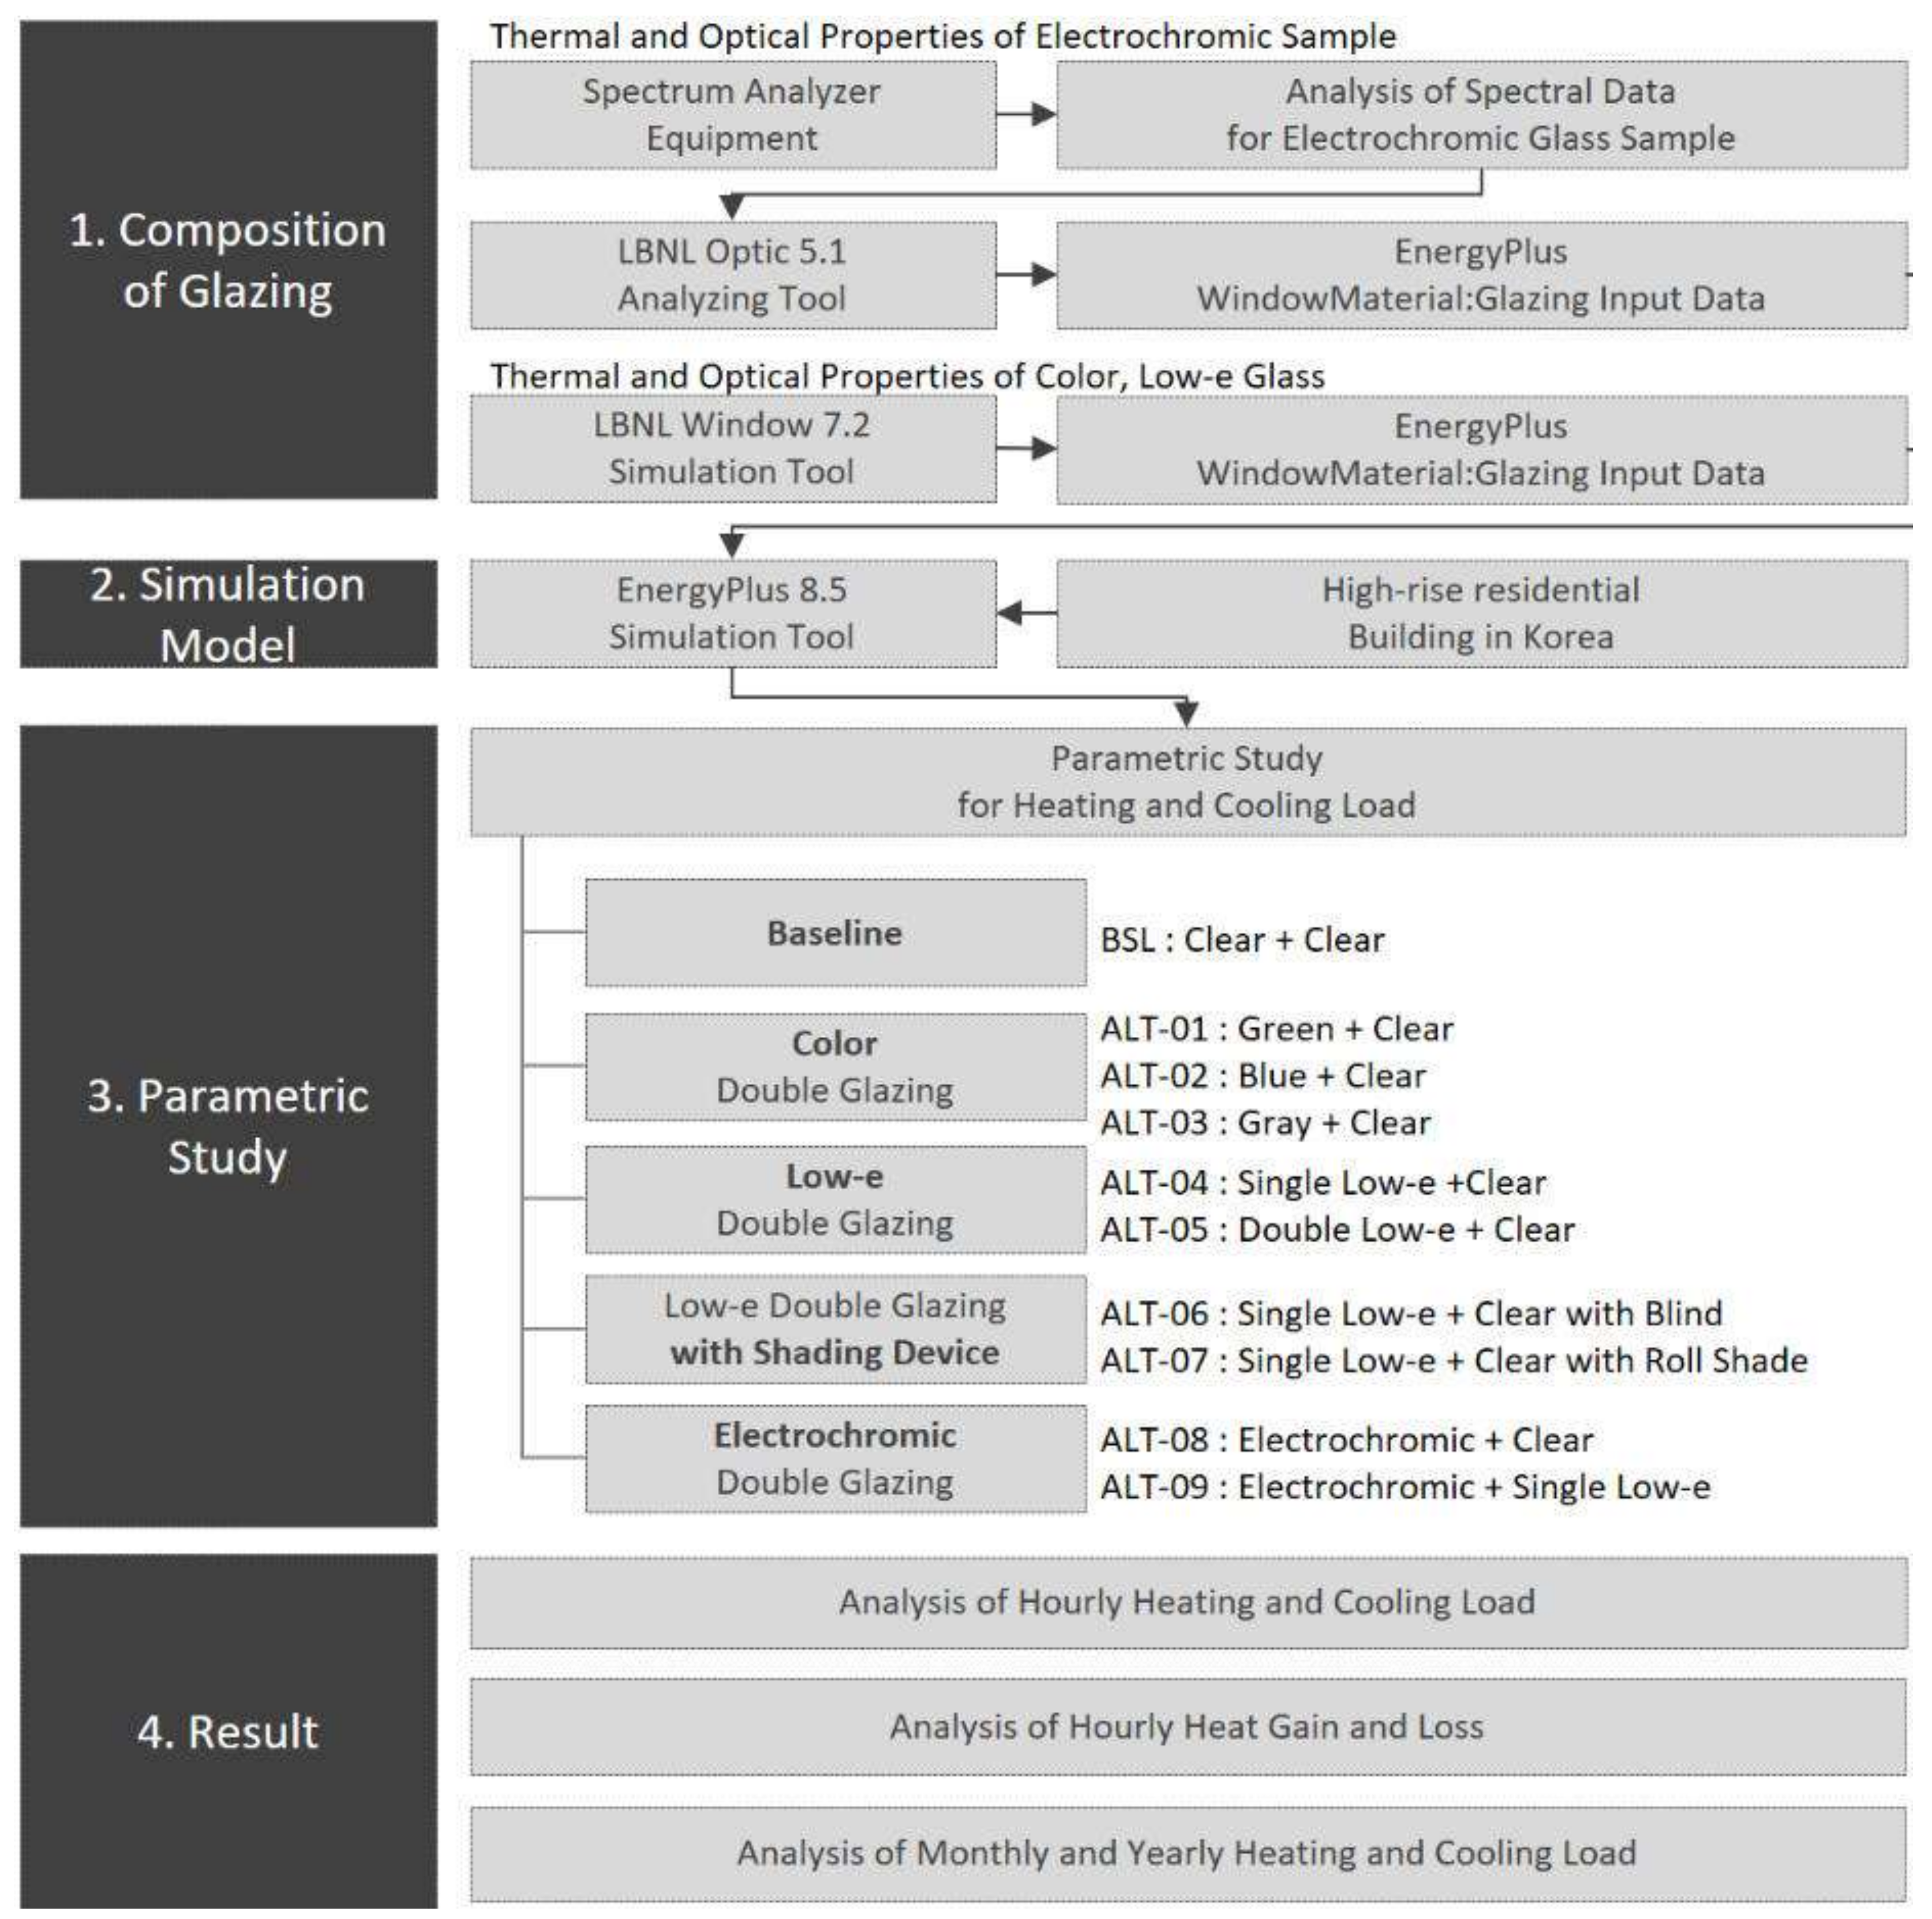
Figure 2.
Electrochromic glass cell and colored mode.

Figure 3.
Transmittance of clear glass, single low-e glass, and electrochromic (EC) glass.
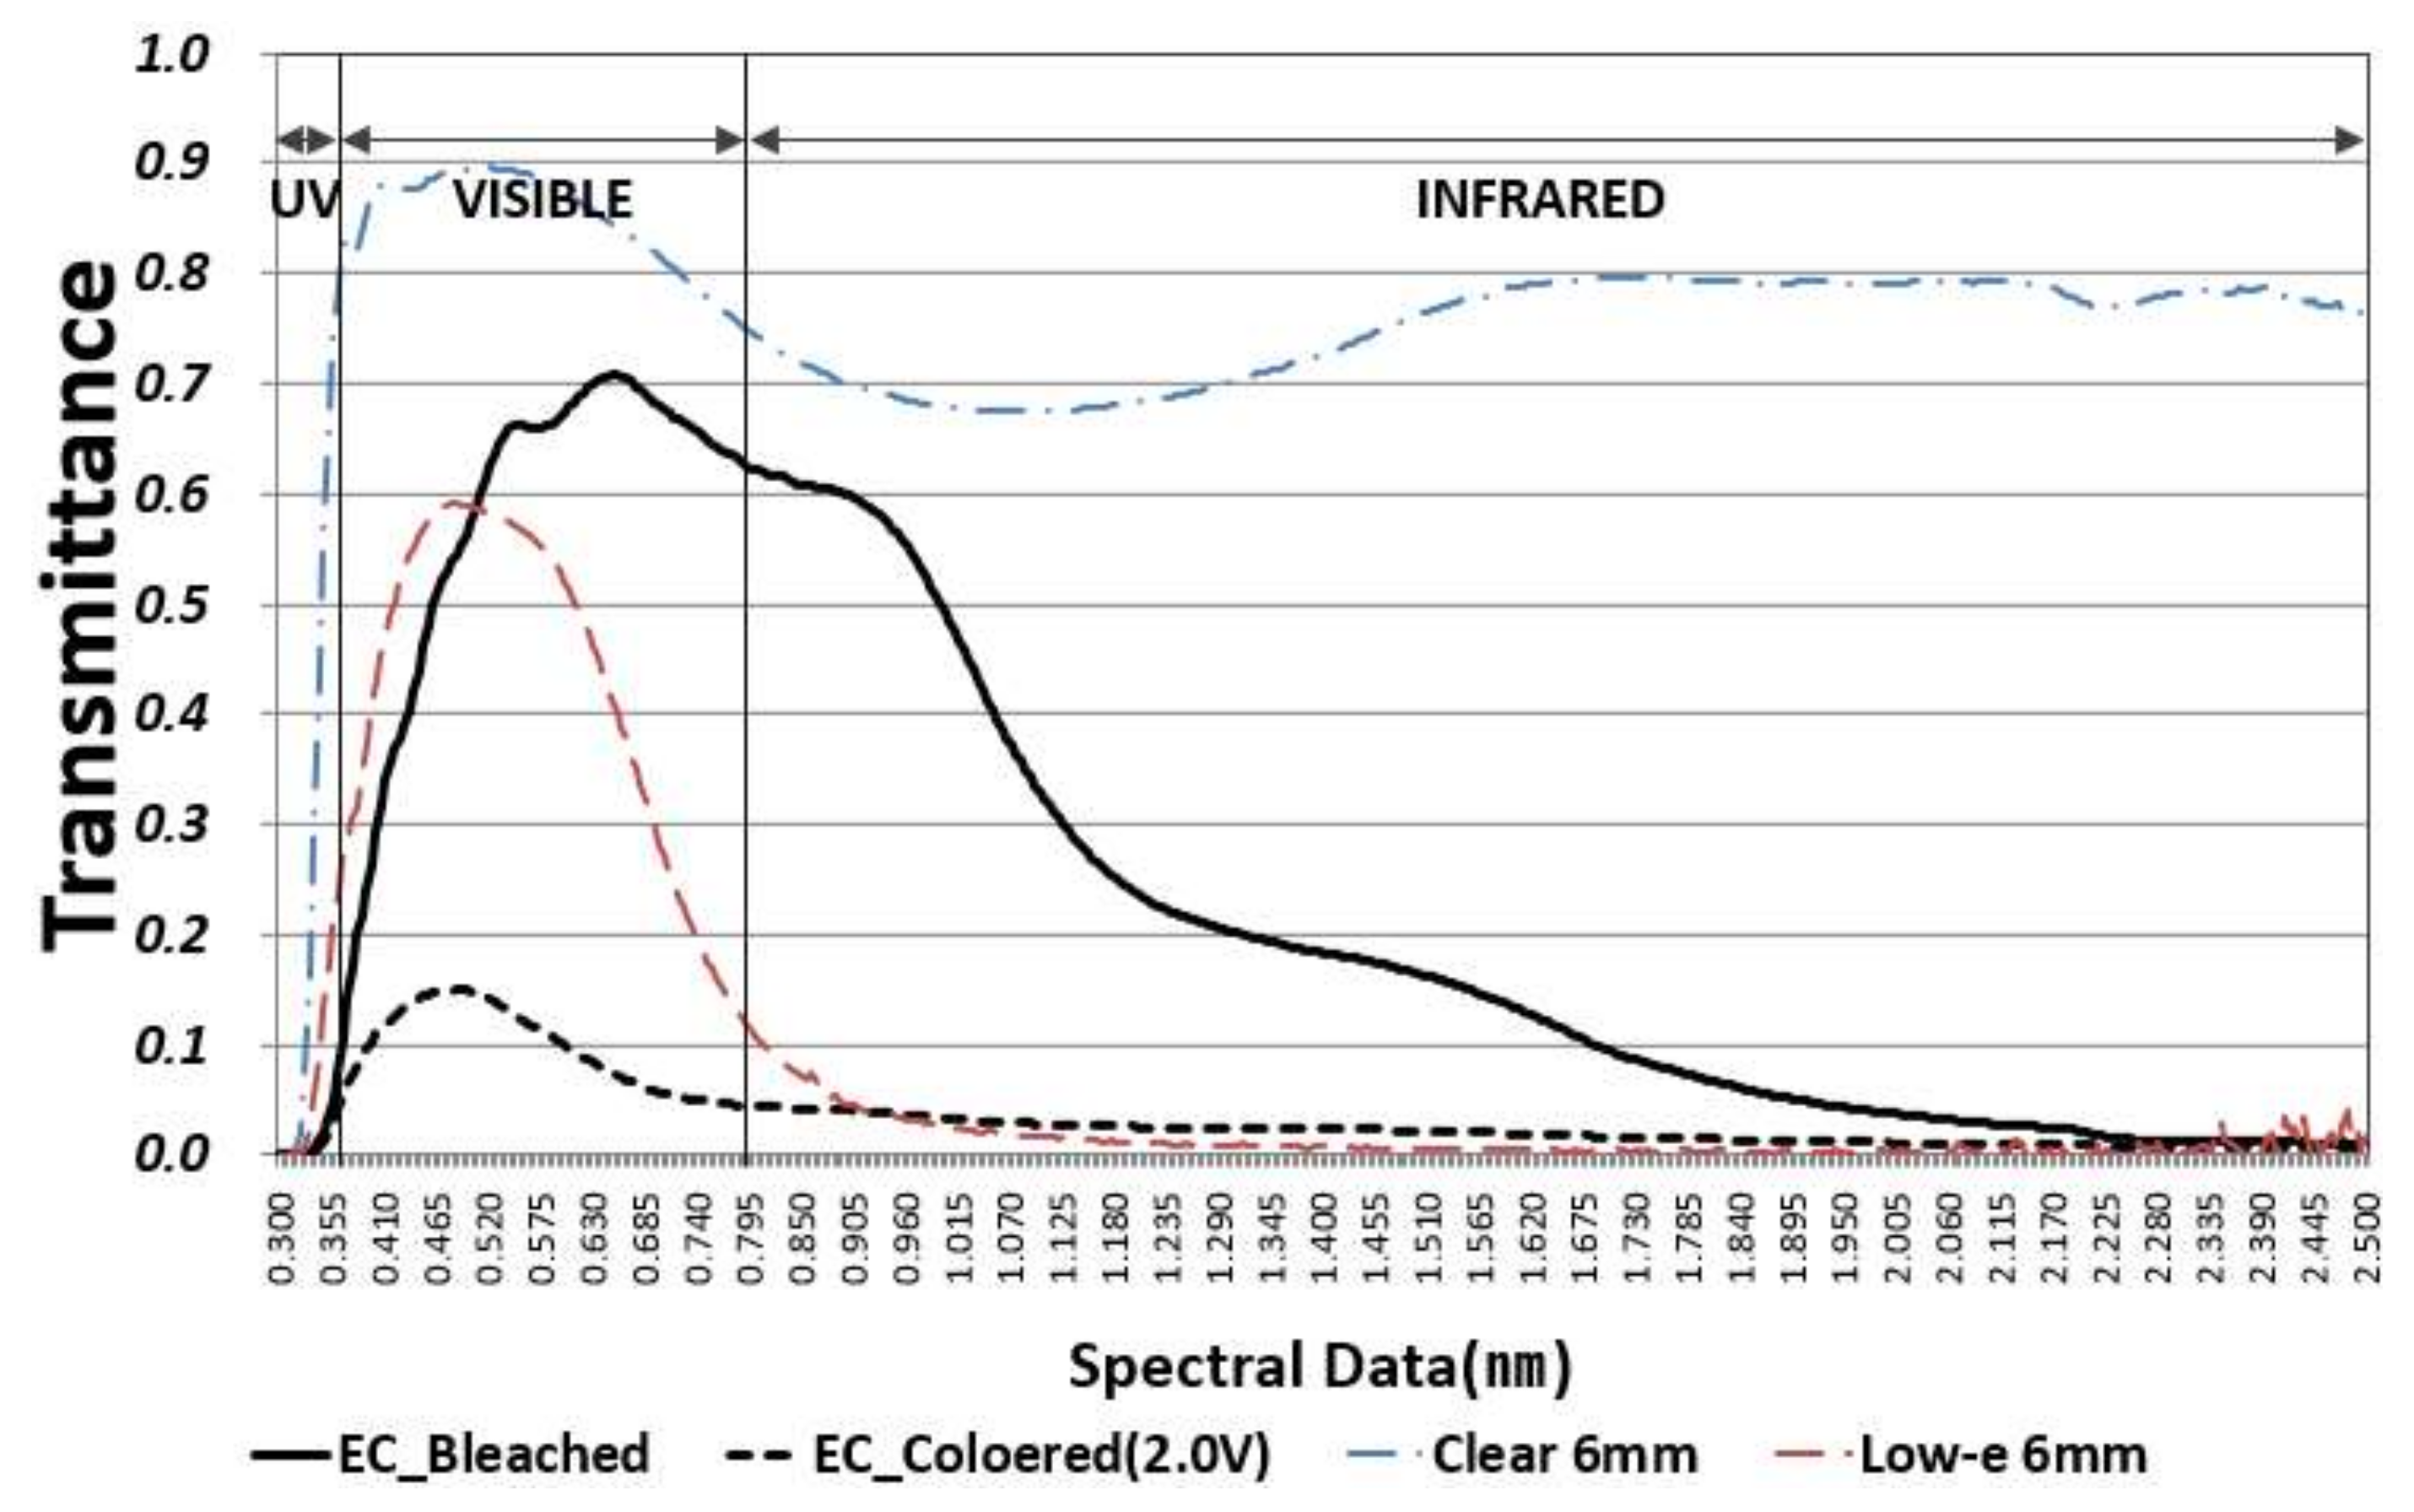
Figure 4.
Front-side reflectance of clear glass, single low-e glass, and electrochromic (EC) glass.

Figure 5.
Back-side reflectance of clear glass, single low-e glass, and electrochromic (EC) glass.

Figure 6.
Perspectival view (left) and EnergyPlus simulation model by OpenStudio (right).

Figure 7.
Monthly heating and cooling loads of baseline model.
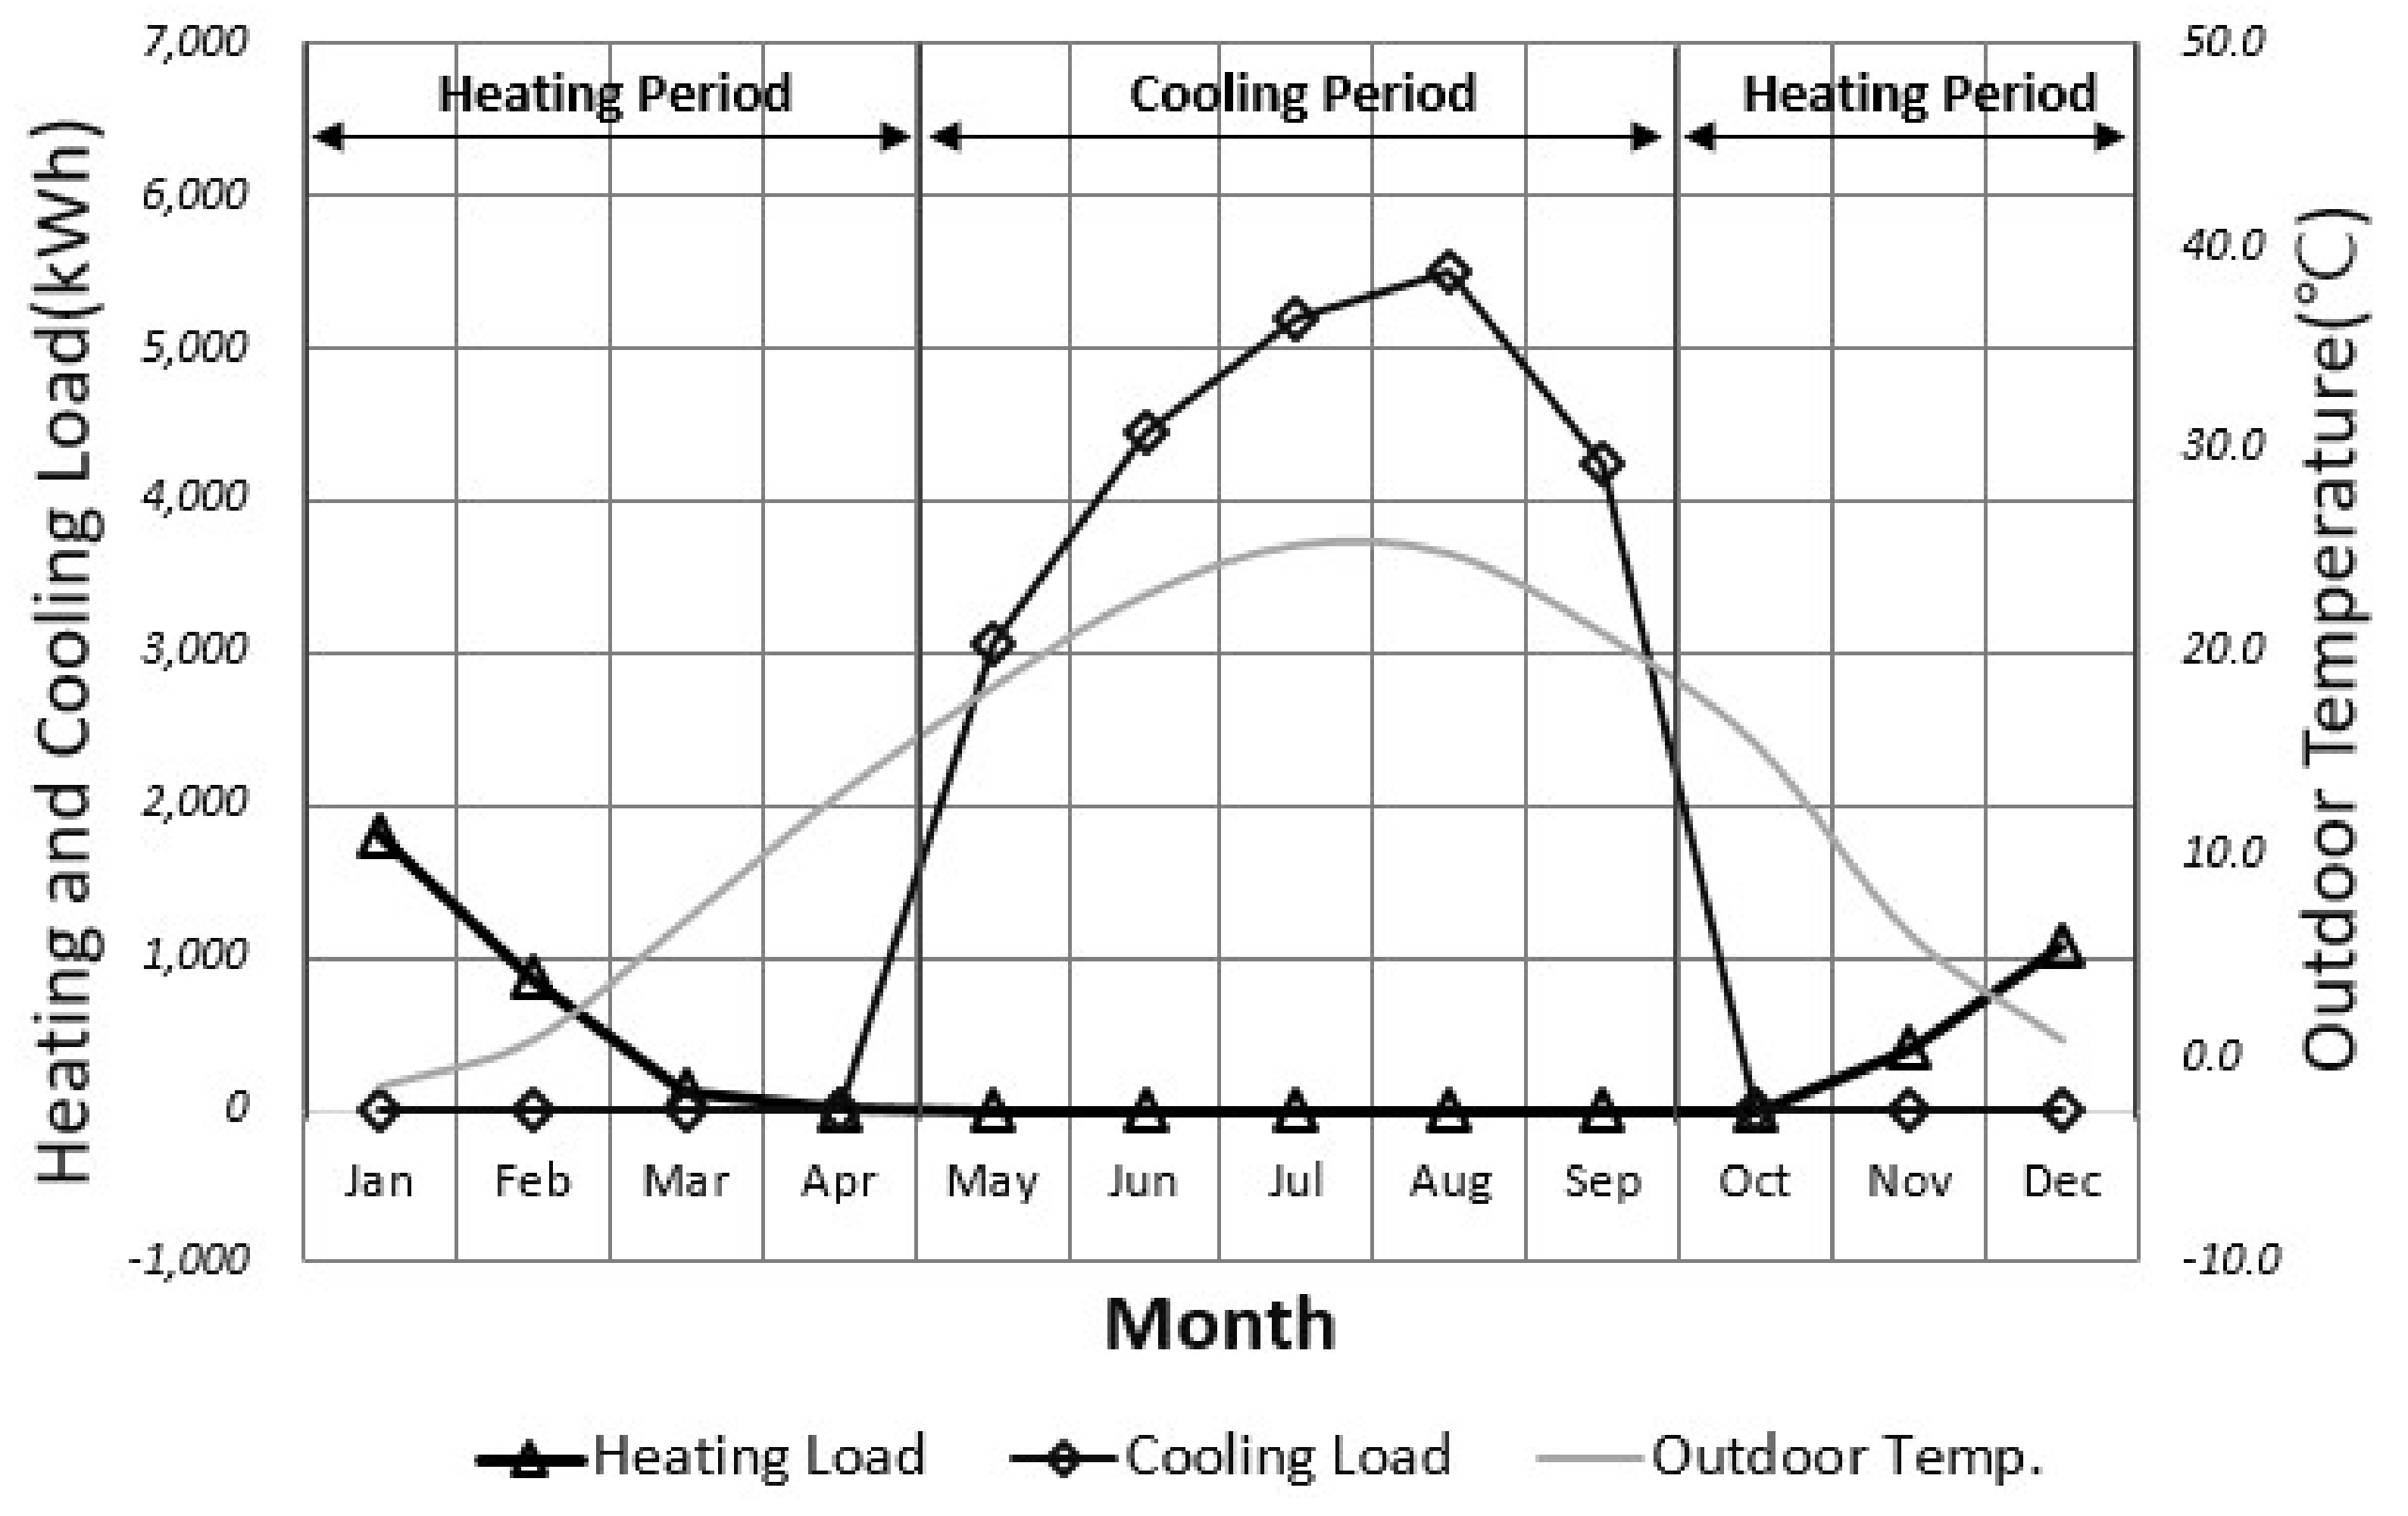
Figure 8.
Optical properties of each type of glazing.

Figure 9.
Glass heat gain and loss of clear, blind, roll shade, and electrochromic glazing.

Figure 10.
Heating loads of clear, colored, and electrochromic (EC) glazing.

Figure 11.
Heating loads of clear, single low-e, double low-e, and electrochromic (EC) glazing.

Figure 12.
Heating loads of blind, roll shade, and electrochromic (EC) glazing.

Figure 13.
Glass heat gain and loss of clear, single low-e, double low-e, and electrochromic (EC) glazing.
Figure 13.
Glass heat gain and loss of clear, single low-e, double low-e, and electrochromic (EC) glazing.
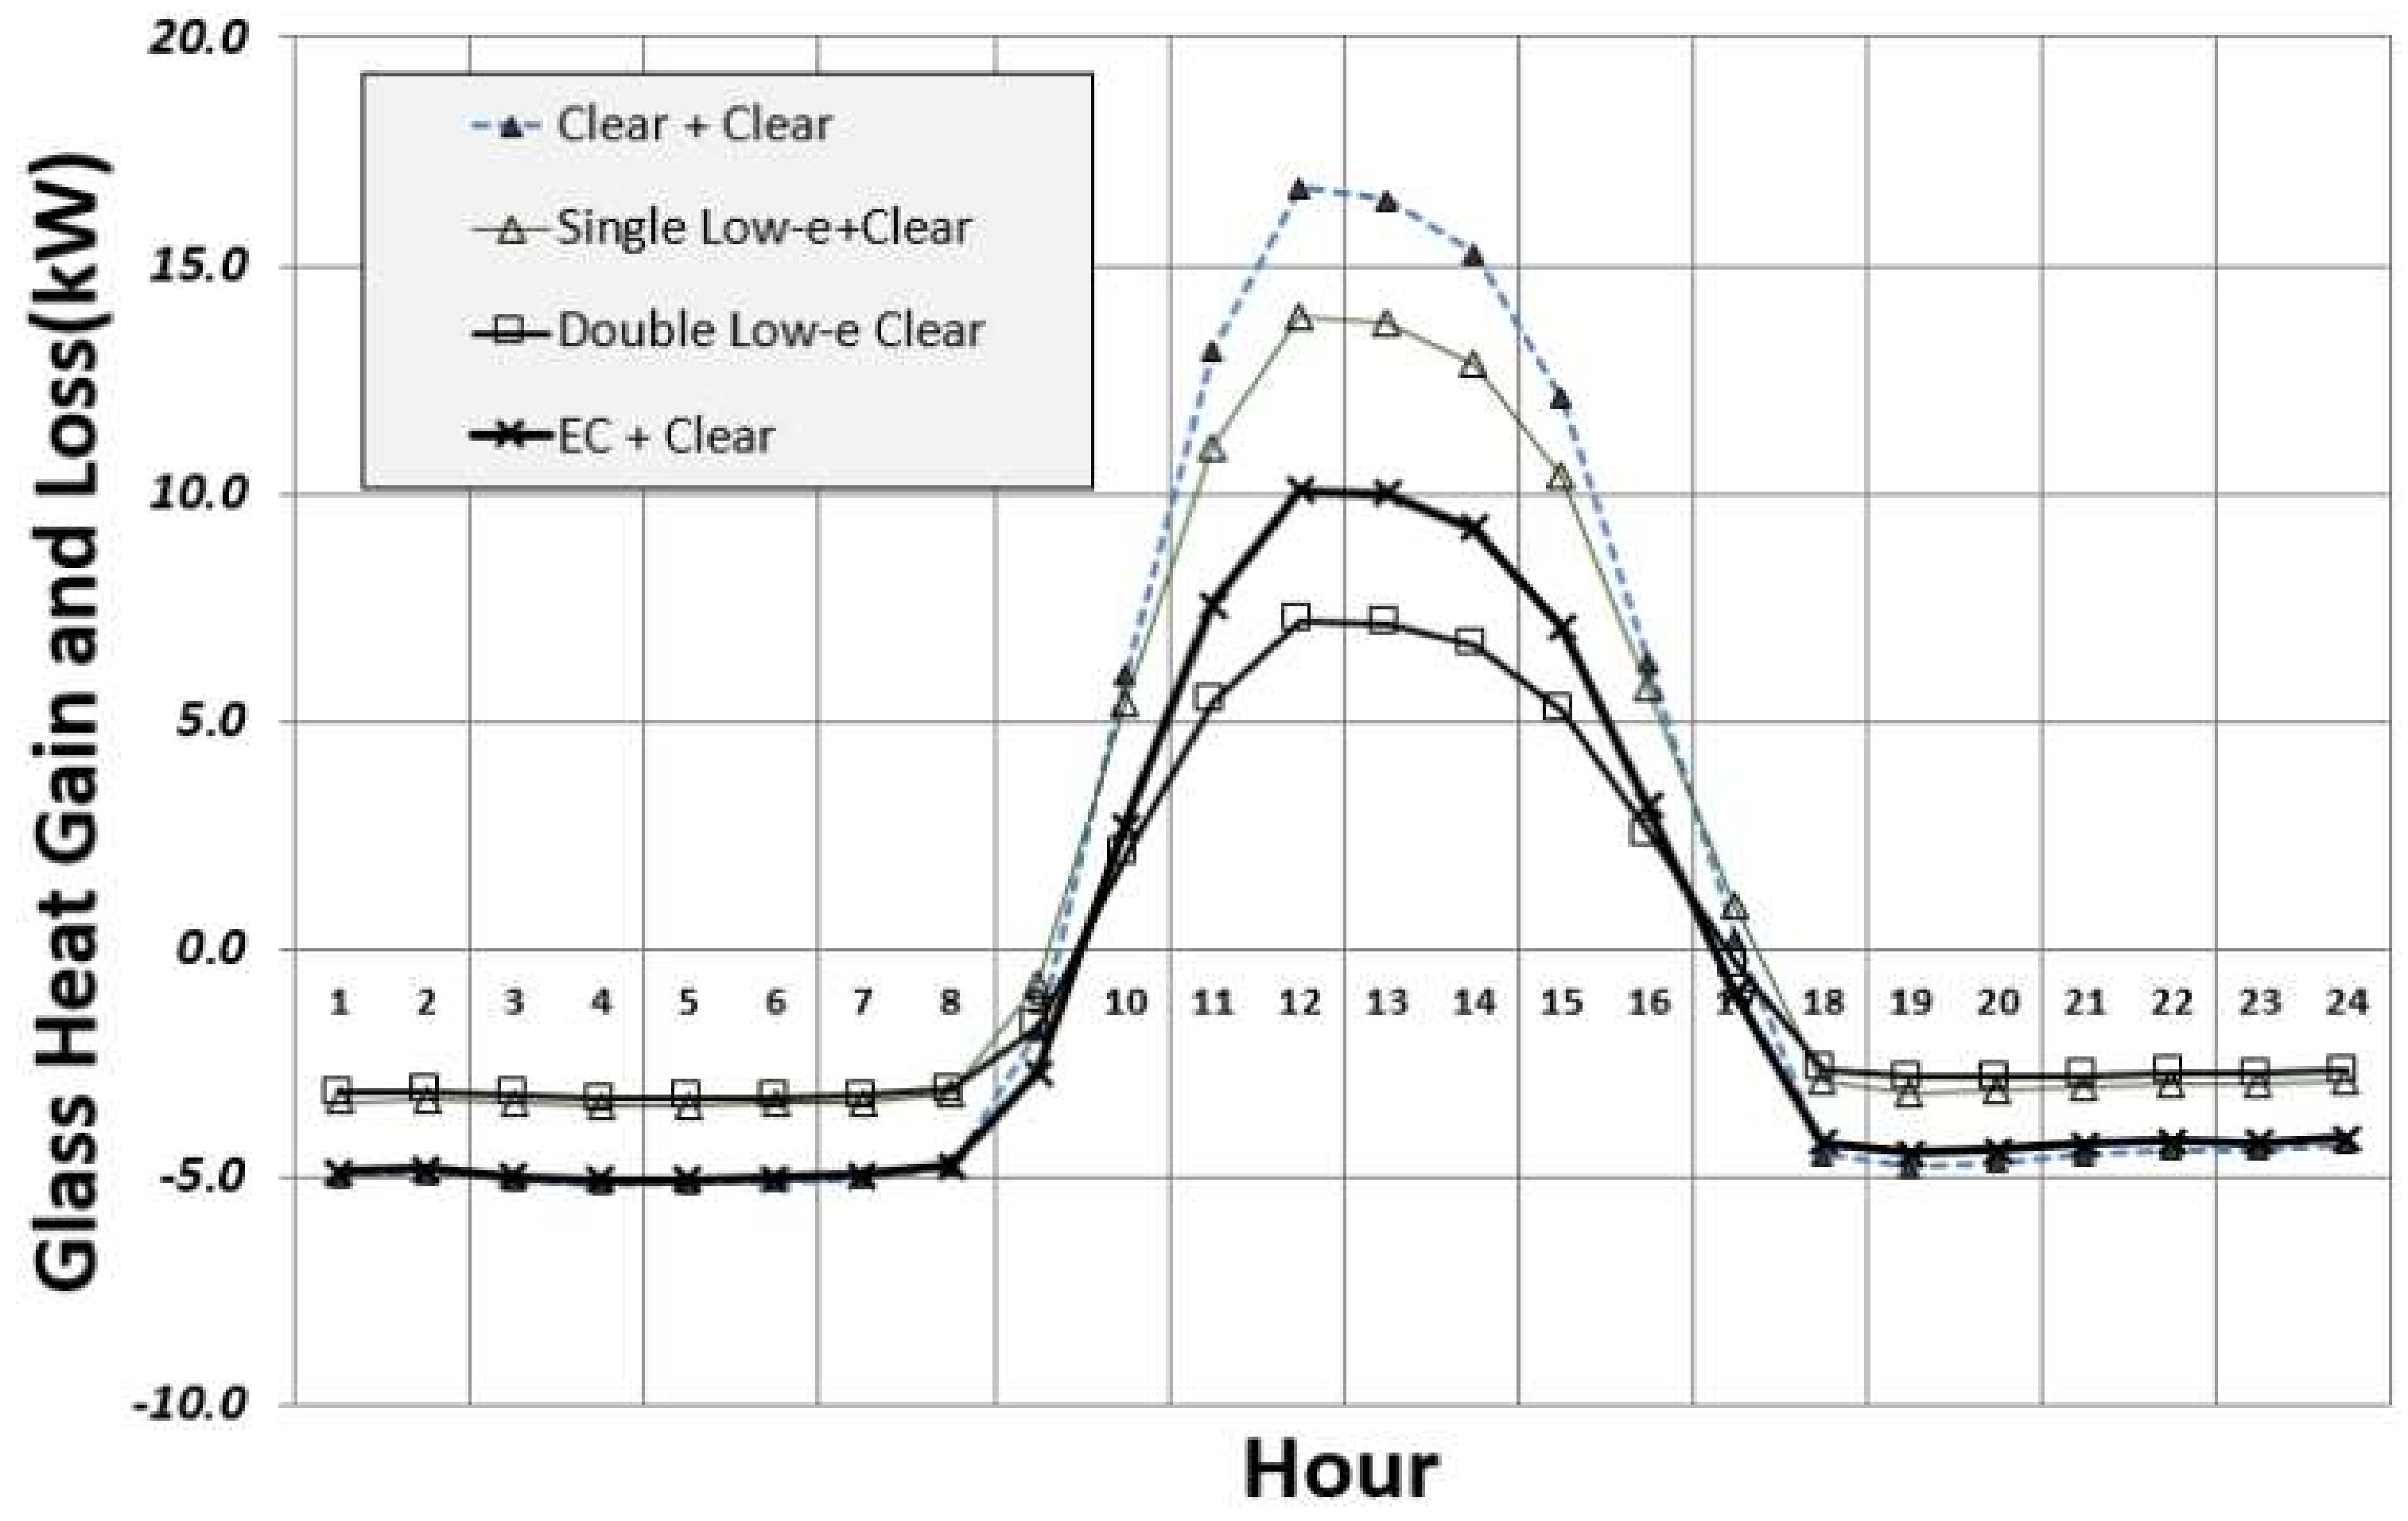
Figure 14.
Glass heat gain and loss of clear, blind, roll shade, and electrochromic (EC) glazing.

Figure 15.
Cooling loads of clear, colored, and electrochromic (EC) glazing.

Figure 16.
Glass heat gain and loss of clear, blind, roll shade, and electrochromic (EC) glazing.

Figure 17.
Cooling loads of clear, single low-e, double low-e, and electrochromic (EC) glazing.
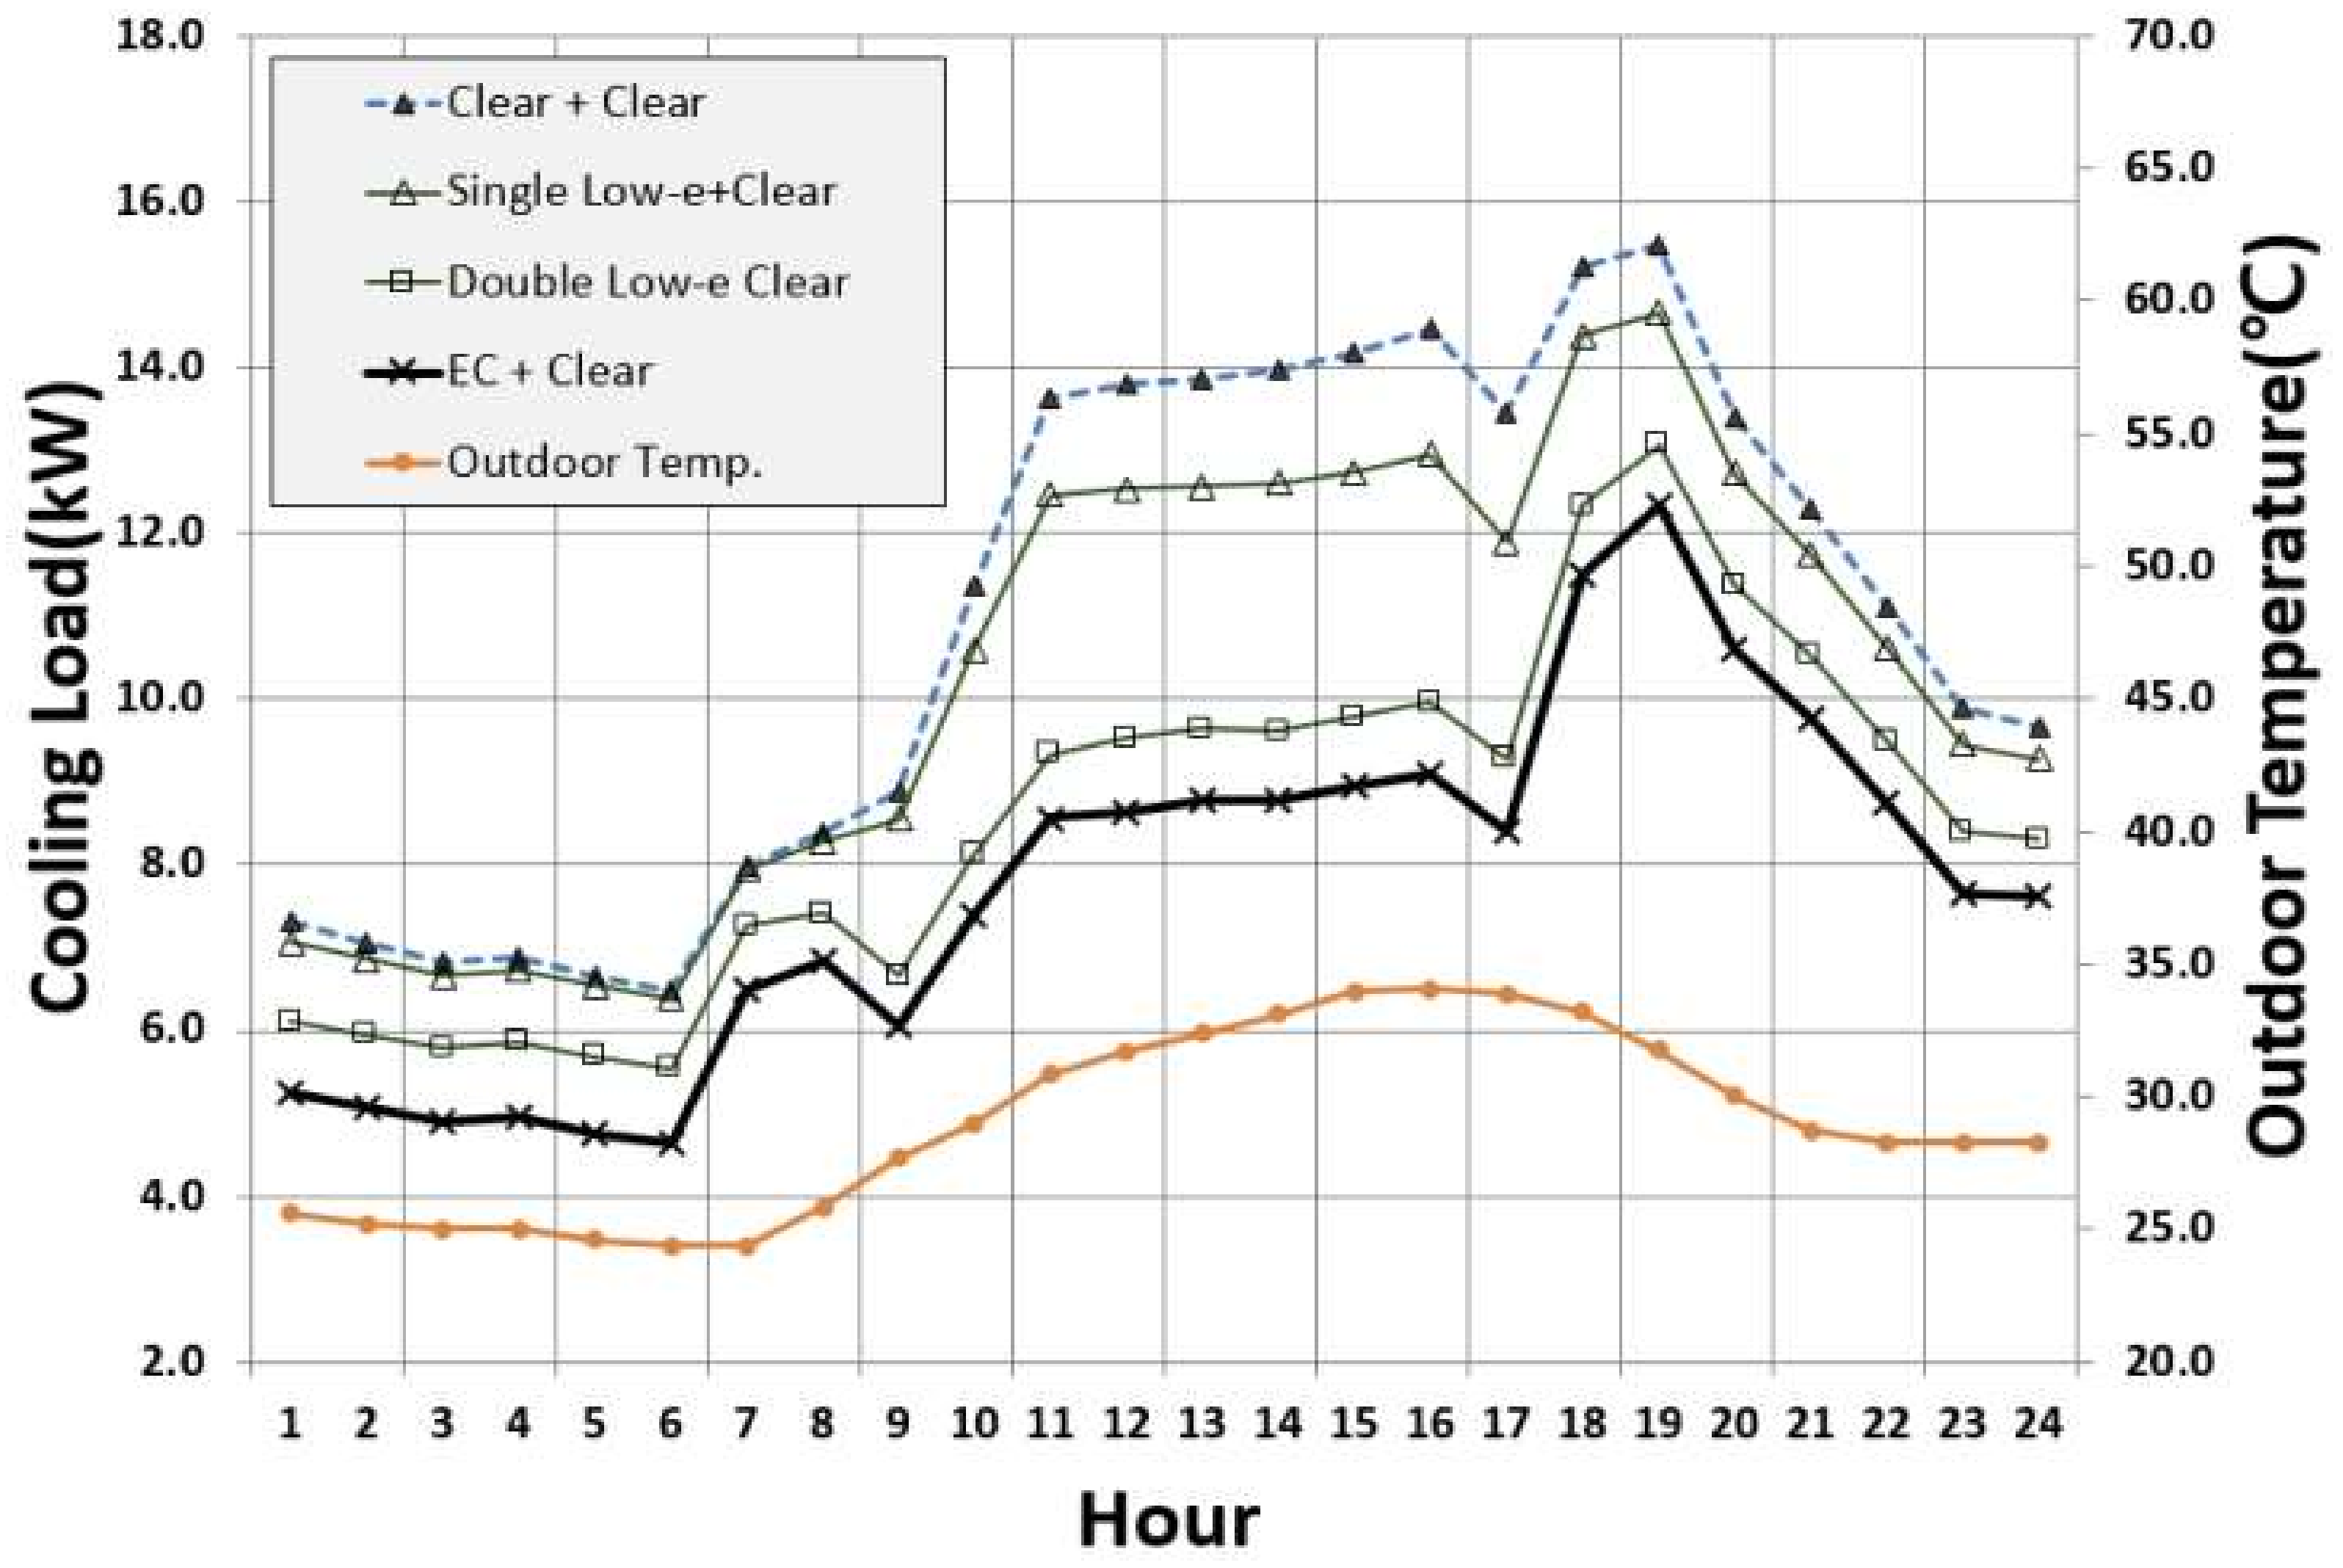
Figure 18.
Glass heat gain and loss of clear, low-e, and electrochromic (EC) glazing.

Figure 19.
Cooling loads of blind, roll shade, and electrochromic (EC) glazing.

Figure 20.
Internal surface temperature of blind, roll shade, and electrochromic (EC) glazing.

Figure 21.
Glass heat gain and loss of clear, blind, roll shade, and electrochromic (EC) glazing.

Figure 22.
Comparison of annual heating and cooling loads.

Figure 23.
Annual heating and cooling loads of clear, colored, and electrochromic (EC) glazing.

Figure 24.
Annual heating and cooling loads of clear, low-e, and electrochromic (EC) glazing.

Figure 25.
Annual heating and cooling loads of clear, blind, roll shade, and electrochromic (EC) glazings.
Figure 25.
Annual heating and cooling loads of clear, blind, roll shade, and electrochromic (EC) glazings.

Table 1.
Input data concerning electrochromic (EC) glass to EnergyPlus.
| Division | EC Glass (Bleached) | EC Glass (Colored) | |
|---|---|---|---|
| Thickness (mm) | 9 | 9 | |
| Solar Transmittance | front | 0.481 | 0.065 |
| back | 0.481 | 0.065 | |
| Solar Reflectance | front | 0.214 | 0.181 |
| back | 0.190 | 0.168 | |
| Visible Transmittance | front | 0.648 | 0.120 |
| back | 0.648 | 0.120 | |
| Visible Reflectance | front | 0.128 | 0.074 |
| back | 0.111 | 0.062 | |
| Front and back side emissivity | 0.840 | 0.840 | |
| Conductivity (W/mK) | 1.000 | 1.000 | |
Table 2.
Composition of simulation base model. SHGC: solar heat gain coefficient.
| Division | Materials | Thermal Properties |
|---|---|---|
| Exterior wall | 200 mm concrete 155 t insulation 19 mm gypsum board | U-value 0.429 W/m2 K |
| Interior floor | 150 mm concrete 30 mm insulation 40 mm ALC(Autoclaved lightweight concrete) 30 mm mortar | U-value 1.186 W/m2 K |
| Glazing | 24 mm double glazing (6 clear + 12 air + 6 clear) | SHGC 0.695 Tvis 0.777 U-value 2.543 |
Table 3.
Internal gain.
| Internal Load Type | Maximum Value |
|---|---|
| Overhead lighting (W/m2) | 10.8 |
| Peak occupancy (m2/person) | 17.0 |
| Equipment (W/m2) | 8.6 |
Table 4.
Proportions of heating and cooling loads.
| Division | Total Load (kWh) | |
|---|---|---|
| Heating | Cooling | |
| Total | 4285.1 | 22,490.0 |
| Rate | 16.0% | 84.0% |
Table 5.
Thermal properties of each type of glazing.
| Division | U-Value | SHGC | Tvis | |||
|---|---|---|---|---|---|---|
| BSL * | Baseline | clear + clear | 2.685 | 0.714 | 0.790 | |
| ALT-01 | Colored glazing | green + clear | 2.685 | 0.632 | 0.671 | |
| ALT-02 | blue + clear | 2.685 | 0.616 | 0.511 | ||
| ALT-03 | gray + clear | 2.685 | 0.618 | 0.393 | ||
| ALT-04 | Low-e glazing | single low-e+ clear | 1.630 | 0.571 | 0.711 | |
| ALT-05 | double low-e + clear | 1.600 | 0.325 | 0.503 | ||
| ALT-06 | Low-e glazing with shading device | interior blind + clear + single low-e | open | 1.630 | 0.571 | 0.711 |
| close | 1.624 | 0.333 | 0.000 | |||
| ALT-07 | interior roll shade + clear + single low-e | open | 1.630 | 0.571 | 0.711 | |
| close | 1.579 | 0.319 | 0.000 | |||
| ALT-08 | Electrochromic glazing (controlled) | EC + clear | bleached | 2.853 | 0.487 | 0.579 |
| colored | 2.853 | 0.191 | 0.107 | |||
| ALT-09 | EC + single low-e | bleached | 1.619 | 0.409 | 0.521 | |
| colored | 1.619 | 0.128 | 0.096 | |||
* BSL: Baseline.
Table 6.
Heating loads of clear, colored, and electrochromic (EC) glazing.
| Glass Division | Clear | Green | Blue | Gray | EC | |
|---|---|---|---|---|---|---|
| Bleached | ||||||
| Glazing properties | U-Value (W/m2 K) | 2.685 | 2.685 | 2.685 | 2.685 | 2.853 |
| SHGC | 0.714 | 0.632 | 0.616 | 0.618 | 0.487 | |
| Tvis | 0.790 | 0.671 | 0.511 | 0.393 | 0.579 | |
| Heating load (kWh) | 83.0 | 89.7 | 91.0 | 90.9 | 105.0 | |
| ※ Double Glazing—[Clear, Green, Blue, Gray, EC] + Clear Glass | ||||||
Table 7.
Heat flow through clear, colored, and electrochromic (EC) glazing.
| Glass Division | Clear | Green | Blue | Gray | EC |
|---|---|---|---|---|---|
| Bleached | |||||
| Transmitted solar (kWh) | 106.1 | 62.0 | 52.7 | 54.2 | 64.4 |
| Convection heat flow (kWh) | −26.5 | −19.7 | −17.9 | −18.2 | −27.9 |
| Infrared heat flow (kWh) | −70.1 | −45.8 | −41.0 | −41.8 | −61.0 |
| Shortwave heat flow (kWh) | 3.3 | 1.2 | 0.9 | 0.9 | 1.3 |
| Total heat flow (kWh) | 6.2 | −4.8 | −7.0 | −6.8 | −25.8 |
Table 8.
Heating loads of clear, low-e, and electrochromic (EC) glazing.
| Glass Division | Clear | Single Low-e | Double Low-e | EC | |
|---|---|---|---|---|---|
| Bleached | |||||
| Glazing properties | U-Value (W/m2 K) | 2.685 | 1.630 | 1.600 | 2.853 |
| SHGC | 0.714 | 0.571 | 0.325 | 0.487 | |
| Tvis | 0.790 | 0.711 | 0.503 | 0.579 | |
| Heating load (kWh) | 83.0 | 65.7 | 86.2 | 105.0 | |
| ※ Double Glazing—[Clear, Single Low-e, Double Low-e, EC] + Clear Glass | |||||
Table 9.
Heat flow through clear, low-e, and electrochromic (EC) glazing.
| Glass Division | Clear | Single Low-e | Double Low-e | EC |
|---|---|---|---|---|
| Bleached | ||||
| Transmitted solar (kWh) | 106.1 | 68.3 | 33.3 | 64.4 |
| Convection heat flow (kWh) | −26.5 | −9.8 | −11.6 | −27.9 |
| Infrared heat flow (kWh) | −70.1 | −34.3 | −32.1 | −61.0 |
| Shortwave heat flow (kWh) | 3.3 | 1.5 | 0.4 | 1.3 |
| Total heat flow (kWh) | 6.2 | 22.7 | −10.7 | −25.8 |
Table 10.
Heating load of clear, shading devices, and electrochromic (EC) glazing.
| Glass Division | Clear | Blind | Roll Shade | EC | |
|---|---|---|---|---|---|
| Open | Bleached | ||||
| Glazing properties | U-Value (W/m2 K) | 2.685 | 1.630 | 1.630 | 1.619 |
| SHGC | 0.714 | 0.571 | 0.571 | 0.409 | |
| Tvis | 0.790 | 0.711 | 0.711 | 0.521 | |
| Heating load (kWh) | 83.0 | 65.7 | 65.7 | 81.5 | |
| ※ Double Glazing—[Clear, Single Low-e, Double Low-e, EC] + Single Low-e Glass | |||||
Table 11.
Heat flow through clear, blind, roll shade, and electrochromic (EC) glazing.
| Glass Division | Clear | Blind | Roll Shade | EC |
|---|---|---|---|---|
| Bleached | ||||
| Transmitted solar (kWh) | 106.1 | 68.3 | 68.3 | 42.4 |
| Convection heat flow (kWh) | −26.5 | −9.8 | −9.8 | −11.9 |
| Infrared heat flow (kWh) | −70.1 | −34.3 | −34.3 | −34.0 |
| Shortwave heat flow (kWh) | 3.3 | 1.5 | 1.5 | 0.6 |
| Total heat flow (kWh) | 6.2 | 22.7 | 22.7 | −4.1 |
Table 12.
Cooling loads of clear, colored, and electrochromic (EC) glazing.
| Glass Division | Clear | Green | Blue | Gray | EC | |
|---|---|---|---|---|---|---|
| Colored | ||||||
| Glazing properties | U-Value (W/m2 K) | 2.685 | 2.685 | 2.685 | 2.685 | 2.853 |
| SHGC | 0.714 | 0.632 | 0.616 | 0.618 | 0.191 | |
| Tvis | 0.790 | 0.671 | 0.511 | 0.393 | 0.107 | |
| Cooling Load (kWh) | 262.2 | 252.6 | 250.7 | 251.0 | 185.8 | |
| ※ Double Glazing—[Clear, Green, Blue, Gray, EC] + Clear Glass | ||||||
Table 13.
Heat flow through clear, colored, and electrochromic (EC) glazing.
| Glass Division | Clear | Green | Blue | Gray | EC |
|---|---|---|---|---|---|
| Colored | |||||
| Transmitted solar (kWh) | 106.6 | 61.4 | 52.0 | 53.5 | 8.7 |
| Convection heat flow (kWh) | 9.8 | 20.3 | 22.4 | 22.0 | 13.4 |
| Infrared heat flow (kWh) | 0.7 | 24.4 | 29.3 | 28.4 | 20.6 |
| Shortwave heat flow (kWh) | 2.8 | 1.0 | 0.7 | 0.7 | 0.0 |
| Total heat flow (kWh) | 114.3 | 105.1 | 103.0 | 103.2 | 42.7 |
Table 14.
Cooling loads of clear, low-e, and electrochromic (EC) glazing.
| Glass Division | Clear | Single Low-e | Double Low-e | EC | |
|---|---|---|---|---|---|
| Colored | |||||
| Glazing properties | U-Value (W/m2 K) | 2.685 | 1.630 | 1.600 | 2.853 |
| SHGC | 0.714 | 0.571 | 0.325 | 0.191 | |
| Tvis | 0.790 | 0.711 | 0.503 | 0.107 | |
| Cooling load (kWh) | 262.2 | 246.2 | 205.1 | 185.8 | |
| ※ Double Glazing—[Clear, Single Low-e, Double Low-e, EC] + Clear Glass | |||||
Table 15.
Heat flow through clear, low-e, and electrochromic (EC) glazing.
| Glass Division | Clear | Single Low-e | Double Low-e | EC |
|---|---|---|---|---|
| Bleached | ||||
| Transmitted solar (kWh) | 106.6 | 68.4 | 33.5 | 8.7 |
| Convection heat flow (kWh) | 9.8 | 14.7 | 11.3 | 13.4 |
| Infrared heat flow (kWh) | 0.7 | 14.7 | 13.7 | 20.6 |
| Shortwave heat flow (kWh) | 2.8 | 1.2 | 0.3 | 0.0 |
| Total heat flow (kWh) | 114.3 | 96.5 | 58.2 | 42.7 |
Table 16.
Cooling loads of clear, blind, roll shade, and electrochromic (EC) glazing.
| Glass Division | Clear | Blind | Roll Shade | EC | |
|---|---|---|---|---|---|
| Closed | Colored | ||||
| Glazing properties | U-Value (W/m2 K) | 2.685 | 1.624 | 1.579 | 1.619 |
| SHGC | 0.714 | 0.333 | 0.319 | 0.128 | |
| Tvis | 0.790 | 0.000 | 0.000 | 0.096 | |
| Cooling load (kWh) | 262.2 | 208.8 | 205.4 | 170.6 | |
| ※ Double Glazing—[Clear, Single Low-e, Double Low-e, EC] + Single Low-e Glass | |||||
Table 17.
Heat flow through clear, blind, roll shade, and electrochromic (EC) glazing.
| Glass Division | Clear | Blind | Roll Shade | EC |
|---|---|---|---|---|
| Bleached | ||||
| Transmitted solar (kWh) | 106.6 | 1.5 | 0.0 | 5.7 |
| Convection heat flow (kWh) | 9.8 | 39.5 | 46.4 | 8.6 |
| Infrared heat flow (kWh) | 0.7 | 19.5 | 11.4 | 13.4 |
| Shortwave heat flow (kWh) | 2.8 | 0.0 | 0.0 | 0.0 |
| Total heat flow (kWh) | 114.3 | 60.5 | 57.7 | 27.7 |
Table 18.
Heating and cooling loads.
| Glass Division | Heating Load | Cooling Load | Total Load | Reduction Rate |
|---|---|---|---|---|
| Baseline (clear + clear) | 4285.1 | 22,490.0 | 26,775.1 | 0.0% |
| Green + clear | 4895.5 | 21,409.2 | 26,304.7 | −1.8% |
| Blue + clear | 5014.4 | 21,190.0 | 26,204.5 | −2.1% |
| Gray + clear | 4999.5 | 21,215.5 | 26,214.9 | −2.1% |
| Single low-e + clear | 2999.4 | 22,060.6 | 25,060.0 | −6.4% |
| Double low-e + clear | 4654.4 | 17,715.3 | 22,369.6 | −16.5% |
| Single low-e + clear with blind | 2999.4 | 18,775.8 | 21,775.3 | −18.7% |
| Single low-e + clear with roll shade | 2999.4 | 18,148.6 | 21,148.0 | −21.0% |
| EC + clear | 6073.3 | 14,343.0 | 20,416.3 | −23.7% |
| EC + single low-e | 4294.7 | 14,082.1 | 18,376.8 | −31.4% |
© 2018 by the authors. Licensee MDPI, Basel, Switzerland. This article is an open access article distributed under the terms and conditions of the Creative Commons Attribution (CC BY) license (http://creativecommons.org/licenses/by/4.0/).
Share and Cite
MDPI and ACS Style
Oh, M.; Tae, S.; Hwang, S. Analysis of Heating and Cooling Loads of Electrochromic Glazing in High-Rise Residential Buildings in South Korea. Sustainability 2018, 10, 1121. https://doi.org/10.3390/su10041121
AMA Style
Oh M, Tae S, Hwang S. Analysis of Heating and Cooling Loads of Electrochromic Glazing in High-Rise Residential Buildings in South Korea. Sustainability. 2018; 10(4):1121. https://doi.org/10.3390/su10041121
Chicago/Turabian StyleOh, Myunghwan, Sungho Tae, and Sangkun Hwang. 2018. "Analysis of Heating and Cooling Loads of Electrochromic Glazing in High-Rise Residential Buildings in South Korea" Sustainability 10, no. 4: 1121. https://doi.org/10.3390/su10041121
Note that from the first issue of 2016, this journal uses article numbers instead of page numbers. See further details here.