Potential Impacts of China 2030 High-Speed Rail Network on Ground Transportation Accessibility


1
Department of Geographic and Oceanographic Sciences, Nanjing University, Nanjing 210023, China
2
Department of Geography, University of Florida, Gainesville, FL 32611, USA
3
Jiangsu Provincial Key Laboratory of Geographic Information Science and Technology, Nanjing University, Nanjing 210023, China
4
Jiangsu Center for Collaborative Innovation in Geographical Information Resource Development and Application, Nanjing 210023, China
*
Author to whom correspondence should be addressed.
Sustainability 2018, 10(4), 1270; https://doi.org/10.3390/su10041270
Submission received: 14 March 2018
/
Revised: 14 April 2018
/
Accepted: 16 April 2018
/
Published: 20 April 2018
(This article belongs to the Special Issue Transport Policy)
Abstract
:China has proposed an ambitious high-speed rail (HSR) program by 2030 to connect all provincial capitals (excluding Lhasa) and large cities with more than half million people. Little attention has been paid to evaluate its potential impacts on ground transportation accessibility. To answer this question, we adopted a door-to-door approach to calculate two indicators: the weighted average travel time and daily accessibility. The results show that the HSR network follows the same spatial patterns of population size and regional development, thus preferentially serving eastern China. The two accessibility indicators suggest that the large-scale construction of HSR network by 2030 will substantially improve accessibility and alter the spatial disparities of accessibility. On average, accessibility of all cities will increase by 61.7%. Geographically, cities with higher accessibility are located in the quadrilateral area of ‘Wuhan-Zhengzhou-Jinan-Nanjing’ on the southeastern section of the ‘Hu Line.’ While the least accessible cities are distributed in peripheral areas. Although the HSR development can benefit accessibility throughout the country, the disparities of accessibility would widen slightly among regions, provinces and cities.
1. Introduction
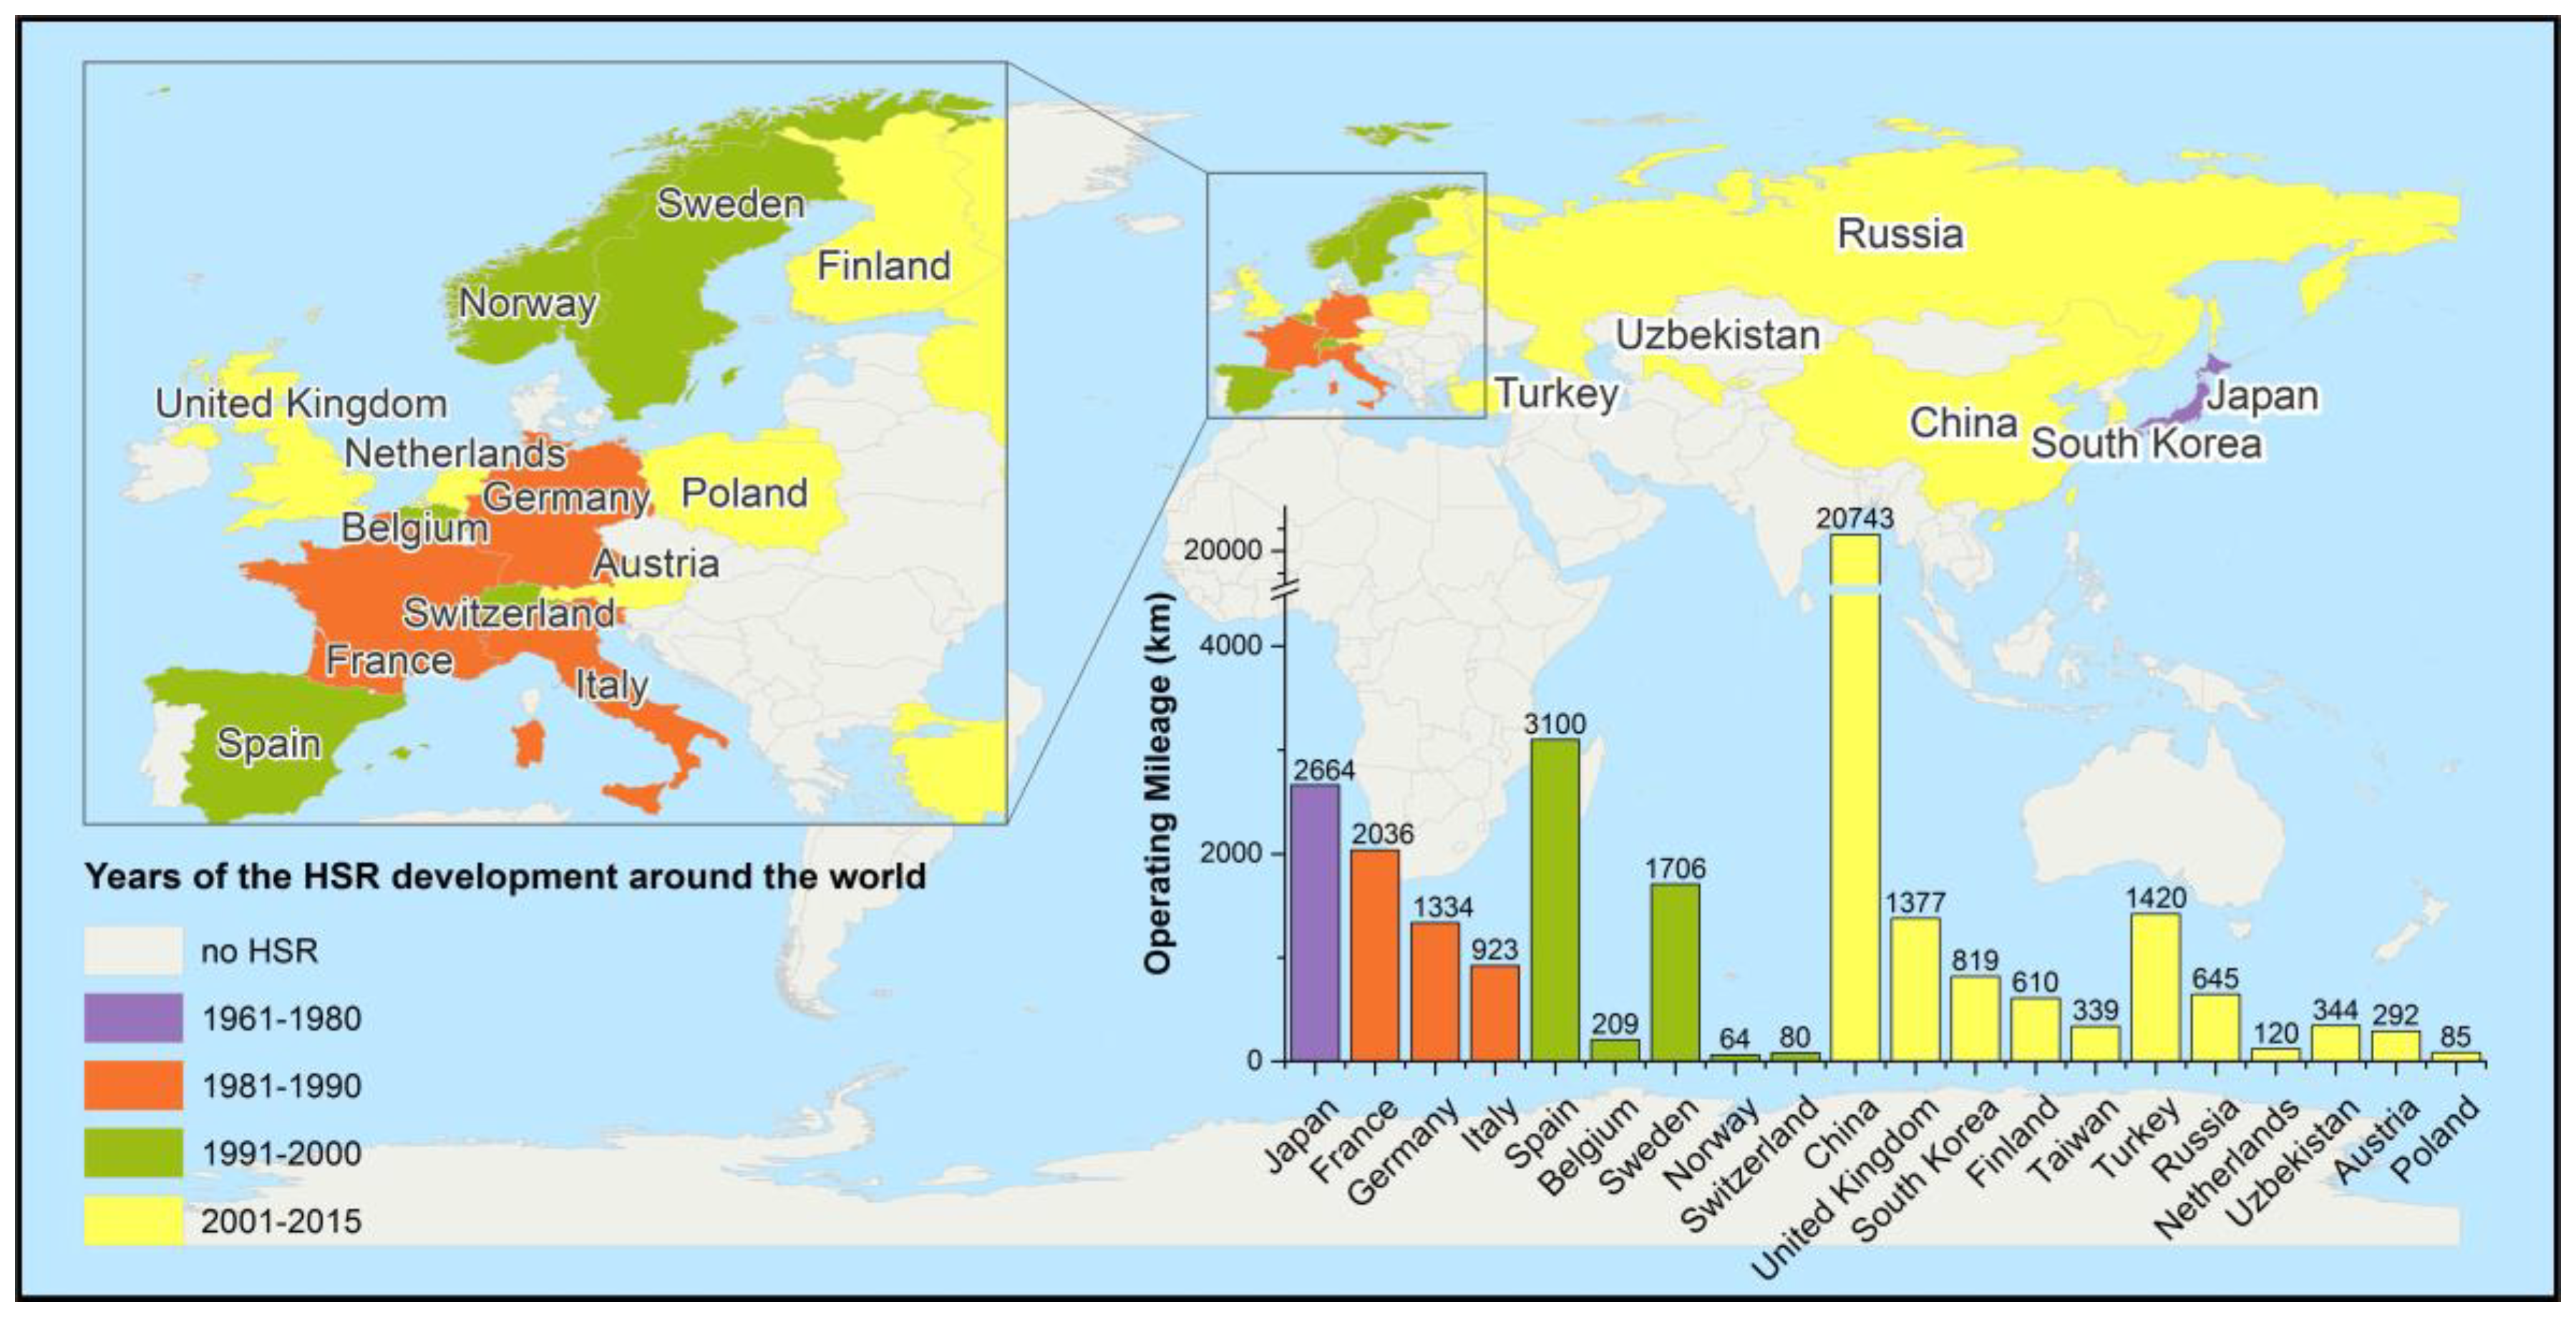
Compared with other forms of ground transportation (e.g., bus, car and conventional rail), the new high-speed rail (HSR) can reduce journey time, offer a higher level of safety and comfort, and lower costs for passengers [1,2]. HSR is also considered a better alternative to air transportation for short trips (150–800 km), when people take into account urban traffic congestion and potential flight delays [3]. Because of these advantages, HSR lines has been growing fast across the world in recent decades [4,5] (Figure 1). The total operating mileage of the worldwide HSR network is predicted to exceed 80,000 km by 2030–2035, thus revolutionizing land-based travel [6]. By 2015, China had constructed the longest HSR network (20,743 km) in the world [5]. The country has proposed an ambitious HSR program by 2030 to link all provincial capitals (excluding Lhasa) and cities with more than half million people [7] (Figure 2). The expansion of HSR network would inevitably contract time-space of the country, and alter the spatial pattern (disparities) of regional accessibility [8,9].
A common goal in almost all transportation plans is to improve accessibility [10,11]. In the current literature, a variety of accessibility measures have been developed to evaluate the impacts of transportation projects during the past few decades, including projects of highways [12,13,14], conventional rail [15,16,17], airports [18,19] and seaports [20]. A small number of studies have analyzed the impacts of China’s HSR network on accessibility but focused primarily on the current HSR network [21,22] and that planned by 2020 [8,23]. Little attention has been paid to the impacts of China’s long-term HSR network plan by 2030. Furthermore, few have considered door-to-door journey time in HSR accessibility, including inner-city travel time and transfer time at railway stations, which offers more realistic estimation. This study aims to address these research gaps by analyzing, based on a door-to-door approach, the potential impacts of China’s HSR development on accessibility between 2003 and 2030.
2. China’s Present and Future HSR Network
China started the construction of its first HSR line, the Qinhuangdao-Shenyang line, in 2003. Since then, its HSR network has expanded rapidly and a total of 62 HSR lines have been completed by the end of 2015 [5] (Figure 3). Currently, China’s HSR network provides excellent connectivity between major provincial capitals across the country, but is mainly concentrated in the eastern China, where population density and economic development are at the highest level. According to the new round of the ‘Mid-to-Long Term Plan for Railway Network’ issued in 2016, China is about to upgrade its HSR network to ‘eight-vertical and eight-horizontal’ corridor lines [7]. By 2030, these HSR lines will achieve 45,000 km and link all provincial capitals (except for Lhasa, capital of Tibet autonomous region) and cities with a population of over half-a-million, particularly those in the central and western regions.
3. Data and Methodology
3.1. Data Sources
This study includes 31 provinces (with the exceptions of Hong Kong, Macao and Taiwan), 4 municipalities, and 333 prefecture-level cities in mainland China. The geographic data (administrative divisions, major water bodies, roads, conventional railways, etc.) were sourced from National Geomatics Center of China [24] and OpenStreetMap [25]. The HSR lines were digitally extracted from the new round of ‘Mid-to-Long Term Plan for Railway Network’ [7] and ‘13th Five-Year Plan for Railway Network’ [26]. Economic and demographic data were obtained from the Economy Prediction System Data Platform [27], China Economic Information Statistics Database [28] and the National Bureau of Statistics of China [29].
Three scenarios were constructed to assess the accessibility impacts of the proposed HSR lines. Scenario 1 is the ground transport network in 2015 without HSR; Scenario 2 is the ground transportation network in 2015 with built HSR network; Scenarios 3 is the planned ground transport network by 2030, comprising the present transport network in 2015 and the future HSR network by 2030. The changes from Scenario 1 to Scenario 2, Scenario 2 to Scenario 3 and Scenario 1 to Scenario 3, are defined as Scenario 2/1 (the first period), Scenario 3/2 (the second period) and Scenario 3/1, respectively. To be comparable, all three scenarios were controlled for the same population, the same GDP level, and the same non-HSR ground transport network. As a result, the reduction in travel time and the improvements in accessibility can be attributed to the expansion of HSR [1,9,23].
3.2. Methodology
3.2.1. Measurement of Travel Time
Travel time is a widely used measure for accessibility, which reflects the ease of travel as determined by the quality of service provided by the transportation [23,30]. We employed a door-to-door approach to calculate times associated with every stage in a journey between origin and destination [31]. The total journey time when using HSR can be divided into four stages (Figure 4): (i) the time from the traveler’s origin location to a railway station; (ii) the transfer and waiting time at the railway station; (iii) the travel time between initial and final railway stations; and (iv) the time from the final railway station to the traveler’s destination.
Therefore, the total journey time of the HSR travel can be expressed as:
where refers to the total journey time of the HSR travel mode from origin to destination, is the travel time from the origin to the railway station, is the travel time between stations by railway, is the travel time from the railway station to the destination and is the transfer time at both railway stations. Here, the transfer time was set to one hour (half-hour per station) [2].
3.2.2. Construction of Frictional Surface
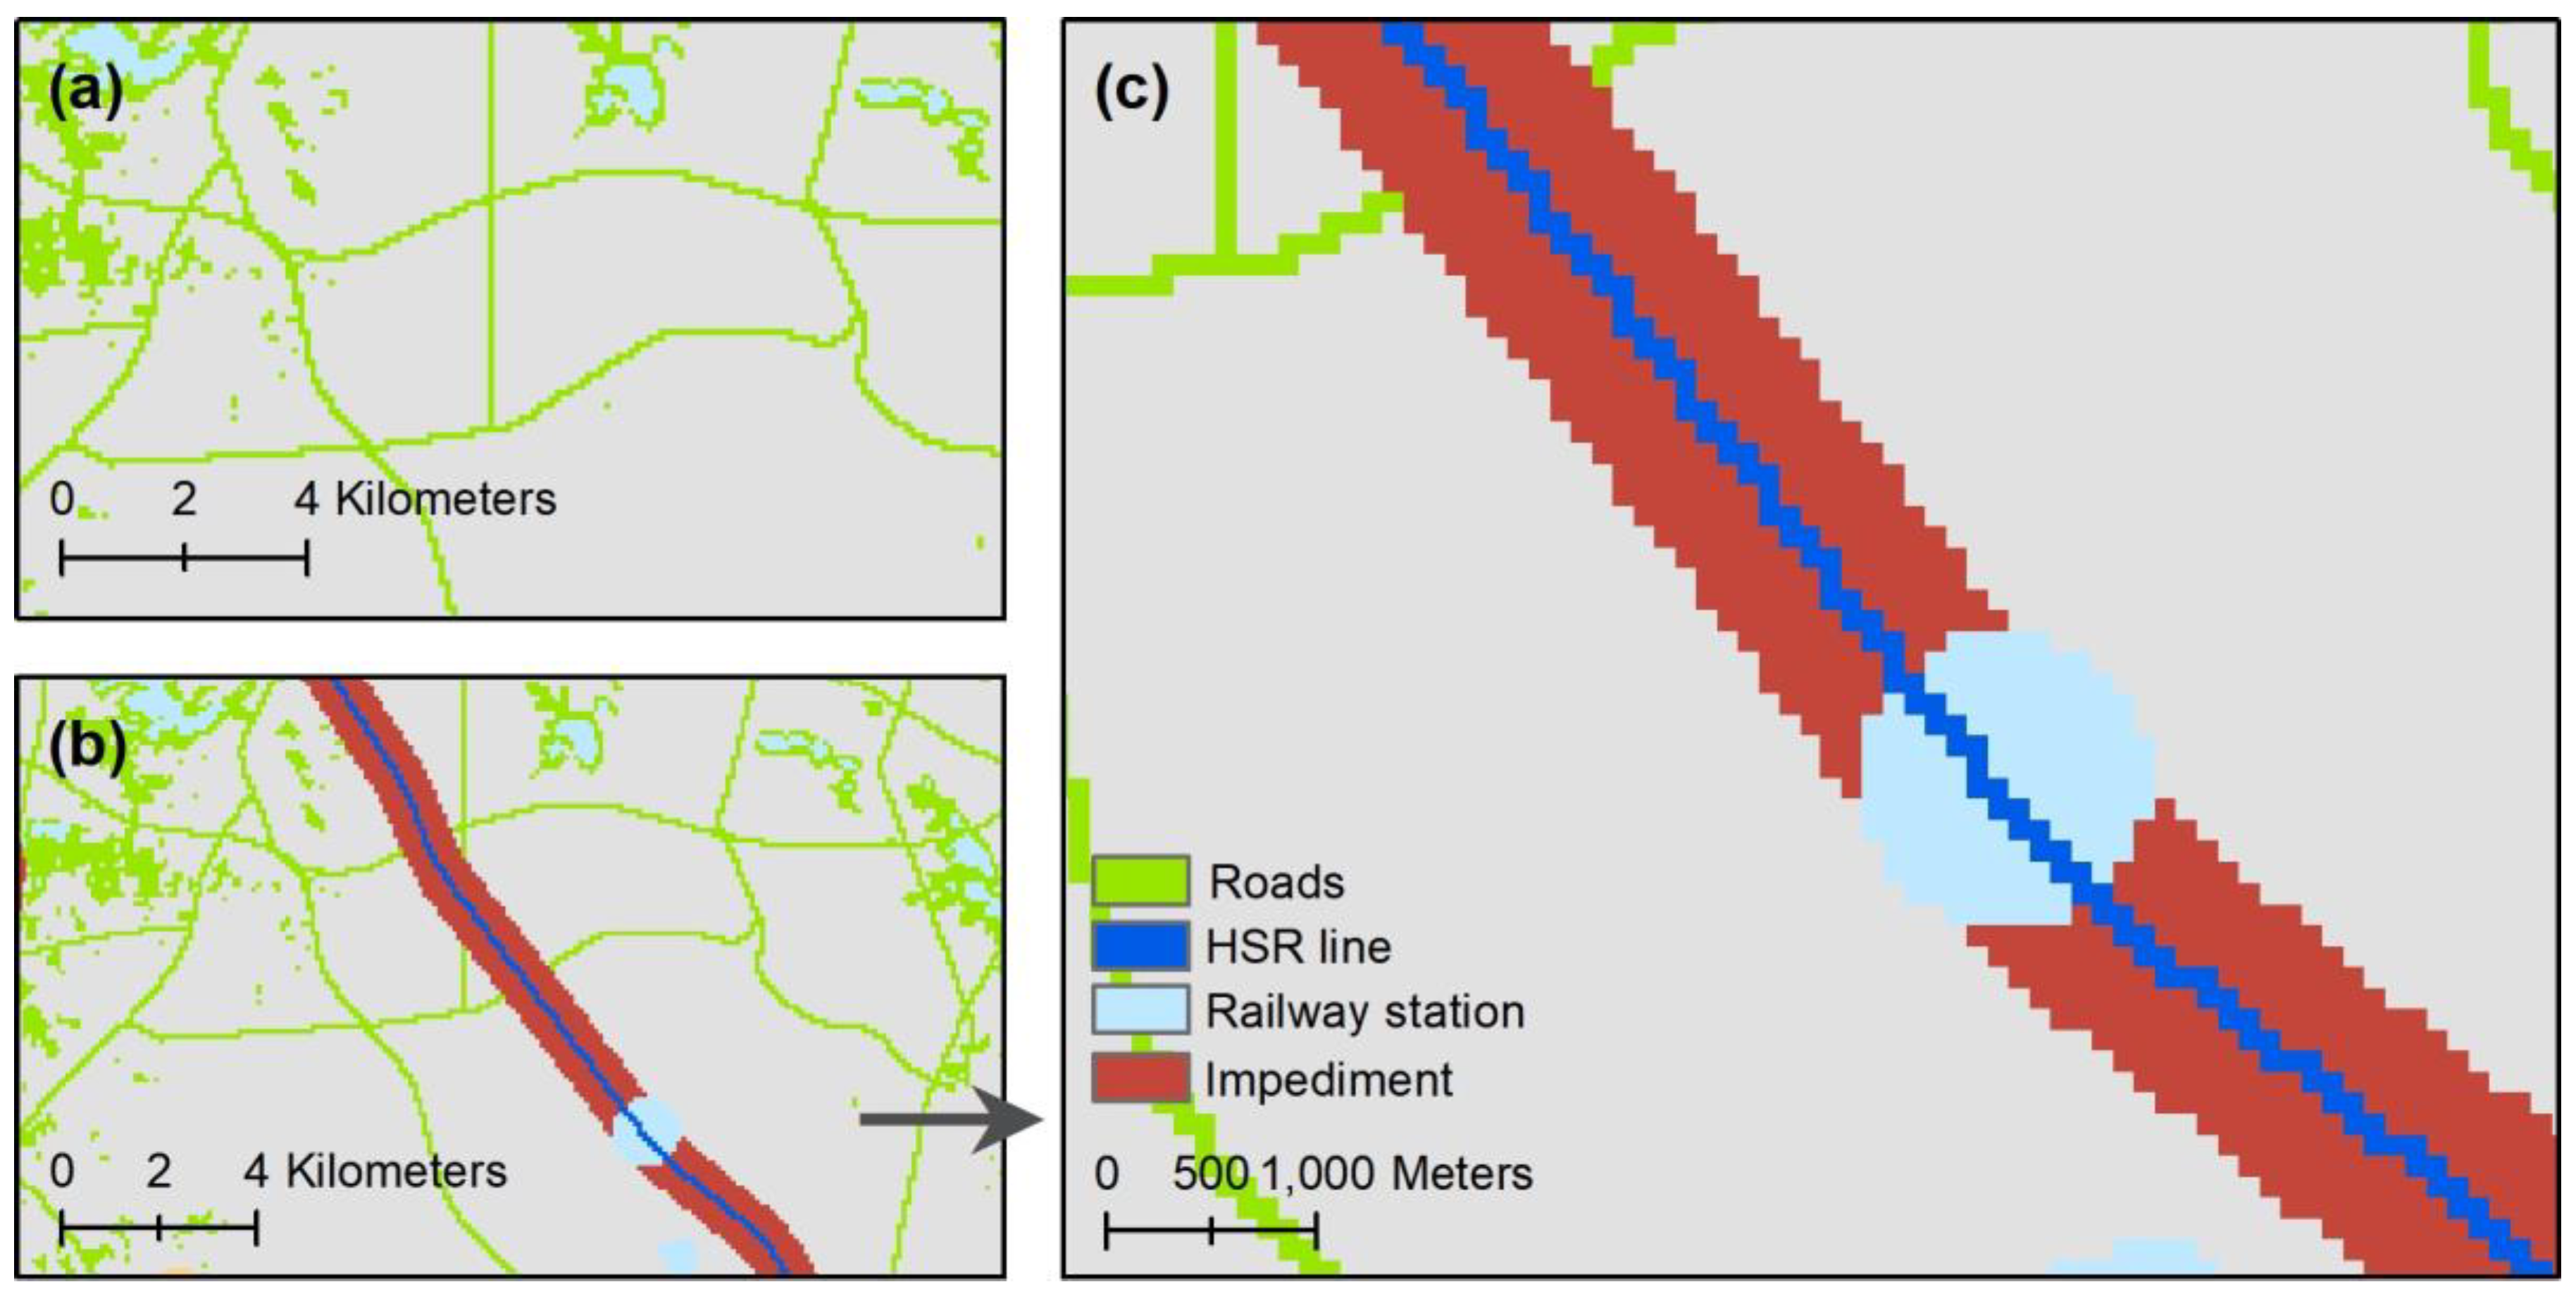
The layered cost distance method [31] was introduced to model accessibility by integrating HSR with other forms of ground transportation (Figure 5). The study area (entire China) was divided into raster grid cells with a spatial resolution of 1 km [30] and the cell value indicated the time spent to traverse a cell. The cell value was calculated as Cost = 100/V × 60, where Cost is the travel time (min per 100 km) and V calculated based on following speed settings: 90, 70, 50 and 20 km/h for the expressway, national highway, provincial and county highway and other roads, respectively (Figure 5a). The average speed of conventional railways was set to 90 km/h [23], whereas the HSR lines were set to 250, 200 and 160 km/h (Figure 5b), which are within the limits of the maximum design speeds of 350, 250 and 200 km/h [32]. Buffer zones with 5 km width and a minimum access speed (0.1 km/h) were set at both sides of HSR lines to account for an half-hour transfer time at each railway station, a buffer with a distance of 5 grid cells surrounding each railway station, and a speed of 10 km/h was assigned to the buffer (5 km ÷ 10 km/h = 0.5 h) (Figure 5c). Finally, we assigned a speed of 1 km/h for water bodies, 10 km/h for non-traffic areas and 35 km/h for a ferry.
To calculate travel time and accessibility, we used ArcGIS ‘Cost Distance’ tool to generate cost raster maps by different mode of ground transportation for each city separately; then, we used ArcGIS ‘Mosaic to New Raster’ tool with ‘MINIMUM’ mosaic parameters to produce cost raster maps by hybrid travel mode for each city. To validate our estimated travel time, we employed Google Map service (https://www.google.com/maps) as a reference for comparison.
3.2.3. Selection of Accessibility Indicators
The accessibility of a cell location was evaluated by two classical indicators, weighted average travel time (WATT) and daily accessibility (DA). The WATT indicator calculates the average travel time from a specific cell location and all other cell locations, weighted by the ‘mass’ of each destination, formulated as follows:
where is the accessibility of raster grid cell i. is the shortest travel time between cell i and city j (the cell where the city government seats) via ground transportation; n is the number of cities in the study area; is the mass of destination city j, as the square root of the product of local population size and GDP [22]. A lower value of WATT indicates a higher accessibility from a location.
The DA indicator represents the total population that can be reached from one location within a specified limited travel time [2,33], expressed as Equation (3).
where is the accessibility of city i. is the resident population of city j; is the shortest travel time between city i and j; 4 h is specified as a limited travel time for a national level study area of China [1,2,21]. A lower value of DA suggests lower accessibility of a location.
Based on Equations (2) and (3), we used ArcGIS ‘Raster Calculator’ tool to estimate WATT and DA for each city. To examine the spatial disparity at each stage of the HSR network extensions, we further calculated the coefficient of variation (CV) values of WATT and DA among regions and provinces.
4. Results
4.1. Validation of Travel Time and Accessibility
We selected Nanjing City as the starting location, other provincial capitals in China as the destinations by highway travel mode and some HSR provincial capitals as destinations by HSR travel mode. The result of the layered cost distance method was obtained from raster maps of travel time from Nanjing City on ground transportation by the highway travel mode in Scenario 1 (Figure 6a) and by the HSR travel mode in Scenario 2 (Figure 6b). The result from Google Maps was calculated as follows: the shorted travel time was chosen for a pair of cities by the highway travel mode; the travel time of a pair of cities by the HSR travel mode was calculated using Formula (1), where and were obtained from Google Maps, was estimated from the HSR timetable (http://www.12306.cn). Figure 6c shows that the mean of the difference between two methods by the highway travel modes is 5.6% and by the HSR travel mode is 7.3%, both indicate that the estimated travel time from the Google Maps and the layered cost distance method are highly consistent.
4.2. WATT Accessibility
Table 1 shows a remarkable time-space contraction across entire China by 2030. The average WATT accessibility among all cities decreased from 18.7 h to 13.1 h (an improvement of 29.8%) in the first period (Scenario 2/1), and will further drop to 10.3 h (a reduction of 21.4%) in the second (Scenario 3/2). Clearly, the reduction rate of travel time reduction in the first period is much faster than that in the second period.
At the regional level, the high accessibility regions are distributed in Central, East and North China in all three scenarios (the average WATT values lower than the national average). In Scenario 2/1, remarkable improvements to the HSR network occurred in the Northeast (38.5%), North (33.4%), South (32.6%) and East China (32.2%). The relative changes in the South (27.4%), Northwest (26.5%), Southwest (20.9%) and Northeast (20.8%) regions of China are large in the second period, which will mitigate the deficiencies from the first period. Hence, the rates of change in the accessibility of regions are balanced (37.6–51.1%) after the construction of the current and planned HSR network.
Similar results derived from provinces and the relative improvements of accessibility for all provinces are noticeable and balanced (39.6–56.3%), except for Tibet (21.0%), with the expansion of the HSR network in Scenario 3/1. In all three scenarios, the provinces with better accessibility are Henan, Anhui, Hubei, Jiangsu, Shandong and Jiangxi Provinces in the Central and East China regions. As expected, Xinjiang and Tibet have remained low accessibility, although the absolute change in travel time of Xinjiang Province is the greatest, with a reduction of 17.5 h (40.5%) overall. In the first period, the area of high accessibility expands to Beijing, Shanghai and Tianjin municipalities and Zhejiang, Hebei Provinces and then to Chongqing and Shaanxi with the expansion of the planned HSR network in the second period.
Although the expansion of HSR network improved the average accessibility across the nation, it slightly aggravates disparities between regions, between provinces and between cities. The regional CV value of WATT increases from 26.3% in Scenario 1 to 30.4% in Scenario 2, and then decreases slightly to 27.6% in Scenario 3, suggesting an increase of spatial imbalance between regions. The CV value of WATT between provinces increases from 41.7% to 50.6% during the first stage of the HSR network development and the disparity will be further aggravated with the future HSR network extension in the second period (53.9%). This reveals a similar trend given that the CV values between cities from Scenarios 1 to 3 are 43.5%, 50.8% and 54.0%, respectively.
The CV values between provinces in each of the regions (Table 2) show that internal inequalities in Southwest and Northwest China are high in Scenario 1 and continue to increase as a result of current and planned HSR networks in Scenarios 2 and 3. In contrast, the disparities in East and Central China regions are low before the construction of HSR and they continue to decrease with the expansion of the planned HSR network. Clearly, disparities between the provinces in South China exhibit a different trend to other regions, increasing in the first period and then sharply decreasing in the second period. In contrast, the CV values for North and Northeast China remain almost unchanged in Scenario 3/1.
Accessibility maps for China, as measured by the WATT indicator, in the three scenarios are shown in Figure 7a–c. The most accessible cities are mainly concentrated in the southeast of the ‘Hu Line’ and near to the geometric center of China. The map (Figure 7a) exhibits a ‘core-periphery’ structure in Scenario 1 before the construction of HSR. In Scenario 2 (Figure 7b), the contours generally spread outwards and the area of accessibility between 10 h and 12 h significantly extends from 0.3 to 1.2 million km2 (a three-fold increase). The planned HSR network causes the contours to spread further in Scenario 3 (Figure 7c) and the area accessible in less than 10 h using HSR will expand from 1.1 to 2.4 million km2 (118.2%), accounting for 25.0% of China’s total area.
The absolute changes in accessibility (travel time savings) are shown in Figure 7d–f. The map (Figure 7d) shows that cities in the peripheral Northwest and Northeast regions receive relatively higher travel time savings in Scenario 2/1, for example, Urumchi (13.2 h) and Harbin (11.2 h) and changes in travel time of between 4 and 6 h occur for most of the area (4.3 million km2). In Scenario 3/2 (Figure 7e), the improvements in accessibility are less than in Scenario 2/1 and the area of all intervals is balanced (2.4–2.6 million km2). Cities with much larger increases in accessibility are always distributed in Xinjiang Province (Figure 7f), followed by parts of Northeast, Southwest and South China regions overall, such as Urumchi (19.5 h), Haikou (13.6 h), Harbin (13.0 h), Kunming (11.5 h), Changchun (11.4 h) and Xining (10.7 h).
4.3. DA Accessibility
Table 3 lists the DA accessibility for all provinces in the three scenarios. The average number of reachable inhabitants within the 4 h limit of all cities in China rises from 61.1 million to 78.5 million (17.4%) in the first period, with a subsequent increase to 109.1 million (30.6%) following the implementation of the planned network in the second period and an increase of 78.6% overall (Scenario 3/1).
Regionally, the results from the DA indicator have some features in common with the WATT indicator: Central China, East China and North China have a higher accessibility in all three scenarios, for example, Henan, Anhui, Jiangsu, Shandong and Hebei Provinces and all four municipalities (Beijing, Tianjin, Shanghai and Chongqing). Conversely, Northwest, Northeast and part of the Southwest regions have lower accessibility, particularly in vast areas with a low population density such as Tibet, Xinjiang, Qinghai, Heilongjiang, Ningxia, Gansu and Inner Mongolia. With a few exceptions, absolute improvements in accessibility will also be strengthened in North China (84.4), followed by Central China (75.7) and East China (73.3) by the development of the present and planned HSR networks. The most notable gains are projected to occur in Beijing (140.1), Tianjin (110.1), Anhui (109.2) and Shandong (102.0).
The disparities in accessibility between regions and between provinces, according to the DA indicator, both deepen in the first period and will be somewhat reversed in the second period. The regional CV value increases from 56.8% to 60.4% in Scenario 2/1, with a subsequent decrease to 57.3% by the completion of the HSR plan in Scenario 3. In contrast, the provincial CV values of Scenarios 1 to 3 are 69.7%, 72.7% and 69.1%, respectively. This means that although the current HSR enlarges inequalities of accessibility, the proposed HSR network slightly enhances equitable accessibility between provinces. The CV value between cities increases from 76.6% in Scenario 1 to 79.7% in Scenario 2 and then increases slightly to 80.5% in Scenario 3.
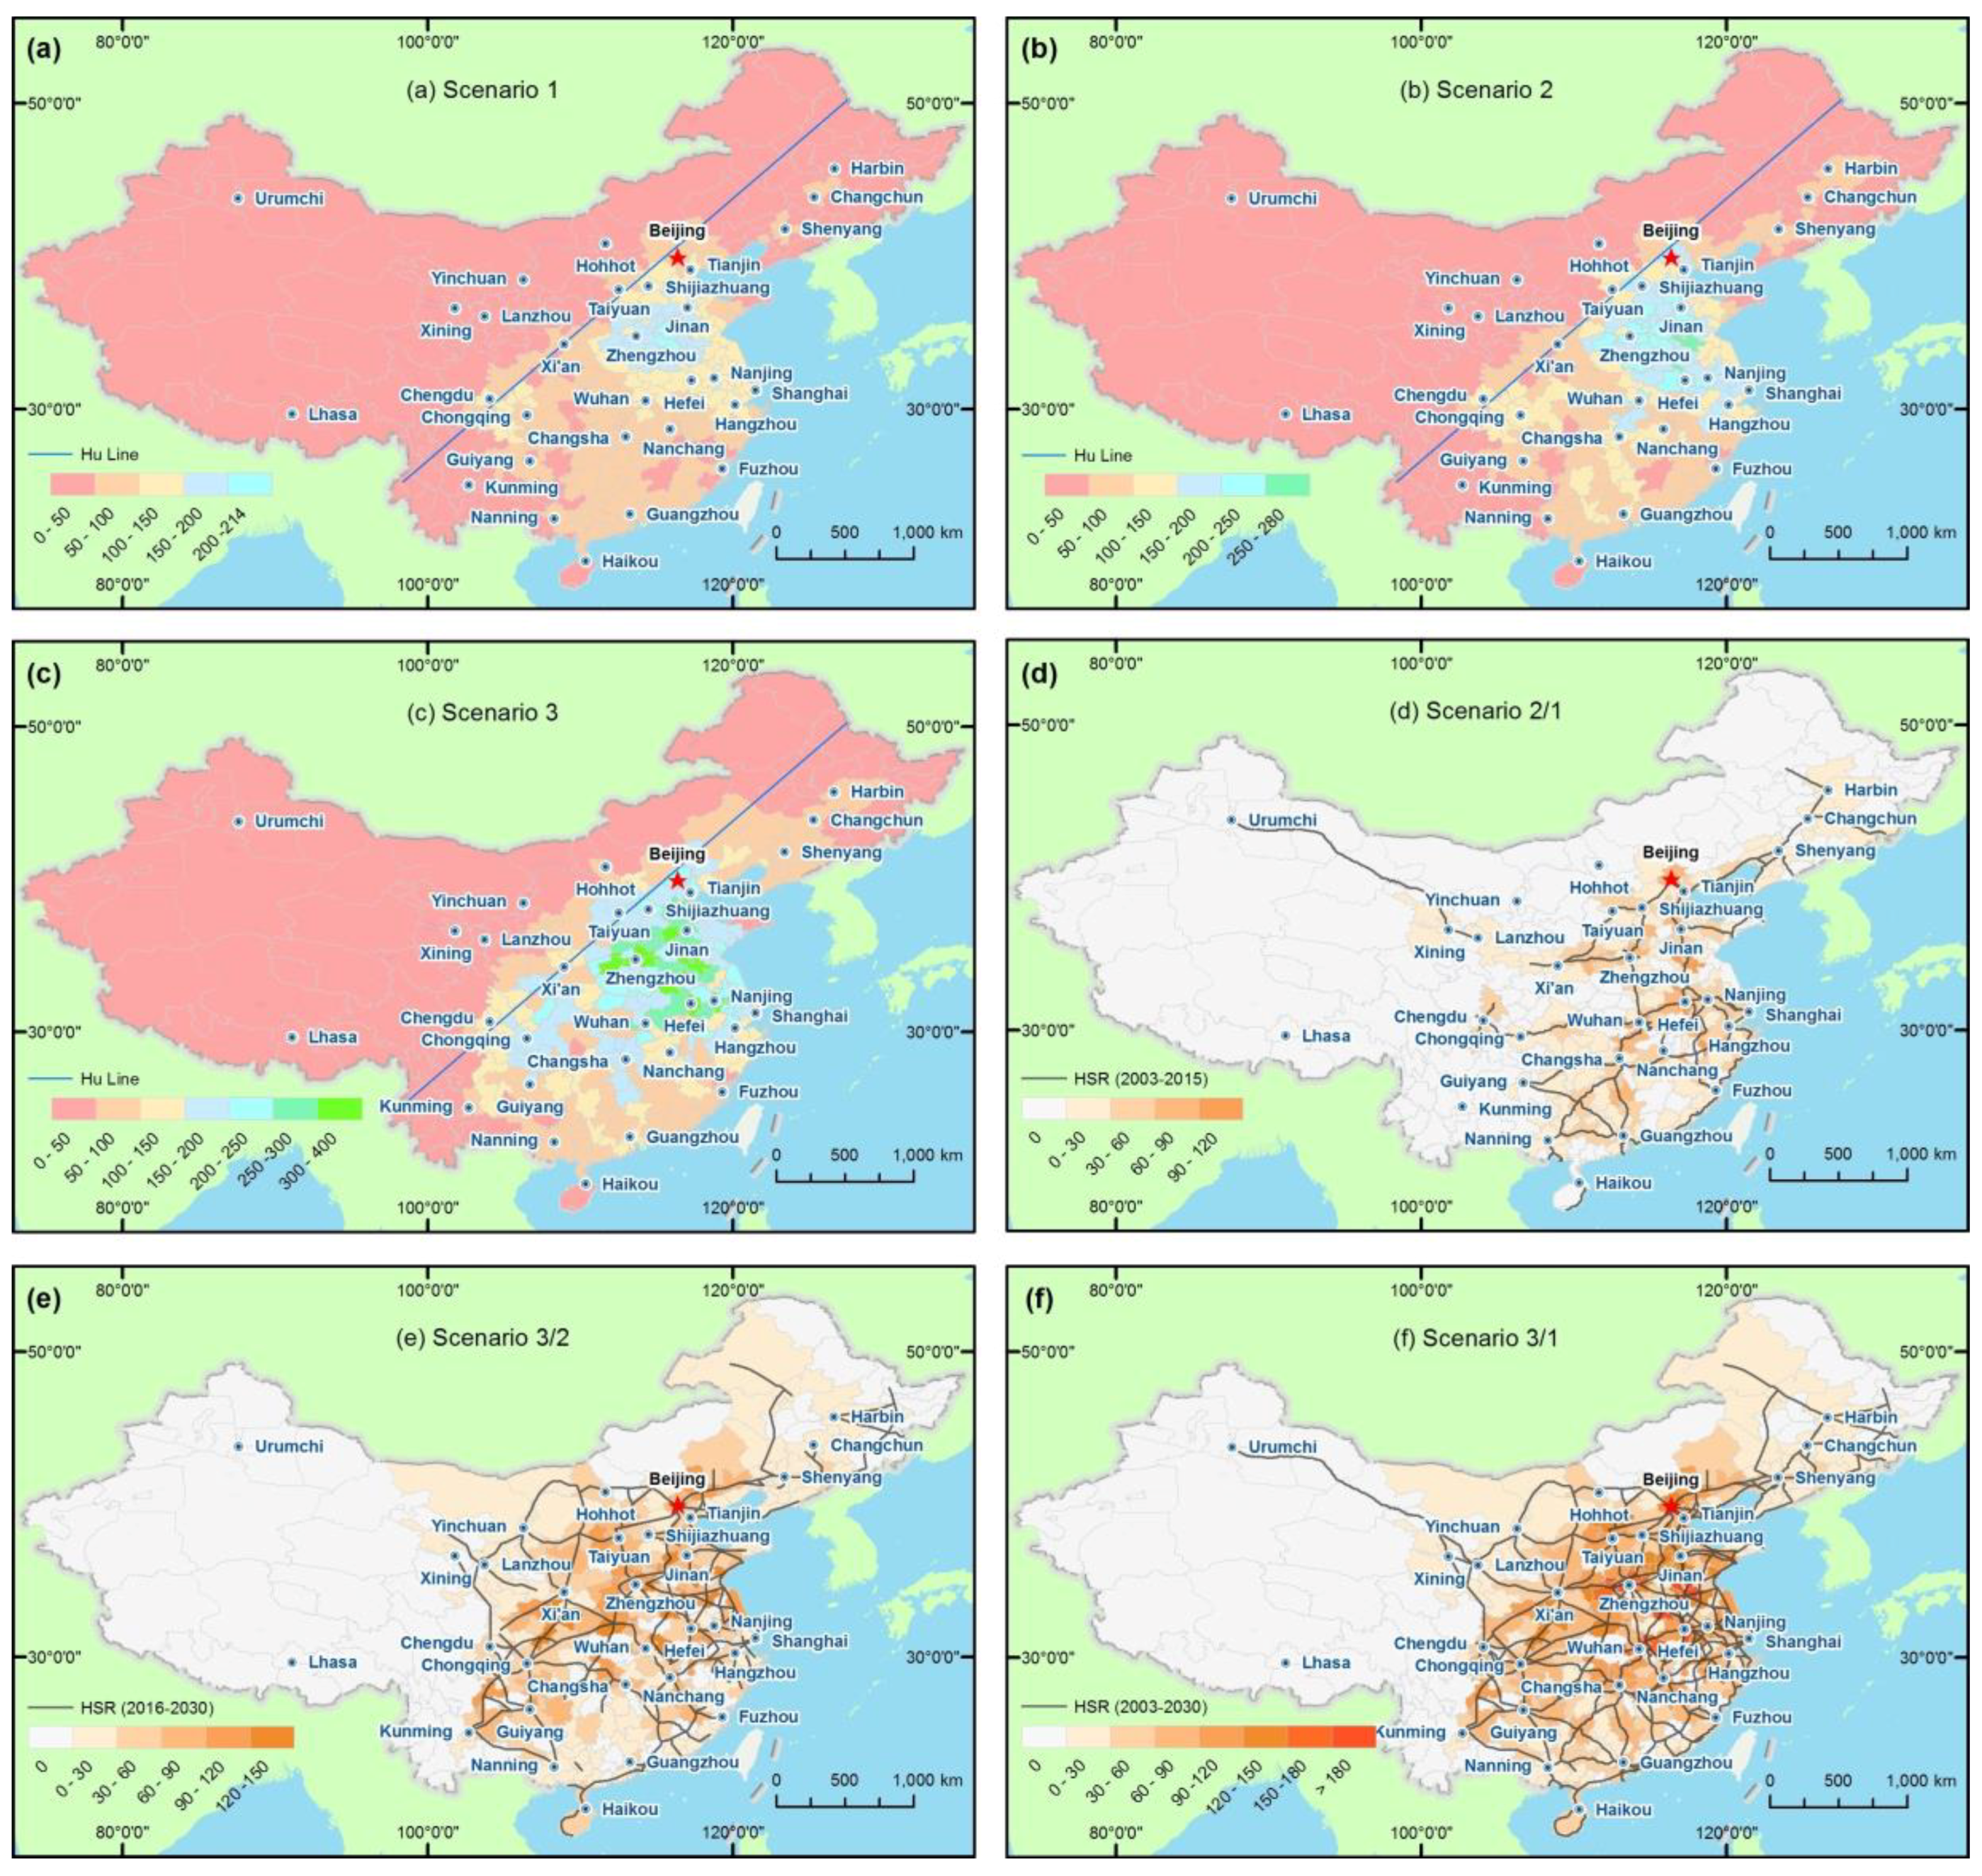
The series of maps (Figure 8a–c) indicate that DA values are high on the southeastern section of the ‘Hu Line’ and low at the edges. There are a smaller number of cities (87) with DA values exceeding 100 million inhabitants before the construction of HSR. This number increases gradually and reaches 118 in Scenario 2 and 161 in Scenario 3 by the completion of proposed HSR network. The maps of the absolute changes (Figure 8d–f) show an obvious ‘corridor effect’ [23], in that the top cities with respect to accessibility changes are mainly concentrated along HSR lines. The distribution of the gains is consistent with accessibility such that the central and eastern regions along the primary HSR corridors, especially at the intersections of HSR lines, experience much greater improvements in accessibility. However, few gains take place in the peripheral provinces such as Tibet and Xinjiang.
5. Discussion
5.1. Comparison between the Two Indicators
Comparisons between accessibility gains from the WATT and DA indicators share several common features (Table 4). For example, the most accessible cities are located in the center and eastern regions of China, particularly in the quadrilateral area of ‘Wuhan-Zhengzhou-Jinan-Nanjing,’ while the least accessible cities are distributed in peripheral areas. As expected, the accessibility of Henan, Anhui, Jiangsu and Shandong Provinces are ranked as top ten in all three scenarios. In contrast, Tibet, Xinjiang and Qinghai are the five least accessible provinces. Finally, although the future HSR network will lead to a more balanced distribution in terms of accessibility, the unequal gap between the most and least accessible regions, provinces and cities will remain greater than before the construction of the HSR network.
There are some differences between the two indicators. For instance, the relative degree of accessibility benefits as measured by the WATT indicator is lower than that measured by the DA indicator. Therefore, the HSR network will have a greater impact as measured by the increase in the reachable population within a certain limited time than by the reduction in travel time. In addition, in the case of the WATT indicator, the accessibility improvement in Scenario 2/1 is much more than in Scenario 3/2, while the DA indicator shows the opposite. The most notable gains in accessibility will be achieved in the more peripheral locations according to the WATT indicator but the DA indicator suggests that the greatest improvements will appear in cities along the HSR corridors in central and eastern regions rather than in peripheral areas.
The findings of this study support the results of other relevant literature pertaining to China’s HSR network in the sense that the network generally improves accessibility across the nation [21,22,23,32,34] but the degree of improvement varies (Table 5). We adopted the door-to-door approach to calculate the times of each stage in a journey for the HSR travel mode, including the inner-city travel time, the transfer time and the waiting time for connecting services at the railway stations. Thus, realistic accessibility impacts of the HSR network were better quantified. It can therefore be seen that the degrees of accessibility gains and disparities in this study, as measured by the WATT and DA indicators, are much lower than other similar studies using the same timescale.
5.2. Policy Suggestions
Reduced journey time is one of the main reasons for passengers to choose HSR but there remains the issue of the amount of time spent before arriving the railway system. It is therefore essential to improve highway public transport to locations around HSR stations to reduce transfer time caused by changing from road to railway travel. Thus, railway stations must provide seamless connections to public transport, convenient access to stations for private cars and taxis, as well as clear spatial orientation for commuters and other travelers to reduce ‘transfer resistance’ [3]. In addition, more attention should be paid to the level of HSR services, such as convenient ticketing services, high-frequency trains and optimized train timetables.
Moreover, because of the fatal HSR crash in Wenzhou, the average operating speeds of HSR trains were reduced from 350, 250 and 200 km/h to 300, 200 and 160 km/h respectively (depending on local conditions) by the Chinese Ministry of Railways of the People’s Republic of China in 2011. However, with the development of HSR technology, China’s new-generation bullet train operates between Beijing and Shanghai switched to a higher speed of 350 km/h in September 2017, making it again among the world’s fastest train services after the operational limit was reduced six years ago [35]. Predictably, with the maturity and stability of technologies, more and more HSR lines are expected to reach its design speed. So, accessibility will be enhanced by future HSR developments, making HSR even more competitive in the transport market in China.
6. Conclusions
The evolution of HSR network from 2003 to 2030 leads to a progressive contraction of time-space and increases in the accumulated population. On average, the accessibility of China cities can be improved by 61.7%. Geographically, the future accessibility will exhibit a ‘core-periphery’ pattern, in which the most accessible cities are located in the southeastern part of the ‘Hu Line,’ particularly in the quadrilateral area of ‘Wuhan-Zhengzhou-Jinan-Nanjing.’ Furthermore, the 2030 HSR network will slightly widen the spatial disparities in term of accessibility. Our analysis shows that such spatial unevenness can increase by 2.9% between regions, 14.2% between provinces and 14.6% between cities.
In our study, a door-to-door approach was proposed to quantify more realistic accessibility impacts of China’s HSR network. However, the two indicators only regard journey time as the principal cost and therefore it has some limitations. We further plan to integrate ticket price to complement travel time and thus calculate total cost. In addition, railroad timetables should also be reformulated to ensure that agreement exists between predicted and actual travel times in future research.
Acknowledgments
This research is supported by Jiangsu Provincial Natural Science Foundation (No. BK20160023), China Scholarship Council (Grant No. 201706190152), the program B for Outstanding PhD candidate of Nanjing University (201702B065) and the Key research and development program of China (No. 2016YFB0501502). We would like to express appreciations to colleagues in the laboratory for their constructive suggestions. In addition, we thank the anonymous reviewers and members of the editorial team for their constructive comments.
Author Contributions
L.W. and Y.L. conceived and designed the research; L.W. and C.S. analyzed the data; L.W. wrote the manuscript; L.M. edited the manuscript.
Conflicts of Interest
The authors declare no conflict of interest.
References
- Gutiérrez, J. Location, economic potential and daily accessibility: An analysis of the accessibility impact of the high-speed line Madrid–Barcelona–French border. J. Transp. Geogr. 2001, 9, 229–242. [Google Scholar] [CrossRef]
- MartÍn, J.C.; Gutiérrez, J.; Román, C. Data envelopment analysis (DEA) index to measure the accessibility impacts of new infrastructure investments: The case of the high-speed train corridor Madrid–Barcelona–French border. Reg. Stud. 2004, 38, 697–712. [Google Scholar] [CrossRef]
- Yin, M.; Bertolini, L.; Duan, J. The effects of the high-speed railway on urban development: International experience and potential implications for China. Prog. Plan. 2015, 98, 1–52. [Google Scholar] [CrossRef]
- Wikipedia. List of High-Speed Railway Lines. Available online: https://en.wikipedia.org/wiki/List_of_high-speed_railway_lines (accessed on 7 August 2016).
- NRA. China’s High-Speed Rail Information. Available online: http://www.nra.gov.cn/ztzl/hyjc/gstl_/zggstL/gtxl/201602/t20160216_21088.html (accessed on 21 December 2016).
- UIC. High Speed. Available online: http://www.uic.org/highspeed (accessed on 19 March 2017).
- NDRC. Mid-to-Long Term Railway Network Plan. Available online: http://www.nra.gov.cn/jgzf/flfg/gfxwj/zt/other/201607/t20160721_26055.shtml (accessed on 16 December 2017).
- Hou, Q.; Li, S.-M. Transport infrastructure development and changing spatial accessibility in the Greater Pearl River Delta, China, 1990–2020. J. Transp. Geogr. 2011, 19, 1350–1360. [Google Scholar] [CrossRef]
- Chandra, S.; Vadali, S. Evaluating accessibility impacts of the proposed America 2050 high-speed rail corridor for the Appalachian Region. J. Transp. Geogr. 2014, 37, 28–46. [Google Scholar] [CrossRef]
- Handy, S.L.; Niemeier, D.A. Measuring accessibility: An exploration of issues and alternatives. Environ. Plan. A 1997, 29, 1175–1194. [Google Scholar] [CrossRef]
- Geurs, K.T.; Wee, B.V. Accessibility evaluation of land-use and transport strategies: Review and research directions. J. Transp. Geogr. 2004, 12, 127–140. [Google Scholar] [CrossRef]
- Gutierrez, J.; Condeco-Melhorado, A.; Martin, J.C. Using accessibility indicators and GIS to assess spatial spillovers of transport infrastructure investment. J. Transp. Geogr. 2010, 18, 141–152. [Google Scholar] [CrossRef]
- Li, S.; Shum, Y. Impacts of the National Trunk Highway System on accessibility in China. J. Transp. Geogr. 2001, 9, 39–48. [Google Scholar] [CrossRef]
- Holl, A. Twenty years of accessibility improvements. The case of the Spanish motorway building programme. J. Transp. Geogr. 2007, 15, 286–297. [Google Scholar] [CrossRef]
- Kotavaara, O.; Antikainen, H.; Rusanen, J. Population change and accessibility by road and rail networks: GIS and statistical approach to Finland 1970–2007. J. Transp. Geogr. 2011, 19, 926–935. [Google Scholar] [CrossRef]
- Pérez, E.O.; Quintana, S.M.; Pastor, I.O. Road and railway accessibility atlas of Spain. J. Maps 2011, 7, 31–41. [Google Scholar] [CrossRef]
- Koopmans, C.; Rietveld, P.; Huijg, A. An accessibility approach to railways and municipal population growth. J. Transp. Geogr. 2012, 25, 94–104. [Google Scholar] [CrossRef]
- Pels, E.; Nijkamp, P.; Rietveld, P. Airport and Airline Competition for Passengers Departing from a Large Metropolitan Area. J. Urban Econ. 2000, 48, 29–45. [Google Scholar] [CrossRef]
- Nigel, H.; Svein, B. Impact of airports on regional accessibility and social development. J. Transp. Geogr. 2011, 19, 1145–1154. [Google Scholar]
- Shi, W.; Su, F.; Zhou, C.; Wu, W. Research on accessibility model of Nansha Islands and surrounding seaports. Acta Geogr. Sin. 2014, 69, 1510–1520. [Google Scholar]
- Cao, J.; Liu, X.C.; Wang, Y.; Li, Q. Accessibility impacts of China’s high-speed rail network. J. Transp. Geogr. 2013, 28, 12–21. [Google Scholar] [CrossRef]
- Jin, F.; Jiao, J.; Qi, Y.; Yang, Y. Evolution and geographic effects of high-speed rail in East Asia: An accessibility approach. J. Geogr. Sci. 2017, 27, 515–532. [Google Scholar] [CrossRef]
- Jiao, J.; Wang, J.E.; Jin, F.; Dunford, M. Impacts on accessibility of China’s present and future HSR network. J. Transp. Geogr. 2014, 40, 123–132. [Google Scholar] [CrossRef]
- NGCC. 1:1,000,000 National Geographic Database. Available online: http://www.webmap.cn/commres.do?method=result100W (accessed on 9 March 2018).
- Geofabik. Download OpenStreetMap Data for this Region: Asia. Available online: http://download.geofabrik.de/asia.html (accessed on 27 July 2017).
- NDRC. 13th Five-Year Plan for Railway Network. Available online: http://www.ndrc.gov.cn/gzdt/201711/t20171124_867822.html (accessed on 6 December 2017).
- BFIT. Economy Prediction System (EPS) Data Platform. Available online: http://www.epsnet.com.cn (accessed on 21 December 2016).
- CEI. CEInet Statistics Database. Available online: http://db.cei.gov.cn/ (accessed on 21 December 2016).
- NBSC. The Statistics of Major Cities. Available online: http://data.stats.gov.cn/easyquery.htm?cn=E0105 (accessed on 21 December 2016).
- Weiss, D.J.; Nelson, A.; Gibson, H.S.; Temperley, W.; Peedell, S.; Lieber, A.; Hancher, M.; Poyart, E.; Belchior, S.; Fullman, N.; et al. A global map of travel time to cities to assess inequalities in accessibility in 2015. Nature 2018, 553, 333–336. [Google Scholar] [CrossRef] [PubMed]
- Wang, L.; Liu, Y.; Sun, C.; Liu, Y. Accessibility Impact of the Present and Future High-Speed Rail Network: A Case Study of Jiangsu Province, China. J. Transp. Geogr. 2016, 54, 161–172. [Google Scholar] [CrossRef]
- Shaw, S.-L.; Fang, Z.; Lu, S.; Tao, R. Impacts of high speed rail on railroad network accessibility in China. J. Transp. Geogr. 2014, 40, 112–122. [Google Scholar] [CrossRef]
- Ortega, E.; López, E.; Monzón, A. Territorial cohesion impacts of high-speed rail at different planning levels. J. Transp. Geogr. 2012, 24, 130–141. [Google Scholar] [CrossRef]
- Wu, W.; Liang, Y.; Wu, D. Evaluating the Impact of China’s Rail Network Expansions on Local Accessibility: A Market Potential Approach. Sustainability 2006, 8, 512–613. [Google Scholar] [CrossRef]
- NRA. The Speed on the Beijing-Shanghai High-Speed Railway Was Increased to 350 km/h. Available online: http://www.nra.gov.cn/xwzx/xwdt/yjhxw/201708/t20170821_43377.shtml (accessed on 10 April 2018).
Figure 1.
Global high-speed rail (HSR) development by the end of 2015.

Figure 2.
China’s current and planned HSR network over the 2003–2030 period.

Figure 3.
Operating mileage of China’s HSR network over the 2003–2030 period.

Figure 4.
Schematic diagram of the total journey time when using HSR.

Figure 5.
Raster maps of (a) road network; (b,c) ground transport network.

Figure 6.
Raster maps of travel time from Nanjing City on ground transportation (a) by the highway travel mode in Scenario 1 and (b) by the HSR travel mode in Scenario 2; and (c) Comparison of the results of door-to-door travel time by the highway and the HSR travel modes with Google Maps (acquired at 14:00–15:00, April 13, 2018) and the layered cost distance method from Nanjing to other provincial capitals in China.

Figure 7.
Accessibility maps for China as measured by the WATT indicator in (a) Scenario 1; (b) Scenario 2; (c) Scenario 3; and its absolute changes (travel time savings) in (d) Scenario 2/1; (e) Scenario 3/2; and (f) Scenario 3/1.
Figure 7.
Accessibility maps for China as measured by the WATT indicator in (a) Scenario 1; (b) Scenario 2; (c) Scenario 3; and its absolute changes (travel time savings) in (d) Scenario 2/1; (e) Scenario 3/2; and (f) Scenario 3/1.
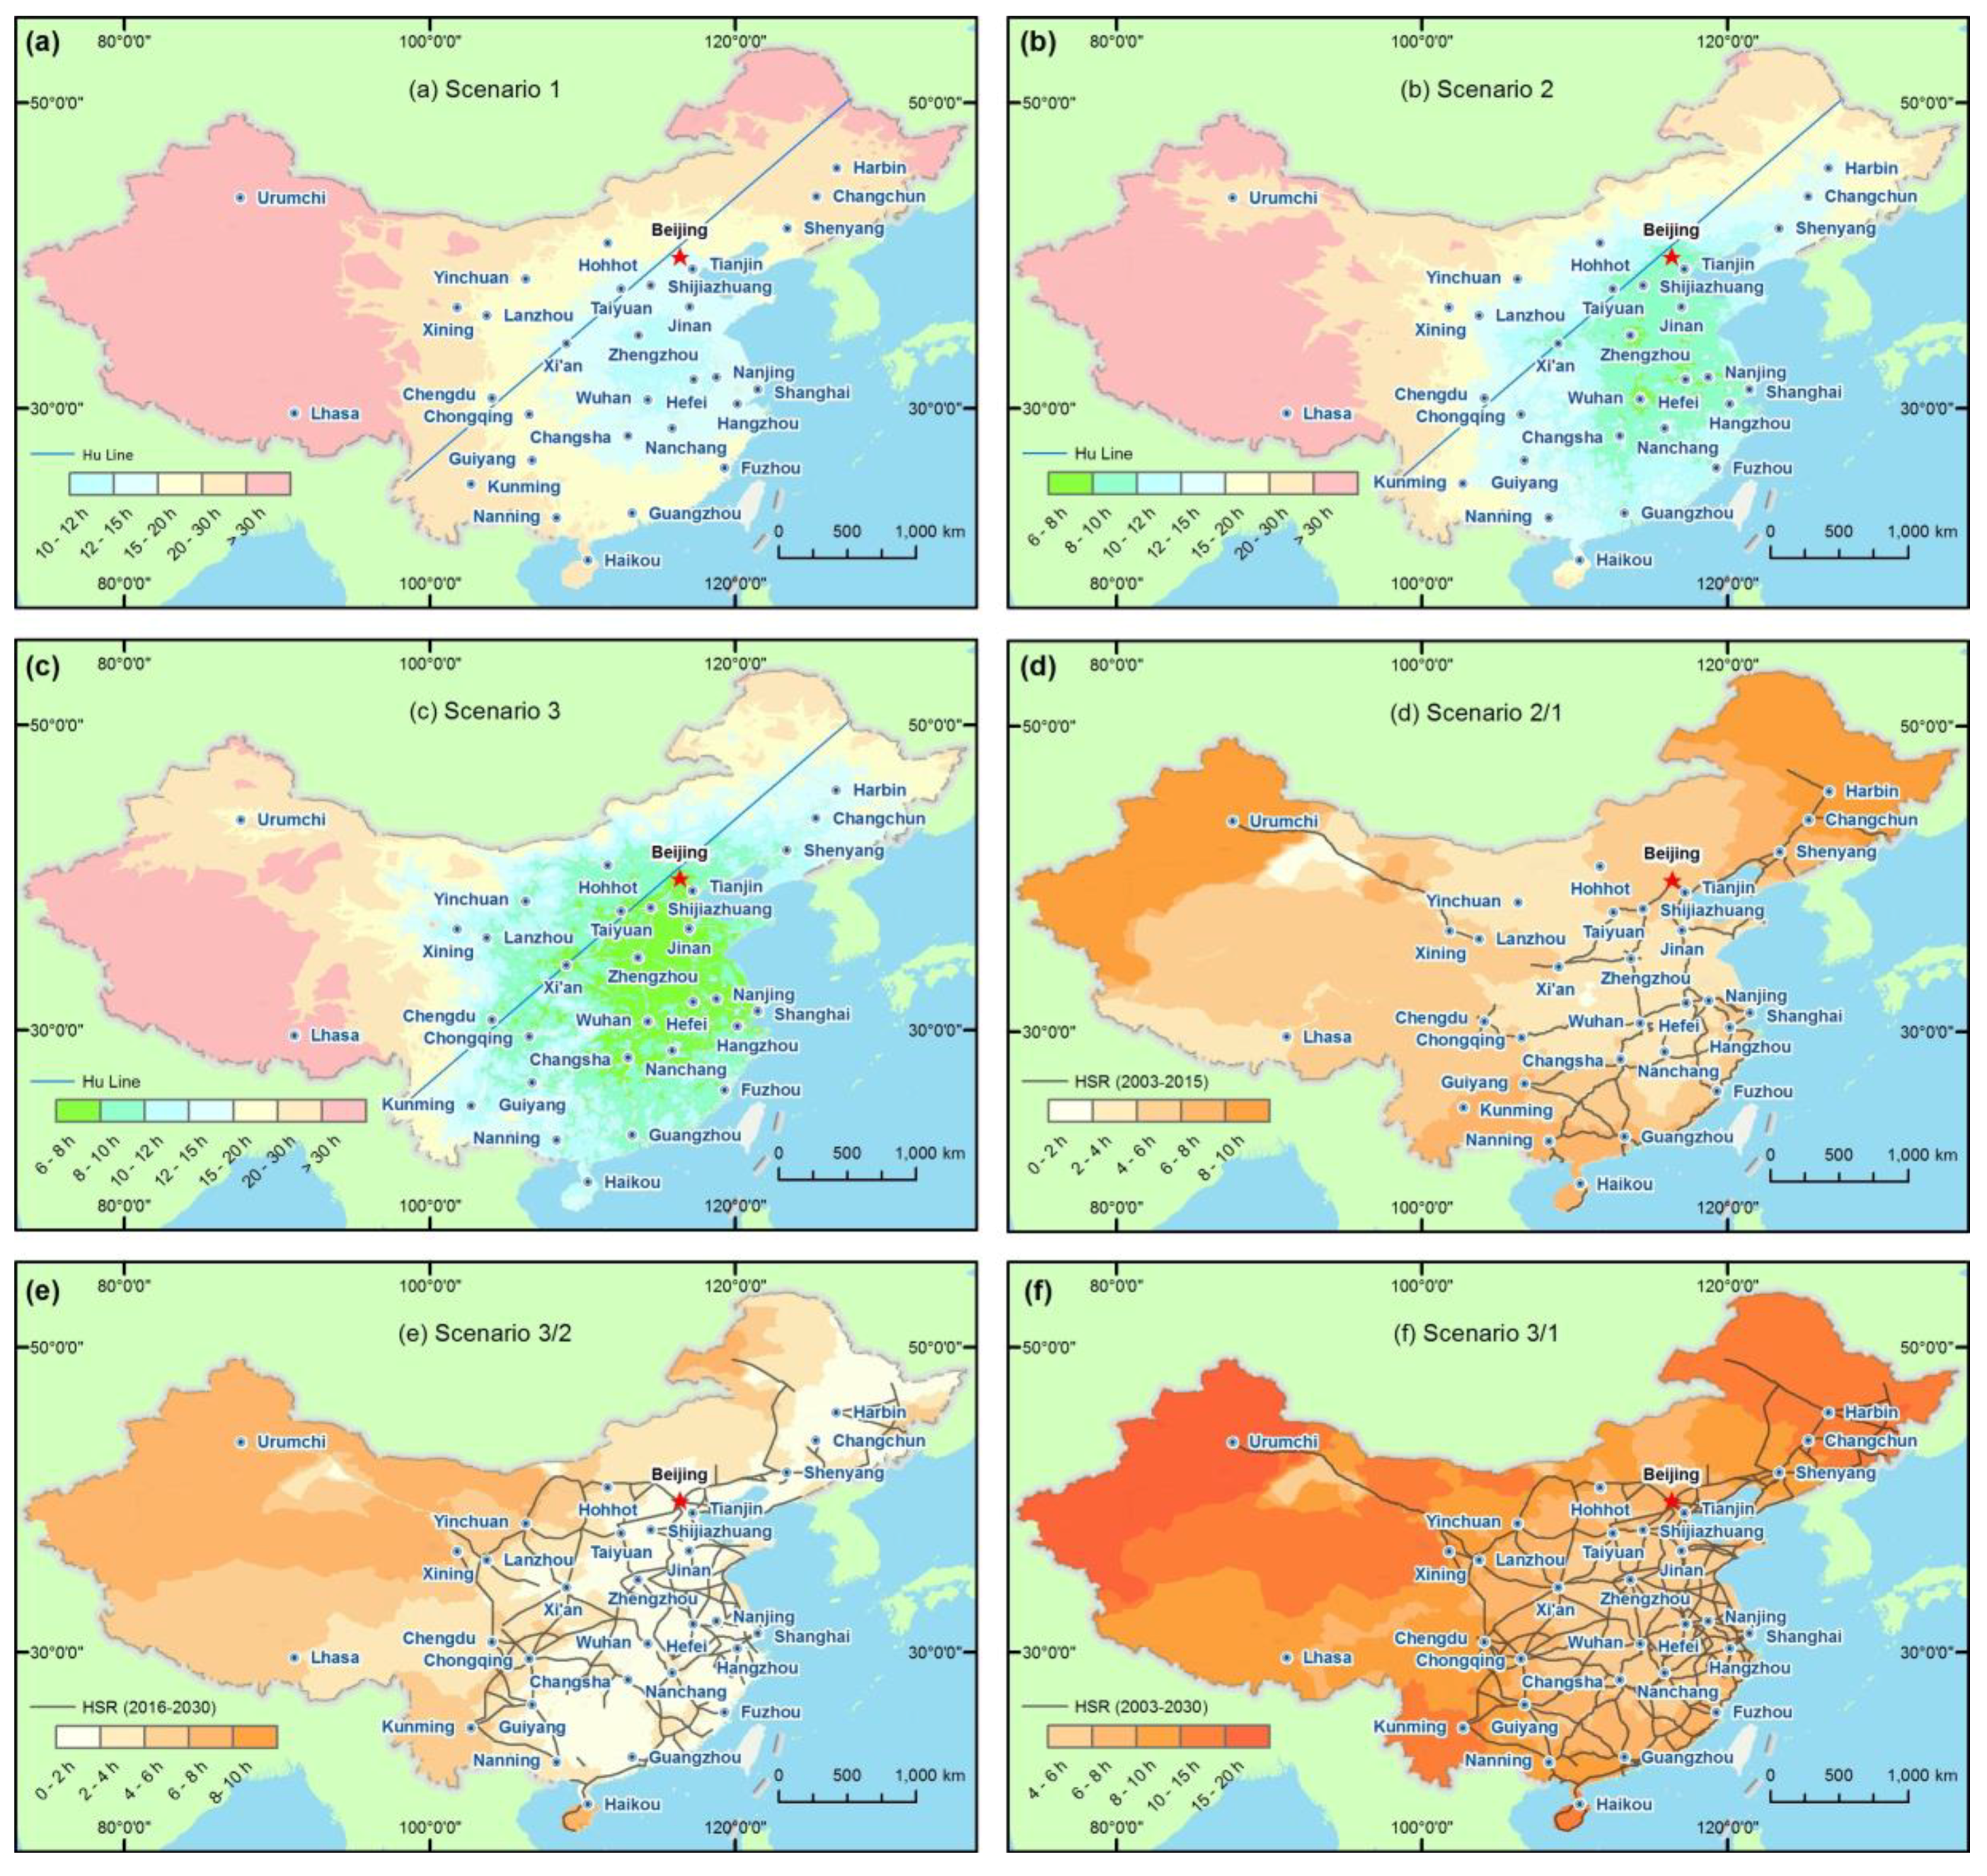
Figure 8.
Accessibility maps for China as measured by the DA indicator (population in millions) in (a) Scenario 1; (b) Scenario 2; (c) Scenario 3; and its absolute changes in (d) Scenario 2/1; (e) Scenario 3/2; and (f) Scenario 3/1.
Figure 8.
Accessibility maps for China as measured by the DA indicator (population in millions) in (a) Scenario 1; (b) Scenario 2; (c) Scenario 3; and its absolute changes in (d) Scenario 2/1; (e) Scenario 3/2; and (f) Scenario 3/1.

Table 1.
Accessibility (in hours) for all China’s provinces in Scenarios 1, 2, 3, 2/1 and 3/2, according to the weighted average travel time (WATT) indicator.
Table 1.
Accessibility (in hours) for all China’s provinces in Scenarios 1, 2, 3, 2/1 and 3/2, according to the weighted average travel time (WATT) indicator.
| Provinces | WATT Accessibility | Scenario 2/1 | Scenario 3/2 | ||||
|---|---|---|---|---|---|---|---|
| Scenario 1 | Scenario 2 | Scenario 3 | 2–1 | % | 3–2 | % | |
| Average of China | 18.7 | 13.1 | 10.3 | 5.6 | 29.8 | 2.8 | 21.4 |
| North China | 15.2 | 10.1 | 8.0 | 5.1 | 33.4 | 2.1 | 20.8 |
| Beijing | 14.4 | 8.4 | 7.1 | 6.0 | 41.8 | 1.2 | 14.8 |
| Tianjin | 13.9 | 8.6 | 7.4 | 5.3 | 38.2 | 1.2 | 14.2 |
| Hebei | 14.0 | 9.0 | 7.6 | 5.0 | 35.4 | 1.5 | 16.3 |
| Shanxi | 13.4 | 9.5 | 7.3 | 3.9 | 28.8 | 2.2 | 23.2 |
| Inner Mongolia | 20.5 | 15.2 | 10.8 | 5.3 | 25.9 | 4.4 | 29.1 |
| Northeast | 23.0 | 14.2 | 12.0 | 8.9 | 38.5 | 2.1 | 15.0 |
| Liaoning | 18.6 | 11.5 | 9.8 | 7.0 | 37.9 | 1.7 | 14.8 |
| Jilin | 22.7 | 14.1 | 11.7 | 8.7 | 38.1 | 2.4 | 17.3 |
| Heilongjiang | 27.8 | 16.9 | 14.6 | 10.9 | 39.3 | 2.2 | 13.2 |
| East China | 13.4 | 9.1 | 7.5 | 4.3 | 32.2 | 1.6 | 17.6 |
| Shanghai | 13.7 | 8.6 | 7.2 | 5.1 | 37.5 | 1.4 | 15.9 |
| Jiangsu | 12.5 | 8.6 | 7.1 | 3.9 | 31.0 | 1.5 | 17.0 |
| Zhejiang | 14.0 | 9.2 | 7.7 | 4.8 | 34.1 | 1.5 | 16.6 |
| Anhui | 11.7 | 8.4 | 7.1 | 3.3 | 28.4 | 1.3 | 15.6 |
| Fujian | 16.1 | 10.4 | 8.6 | 5.7 | 35.5 | 1.8 | 17.3 |
| Jiangxi | 13.0 | 9.4 | 7.4 | 3.6 | 27.4 | 2.0 | 21.6 |
| Shandong | 12.9 | 9.0 | 7.3 | 3.9 | 30.0 | 1.7 | 18.7 |
| Central China | 12.3 | 8.7 | 7.1 | 3.6 | 29.6 | 1.5 | 17.6 |
| Henan | 11.5 | 8.1 | 6.6 | 3.4 | 29.9 | 1.5 | 18.5 |
| Hubei | 11.8 | 8.7 | 7.1 | 3.2 | 26.9 | 1.6 | 18.2 |
| Hunan | 13.5 | 9.3 | 7.7 | 4.3 | 31.6 | 1.5 | 16.3 |
| South China | 20.3 | 13.7 | 10.0 | 6.6 | 32.6 | 3.8 | 27.4 |
| Guangdong | 17.5 | 10.7 | 9.1 | 6.7 | 38.5 | 1.6 | 15.2 |
| Guangxi | 18.5 | 11.9 | 9.8 | 6.7 | 35.9 | 2.1 | 17.5 |
| Hainan | 25.0 | 18.5 | 10.9 | 6.5 | 26.0 | 7.6 | 40.9 |
| Southwest | 23.1 | 18.2 | 14.4 | 4.9 | 21.1 | 3.8 | 20.9 |
| Chongqing | 15.3 | 11.1 | 7.6 | 4.3 | 27.8 | 3.5 | 31.6 |
| Sichuan | 17.7 | 13.5 | 9.6 | 4.2 | 23.5 | 3.9 | 29.1 |
| Guizhou | 17.0 | 11.3 | 9.0 | 5.7 | 33.7 | 2.3 | 20.3 |
| Yunnan | 24.0 | 18.1 | 13.2 | 5.9 | 24.6 | 4.9 | 27.3 |
| Tibet | 41.3 | 37.1 | 32.7 | 4.3 | 10.4 | 4.4 | 11.8 |
| Northwest | 23.5 | 17.9 | 13.2 | 5.6 | 23.6 | 4.8 | 26.5 |
| Shaanxi | 13.9 | 10.1 | 7.5 | 3.8 | 27.2 | 2.6 | 25.4 |
| Gansu | 19.3 | 14.6 | 10.3 | 4.6 | 24.1 | 4.3 | 29.6 |
| Qinghai | 23.3 | 18.9 | 13.1 | 4.4 | 18.9 | 5.7 | 30.3 |
| Ningxia | 17.9 | 14.4 | 9.3 | 3.5 | 19.7 | 5.1 | 35.4 |
| Xinjiang | 43.1 | 31.7 | 25.7 | 11.4 | 26.4 | 6.1 | 19.1 |
Table 2.
Disparities of accessibility between provinces in each of the regions.
| Regions | Disparities of WATT | Scenario 2/1 | Scenario 3/1 | ||||
|---|---|---|---|---|---|---|---|
| Scenario 1 | Scenario 2 | Scenario 3 | 2–1 | % | 3–1 | % | |
| North China | 19.4% | 28.1% | 19.1% | 0.087 | 44.7% | −0.003 | −1.5% |
| Northeast | 20.0% | 18.8% | 20.2% | −0.012 | −6.1% | 0.002 | 0.8% |
| East China | 10.6% | 7.6% | 7.0% | −0.030 | −28.4% | −0.036 | −33.6% |
| Central China | 8.8% | 6.9% | 8.2% | −0.019 | −21.9% | −0.006 | −6.5% |
| South China | 20.1% | 30.6% | 9.3% | 0.105 | 52.3% | −0.108 | −53.8% |
| Southwest | 46.4% | 59.9% | 72.3% | 0.134 | 28.9% | 0.259 | 55.7% |
| Northwest | 48.9% | 46.3% | 55.1% | −0.026 | −5.2% | 0.062 | 12.7% |
Table 3.
Accessibility (reachable inhabitants in millions within 4 h) for all China’s provinces in Scenarios 1, 2, 3, 2/1 and 3/2, according to the daily accessibility (DA) indicator.
Table 3.
Accessibility (reachable inhabitants in millions within 4 h) for all China’s provinces in Scenarios 1, 2, 3, 2/1 and 3/2, according to the daily accessibility (DA) indicator.
| Provinces | DA Accessibility | Scenario 2/1 | Scenario 3/2 | ||||
|---|---|---|---|---|---|---|---|
| Scenario 1 | Scenario 2 | Scenario 3 | 2–1 | % | 3–2 | % | |
| Average of China | 61.1 | 78.5 | 109.1 | 17.4 | 28.5 | 30.6 | 39.0 |
| North China | 79.3 | 114.1 | 163.6 | 34.8 | 43.9 | 49.6 | 43.5 |
| Beijing | 87.6 | 156.6 | 227.7 | 69.0 | 78.8 | 71.1 | 45.4 |
| Tianjin | 103.5 | 160.9 | 213.6 | 57.4 | 55.5 | 52.7 | 32.7 |
| Hebei | 108.5 | 136.1 | 179.8 | 27.6 | 25.4 | 43.6 | 32.1 |
| Shanxi | 82.2 | 102.0 | 167.8 | 19.9 | 24.2 | 65.7 | 64.4 |
| Inner Mongolia | 14.6 | 14.6 | 29.4 | 0.0 | 0.0 | 14.8 | 101.4 |
| Northeast | 32.8 | 40.0 | 49.3 | 7.1 | 21.8 | 9.3 | 23.4 |
| Liaoning | 44.6 | 58.9 | 74.3 | 14.3 | 32.2 | 15.4 | 26.1 |
| Jilin | 35.5 | 40.9 | 50.4 | 5.4 | 15.3 | 9.5 | 23.2 |
| Heilongjiang | 18.4 | 20.1 | 23.2 | 1.7 | 9.1 | 3.1 | 15.6 |
| East China | 100.7 | 132.8 | 173.9 | 32.2 | 31.9 | 41.1 | 30.9 |
| Shanghai | 108.5 | 160.9 | 179.0 | 52.5 | 48.4 | 18.1 | 11.2 |
| Jiangsu | 130.9 | 163.4 | 218.7 | 32.5 | 24.8 | 55.3 | 33.8 |
| Zhejiang | 88.2 | 123.7 | 144.3 | 35.4 | 40.1 | 20.6 | 16.7 |
| Anhui | 135.7 | 174.6 | 244.8 | 39.0 | 28.7 | 70.2 | 40.2 |
| Fujian | 47.6 | 63.8 | 79.4 | 16.2 | 34.0 | 15.7 | 24.6 |
| Jiangxi | 67.7 | 88.7 | 139.1 | 20.9 | 30.9 | 50.4 | 56.9 |
| Shandong | 126.2 | 154.9 | 212.3 | 28.7 | 22.7 | 57.4 | 37.1 |
| Central China | 106.9 | 134.7 | 182.6 | 27.8 | 26.0 | 47.9 | 35.6 |
| Henan | 158.7 | 192.9 | 260.8 | 34.2 | 21.5 | 67.9 | 35.2 |
| Hubei | 86.6 | 109.5 | 157.4 | 22.9 | 26.5 | 47.9 | 43.7 |
| Hunan | 75.3 | 101.8 | 129.7 | 26.4 | 35.1 | 28.0 | 27.5 |
| South China | 41.0 | 52.2 | 74.1 | 11.2 | 27.2 | 21.9 | 42.0 |
| Guangdong | 67.5 | 87.5 | 102.3 | 20.0 | 29.7 | 14.8 | 16.9 |
| Guangxi | 52.4 | 65.9 | 80.6 | 13.5 | 25.7 | 14.6 | 22.2 |
| Hainan | 3.2 | 3.2 | 39.5 | 0.0 | 0.0 | 36.3 | 1131.2 |
| Southwest | 49.4 | 55.3 | 84.7 | 6.0 | 12.1 | 29.3 | 53.0 |
| Chongqing | 100.0 | 120.5 | 176.4 | 20.6 | 20.6 | 55.9 | 46.3 |
| Sichuan | 72.8 | 79.2 | 110.8 | 6.4 | 8.8 | 31.5 | 39.8 |
| Guizhou | 52.2 | 55.1 | 101.1 | 2.9 | 5.5 | 46.0 | 83.4 |
| Yunnan | 21.1 | 21.1 | 34.3 | 0.0 | 0.0 | 13.2 | 62.6 |
| Tibet | 0.7 | 0.7 | 0.7 | 0.0 | 0.0 | 0.0 | 0.0 |
| Northwest | 17.5 | 20.2 | 35.2 | 2.7 | 15.5 | 15.0 | 74.0 |
| Shaanxi | 47.2 | 58.9 | 111.2 | 11.7 | 24.9 | 52.2 | 88.6 |
| Gansu | 17.5 | 18.3 | 27.9 | 0.8 | 4.5 | 9.5 | 52.0 |
| Qinghai | 6.2 | 7.2 | 8.2 | 1.1 | 17.3 | 1.0 | 14.1 |
| Ningxia | 13.8 | 13.8 | 25.9 | 0.0 | 0.0 | 12.1 | 87.3 |
| Xinjiang | 2.9 | 2.9 | 2.9 | 0.0 | 0.0 | 0.0 | 0.0 |
Table 4.
The top 10 provinces ranked by accessibility in Scenarios 1, 2, 3 and 3/1.
| Rank | Scenario 1 | Scenario 2 | Scenario 3 | Scenario 3/1 (Absolute) | Scenario 3/1 (Relative) | |||||
|---|---|---|---|---|---|---|---|---|---|---|
| WATT | DA | WATT | DA | WATT | DA | WATT | DA | WATT | DA | |
| 1 | Henan | Henan | Henan | Henan | Henan | Henan | Xinjiang | Beijing | Hainan | Hainan |
| 2 | Anhui | Anhui | Anhui | Anhui | Anhui | Anhui | Hainan | Tianjin | Chongqing | Beijing |
| 3 | Hubei | Jiangsu | Beijing | Jiangsu | Hubei | Beijing | Heilongjiang | Anhui | Beijing | Shaanxi |
| 4 | Jiangsu | Shandong | Shanghai | Shanghai | Beijing | Jiangsu | Jilin | Henan | Jilin | Tianjin |
| 5 | Shandong | Hebei | Tianjin | Tianjin | Jiangsu | Tianjin | Yunnan | Jiangsu | Ningxia | Jiangxi |
| 6 | Jiangxi | Shanghai | Jiangsu | Beijing | Shanghai | Shandong | Qinghai | Shandong | Guangdong | Shanxi |
| 7 | Shanxi | Tianjin | Hubei | Shandong | Shanxi | Hebei | Inner Mongolia | Shanxi | Inner Mongolia | Inner Mongolia |
| 8 | Hunan | Chongqing | Shandong | Hebei | Shandong | Shanghai | Gansu | Chongqing | Shanghai | Guizhou |
| 9 | Shanghai | Zhejiang | Hebei | Zhejiang | Tianjin | Chongqing | Liaoning | Jiangxi | Heilongjiang | Ningxia |
| 10 | Shaanxi | Beijing | Zhejiang | Chongqing | Jiangxi | Shanxi | Guangxi | Hebei | Guizhou | Hubei |
Table 5.
Comparison with relevant studies on accessibility in relation to China’s HSR network.
| Study | Phase | Key Results |
|---|---|---|
| Cao et al. (2013) | 2008–2020 | Central-eastern cities gain more benefits based on the results of WATT and contour measures. |
| Shaw et al. (2014) | 2008–2012 | Travel time accessibility of all cities improved about 6.3%. |
| Jiao et al. (2014) | 2003–2020 | WATT increases 42.3% and DA increases 76.4% The HSR increases inequality in accessibility. |
| Wu et al. (2016) | 2006–2014 | The average accessibility improvements experienced a rise of 19.3% at the national level. |
| Jin et al. (2017) | 2008–2020 | WATT increases 42.0% and DA increases 98.7% The inequality of accessibility is aggravated. |
| This study | 2003–2030 | WATT increases 44.9% and DA increases 78.6% The inequality of accessibility is slightly increased. |
© 2018 by the authors. Licensee MDPI, Basel, Switzerland. This article is an open access article distributed under the terms and conditions of the Creative Commons Attribution (CC BY) license (http://creativecommons.org/licenses/by/4.0/).
Share and Cite
MDPI and ACS Style
Wang, L.; Liu, Y.; Mao, L.; Sun, C. Potential Impacts of China 2030 High-Speed Rail Network on Ground Transportation Accessibility. Sustainability 2018, 10, 1270. https://doi.org/10.3390/su10041270
AMA Style
Wang L, Liu Y, Mao L, Sun C. Potential Impacts of China 2030 High-Speed Rail Network on Ground Transportation Accessibility. Sustainability. 2018; 10(4):1270. https://doi.org/10.3390/su10041270
Chicago/Turabian StyleWang, Lvhua, Yongxue Liu, Liang Mao, and Chao Sun. 2018. "Potential Impacts of China 2030 High-Speed Rail Network on Ground Transportation Accessibility" Sustainability 10, no. 4: 1270. https://doi.org/10.3390/su10041270
Note that from the first issue of 2016, this journal uses article numbers instead of page numbers. See further details here.