“I Drive outside of Peak Time to Avoid Traffic Jams—Public Transport Is Not Attractive Here.” Challenging Discourses on Travel to the University Campus in Manila

 , , ,
, , ,
Abstract
:1. Introduction
“People in vehicles travel freely. Curb-sides are permanently filled with parked cars and the children and elderly stay inside their homes. Road space has been delivered to other occupants and the city belongs to no one. While the environment is being destroyed and physical violence has become a major cause of urban fatalities, the economic elite is working to benefit from the globalization process and the middle class is struggling to join the venture” [2] (p. 3).
2. Methods
2.1. The Discursive Approach
- Identification of the concourse under debate–in this case, the issues associated with travel to the university campus at DLSU, Manila
- Generation and selection of statements–the Q sample
- Administration of the Q sample to participants through interviews
- Statistical analysis of collected data to extract ‘typical’ Q sorts through factor analysis (PCA), using Q software (PQMethod 2.35)
- Discursive interpretation of typical Q sorts
2.2. Generation of the Q Sample
2.3. Administering the Q Sort
2.4. Administration of the Survey to Participants
3. Factor Analysis
- Entering of statement list (Q sample)
- Entering of scoring of statements per participant (Q sorts)
- Error proofing, including checking for encoding mistakes, such as double entry of statements
- Factor analysis, using PCA, for generating factor loadings on unrotated factors
- VARIMAX factor rotation to improve quality of factor loadings
- Selection of significantly loading sorts through factor flagging
- Analysis of rotated factors, where the dominant statements with their corresponding rankings are identified for each discourse (also referred to as ‘factors’), including the consensus and disagreement statements
4. Discourses on Travel
4.1. Revealed Discourses
- Discourse A: The Individualistic Car Driver
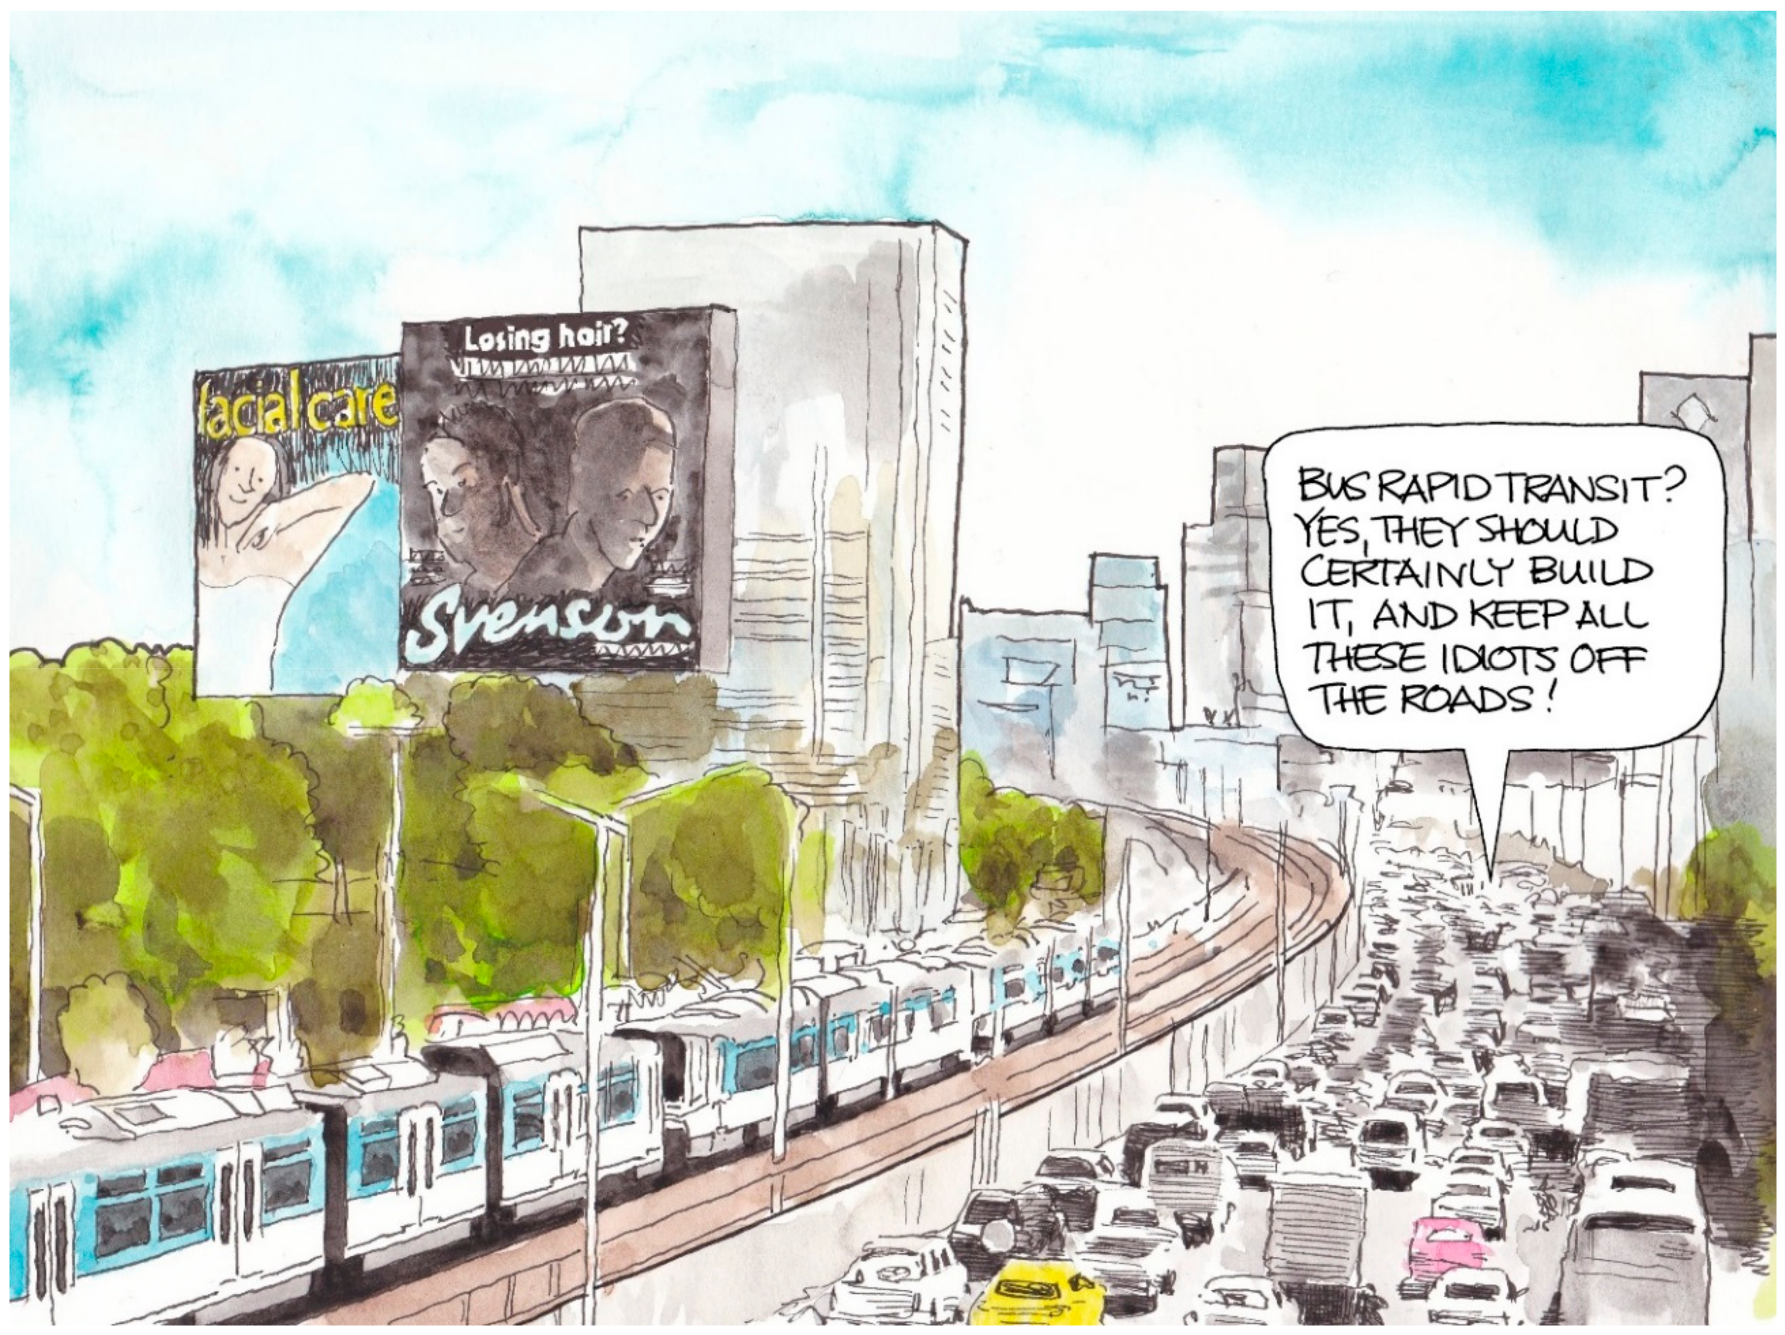
- Discourse B: The Public Transport Advocate
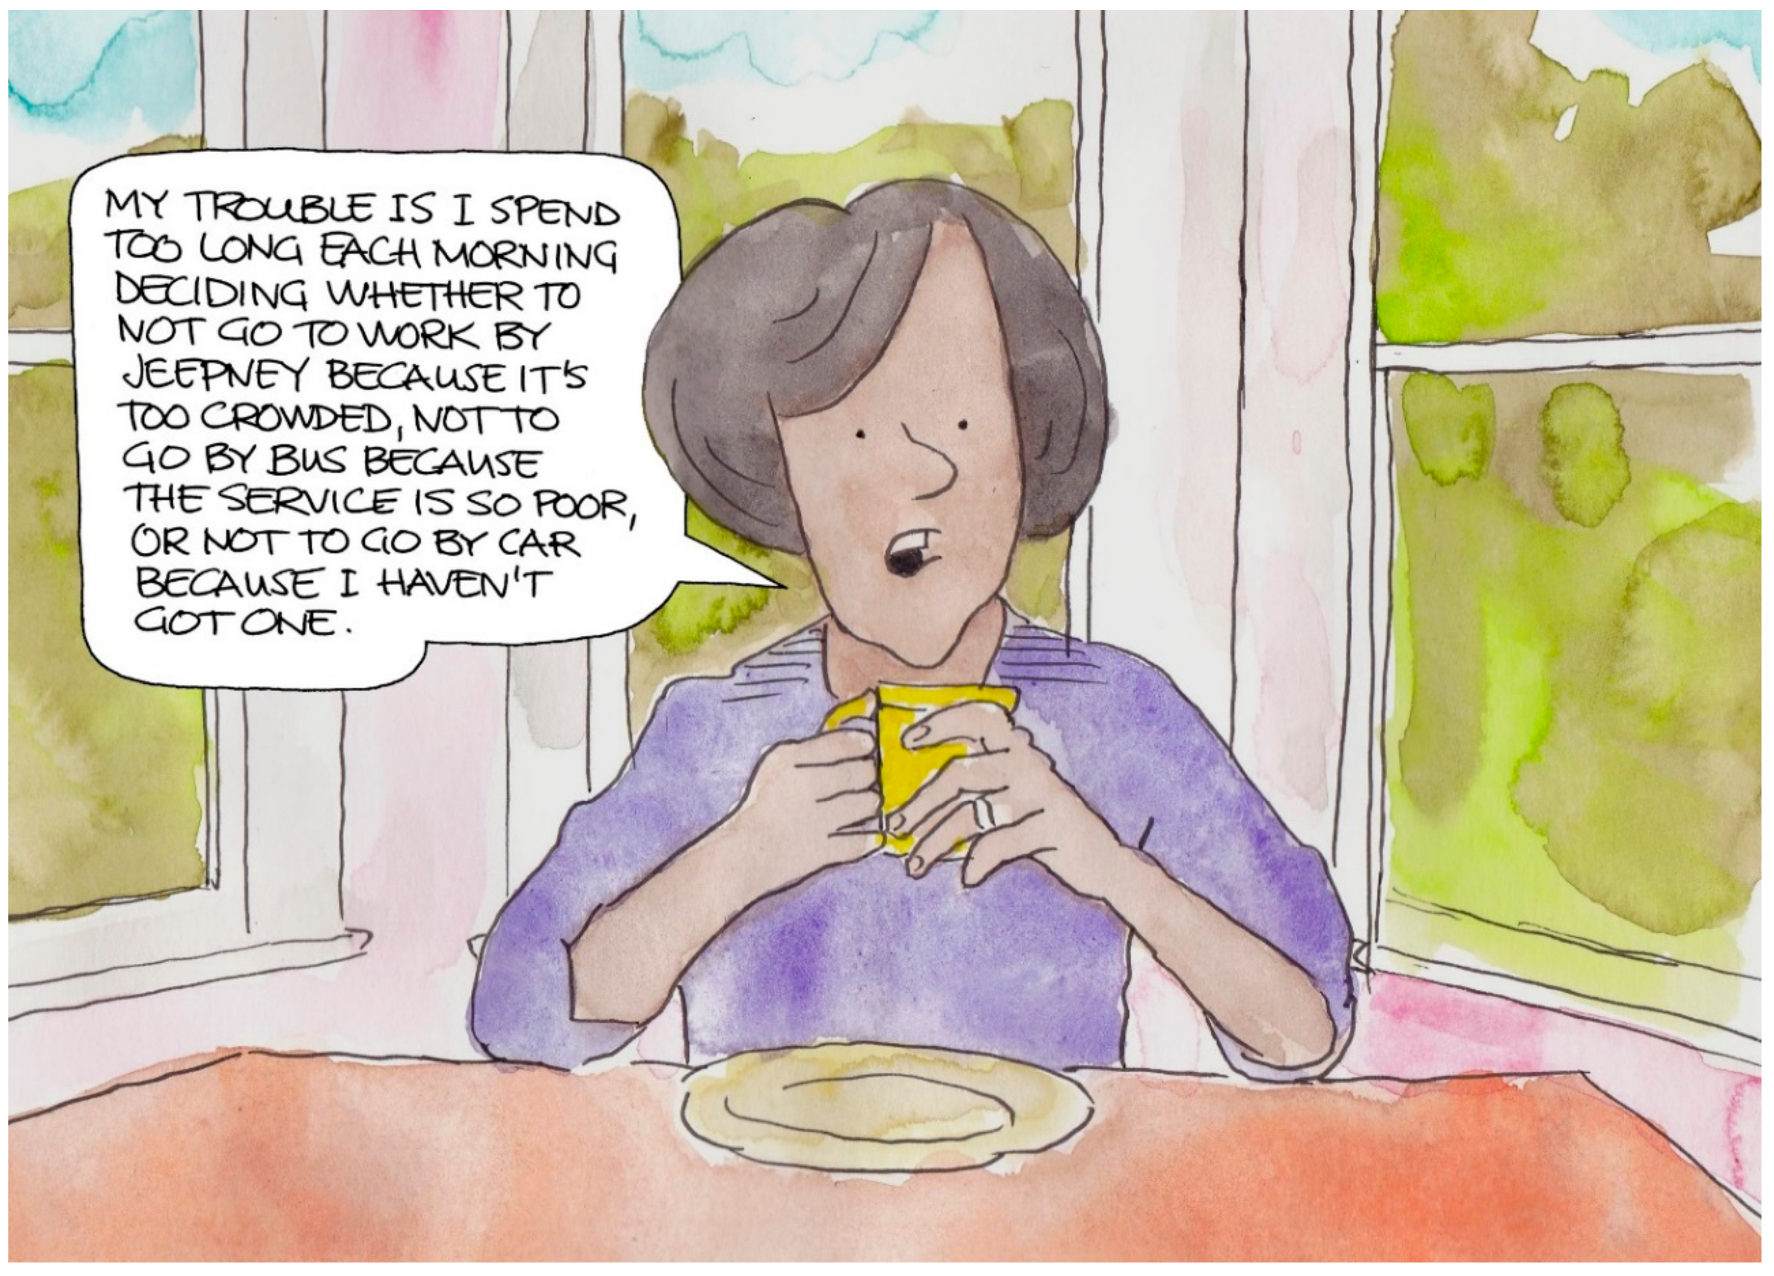
- Discourse C: The Frustrated Traveller
- Discourse D: The Comfort-Seeking Traveller
4.2. Discourse A: The Individualistic Car Driver
- “There should be more options to make people travel more freely. We should consider people’s individual routes” (P10)
- “There are no cycle lanes over here. If we had them, I would cycle but air pollution may still need to be taken into account, as I do not want to inhale polluted air when I am cycling outside with cars” (P22)
- “Cyclists and pedestrians cannot be safe, unless more infrastructure is built […] cyclists do not have enough space on the road” (P13)
- “I do not like walking at all. Walking takes lots of your time” (P19)
4.3. Discourse B: The Public Transport Advocate
- “I have a car, but I still enjoy riding public transport, as I can think about my research when I am riding on public transport. If I drive, I have to focus on my driving” (P23)
- “If people are given access, people will use public transport more” (P26)
- “To encourage shift to public transport, fares should be subsidized. Profit of service providers should not be that high” (P36)
- “Some (private car) drivers choose to use public transport. For example, if they are running late, drivers would just choose to ride public transport” (P41)
- “Public transport should not be privatised and/or should at least be partly state-owned. Both Uber and normal taxis are privatised and compete with each other” (P26)
4.4. Discourse C: The Frustrated Traveller
- “It is hard to understand the route and information to use a jeepney. You do not know where the route is going. You have to ask the driver, but the driver is always too busy driving and has to deal with receiving fares. He does not really have time to answer questions” […] “It is too crowded when I use the LRT, buses and jeepneys. I cannot even breathe” (P18)
- “Because of these conditions, I would prefer driving my own car even if it means staying in traffic for hours. I manage traffic by choosing to leave at off-peak hours” […] “I drive outside of peak time to avoid traffic jams. Public transport is not attractive here. People can leave at different times to avoid the traffic, so it won’t be tiring. I quite enjoy driving, especially if there are no traffic jams. It is more comfortable to drive a car home, as public transport is so crowded and it does not always arrive on time” (P21)
- “Taxi drivers are ‘silly’ drivers, because the government has been lenient in implementing traffic rules. Drivers of public transport vehicles have become unruly” (P32)
4.5. Discourse D: The Comfort-Seeking Traveller
- “It is better to be stuck in your own car rather than to be stuck in a jeepney during heavy traffic” (P09)
- “I do not enjoy riding on jeepneys because of the pollution and crowded conditions” (P24)
- “It is very difficult to cycle here, although one of my colleagues often cycles from home to her workplace” (P24)
5. Comment
6. Conclusions
Author Contributions
Acknowledgments
Conflicts of Interest
References
- Hickman, R.; Cao, M.; Lira, B.M.; Fillone, A.; Biona, J.; Lopez, N. Understanding capabilities, functionings and travel in high and low income neighbourhoods in Manila. Soc. Incl. 2017, 5, 161–174. [Google Scholar] [CrossRef]
- Vasconcellos, E. Urban Transport, Environment and Equity: The Case for Developing Countries; Earthscan: London, UK, 2001. [Google Scholar]
- Böhm, S.; Jones, C.; Land, C.; Paterson, M. Part One, Conceptualizing Automobility: Introduction: Impossibilities of automobility. Sociol. Rev. 2006, 54, 1–16. [Google Scholar] [CrossRef]
- Escobar, A. Encountering Development: The Making and Unmaking of the Third World; Princeton University Press: Princeton, NJ, USA, 2012. [Google Scholar]
- Stephenson, W. Technique of factor analysis. Nature 1935, 136, 297. [Google Scholar] [CrossRef]
- Stephenson, W. The Study of Behavior: Q-Technique and Its Methodology; University of Chicago Press: Chicago, IL, USA, 1953. [Google Scholar]
- Stevenson, H. Contemporary discourses of green political economy: A Q method analysis. J. Environ. Policy Plan. 2015, 1–21. [Google Scholar] [CrossRef]
- Steg, L.; Vlek, C.; Slotegraaf, G. Instrumental-reasoned and symbolic-affective motives for using a motor car. Transp. Res. Part F 2001, 4, 151–169. [Google Scholar] [CrossRef]
- Van Exel, N.; de Graaf, G.; Rietveld, P. Getting from A to B: Operant Approaches to Travel Decision Making. Operant Subj. 2004, 27, 194–216. [Google Scholar]
- Rajé, F. Using Q methodology to develop more perceptive insights on transport and social inclusion. Transp. Policy 2007, 14, 467–477. [Google Scholar] [CrossRef]
- Van Exel, N.; de Graaf, G.; Rietveld, P. I can do perfectly well without a car! Transportation 2011, 38, 383–407. [Google Scholar] [CrossRef] [Green Version]
- Jones, T.; Pooley, C.G.; Scheldeman, G.; Horton, D.; Tight, M.; Mullen, C.; Jopson, A.; Whiteing, A. Moving around the city: Discourses on walking and cycling in English urban areas. Environ. Plan. A 2012, 44, 1407–1424. [Google Scholar] [CrossRef]
- Hickman, R.; Vecia, G. Discourses, travel behaviour and the ‘last mile’ in London. Built Environ. 2016, 42, 539–553. [Google Scholar] [CrossRef]
- Barry, J.; Proops, J. Seeking sustainability discourses with Q methodology. Ecol. Econ. 1999, 28, 337–345. [Google Scholar] [CrossRef]
- Brown, S. A primer on Q methodology. Operant Subj. 1993, 16, 91–138. [Google Scholar]
- Addams, H. Q methodology. In Social Discourse and Environmental Policy: An Application of Q Methodology; Addams, H., Proops, J., Eds.; Edward Elgar: Cheltenham, UK, 2000. [Google Scholar]
- Shabila, N.P.; Al-Tawil, N.G.; Al-Hadithi, T.S.; Sondorp, E. Using Q-methodology to explore people’s health seeking behaviour and perception of the quality of primary care services. BMC Public Health 2014, 14, 2. [Google Scholar] [CrossRef] [PubMed]
- Steelman, T.A.; Maguire, L.A. Understanding participant perspectives: Q methodology in national forest management. J. Policy Anal. Manag. 1999, 18, 361–388. [Google Scholar] [CrossRef]
- Rodgers, R.S. Q methodology. In Rethinking Methods in Psychology; Smith, J.A., Harre, R., van Longenhove, I., Eds.; Sage: London, UK, 1995. [Google Scholar]
- Cross, R.M. Exploring attitudes: The case for Q methodology. Health Educ. Res. 2005, 20, 206–213. [Google Scholar] [CrossRef] [PubMed]
- Japan International Cooperation Agency (JICA); Department of Transportation and Communications (DOTC). Metro Manila Urban Transportation Integration Study Update and Enhancement Project (MUCEP); Technical Report: Transportation Demand Characteristics; DOTC: Manila, Philippines, 2015. [Google Scholar]
- DLSU Diversity Report: Manila, Philippines, 2017. Available online: https://www.collegefactual.com/colleges/la-salle-university/student-life/diversity/) (accessed on 1 March 2018).
- Land Transportation Office. Roadmap for Transport Infrastructure Development Registered Motor Vehicles by Classification and Region 2010–2013; LTO: Manila, Philippines, 2014. Available online: http://data.gov.ph/catalogue/dataset/registered-motor-vehicles-by-classification-and-region-2010–2013 (accessed on 1 March 2017).
- Japan International Cooperation Agency (JICA); Department of Transportation and Communications (DOTC). Metro Manila Urban Transportation Integration Study (MMUTIS); Technical Report No. 4: Transportation Demand Characteristics; DOTC: Manila, Philippines, 1999. [Google Scholar]
- Japan International Cooperation Agency (JICA); National Economic and Development Authority (NEDA). Roadmap for Transport Infrastructure Development for Metro Manila and Its Surrounding Areas; NEDA: Manila, Philippines, 2014. [Google Scholar]
- Waze. Global Driver Satisfaction Index. 2015. Available online: https://blog.waze.com/2015/09/global-driver-satisfaction-index.html (accessed on 1 March 2017).
- Kutzbach, M. Motorization in developing countries: Causes, consequences and effectiveness of policy options. J. Urban Econ. 2009, 65, 154–166. [Google Scholar] [CrossRef]
- Wells, P.; Xenias, D. From ‘freedom of the open road’ to ‘cocooning’: Understanding resistance to change in personal private automobility. Environ. Innov. Soc. Trans. 2015, 16, 106–119. [Google Scholar] [CrossRef]
- Geurs, K.; Van Wee, B. Backcasting as a Tool for Sustainable Transport Policy Making: The Environmentally Sustainable Transport Study in the Netherlands. Eur. J. Transp. Infrastruct. Res. 2004, 4, 47–69. [Google Scholar]
- Åkerman, J.; Höjer, M. How much transport can the climate stand? Sweden on a sustainable path in 2050. Energy Policy 2006, 34, 1944–1957. [Google Scholar] [CrossRef]
- Hickman, R.; Banister, D. Transport, Climate Change and the City; Routledge: Abingdon, UK, 2014. [Google Scholar]


| Demographic | No. of Participants | % of Participants | % DLSU Student (Undergraduate)/Faculty | % Metro Manila * | Source | |
|---|---|---|---|---|---|---|
| Gender | Male | 24 | 57% | 37.5%/51.9% | 52% | [21,22] |
| Female | 18 | 43% | 62.5%/48.1% | 48% | ||
| Age | 18–24 | 19 | 45% | 62.7% | 19% | [21,22] |
| 25–44 | 19 | 45% | 36.9% | 36% | ||
| 45–64 | 4 | 10% | - | 22% | ||
| Driving license | Yes | 27 | 64% | - | 54% | [23] |
| No | 15 | 36% | - | 46% | ||
| Household car ownership | Yes | 37 | 88% | - | 12% | [21] |
| No | 5 | 12% | - | 89% | ||
| Monthly household income (U.S.D) | 200–500 | 5 | 12% | - | 44% | [21] |
| 500–900 | 4 | 10% | - | 13% | ||
| 900–1100 | 1 | 2% | - | 5% | ||
| 1100–1400 | 4 | 10% | - | 3% | ||
| >1400 | 28 | 67% | - | 1% | ||
| Main mode to school/work | Private Car | 17 | 40% | - | 8% | [21] |
| Jeepney | 1 | 2% | - | 19% | ||
| Utility Van | 4 | 10% | - | 1% | ||
| Walking | 3 | 7% | - | 31% | ||
| Bus | 10 | 24% | - | 7% | ||
| Taxi | 1 | 2% | - | 1% | ||
| Train | 4 | 10% | - | 4% | ||
| Motorcycle | 2 | 5% | - | 8% | ||
| Secondary mode to school/work | Private Car | 3 | 7% | - | 8% | [21] |
| Jeepney | 5 | 12% | - | 19% | ||
| Utility Van | 3 | 7% | - | 1% | ||
| Walking | 3 | 7% | - | 31% | ||
| Bus | 2 | 5% | - | 7% | ||
| Taxi | 3 | 7% | - | 1% | ||
| Train | 9 | 21% | - | 4% | ||
| Motorcycle | - | 0% | - | 8% | ||
| Agree with Least | Agree with Most | ||||||||
|---|---|---|---|---|---|---|---|---|---|
| Value | −4 | −3 | −2 | −1 | 0 | 1 | 2 | 3 | 4 |
| Number of Statements | 4 | 7 | 9 | 11 | 13 | 11 | 9 | 7 | 4 |
| (n = 75) | |||||||||
| Factor | Eigenvalues | As Percentages | Cumulative Percentages |
|---|---|---|---|
| 1 | 8.70 | 20.72% | 20.72% |
| 2 | 3.16 | 7.52% | 28.24% |
| 3 | 2.23 | 5.31% | 33.55% |
| 4 | 1.98 | 4.71% | 38.25% |
| 5 | 1.79 | 4.26% | 42.51% |
| 6 | 1.77 | 4.21% | 46.72% |
| 7 | 1.65 | 3.93% | 50.65% |
| 8 | 1.51 | 3.60% | 54.25% |
| 9 | 1.44 | 3.43% | 57.68% |
| 10 | 1.37 | 3.26% | 60.94% |
| 11 | 1.30 | 3.10% | 64.03% |
| 12 | 1.16 | 2.77% | 66.80% |
| 13 | 1.10 | 2.61% | 69.41% |
| 14 | 1.01 | 2.40% | 71.82% |
| 15 | 0.98 | 2.33% | 74.15% |
| 16 | 0.94 | 2.23% | 76.38% |
| 17 | 0.90 | 2.14% | 78.51% |
| 18 | 0.85 | 2.03% | 80.54% |
| 19 | 0.80 | 1.91% | 82.45% |
| 20 | 0.78 | 1.86% | 84.31% |
| Participant ID | Factor | |||||||
|---|---|---|---|---|---|---|---|---|
| 1 | 2 | 3 | 4 | |||||
| P01 | 0.00 | 0.13 | 0.19 | 0.54 | X | |||
| P02 | −0.05 | 0.11 | 0.44 | X | 0.21 | |||
| P03 | 0.02 | 0.43 | X | 0.22 | 0.36 | |||
| P04 | 0.16 | 0.65 | X | 0.12 | 0.42 | |||
| P05 | 0.35 | 0.50 | X | 0.23 | 0.23 | |||
| P06 | 0.38 | 0.33 | 0.33 | 0.03 | ||||
| P07 | 0.35 | 0.09 | 0.12 | 0.60 | X | |||
| P08 | −0.04 | 0.62 | X | −0.10 | 0.17 | |||
| P09 | 0.09 | 0.08 | −0.04 | 0.58 | X | |||
| P10 | 0.45 | X | 0.21 | 0.30 | 0.07 | |||
| P11 | 0.31 | 0.20 | 0.43 | X | 0.22 | |||
| P12 | 0.58 | X | −0.27 | 0.03 | 0.11 | |||
| P13 | 0.60 | X | 0.21 | 0.00 | 0.13 | |||
| P14 | 0.62 | X | 0.05 | 0.23 | −0.04 | |||
| P15 | 0.40 | X | 0.25 | −0.24 | −0.10 | |||
| P16 | 0.34 | 0.47 | X | 0.27 | 0.01 | |||
| P17 | 0.50 | X | 0.05 | −0.13 | 0.14 | |||
| P18 | 0.06 | 0.17 | 0.45 | X | 0.25 | |||
| P19 | 0.59 | X | 0.07 | 0.04 | 0.12 | |||
| P20 | 0.08 | 0.11 | 0.39 | X | −0.32 | |||
| P21 | 0.20 | 0.18 | 0.53 | X | 0.24 | |||
| P22 | 0.39 | X | 0.01 | 0.11 | 0.18 | |||
| P23 | 0.26 | 0.62 | X | 0.12 | −0.16 | |||
| P24 | 0.18 | −0.02 | 0.11 | 0.56 | X | |||
| P25 | 0.34 | 0.40 | 0.27 | 0.14 | ||||
| P26 | −0.01 | 0.66 | X | 0.01 | 0.16 | |||
| P27 | 0.31 | 0.07 | 0.47 | 0.44 | ||||
| P28 | 0.08 | −0.25 | 0.33 | 0.12 | ||||
| P29 | 0.34 | 0.20 | 0.29 | 0.23 | ||||
| P30 | −0.05 | 0.72 | X | 0.25 | 0.04 | |||
| P31 | 0.53 | X | 0.03 | 0.47 | 0.11 | |||
| P32 | −0.03 | 0.40 | 0.52 | X | −0.14 | |||
| P33 | 0.06 | 0.34 | 0.59 | X | −0.20 | |||
| P34 | −0.03 | −0.04 | 0.66 | X | 0.09 | |||
| P35 | 0.36 | 0.08 | 0.51 | X | −0.09 | |||
| P36 | −0.15 | 0.34 | X | 0.25 | −0.12 | |||
| P37 | 0.20 | 0.65 | X | 0.17 | 0.25 | |||
| P38 | 0.41 | X | 0.12 | 0.25 | −0.13 | |||
| P39 | 0.09 | 0.35 | 0.02 | −0.27 | ||||
| P40 | 0.33 | −0.27 | 0.36 | 0.24 | ||||
| P41 | 0.15 | 0.48 | X | 0.07 | −0.03 | |||
| P42 | 0.30 | 0.17 | 0.52 | X | 0.16 | |||
| No. | Statement | Statement by Discourse | |||
|---|---|---|---|---|---|
| A | B | C | D | ||
| The Individualistic Car Driver | The Public Transport Advocate | The Frustrated Traveller | The Comfort-Seeking Traveller | ||
| 1 | I enjoy the freedom and independence of driving a car | 1 | −2 | 2 | 3 |
| 2 | I enjoy driving nice or expensive cars | −2 | −4 | 1 | 0 |
| 3 | Car ownership is a universal goal and a natural step in life’s progression | 1 | −4 | −1 | −3 |
| 4 | I like driving fast and get a kick out of driving | −4 | −4 | 0 | −4 |
| 5 | Driving is tiring and stressful–time spent driving is often the worst part of my day | −1 | −1 | −3 | 1 |
| 6 | I prefer to drive a Sports Utility Vehicle (SUV) or Sedan in case of floods | −1 | 0 | 0 | 3 |
| 7 | We need to invest more in the urban highway network–there is too much congestion and we need more space for cars | 4 | −3 | 2 | −2 |
| 8 | I feel safer in a car–it is the safest way to get around | 3 | −1 | 2 | 4 |
| 9 | Being in a car stuck in traffic is better than riding a bus or jeepney stuck in traffic | −3 | −2 | 1 | 4 |
| 10 | If you are successful in life you tend to drive a nice car | 1 | −3 | 0 | −1 |
| 11 | Residential car parking spaces are much too difficult to find–more spaces are required | 2 | −4 | −2 | 2 |
| 12 | I like the carrying capacity and utility of an SUV or Sedan (for luggage and other passengers) | 1 | 0 | 1 | 3 |
| 13 | It is necessary to own a car in a city like Manila–public transport is too unreliable | −2 | 0 | 0 | −1 |
| 14 | It is hard to be truly independent and flexible without a car | 0 | −2 | −2 | −2 |
| 15 | I would use a low emission car or electric car if they became much cheaper | 3 | 1 | −1 | 3 |
| 16 | I would use an automated car if they became available–they would be useful in Manila | 1 | −2 | 2 | 1 |
| 17 | Car clubs and car rental (Uber or Grab) are an ideal model of car ownership–they mean I do not need to buy my own car | 1 | −1 | −3 | 2 |
| 18 | We should spend much more money to provide an extensive and reliable Light Rapid Transit (LRT) network | 2 | 3 | 3 | 2 |
| 19 | Bus Rapid Transit (BRT) should be developed–with segregated bus lanes to give them priority over the car | 4 | 3 | 1 | 0 |
| 20 | There needs to be much improved public transport links to Ninoy Aquino International Airport | 4 | 2 | 4 | 1 |
| 21 | I use public transport only because I do not have a car | −1 | −3 | −4 | 0 |
| 22 | The LRT, bus and jeepneys are much too crowded to enjoy travelling on them at the peak times | 4 | 3 | 4 | 3 |
| 23 | The current public transport network is not good enough to make car ownership unnecessary | −1 | 1 | 4 | −2 |
| 24 | An important part of travelling on public transport is the capacity to read, write and use my phone throughout the journey | 0 | 0 | −4 | 4 |
| 25 | I enjoy riding on jeepneys–they are fun and convenient | −3 | −2 | −3 | −4 |
| 26 | The LRT Line One extension is important to allow better connections between Manila and other urban centres (Cavite) | 2 | 4 | 3 | 1 |
| 27 | We should stop spending money on urban highways and use the funds for improving public transport | −3 | 4 | −1 | 2 |
| 28 | I don’t use public transport because the transfers are inconvenient | −2 | −2 | −2 | −3 |
| 29 | Public transport should be subsidised to improve the quality–systems shouldn’t need to make a profit | 3 | 1 | 1 | 4 |
| 30 | Provincial public transport terminals are needed to the north and south of the city–with citybus links into the city | 3 | 4 | 3 | −1 |
| 31 | It is really only the poorest people in society that use the bus regularly | −4 | −3 | −4 | −2 |
| 32 | We should add more point-to-point buses between urban centres–even if they are more expensive | 0 | 1 | 0 | -1 |
| 33 | I would cycle more if there were much better cycling facilities | −1 | 0 | 0 | 0 |
| 34 | Cycling is not possible in Manila–it is too dangerous and there are no facilities | 0 | 1 | −1 | 2 |
| 35 | We should invest in an extensive, segregated cycle network | 0 | 1 | 1 | −1 |
| 36 | Using private concessions is a useful way of providing transport infrastructure–it saves public money and provides good quality projects | −2 | 0 | 1 | −1 |
| 37 | I enjoy cycling regularly as it gives me exercise | −2 | 0 | −2 | −1 |
| 38 | Streets should be closed to traffic on Sundays or one day a month–so walking, cycling and social interaction can take place in and between urban centres (similar to the Bogotá Ciclovía) | −1 | −1 | −4 | −1 |
| 39 | Cycling to work isn’t feasible due to the distance or the need to arrive at work in professional attire | 2 | 1 | −1 | −1 |
| 40 | A society where the majority of people cycle to work is ideal | −2 | 2 | 0 | 0 |
| 41 | I enjoy using cycle hire, such as GrabBike and we should have more of these facilities provided | −3 | −1 | −1 | −3 |
| 42 | I use a motorcycle as it is much quicker through traffic | −4 | −2 | −3 | −3 |
| 43 | Using a motorcycle is too dangerous and it should be discouraged | 0 | −1 | −1 | 2 |
| 44 | I use the motorcycle over public transport because it is cheaper | −3 | −2 | −3 | −4 |
| 45 | You should be able to walk anywhere you need to go | 0 | 3 | 1 | 1 |
| 46 | Walking is my favourite means of travel | −3 | 0 | −2 | 1 |
| 47 | I only tend to walk as it is free–I much prefer other modes of travel | −1 | −3 | −2 | 1 |
| 48 | We need to radically improve footways and the public realm–so walking is much more pleasant | 0 | 2 | 2 | 3 |
| 49 | I would much prefer if I could walk, cycle and use public transport all of the time–and never travel by car | −4 | 2 | 0 | −1 |
| 50 | I prefer to work at home and do it whenever I can | −3 | 0 | 1 | −4 |
| 51 | It is important to locate new development around the public transport network | 3 | 2 | 2 | 1 |
| 52 | New urban centres and developments should only be built if they are well served by public transport | −1 | 2 | 3 | 1 |
| 53 | It is difficult to use public transport–many of the stations are not accessible for those with disabilities or mobility difficulties | −2 | 1 | 1 | 0 |
| 54 | I would use the bus and jeepney–but it is difficult to find out where services run from and to | −1 | −1 | −1 | 2 |
| 55 | Public transport connections to informal settlements need to be much improved | 3 | −1 | 2 | −3 |
| 56 | I do not feel confident cycling in heavy or fast-moving traffic–cyclists are the most vulnerable of all road users | 0 | 1 | 3 | 2 |
| 57 | It is important to build the Metro Manila Skyway and other urban highways–they are critical to improve congestion in Manila | 1 | −1 | 3 | −2 |
| 58 | My preferred mode of transport is influenced by daily weather conditions | −2 | 0 | 4 | 0 |
| 59 | Roads and streets are a public good and should be used more democratically–there should be much more space for pedestrians and cyclists | 0 | 2 | 0 | −2 |
| 60 | We should provide cheaper parking spaces in Manila | 1 | −3 | 0 | 1 |
| 61 | Taxis are important and should be given greater priority on our roads | 0 | −3 | −3 | −3 |
| 62 | Cars are given too much priority on highways | 1 | 1 | −2 | −3 |
| 63 | The cost of car parking influences my choice of retail centre | −1 | −2 | −2 | −1 |
| 64 | It is important to expand Ninoy Aquino International Airport as an international hub and to help generate employment in the city | 2 | −1 | −1 | 1 |
| 65 | The international airport should be moved beyond the metropolitan area | 0 | 4 | 3 | −2 |
| 66 | Travelcards are important to creating a more ‘seamless’ travel experience–so that one ticket can be used on the LRT, bus and all public transport | 2 | 3 | 1 | 0 |
| 67 | We need more pedestrianisation in the urban centres–it is important to reduce traffic in the retail areas | 2 | 3 | −1 | 0 |
| 68 | The jeepney fleet needs to be modernised with new comfortable vehicles and formal stops | 0 | 0 | 2 | 0 |
| 69 | Jeepneys are an iconic mode for Manila–they should have clean fuel but still be allowed to run as they currently do | 2 | −1 | 0 | 2 |
| 70 | More information is required on jeepney routing and scheduling–so it is easier to use them | 2 | 1 | 0 | 0 |
| 71 | Jeepneys should be required to stop at formal stops only | 3 | 2 | 2 | 3 |
| 72 | Cars should be charged to use the highway–and the funds used to improve public transport | −1 | 2 | −1 | 0 |
| 73 | New forms of taxation, on vehicle licensing, or businesses or residential property sales, are required to fund more investment in public transport schemes | −2 | 0 | −3 | 0 |
| 74 | All vehicles over 15 years old should not be allowed to use the highway | 1 | 0 | −2 | −2 |
| 75 | The vehicle licensing system should be used to restrict and reduce the number of vehicles on the highway | 1 | 3 | 0 | −2 |
| Rank | Statements |
|---|---|
| +4 | 7, 19, 20, 22 |
| +3 | 8, 15, 29, 30, 51, 55, 71 |
| −3 | 9, 25, 27, 41, 44, 46, 50 |
| −4 | 4, 31, 42, 49 |
| Rank | Statements |
|---|---|
| +4 | 26, 27, 30, 65 |
| +3 | 18, 19, 22, 45, 66, 67, 75 |
| −3 | 7, 10, 21, 31, 47, 60, 61 |
| −4 | 2, 3, 4, 11 |
| Rank | Statements |
|---|---|
| +4 | 20, 22, 23, 58 |
| +3 | 18, 26, 30, 52, 56, 57, 65 |
| −3 | 5, 17, 25, 42, 44, 61, 73 |
| −4 | 21, 24, 31, 38 |
| Rank | Statements |
|---|---|
| +4 | 8, 9, 24, 29 |
| +3 | 1, 6, 12, 15, 22, 48, 71 |
| −3 | 3, 28, 41, 42, 55, 61, 62 |
| −4 | 4, 25, 44, 50 |
| Statement | Ranking |
|---|---|
| We should spend much more money to provide an extensive and reliable Light Rapid Transit network | Moderately Agree |
| Jeepneys should be required to stop at formal stops only | Moderately Agree |
| More information is required on jeepney routing and scheduling–so it is easier to use them | Moderately Agree to Neutral |
| I would cycle more if there were much better cycling facilities | Neutral to Moderately Disagree |
| I enjoy cycling regularly as it gives me exercise | Moderately Disagree |
| I don’t use public transport because the transfers are inconvenient | Moderately Disagree |
© 2018 by the authors. Licensee MDPI, Basel, Switzerland. This article is an open access article distributed under the terms and conditions of the Creative Commons Attribution (CC BY) license (http://creativecommons.org/licenses/by/4.0/).
Share and Cite
Hickman, R.; Lopez, N.; Cao, M.; Lira, B.M.; Biona, J.B.M. “I Drive outside of Peak Time to Avoid Traffic Jams—Public Transport Is Not Attractive Here.” Challenging Discourses on Travel to the University Campus in Manila. Sustainability 2018, 10, 1462. https://doi.org/10.3390/su10051462
Hickman R, Lopez N, Cao M, Lira BM, Biona JBM. “I Drive outside of Peak Time to Avoid Traffic Jams—Public Transport Is Not Attractive Here.” Challenging Discourses on Travel to the University Campus in Manila. Sustainability. 2018; 10(5):1462. https://doi.org/10.3390/su10051462
Chicago/Turabian StyleHickman, Robin, Neil Lopez, Mengqiu Cao, Beatriz Mella Lira, and Jose Bienvenido Manuel Biona. 2018. "“I Drive outside of Peak Time to Avoid Traffic Jams—Public Transport Is Not Attractive Here.” Challenging Discourses on Travel to the University Campus in Manila" Sustainability 10, no. 5: 1462. https://doi.org/10.3390/su10051462