Municipal Sustainability Influence by European Union Investment Programs on the Portuguese Local Government


Abstract
1. Introduction
2. European Structural Investment and Funds Impact on Municipal Performance and Sustainability
2.1. European Structural Investment and Funds Impact on Municipal Performance
2.2. Understanding the Importance of “Holistic” Sustainability
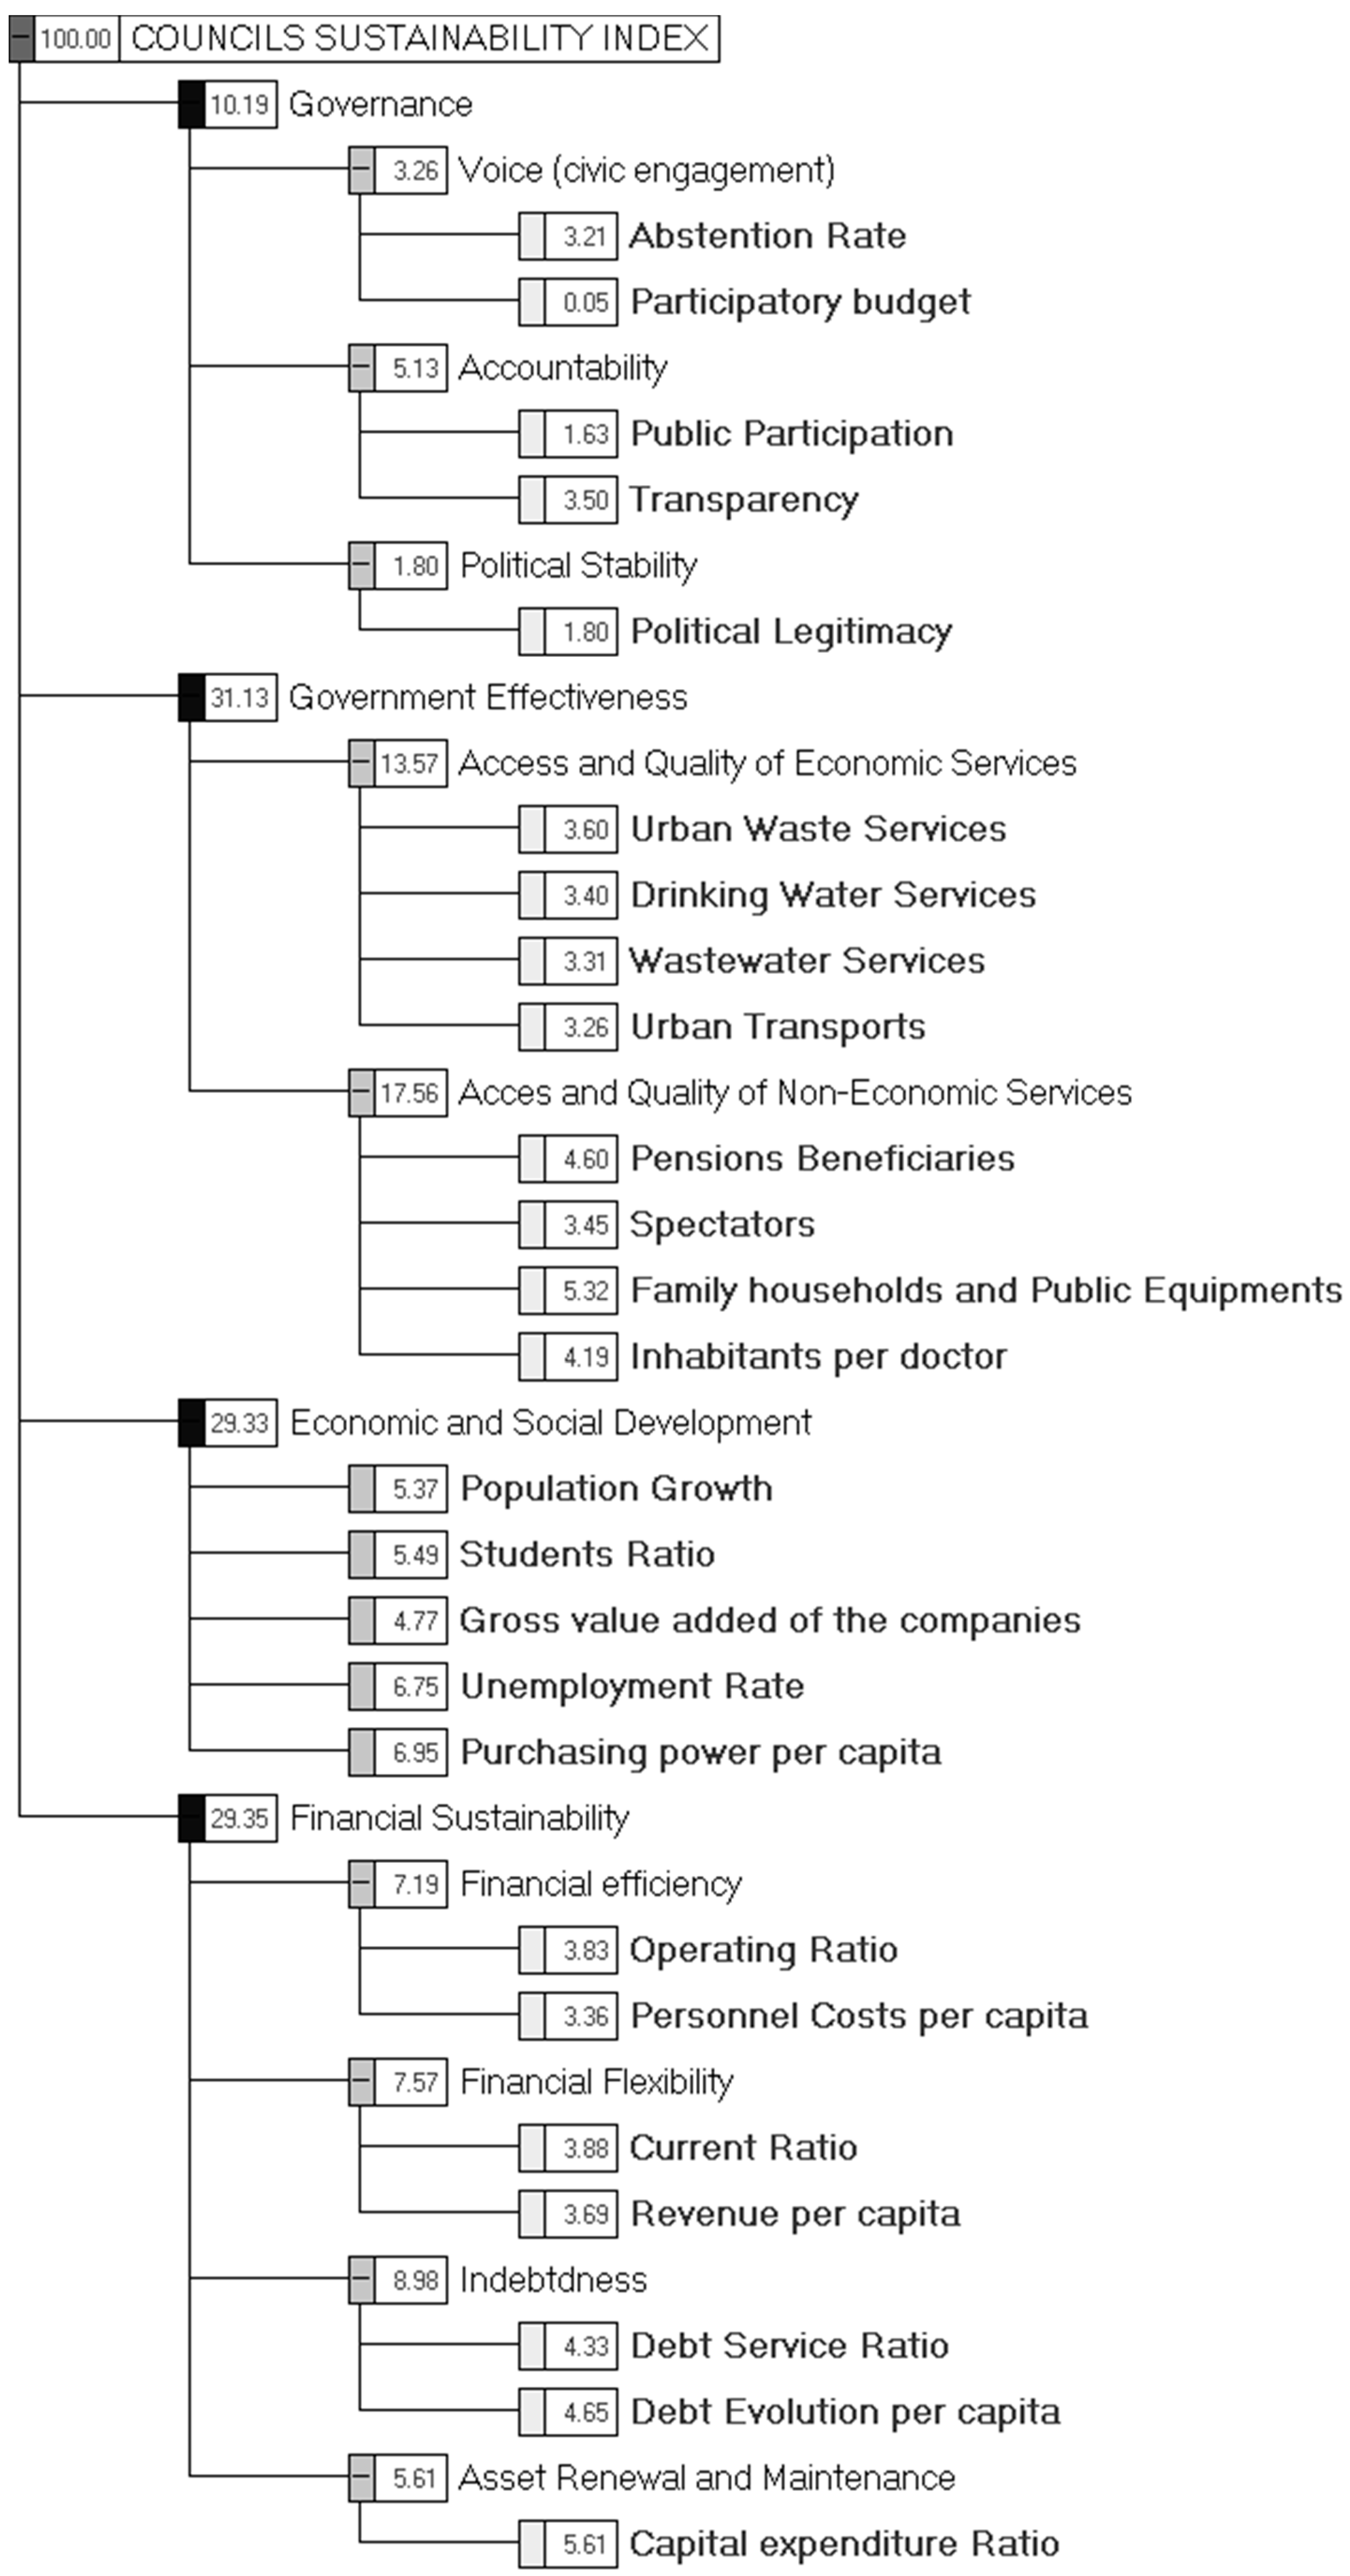
2.3. A Portuguese Council Sustainability Index (CSI)
3. Methodological Considerations
- Efficiency focuses on the relative position of the councils from a group with respect to their own corresponding frontier; the more below the frontier, the more inefficient these councils.
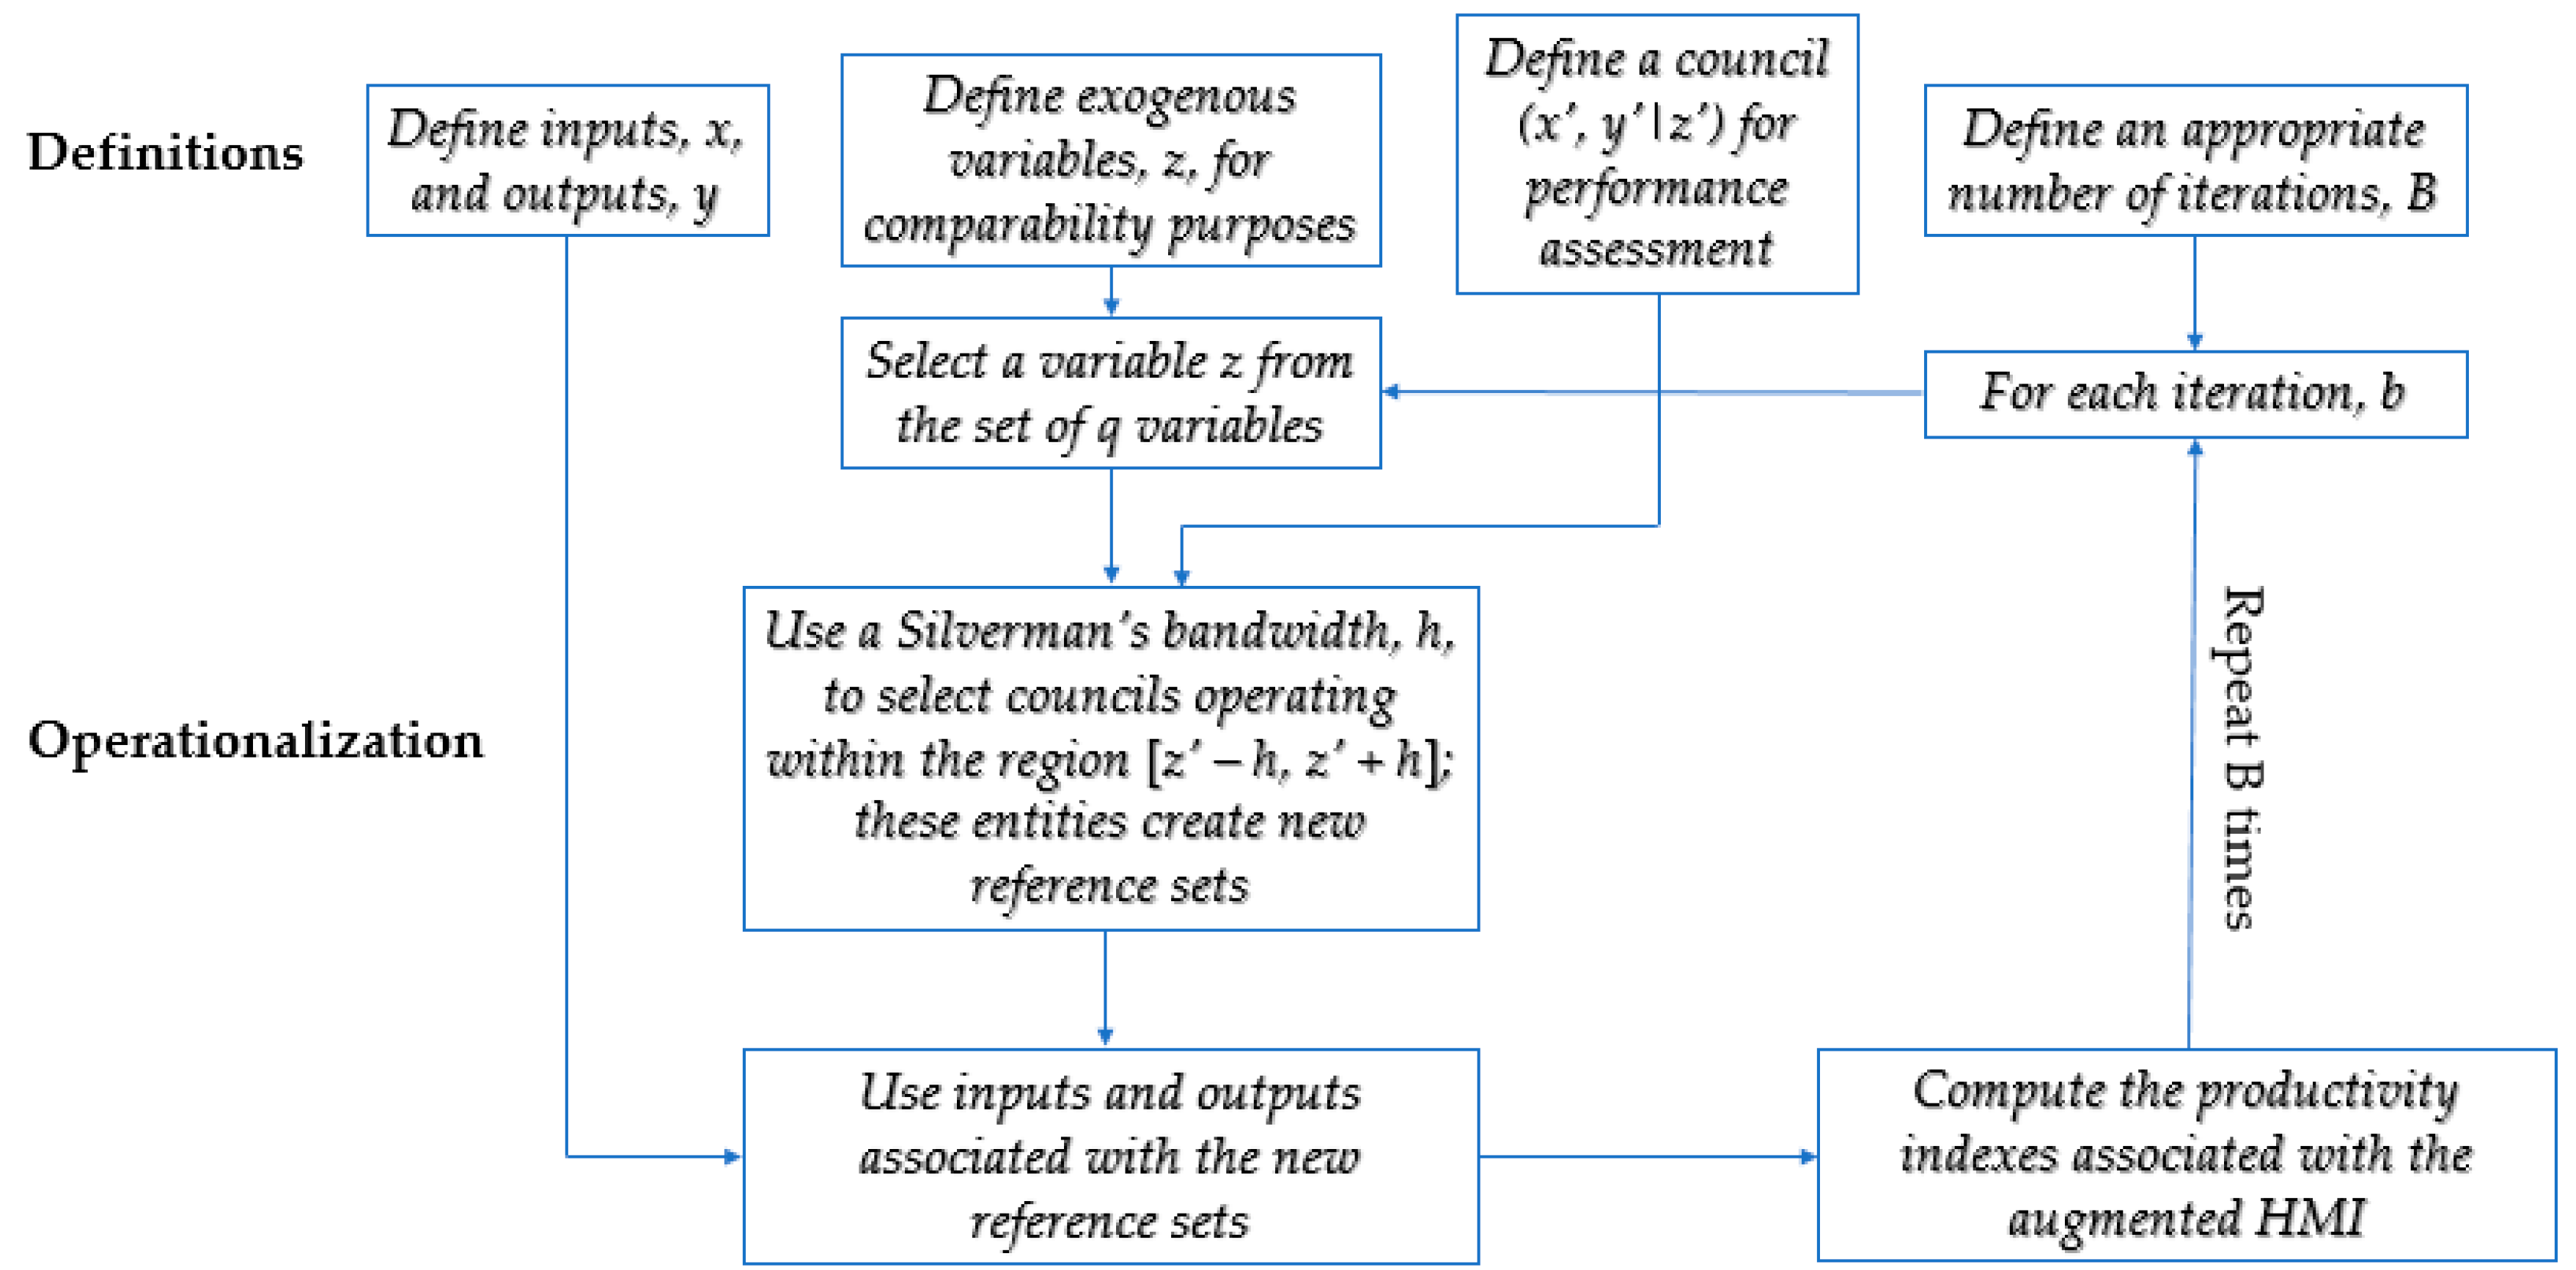
- Productivity concerns the relative position of both frontiers (i.e., technologies); one cluster is more productive than the other if the former benchmarks can produce more outputs with fewer inputs than the best practices of the other group [41]. Let us consider two clusters, A = {non-sustainable councils} and B = {sustainable councils}, as achieved through the CSI approach (vide supra). Each cluster is totally characterized by a set of m inputs (consumed resources), Xi, i = 1…, m, and s produced outputs (goods and/or services), Yr, r = 1, …, s. Suppose these clusters have sizes and , respectively. These councils are responsible for the production process, say and , and at the same time they face a set of q exogenous variables, Zp, p = 1, …, q. Some of those councils are more efficient than the others in the very same cluster. The Pareto-efficient councils are placed in the efficient frontier (or technology), and , which in turn can be constructed via non/semi-parametric tools, such as data envelopment analysis (DEA)-like methods. Now, consider a single council0 from a specific cluster, say A, and denote it by . We intend to achieve its targets on the frontier of another cluster, say B. is the set of m+s targets of council0 with respect to the frontier of that cluster, , and is a directional vector controlling for the direction in which council0 is projected on . Targets can be pre-defined or empirically determined. In the latter case, if DEA-like methods are employed, a linear combination of (at least, one) Pareto-efficient councils in is used to compute . Assessing these values assumes a prominent role in Ferreira and Marques’ approach, as shown later. The next subsection describes how these targets can be computed through a very robust semi-parametric frontier-based method.
4. Empirical Evidence on Impact of EU Programs on Portuguese Councils
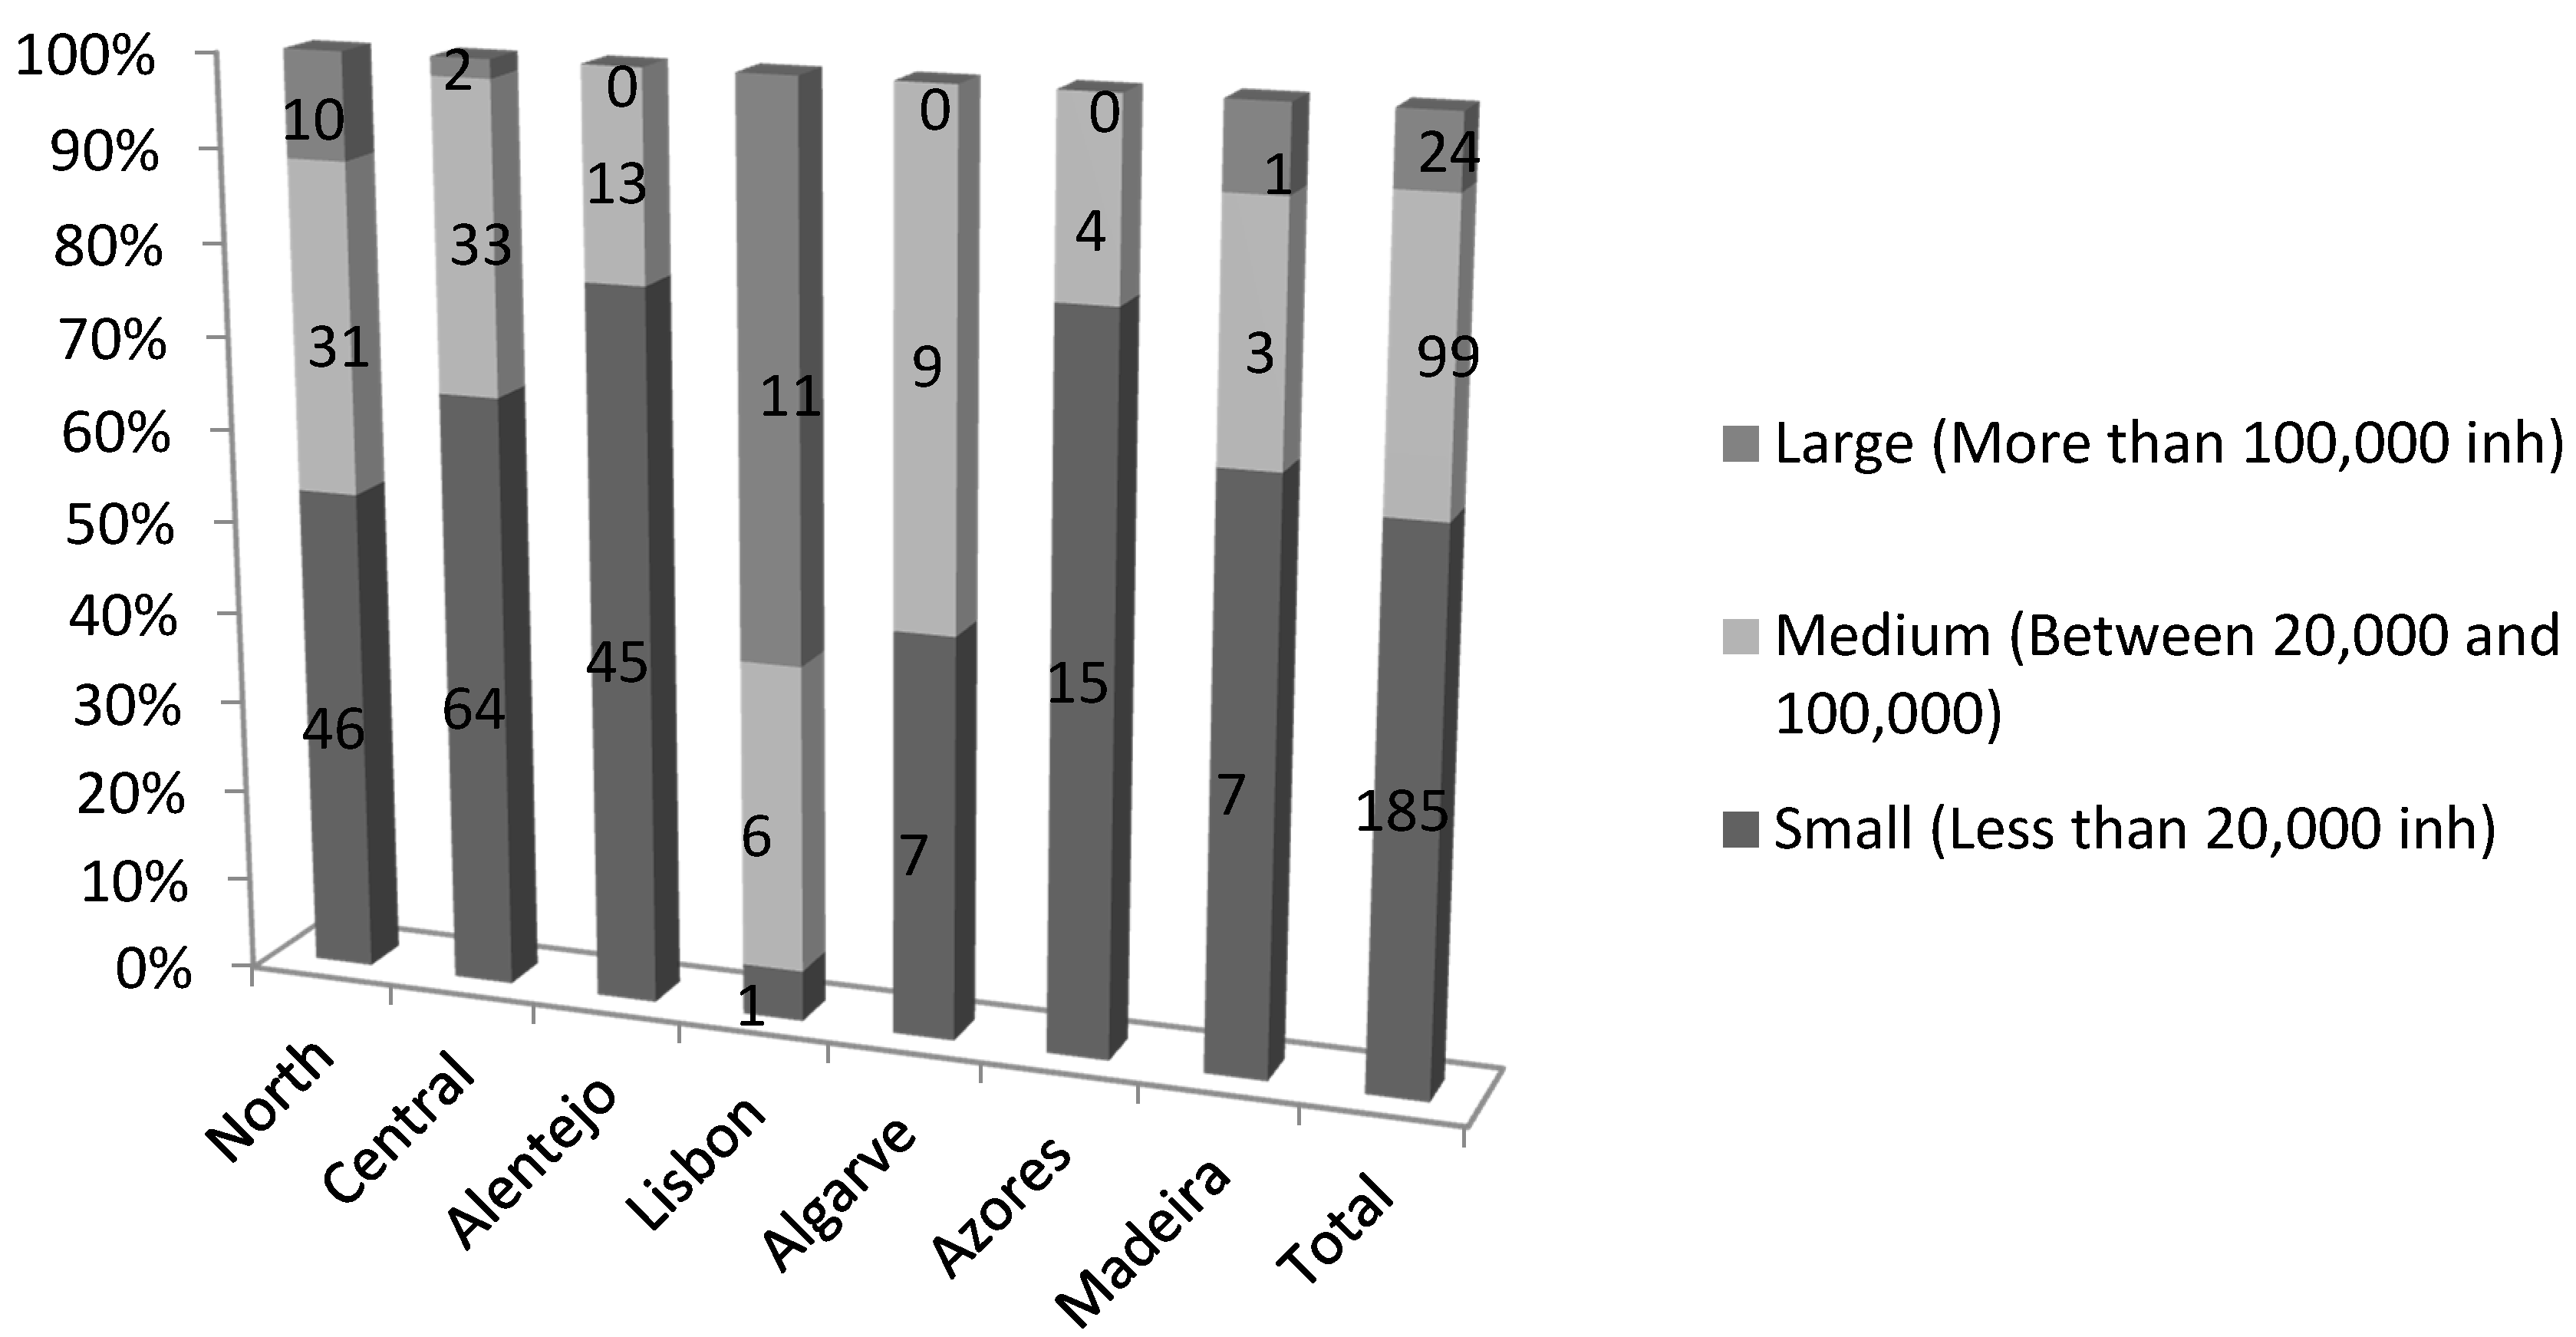
4.1. Portuguese Local Government
4.2. Does High Sustainability Means High EU Investments Performance?
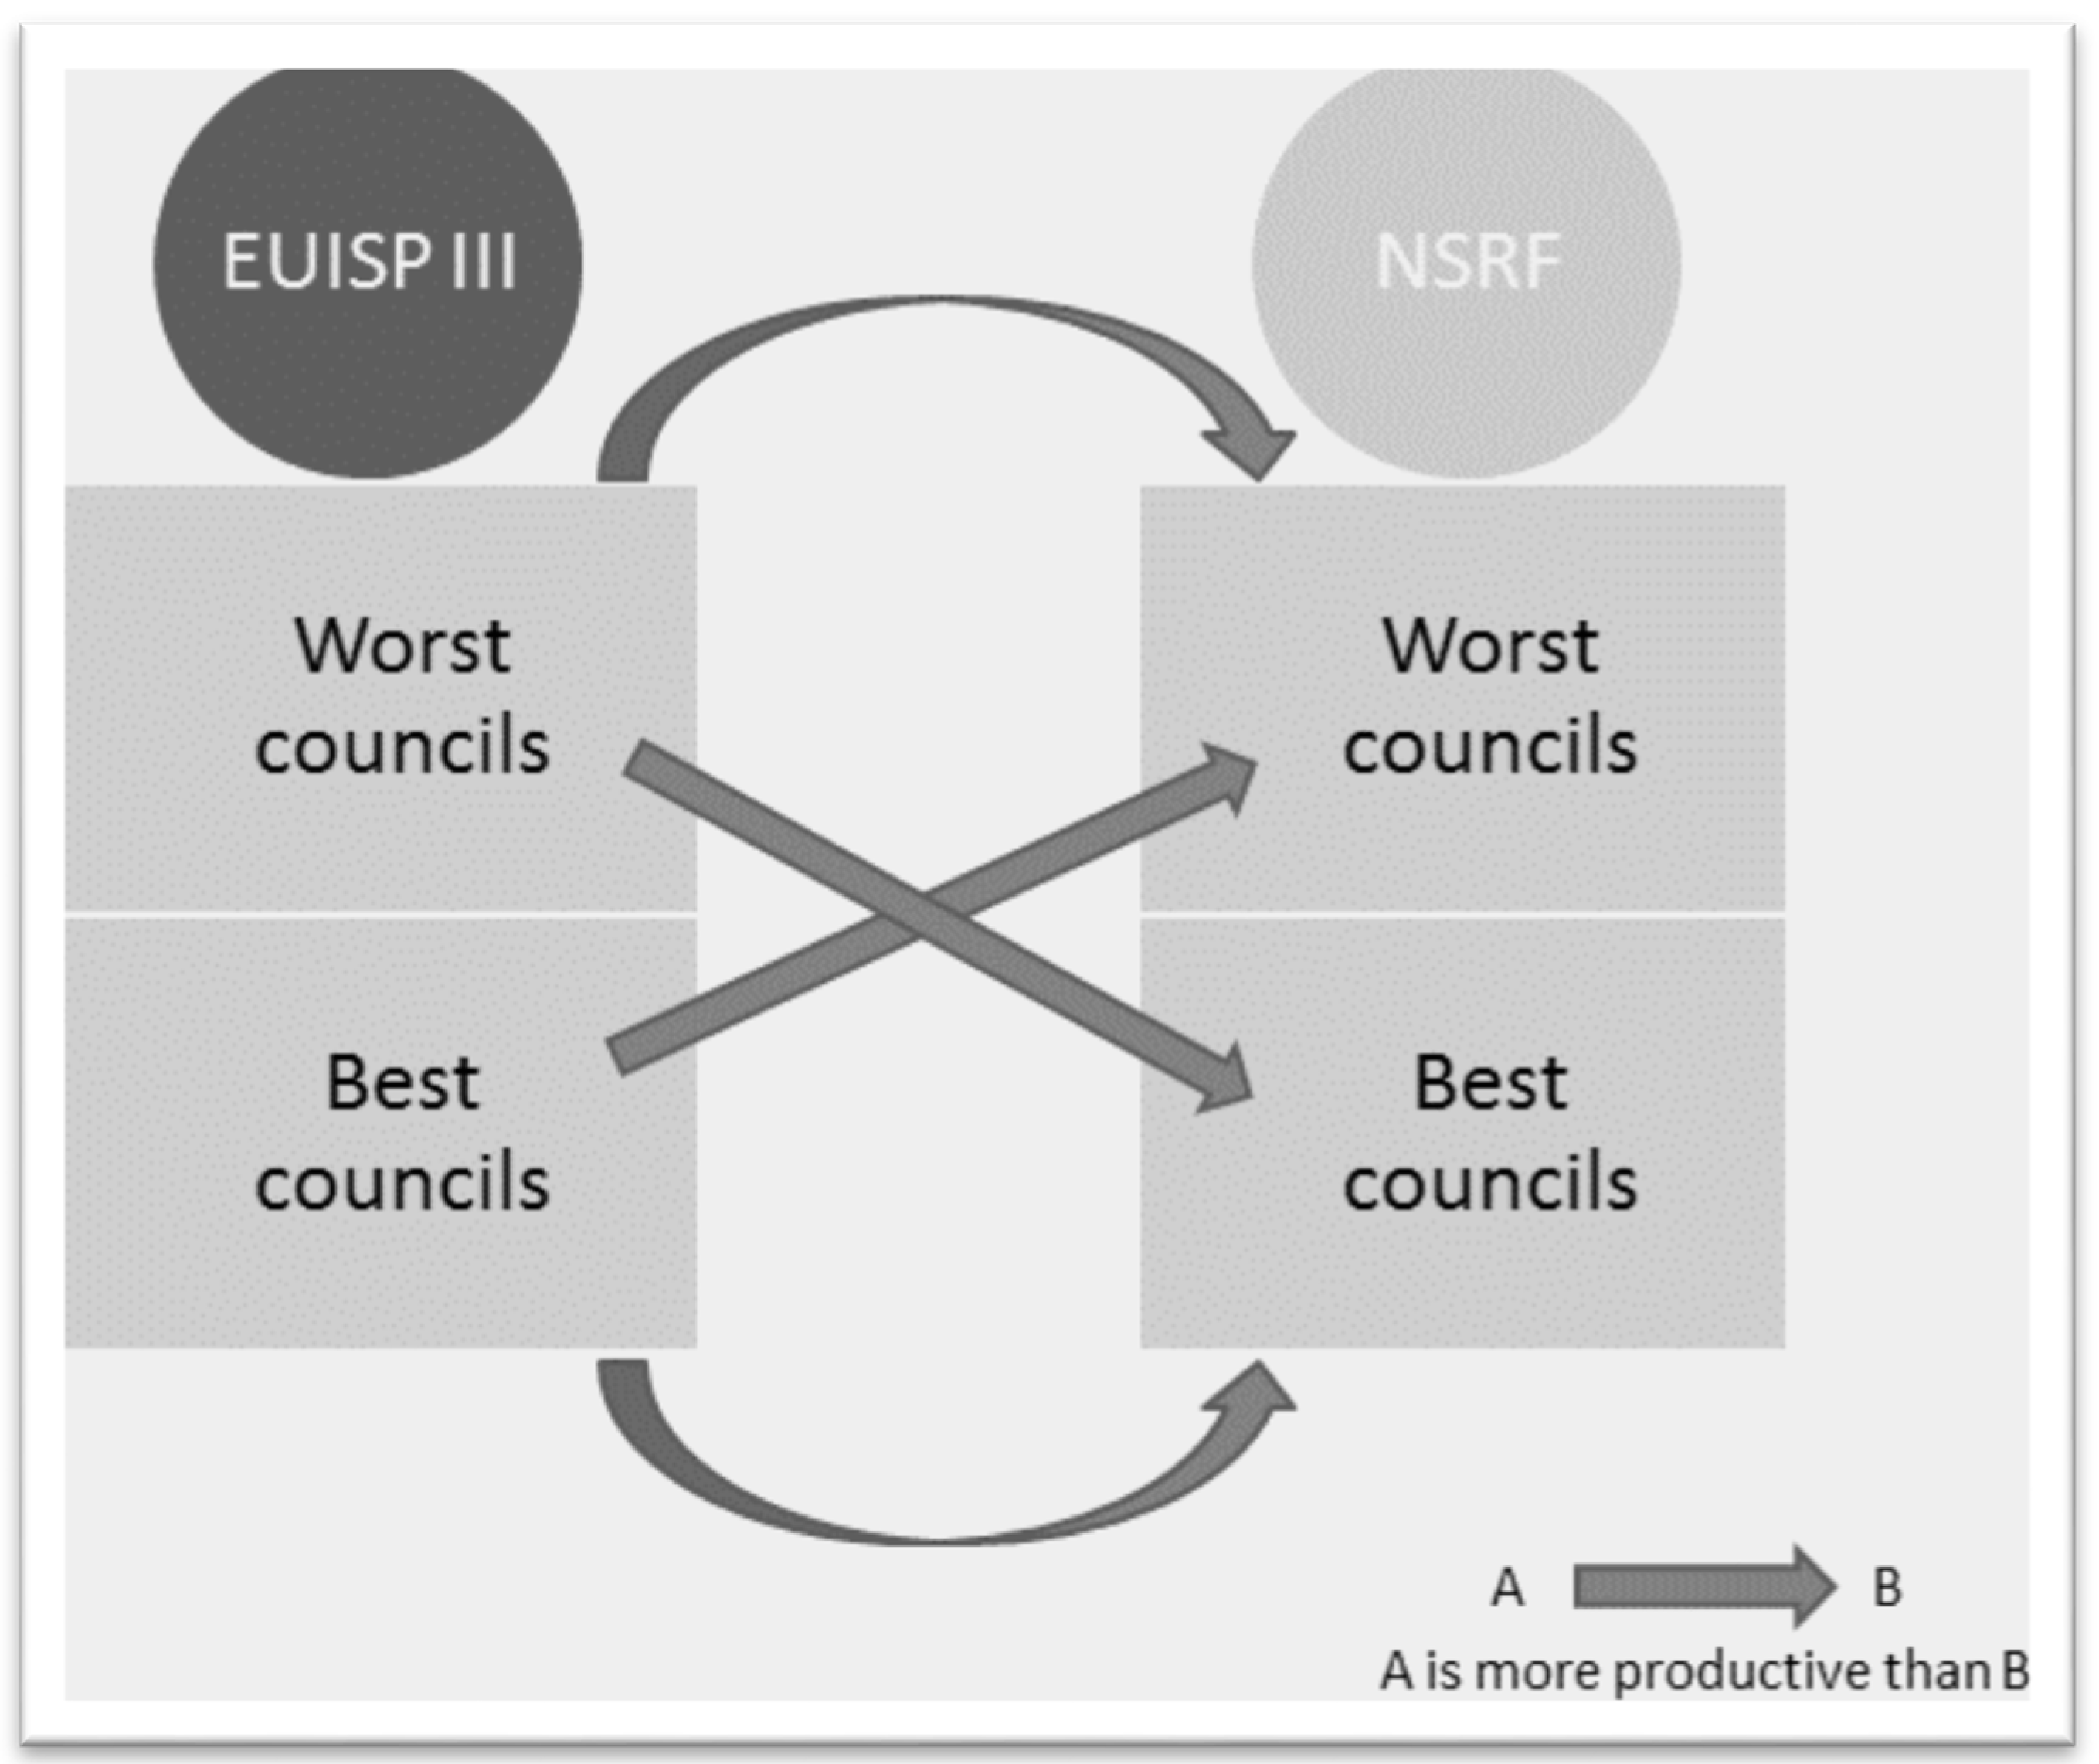
- A—Non-sustainable councils, ESIF III
- B—Sustainable councils, ESIF III
- C—Non-sustainable councils, NSRF
- D—Sustainable councils, NSRF
- H1: Sustainable councils are more efficient than non-sustainable councils.
- H2: Sustainable councils are more productive than non-sustainable councils.
- H3: Worst/best performers in NSRF are more efficient than the worst/best ones under ESIF III.
- H4: Worst/best performers in NSRF are more productive than the worst/best ones under ESIF III.
- H5: Worst/best performers in NSRF are more efficient than the best/worst ones under ESIF III.
- H6: Worst/best performers in NSRF are more productive than the best/worst ones under ESIF III.
4.3. Results
5. Concluding Remarks
Acknowledgments
Author Contributions
Conflicts of Interest
Appendix A

| Previous Regulation 1986–1988 (Exclusive Funding of Public Infrastructures) | European Structural and Investment Funds I (1989–1993) | European Structural and Investment Funds II (1994–1999) | European Structural and Investment Funds III (2000–2006) | National Strategic Reference Program—NSRF (2007–2013) | |
|---|---|---|---|---|---|
| Total Investment | 1185 million euros | 4600 million euros | 14,589 million euros | 20,528 million euros | 21,500 million euros |
| Programs—Strategic Axes and Projects | Four Specific Programs—National Program of community interest of incentives to productive activity; specific program for telecommunications (STAR) and energy (VALOREN); integrated operation of the northern development Alentejo Region. | Several territorial and sectorial specific projects. | Axes of intervention: qualify human resources and employment; strengthen the factors of competitiveness of the economy; promote the quality of life and social cohesion; and strengthen the regional economic base. There was also a diversity of programs by sector and region assigned operational interventions. | Four strategic Axes: raise the level of qualification of the Portuguese, promote the employment and social cohesion (about 24% of the public expenditure); change the profile productive towards the activities of the future (20% of public expenditure); affirm the value of the territory and of the geo position of the economic country (10% of the public expenditure); and promote the sustainable development of the regions and the national cohesion (46% of public expenditure). | Three Thematic Programs—operational program of territorial development OPTD; operational program of human potential OPHP; and the program CFOP—competitiveness factors operational Program. Seven Regional Programs, corresponding to each of the regions as part of the mainland and Regions. |
| Major Contributions | Innovative principles of the 1988 Reform: concentration (in a limited number objectives and application to regions whose development is lagging behind), the additionality (community expenditure complemented by national expenditure), the partnership (involvement of all levels of national and community administration and social partners in the preparation and implementation of programs) and programming (refusal of financing of individual projects and their pluri-annual programs and pluri-sectorial framework and, preferably, interregional). The word evaluation appears for the first time. | Notwithstanding the efforts, it was not possible to efficiently mobilize and achieve the corporate sector, in terms of its management and competitiveness. | It fulfilled the objectives of output growth, the employment, real convergence with the other countries of the community, and of convergence between internal regions. High performance and adaptation of the programs to the operating context and social evolution—the increasing economic effectiveness of the structural funds. | Based on the National Plan for Economic and Social Development, the Program outlined the purlins of the medium- and long-term development of Portugal: Atlantic economy border of Europe; privilege of activities, competitiveness factors and technologies more structural dynamic of the global economy; a National Strategy for nature conservation and biodiversity, protection and enhancement of the natural heritage, and enhancement of solidarity and cohesion as regards the social development model. | It surpassed the multiplicity of existing sectorial programs in the EU Investment and Funds Program III and the fact that management should be made through the centralized level of Operational Programs instead of being made, as in the past, at the project level. |
| Sustainable Councils—Best 10% Performers | ||||||||||||
|---|---|---|---|---|---|---|---|---|---|---|---|---|
| Regions | Size | Councils | Global Ranking | Council Position | Governance Ranking | Council Position | Government Effectiveness Ranking | Council Position | Economic and Social Development Ranking | Council Position | Financial Sustainability Ranking | Council Position |
| Lisbon | L | Lisboa | 235.86 | 1 | 5.41 | 173 | 29.54 | 93 | 179.50 | 1 | 21.41 | 241 |
| Lisbon | L | Oeiras | 221.98 | 2 | 6.06 | 146 | 42.80 | 47 | 134.34 | 2 | 38.78 | 117 |
| Algarve | M | Loulé | 177.85 | 3 | 6.61 | 126 | 56.64 | 25 | 20.00 | 62 | 94.60 | 8 |
| North | M | São João da Madeira | 171.22 | 4 | 0.64 | 301 | 56.16 | 26 | 69.77 | 4 | 44.64 | 82 |
| Azores | S | Corvo | 166.12 | 5 | 1.30 | 293 | 21.96 | 134 | −8.00 | 244 | 150.85 | 1 |
| Central | M | Entroncamento | 162.71 | 6 | 6.47 | 134 | 97.23 | 2 | 24.22 | 39 | 34.80 | 148 |
| Central | M | Águeda | 160.14 | 7 | 8.69 | 56 | 86.24 | 5 | 26.82 | 31 | 38.38 | 119 |
| Central | S | Constância | 158.64 | 8 | 8.36 | 73 | 85.46 | 7 | 23.85 | 40 | 40.96 | 98 |
| Alentejo | S | Sines | 150.09 | 9 | 6.34 | 139 | 32.75 | 82 | 65.93 | 5 | 45.07 | 76 |
| Central | S | Figueira de Castelo Rodrigo | 145.27 | 10 | 6.57 | 130 | 9.12 | 212 | −0.70 | 196 | 130.28 | 2 |
| Lisbon | L | Vila Franca de Xira | 141.74 | 11 | 2.82 | 260 | 85.85 | 6 | 25.58 | 34 | 27.49 | 199 |
| North | L | Maia | 140.45 | 12 | 4.70 | 206 | 70.91 | 14 | 36.85 | 14 | 27.98 | 192 |
| North | M | Vale de Cambra | 140.26 | 13 | 8.24 | 75 | 52.86 | 29 | 27.78 | 28 | 51.38 | 53 |
| North | M | Bragança | 139.39 | 14 | 2.36 | 275 | 91.58 | 4 | 12.30 | 98 | 33.14 | 154 |
| Azores | S | Lajes das Flores | 138.27 | 15 | 10.82 | 19 | 17.85 | 166 | −9.20 | 249 | 118.80 | 4 |
| Central | M | Torres Vedras | 138.23 | 16 | 6.38 | 136 | 95.80 | 3 | 22.72 | 45 | 13.33 | 278 |
| North | L | Porto | 136.44 | 17 | 5.88 | 156 | 39.80 | 54 | 58.68 | 6 | 32.09 | 162 |
| Alentejo | S | Vendas Novas | 133.99 | 18 | 3.86 | 236 | 99.67 | 1 | 17.42 | 70 | 13.04 | 280 |
| Central | M | Pombal | 132.74 | 19 | 8.60 | 61 | 39.20 | 56 | 18.15 | 66 | 66.80 | 23 |
| Alentejo | S | Ourique | 129.98 | 20 | 8.98 | 46 | 26.14 | 108 | −4.42 | 222 | 99.27 | 6 |
| North | S | Valença | 127.61 | 21 | 7.81 | 84 | 80.92 | 9 | 8.58 | 120 | 30.30 | 175 |
| Central | S | Oliveira de Frades | 127.30 | 22 | 7.49 | 88 | 19.60 | 152 | 35.68 | 18 | 64.53 | 29 |
| Alentejo | S | Grândola | 127.29 | 23 | 6.21 | 141 | 75.61 | 11 | 14.41 | 81 | 31.06 | 172 |
| North | S | Melgaço | 127.22 | 24 | 5.61 | 166 | 47.43 | 36 | 17.10 | 72 | 57.08 | 40 |
| Algarve | M | Albufeira | 125.33 | 25 | 1.69 | 288 | 38.87 | 58 | 7.06 | 126 | 77.71 | 11 |
| Central | S | Vila Velha de Ródão | 124.03 | 26 | 8.91 | 50 | 36.74 | 67 | 34.89 | 19 | 43.48 | 89 |
| Central | L | Leiria | 123.82 | 27 | 8.91 | 49 | 38.97 | 57 | 34.26 | 21 | 41.67 | 94 |
| Central | M | Viseu | 122.53 | 28 | 8.06 | 79 | 71.46 | 13 | 15.85 | 75 | 27.16 | 201 |
| Central | S | Vouzela | 121.62 | 29 | 8.64 | 58 | 50.74 | 32 | 0.84 | 175 | 61.39 | 34 |
| Alentejo | M | Azambuja | 118.55 | 30 | 6.91 | 109 | 46.76 | 37 | 35.78 | 16 | 29.10 | 185 |
| Central | M | Aveiro | 117.65 | 31 | 5.02 | 193 | 74.93 | 12 | 40.99 | 9 | −3.29 | 293 |
| Non-Sustainable Councils—Worst 10% Performers | ||||||||||||
|---|---|---|---|---|---|---|---|---|---|---|---|---|
| Regions | Size | Councils | Global Ranking | Council Position | Governance Ranking | Council Position | Government Effectiveness Ranking | Council Position | Economic and Social Development Ranking | Council Position | Financial Sustainability Ranking | Council Position |
| Algarve | S | Vila Real de Santo António | −898.68 | 308 | 6.36 | 138 | 45.41 | 41 | 4.00 | 155 | −954.45 | 308 |
| North | S | Alijó | −289.57 | 307 | 4.05 | 227 | −42.28 | 297 | −6.76 | 238 | −244.59 | 307 |
| Alentejo | S | Mourão | −131.47 | 306 | 5.10 | 190 | −61.12 | 304 | −39.06 | 305 | −36.40 | 298 |
| Central | S | Góis | −103.42 | 305 | 6.66 | 125 | −147.61 | 308 | −2.94 | 215 | 40.47 | 104 |
| North | S | Freixo de Espada à Cinta | −76.70 | 304 | 5.78 | 160 | −5.16 | 264 | −20.70 | 290 | −56.62 | 301 |
| North | S | Santa Marta de Penaguião | −76.38 | 303 | 10.02 | 27 | −100.17 | 305 | −27.52 | 299 | 41.29 | 95 |
| Central | S | Ferreira do Zêzere | −75.78 | 302 | 8.68 | 57 | −134.41 | 307 | 11.11 | 106 | 38.84 | 116 |
| Madeira | M | Santa Cruz | −66.80 | 301 | 6.79 | 118 | 29.69 | 92 | −0.09 | 188 | −103.18 | 306 |
| North | M | Chaves | −44.63 | 300 | 5.43 | 172 | 33.48 | 79 | −2.58 | 213 | −80.97 | 304 |
| Central | S | Celorico da Beira | −43.30 | 299 | 3.81 | 240 | −112.24 | 306 | −1.86 | 204 | 66.99 | 22 |
| North | S | Alfândega da Fé | −40.46 | 298 | 15.41 | 1 | 11.03 | 203 | −26.55 | 295 | −40.35 | 299 |
| Alentejo | S | Gavião | −27.92 | 297 | 4.88 | 197 | −59.80 | 302 | −15.42 | 278 | 42.42 | 92 |
| Azores | S | Nordeste | −27.29 | 296 | 9.47 | 38 | 6.06 | 226 | −7.99 | 243 | −34.84 | 296 |
| Central | S | Idanha-a-Nova | −26.72 | 295 | 4.55 | 210 | −36.58 | 294 | −17.30 | 283 | 22.62 | 234 |
| Lisbon | L | Seixal | −24.90 | 294 | 1.15 | 297 | 17.49 | 169 | 13.17 | 90 | −56.71 | 302 |
| Central | S | Cadaval | −24.87 | 293 | 1.58 | 290 | −51.80 | 301 | 9.07 | 119 | 16.28 | 265 |
| Madeira | S | Santana | −19.69 | 292 | 3.82 | 238 | −60.78 | 303 | −14.01 | 271 | 51.28 | 55 |
| North | S | Vinhais | −19.02 | 291 | 8.69 | 55 | −33.34 | 292 | −24.16 | 294 | 29.79 | 179 |
| Madeira | S | Ponta do Sol | −16.50 | 290 | 0.68 | 300 | −40.37 | 296 | −13.30 | 268 | 36.48 | 132 |
| Central | S | Pedrógão Grande | −13.57 | 289 | 4.83 | 203 | −47.10 | 299 | −6.64 | 234 | 35.33 | 141 |
| Algarve | S | Alcoutim | −13.13 | 288 | 8.54 | 65 | −16.07 | 280 | −6.79 | 239 | 1.18 | 292 |
| North | M | Vizela | −12.61 | 287 | 11.07 | 16 | 39.92 | 53 | 10.60 | 110 | −74.19 | 303 |
| Central | S | Santa Comba Dão | −12.31 | 286 | 4.34 | 218 | 17.77 | 167 | 1.83 | 167 | −36.25 | 297 |
| North | S | Terras de Bouro | −10.51 | 285 | 3.99 | 230 | −17.47 | 281 | −28.48 | 300 | 31.45 | 170 |
| North | S | Baião | −6.88 | 284 | 11.48 | 13 | −3.86 | 261 | −40.57 | 306 | 26.07 | 214 |
| North | S | Cinfães | −5.73 | 283 | 5.52 | 170 | 6.69 | 222 | −44.10 | 307 | 26.16 | 213 |
| Central | S | Vila Nova de Poiares | −3.35 | 282 | 9.76 | 31 | −14.32 | 279 | 7.02 | 128 | −5.80 | 294 |
| Algarve | M | Faro | −3.01 | 281 | 1.79 | 285 | 57.72 | 24 | 35.74 | 17 | −98.26 | 305 |
| Alentejo | S | Alandroal | −2.66 | 280 | 9.71 | 34 | −11.48 | 275 | −17.94 | 284 | 17.05 | 263 |
| Central | S | Mação | 1.51 | 279 | 9.22 | 42 | −32.86 | 291 | 0.72 | 176 | 24.44 | 221 |
| Alentejo | S | Viana do Alentejo | 5.07 | 278 | 7.56 | 87 | −25.33 | 285 | 1.98 | 165 | 20.86 | 246 |
References
- United Cities and Local Governments. Local Government Finance: The Challenges of the 21st Century; Second Global Report on Decentralization and Local Democracy; United Cities and Local Governments: Barcelona, Spain, 2010. Available online: https://www.citiesalliance.org/sites/citiesalliance.org/files/CA_Images/UCLG_GOLDII_ExecutiveSummary.pdf (accessed on 28 December 2018).
- Devas, N.; Delay, S. Local democracy and the challenges of decentralising the state: An international perspective. Local Gov. Stud. 2006, 32, 677–2007. [Google Scholar] [CrossRef]
- Cruz, N.; Marques, R. Scorecards for sustainable local governments. Cities 2014, 39, 165–170. [Google Scholar] [CrossRef]
- Portugal. Documento Verde da Reforma da Administração Local: Uma Reforma de Gestão, uma Reforma de Território e uma Reforma Política (in Portuguese); Minister of Parliamentary Affairs: Lisbon, Portugal, 2011.
- NADC. European Union Funds; Annual Report 2014; National Agency for Development and Cohesion: Lisbon, Portugal, 2016. [Google Scholar]
- Monfort, M.; Cuestas, J.C.; Ordonez, J. Real convergence in Europe: A cluster analysis. Econ. Model. 2013, 33, 689–694. [Google Scholar] [CrossRef]
- Moro, B. Lessons from the European economic and financial great crisis: A survey. Eur. J. Political Econ. 2014, 34, S9–S24. [Google Scholar] [CrossRef]
- Borsi, M.T.; Metiu, N. The evolution of economic convergence in the European Union. Empir. Econ. 2015, 48, 657–681. [Google Scholar] [CrossRef]
- Scipioni, A.; Mazzi, A.; Zuliani, F.; Mason, M. The ISO 14031 standard to guide the urban sustainability measurement process: An Italian experience. J. Clean. Prod. 2008, 16, 1247–1257. [Google Scholar] [CrossRef]
- Bachtler, J.; Wren, C. Evaluation of European Union cohesion policy: Research questions and policy challenges. Reg. Stud. 2006, 40, 143–153. [Google Scholar] [CrossRef]
- Sala-i-Martin, X.X. Regional cohesion: Evidence and theories of regional growth and convergence. Eur. Econ. Rev. 1996, 40, 1325–1352. [Google Scholar] [CrossRef]
- Delhey, J. The prospects of catching up for new EU members lessons for the accession countries to the European Union from previous enlargements. Soc. Ind. Res. 2001, 56, 205–231. [Google Scholar] [CrossRef]
- Boldrin, M.; Canova, F.; Pischke, J.S.; Puga, D. Inequality and convergence in Europe’s regions: Reconsidering European regional policies. Econ. Policy 2001, 16, 205 and 207–253. [Google Scholar] [CrossRef]
- Atkinson, T.; Cantillon, B.; Marlier, E.; Nolan, B. Social Indicators: The EU and Social Inclusion; Oxford University Press: Oxford, UK, 2002. [Google Scholar]
- Ederveen, S.; de Groot, H.L.F.; Nahuis, R. Fertile Soil for the Structural Funds? A Panel Data Analysis of the Conditional Effectiveness of European Cohesion Policy; CPB Netherlands Bureau for Economic Policy Analysis: The Hague, The Netherlands, 2002. [Google Scholar]
- Cappelen, A.; Castellacci, F.; Fagerberg, J.; Verspagen, B. The impact of EU regional support on growth and convergence in the European Union. JCMS 2003, 41, 621–644. [Google Scholar] [CrossRef]
- Beugelsdijk, M.; Eijffinger, S.C. The effectiveness of structural policy in the European Union: An empirical analysis for the EU-15 in 1995–2001. JCMS 2005, 43, 37–51. [Google Scholar] [CrossRef]
- Dall’Erba, S.; Le Gallo, J. Regional convergence and the impact of European structural funds over 1989–1999: A spatial econometric analysis. Pap. Reg. Sci. 2008, 87, 219–244. [Google Scholar] [CrossRef]
- Fritsche, U.; Kuzin, V. Analysing convergence in Europe using the non-linear single factor model. Empir. Econ. 2011, 41, 343–369. [Google Scholar] [CrossRef]
- Bartkowska, M.; Riedl, A. Regional convergence clubs in Europe: Identification and conditioning factors. Econ. Model. 2012, 29, 22–31. [Google Scholar] [CrossRef]
- Christoph, B.; Noll, H.H. Subjective well-being in the European Union during the 90s. In European Welfare Production; Springer: Dordrecht, The Netherlands, 2003; pp. 197–222. [Google Scholar]
- Diener, E.; Suh, E. Measuring quality of life: Economic, social, and subjective indicators. Soc. Ind. Res. 1997, 40, 189–216. [Google Scholar] [CrossRef]
- Caldas, P.; Dollery, B.; Marques, R.C. What really matters concerning local government evaluation: Community Sustainability? Lex Localis J. Local Self-Gov. 2016, 14, 279–304. [Google Scholar] [CrossRef]
- Bartelmus, P. Use and usefulness of sustainability economics. Ecol. Econ. 2010, 69, 2053–2055. [Google Scholar] [CrossRef]
- IUCN, U. World Conservation Strategy: Living Resource Conservation for Sustainable Development; International Union for the Conservation of Nature and Natural Resources (IUCN): Gland, Switzerland, 1980. [Google Scholar]
- Brundtland, G.H. World commission on environment and development. Environ. Policy Law 1985, 14, 26–30. [Google Scholar]
- Dollery, B.E.; Kortt, M.; Grant, B. Funding the Future, Financial Sustainability and Infrastructure Finance in Australian Local Government; The Federation Press: Sydney, Australia, 2013. [Google Scholar]
- Pires, S.M.; Fidélis, T. Local sustainability indicators in Portugal: Assessing implementation and use in governance contexts. J. Clean. Prod. 2015, 86, 289–300. [Google Scholar] [CrossRef]
- Vetter, A.; Kersting, N. Democracy versus efficiency? Comparing local government reforms across Europe. In Reforming Local Government in Europe; VS Verlag für Sozialwissenschaften: Wiesbaden, Germany, 2003; pp. 11–28. [Google Scholar]
- Aulich, C. Australia: Still a tale of Cinderella? In Comparing Local Governance: Trends and Developments; Palgrave Macmillan: Basingstoke, UK, 2005; pp. 193–210. [Google Scholar]
- Dollery, B.E.; Garcea, J.; Lesage, E. Local Government Reform: A Comparative Analysis of Advanced Anglo-American Countries; Edward Elgar: Cheltenham, UK, 2008. [Google Scholar]
- Dollery, B.E.; Crase, L.; Grant, B. The local capacity, local community and local governance dimensions of sustainability in Australian local government. Commonw. J. Local Gov. 2011. [Google Scholar] [CrossRef]
- Bell, S.; Morse, S. Measuring Sustainability: Learning from Doing; Routledge: London, UK, 2013. [Google Scholar]
- Warburton, D. Community and Sustainable Development: Participation in the Future; Routledge: London, UK, 2013. [Google Scholar]
- Wates, N. The Community Planning Handbook: How People Can Shape Their Cities, Towns & Villages in Any Part of the World; Routledge: London, UK, 2014. [Google Scholar]
- Ammons, D. Municipal Benchmarks: Assessing Local Performance and Establishing Community Standards; M.E. Sharpe: Armonk, NY, USA, 2012. [Google Scholar]
- Andrews, M.; Hay, R.; Myers, J. Can governance indicators make sense? Towards a new approach to sector-specific measures of governance. Oxf. Dev. Stud. 2010, 38, 391–410. [Google Scholar] [CrossRef]
- Ferreira, D.C.; Marques, R.C. Malmquist and Hicks–Moorsteen Productivity Indexes for Clusters Performance Evaluation. Int. J. Inf. Technol. Decis. Mak. 2016, 15, 1015–1053. [Google Scholar] [CrossRef]
- Charnes, A.; Cooper, W.W.; Lewin, A.Y.; Morey, R.C.; Rousseau, J. Sensitivity and stability analysis in DEA. Ann. Oper. Res. 1985, 2, 139–150. [Google Scholar] [CrossRef]
- Aragon, Y.; Daouia, A.; Thomas-Agnan, C. Nonparametric frontier estimation: A Conditional quantile-based approach. Econ. Theory 2005, 21, 358–389. [Google Scholar] [CrossRef]
- Ferreira, D.C.; Marques, R.C. Did the corporatization of Portuguese hospitals significantly change their productivity? Eur. J. Health Econ. 2015, 16, 289–303. [Google Scholar] [CrossRef] [PubMed]
- Daraio, C.; Simar, L. Directional distances and their robust versions: Computational and testing issues. Eur. J. Oper. Res. 2014, 237, 358–369. [Google Scholar] [CrossRef]
- Portela, M.C.A.S.; Thanassoulis, E. Malmquist indexes using a Geometric Distance Function (GDF). Application to a sample of Portuguese bank branches. J. Prod. Anal. 2006, 25, 25–41. [Google Scholar] [CrossRef]
- Moorsteen, R.H. On measuring productive potential and relative efficiency. Q. J. Econ. 1961, 75, 451–467. [Google Scholar] [CrossRef]
- Minister of Parliamentary Affairs. Livro Branco do Sector Empresarial Local (in Portuguese); Minister of Parliamentary Affairs: Lisbon, Portugal, 2011.
- Pinto, F.; Da Cruz, N.; Marques, R.C. Contracting water services with public and private partners: A case study approach. J. Water Supply Res. Technol. AQUA 2015, 64, 194–210. [Google Scholar] [CrossRef]
- European Commission. A New Partnership for Cohesion: Convergence, Competitiveness, Cooperation; Third Report on Economic and Social Cohesion; Office for Official Publications of the European Communities: Luxembourg, 2004. [Google Scholar]
- Afonso, A.; Fernandes, S. Assessing and explaining the relative efficiency of local government. J. Socio-Econ. 2008, 37, 1946–1979. [Google Scholar] [CrossRef]
- Troschinetz, A.M.; Mihelcic, J.R. Sustainable recycling of municipal solid waste in developing countries. Waste Manag. 2009, 29, 915–923. [Google Scholar] [CrossRef] [PubMed]
- Caragliu, A.; Del Bo, C.; Nijkamp, P. Smart cities in Europe. J. Urban Technol. 2011, 18, 65–82. [Google Scholar] [CrossRef]
- Ache, P.; Andersen, H.T.; Maloutas, T.; Raco, M.; Tasan-Kok, T. Cities between Competitiveness and Cohesion: Discourses, Realities and Implementation; Springer: New York, NY, USA, 2008. [Google Scholar]
- Sapelli, C.; Vial, B. The performance of private and public schools in the Chilean voucher system. Cuad. Econ. 2002, 39, 423–454. [Google Scholar] [CrossRef]
- Zeller, M.; Sharma, M.; Henry, C.; Lapenu, C. An operational method for assessing the poverty outreach performance of development policies and projects: Results of case studies in Africa, Asia, and Latin America. World Dev. 2006, 34, 446–464. [Google Scholar] [CrossRef]
- Nyhan, R.C.; Martin, L.L. Assessing the performance of municipal police services using data envelopment analysis: An exploratory study. State Local Gov. Rev. 1999, 31, 18–30. [Google Scholar] [CrossRef]
- Benito, B.; Bastida, F. The determinants of the municipal debt policy in Spain. J. Public Budg. Account. Financ. Manag. 2004, 16, 492–525. [Google Scholar] [CrossRef]
- Buettner, T.; Wildasin, D.E. The dynamics of municipal fiscal adjustment. J. Public Econ. 2006, 90, 1115–1132. [Google Scholar] [CrossRef]


| Authors | Main Findings |
|---|---|
| Sala-i-Martin [11] | USA, Japan, and European Countries tend to converge at a rate of approximately 2% per year. Interregional distribution of income in all countries has shrunk over time. |
| Delhey [12] | “Catch-up” process is facilitated by EU integration policies not guaranteed. |
| Boldrin et al. [13] | Stability and inequality of EU regional distribution of income per capita. EU regional funds impact is positive on GDP per capita growth of poorer countries. |
| Atkinson et al. [14] | Proposal of alternatives to the EU indicators for social inclusion (distribution of income, social transfers, regional disparities, persistence of poverty, unemployment, and educational rate), such as housing, health, access to essential services, and social participation. |
| Ederveen et al. [15] | Structural funds are globally (13 regions of Europe) ineffective. Structural funds are only effective for countries with a proper “institutional framework”, based on transparency, control of corruption, good governance, and institutional quality. |
| Cappelen et al. [16] | EU regional policy is effective and positively related to accompanying policies that improve the competence of the receiving environments. |
| Beugelsdijk and Eiffnger [17] | Structural funds have a positive impact based on institutional capacity. Moral hazard and substitution effects may result from use of structural funds. Structural funds contribute to fewer interregional disparities. |
| Dall’erba and Le Gallo [18] | Convergence takes place, but the funds have no impact on it. Investments targeted to peripheral zones never spill over to neighbors. |
| Fritsche and Kuzin [19] | Regional clusters exist in the consumer price level. Existence of convergence clubs, including a fast-growing countries club, without strong regional linkages. |
| Bartkowska and Riedl [20] | Existence of convergence clubs, indicating that European regions form six separate groups converging to their own steady state paths. The level of initial conditions such as human capital and per capita income plays a crucial role in determining the formation of convergence clubs among European regions. |
| Borsi and Metiu [8] | Economic “catch-up” exists based on institutional changes and macro-economic adjustment processes. No overall real income per capita growth; the existence of sub-groups that converge to different steady states. Regional linkages play an important role in determining the formation of convergence clubs. A clear separation between the new and the old EU member states in the long run. |
| Author | Date | Concepts and Definitions |
|---|---|---|
| Vetter and Kersting [29] | 2003 | Economic and political attributes must be considered. |
| Aulich [30] | 2005 | Local government dual role (democratic organization and service provider); the importance of efficient service provision together with effective local democracy. |
| Dollery, Garcea and Lesage [31] | 2008 | Five main pillars of local government sustainability: demographic factors, council revenue, council expenditure, council financial management, and council governance. |
| Dollery, Crase and Grant [32] | 2011 | The importance of local democracy (good governance), local social capital (citizens “sense of community” and “sense of place”), and local government capacity (well-functioning elected leadership and administrative and technical expertise). |
| Bell and Morse [33] | 2013 | Measuring sustainability at local and regional levels. New ways of thinking about sustainability indicators. |
| Warburton [34] | 2013 | Community participation and sustainable development. The connections between environmental action and community-based activities. |
| Wates [35] | 2014 | New methods of community planning. How communities become safer, stronger, wealthier, and more sustainable. |
| Expenditure by Function | ||
|---|---|---|
| Portugal (%) | EU Average (%) | |
| Economic activity | 22 | 12 |
| Education | 9 | 23 |
| Health | 4 | 11 |
| Social protection | 3 | 15 |
| General functions | 36 | 24 |
| Other | 26 | 15 |
| Variable | Description | Units |
|---|---|---|
| Input—Investment per inhabitant [47] | EU investments allocated and applied in each council divided by number of residents. | 1000 € |
| Input—Funds per inhabitant [47] | EU funds allocated and applied in each council divided by number of residents. | 1000 € |
| Output—Purchasing power per capita PPP [12,48,49,50] | This composite indicator is intended to translate the purchasing power in per capita terms. | It is an index number with the value 100 in the country average, which compares the purchasing power, in per capita terms, in different councils or regions. |
| Output—Companies gross value added per capita [18,19,20,51] | The company gross added value (GAV) is the wealth per resident generated in the production, discounting the value of goods and services consumed to achieve it, for example, the raw materials. The values are gross when the consumption of fixed capital is not assumed. | 1000 € |
| Output—(Education) high school conclusion rate [14,52,53] | Success rate meaning the number of students that concluded high school divided by the total number of students. | % |
| Output—(Health) doctors per 1000 inhabitants [14,54] | Number of doctors divided by a thousand residents. | No |
| Output—(Indebtedness) debt service ratio [55,56] | Sum of interest paid plus capital debt amortization divided by total expenses. | % |
| Index | <1 | =1 | >1 |
|---|---|---|---|
| Councils of cluster A have a higher average technical efficiency than councils of B | Councils of both clusters A and B have similar technical efficiency levels | Councils of cluster A have a lower average technical efficiency than councils of B. | |
| Benchmarks of cluster A consume fewer resources than benchmarks of B | The consumption profile of benchmarks of both clusters is similar | Benchmarks of cluster A consume more resources than benchmarks of B. | |
| Benchmarks of cluster A deliver more services than benchmarks of B | The production profile of benchmarks of both clusters is similar | Benchmarks of cluster A delivery less services than benchmarks of B. | |
| Overall, the productivity of A is higher than the productivity of B | Overall, the productivity levels of A and B are identical | Overall, the productivity of A is lower than the productivity of B. | |
| Councils of cluster A are closer to their optimal scale than councils of B | Councils of clusters A and B are “at the same distance” to their optimal scale | Councils of cluster B are closer to their optimal scale than councils of A. | |
| Overall, total factor productivity of A is higher than B | Overall, both clusters share identical total factor productivity levels | Overall, total factor productivity of B is higher than A |
| Index | Results | Comments | |
|---|---|---|---|
| A vs. B (Non- sustainable vs sustainable councils, ESIF III) | (efficiency spread) | 1.0327 * [1.0081; 1.2142]95% | The technical efficiency of sustainable councils (ESIF III) is higher than the efficiency of non-sustainable ones. This is because the former are closer to their efficient frontier than the latter. On average, the efficiency of sustainable councils is ~3% higher than that of non-sustainable municipalities. Such a gap can reach ~21%. Differences are statistically significant since the 95% confidence interval’s lower bound is larger than 1. |
| (resources productivity) | 1.0580 * [1.0368; 1.0504]95% | Sustainable and technically efficient councils (ESIF III) consume 4–5% less resources than benchmarks in the non-sustainable councils’ cluster, for equivalent levels of produced goods/services. Differences are statistically significant at the 95% confidence level. | |
| (outputs productivity) | 0.8200 ** [0.7846; 1.1298]95% | Non-sustainable and technically efficient councils (ESIF III) produce, on average, 18% more goods and/or services than the best practices in B. Nevertheless, differences are not meaningful from the statistical point of view. | |
| (technology gap) | 0.8199 ** [0.7813; 1.1013]95% | Both technologies are similar because {1} [0.7813; 1.1013]95%. That is, benchmarks from A and B produce similar amounts of outputs with equivalent levels of resources. This suggests that both groups of councils are equally productive. | |
| (returns to scale) | 1.6038 * [1.0910; 5.3457]95% | Sustainable councils (ESIF III) are closer to their MPSS than non-sustainable councils. Differences are significant at the 95% confidence level. | |
| (total factor productivity) | 0.9625 ** [0.8860; 3.7402]95% | Although on average the productivity (TFP) of A is about 4% higher than the one in B, there is no statistical evidence of a considerable productivity gap between these two technologies. That is, both sustainable and non-sustainable councils in the ESIF III program can reach equivalent productivity levels. | |
| C vs. D (Non- sustainable vs sustainable councils, NSRF) | (efficiency spread) | 1.0096 * [1.0032; 1.1567]95% | Sustainable councils (NSRF) are, in general, more efficient than non-sustainable units. Gaps in efficiency spread can hit 15%. Gaps are significant at the 95% level. |
| (resources productivity) | 0.9782 * [0.9038; 0.9792]95% | Keeping the outputs unchanged, the efficient technology of cluster C consumes 2–10% less resources than the one of cluster D. | |
| (outputs productivity) | 0.8446 ** [0.8452; 1.1199]95% | For equivalent resources consumption’s levels, benchmarks from cluster C can produce 15% more outputs than cluster D. Yet, differences are not statistically meaningful. | |
| (technology gap) | 0.8199 ** [0.8248; 1.0844]95% | No significant technological gap has been found between these two clusters, thus they are equally productive. | |
| (returns to scale) | 1.4561 ** [0.3040; 1.8396]95% | Sustainable and non-sustainable councils exhibit comparable scale efficiencies. That is, they are at the same distance (on average) to their own MPSS. | |
| (total factor productivity) | 0.9936 ** [0.2010; 4.3975]95% | No statistically significant differences between these two clusters were found in terms of productivity. The expected value of HMI is close to 1, a value belonging to the 95% confidence interval. |
| Index | A vs. C | A vs. D | B vs. C | B vs. D |
|---|---|---|---|---|
| 0.9765 [0.9491; 0.9932]95% | 0.9958 [0.9963; 1.1383]95% | 0.9534 [0.8082; 0.9852]95% | 0.9756 [0.9575; 0.9884]95% | |
| 0.9566 [0.7295; 0.9597]95% | 1.0453 [1.0049; 1.0428]95% | 1.0027 [0.9059; 1.0061]95% | 0.9405 [0.9351; 0.9606]95% | |
| 1.1350 [0.9466; 1.4419]95% | 0.6800 [0.6033; 0.9370]95% | 1.0924 [0.7021; 1.2173]95% | 0.9568 [0.9221; 1.1338]95% | |
| 1.0523 [0.9101; 1.2811]95% | 0.7454 [0.6555; 0.9746]95% | 1.1947 [0.7188; 1.0464]95% | 0.9654 [0.9282; 1.0582]95% | |
| 0.5698 [0.5248; 0.6637]95% | 0.8257 [0.2849; 4.0920]95% | 0.4465 [0.3645; 0.7393]95% | 0.6825 [0.2558; 0.7118]95% | |
| 0.5816 [0.5635; 0.6156]95% | 0.5199 [0.1348; 2.4906]95% | 0.5429 [0.0832; 0.8757]95% | 0.5802 [0.1922; 0.6482]95% |
© 2018 by the authors. Licensee MDPI, Basel, Switzerland. This article is an open access article distributed under the terms and conditions of the Creative Commons Attribution (CC BY) license (http://creativecommons.org/licenses/by/4.0/).
Share and Cite
Caldas, P.; Ferreira, D.C.; Dollery, B.; Marques, R.C. Municipal Sustainability Influence by European Union Investment Programs on the Portuguese Local Government. Sustainability 2018, 10, 910. https://doi.org/10.3390/su10040910
Caldas P, Ferreira DC, Dollery B, Marques RC. Municipal Sustainability Influence by European Union Investment Programs on the Portuguese Local Government. Sustainability. 2018; 10(4):910. https://doi.org/10.3390/su10040910
Chicago/Turabian StyleCaldas, Paulo, Diogo Cunha Ferreira, Brian Dollery, and Rui Cunha Marques. 2018. "Municipal Sustainability Influence by European Union Investment Programs on the Portuguese Local Government" Sustainability 10, no. 4: 910. https://doi.org/10.3390/su10040910
APA StyleCaldas, P., Ferreira, D. C., Dollery, B., & Marques, R. C. (2018). Municipal Sustainability Influence by European Union Investment Programs on the Portuguese Local Government. Sustainability, 10(4), 910. https://doi.org/10.3390/su10040910