Abstract
The stability of twenty-seven composts and organic substrates (including raw, less stable and stable materials) was assessed using two different liquid phase tests. One of the tests was introduced in 1998 and was based on the calculation of a Specific Oxygen Uptake Rate (SOUR). The newly introduced liquid phase test presented here is simpler to set-up and to perform than the older liquid phase test and is more representative of the composting process due to its longer experimental duration. It is based on the quantification of oxygen consumption in the headspace of a BOD bottle that contains the liquid-solid solution. The results indicate that a marginal correlation does exist between the main indices calculated from both tests. The correlation was slightly stronger for the indices calculated from the raw materials than from the processed ones. The correlation calculated from the processed substrates was statistically insignificant. The SOUR ranged from 1520 to 3650 mg O2/kg VS-h for the raw materials and from 110 to 1150 mg O2/kg VS-h for the processed materials, respectively. The corresponding stability rate related index (LSRI24) of the new liquid phase test introduced here ranged from 240 to 1180 mg O2/dry kg-h for the raw materials and from 64 to 792 mg O2/dry kg-h for the processed ones.
1. Introduction
According to the waste management hierarchy promoted by the European Union [1], landfilling of untreated wastes is the least preferable environmental option under the framework of sustainability. Existing legislation in European Union aims both to reduce the biodegradable wastes that are disposed of to landfills as well as to establish recycling systems, separate collection and mechanical and biological pre-treatment [1]. Composting is one of the classic biological treatment techniques applied worldwide to stabilize the biodegradable fraction of solid wastes. The composting end-product should be a stable and sanitized organic material, that contains carbon of low degradability, that could be applied to agricultural or arid land.
Stability can be defined as the extent to which readily biodegradable organic matter has decomposed [2]. This term is usually related to the resistance of organic matter against extensive degradation or against major microbiological activity [3]. The more stable an organic material is, the more resistant to microbial attack it is. Stability is typically assessed through respirometric techniques being a function of the microbial respiration activity. Microbial respiration activity is quantified either by monitoring the oxygen consumption or by measuring carbon dioxide production during a specific period of time. A wide research on respiration activity indices has been conducted over the years to quantify the extend of stability, and several analytical methods and indices have been proposed. Stability is differentiated from maturity, since the latter expresses the effect of compost to plant or seed growth. Both stability and maturity are important compost quality parameters and should be assessed and reported together for all composted substrates.
Several respiration indices and methods have been proposed for assessing and evaluating compost stability; most of them are classified as static or dynamic methods [4,5,6,7,8,9]. The above classification depends on whether there exists a continuous supply of air (dynamic) or not (static) into the experiment vessel. In dynamic respiration methods, oxygen uptake rate and carbon dioxide generation rates are determined by measuring the difference in O2 and CO2 contents of the air in the inlet and outlet reactor streams [4,5,10,11,12]. On the other hand, in static methods, sealed reactors of different size and volume are used and oxygen consumption is calculated through manometric principles [6,7,13], via the use of the ideal gas law or by simply placing oxygen sensors within the reactors [13,14,15].
An alternative categorization of stability methods is into solid phase and liquid phase ones, depending on the state of the substrate which is undergoing analysis. In solid phase methods, the substrate is placed as received into the reactor, without any previous pretreatment, but with an optimal moisture content to allow an active microbial degradation [5,8,12]. Sometimes, only small quantities of water or nutrients are added to the sample to optimize the degradation.
In liquid phase methods, solid substrates are being diluted into an aquatic solution (typically deionized laboratory grade water that contains nutrients) to form a “slurry”. Oxygen consumption is measured via dissolved oxygen probes [2]. Due to the state of the sample, liquid tests are considered as static-based methods, since air does not pass continuously through the reactor [9,16].
One of the pioneering liquid phase compost stability assessment techniques was proposed by Lasaridi and Stentiford [2]. They had proposed, then, a specific oxygen uptake rate (SOUR) to assess stability. The aforementioned test (herein referred to as the “SOUR test”) required a controlled temperature water bath, an air pump, a dissolved oxygen (DO) probe and a data logging system. The duration of the experiment was approximately 30 h (in some case up to 60 h), while two aeration sequences were used depending on the biodegradability of each sample. Oxygen content was measured directly in the aqueous phase via oxygen probes, like in the old-fashioned Biochemical Oxygen Demand (BOD5) tests applied to wastewater. Two respiration indices had been proposed by Lasaridi and Stentiford [2]; a maximum oxygen consumption rate (SOUR) and a cumulative oxygen demand for the first 20 h (OD20). Adani et al. [9] examined different organic substrates by adding a second cumulative index at 12 h (OD12) and by comparing SOUR, OD20 and OD12 with the corresponding indices derived from static and dynamic solid phase tests. According to Adani et al. [9] both static and dynamic solid phase indices correlated positively with the OD12, OD20 and SOUR. Scaglia et al. [17] validated the method by measuring (among others) SOUR, OD12 and OD20 for six different organic samples, in three different laboratories. As stated by Scaglia et al. [17], the cumulative indices OD12 and OD20 were better to characterize biological stability, as opposed to SOUR, which was a “rate” index. Moreover, Stentiford [18] considers that specific oxygen uptake rate (as a liquid phase-based index) is focusing not to reproduce the field conditions within a composting process but to evaluate what effect composting would have on a raw material, in a similar manner to the classic BOD5 test used in wastewater.
Composting is actually a solid-state process in which transfer phenomena and air limitations are dominant factors that can affect the whole process. In liquid phase methods, water limits oxygen diffusion and transfer, since O2 needs to first dissolve into the water and then to interact with the biomass attached onto the solid matrix. Thus, O2 transfer is limited by the water saturation concentration. On the other hand, the solid phase stability tests are considered to simulate more accurately field conditions compared to the liquid-phase ones [19], since an oxygen transfer limitation is not expected, because the solid matrix comes in direct contact with the oxygen in the air. Adani et al. [9] also identified a significant dependence of SOUR on the water-soluble organic fraction of the samples.
A drawback of the liquid phase methods is the low amount (typically 3 to 8 g) of sample required in the experiments [19]. To overcome this, several replications (ideally ≥ 3) should be performed in liquid phase stability assessment methods, usually more than the solid-phase ones. Despite the above, liquid phase stability assessment techniques are occasionally preferred by researchers due to the need for use of small amounts of sample.
The assay described by Lasaridi and Stentiford [2] required a DO probe, that is used less frequently nowadays to measure BOD5 in wastewater. This is because manometric based oxygen consumption tests have completely replaced the classic DO probe-based tests when measuring BOD5 in wastewater. Thus, there is a need for an easier and faster to use liquid phase test that uses the manometric principles that are also commonly employed in other stability tests (e.g., AT4). A manometric liquid phase method could be an alternative for use in real facilities since: (a) it requires standard equipment and apparatus that is common in a typical wastewater laboratory; (b) it is an easy and simple technique with a relatively low cost; (c) it is based on the standard method of biochemical oxygen demand (BOD) determination, as used in typical wastewater analysis; (d) it needs a shorter testing time (<3 d) compared to the typical solid phase dynamic tests (5–7 d); (e) it is a bench scale method. The oxygen transfer limitations of the liquid phase tests are compensated by the fact that those stability tests have a relative value, even though they do not simulate field conditions as accurately as the solid phase tests.
The objectives of this study were:
- (i)
- to develop a new, simple to use, liquid-phase respirometric method using manometric principles, and
- (ii)
- to compare the indices calculated by this new test with the indices calculated by an already published test (SOUR method) [2].
To achieve those objectives, we used 5 raw and 22 processed organic substrates of variable origin and biodegradability. The respiration activities of all substrates were calculated using with both tests.
2. Materials and Methods
2.1. Substrates
Twenty-seven (27) organic substrates from variable origin were used in this study so that to obtain a wide range of degradability and organic matter contents (see Table 1). The substrates included raw, short-term and long-term processed materials and were classified into two major categories here: “Raw” and “Processed” materials. However, since respiration activity is a common stability index to characterize processed and/or stable materials (i.e., composts), most of the selected substrates used in this work (i.e., 22) intentionally belonged to the “processed” category, while the raw materials were only five (5). For the processed materials, some type of direct (e.g., composting) or indirect treatment process (i.e., storage) had been applied.

Table 1.
Source materials and description of the organic substrates used.
The sampling procedure was performed using a sequential quartering process, and then a grab sample (2.5–3.0 wet kg) was obtained from the final quarter. Immediately after sampling, organic substrates were stored at −20 °C. One day before analysis, samples were thawed at room temperature.
2.1.1. Raw Substrates
Five (5) raw organic substrates were evaluated. These were simulated food wastes (R-FW1, R-FW2, R-FW3), a dewatered sludge sample obtained from a nearby wastewater treatment facility (R-DSL) and a material (leaves, branches) obtained from a forest floor (R-FOR).
R-FW1, R-FW2 and R-FW3 were artificially prepared raw food wastes, with differences in the proportions of each ingredient. Simulated food wastes were selected to achieve substrates with high level of degradability, and for reasons of better homogeneity. R-FW1 was prepared by mixing cooked pasta, white bread, chopped apples and grilled minced beef meat (25% each, on a wet weight basis, wb). R-FW2 was simulated by mixing cooked meat and white bread in 50–50% wb. R-FW3 was prepared by mixing 50% of uncooked pasta, 30% of uncooked frozen fries and 20% of beef-based dog food (wb). These three aforementioned substrates were sealed in a plastic bag after their preparation and remained in ambient temperature for a week to better simulate actual food wastes conditions.
R-DSL was a dewatered sludge derived from a nearby wastewater treatment plant (WWTP), where the thickened aerated sludge was dewatered via a filter-press. Sampling of the dewatered sludge was done as soon as the sludge was passed through the filter-press. R-FOR was a sample of leaves and small branches obtained from a forest floor during spring season, by collecting all the available material from a randomly selected 2 m2 surface.
2.1.2. Processed Substrates
Twenty-two (22) processed substrates were studied, some of which had already undergone some type of a treatment process, namely in a Mechanical Biological Treatment (MBT) plant for municipal solid waste, in small-scale treatment facilities, after home composting or commercial composts. The processed substrates also included four cow manure derived composts (P-MAN1, 2, 3, 4), four MSW derived composts (P-MSWC1, 2, P-OFMSW, P-MSWB), two vermicomposts (P-VERC1, 2), and a sea-weeds derived compost (P-SWC) which is marketed as a commercial product. Moreover, eleven home composts samples were also collected and studied (P-HC1 to P-HC11), with a minimum of 6 months processing.
P-MAN1 was a fresh -cow derived- manure, stored in a in static pile for one month, which was obtained from a cattle farm. P-MAN2 was a fresh animal manure, collected from a different cow breeding facility, that consisted of cow manure and straw. It was stored in an open pile for one week prior to sampling. P-MAN3 was also a mixture of cow manure and straw. It was obtained from the same facility, as previously mentioned P-MAN2, after passing through a solid–liquid separator and after stored in piles for 1 week. Above materials were considered processed since they had been stored for at least one week at the time of sampling.
P-MSWC1 was a compost derived from the undersized fraction of commingled MSW. It was obtained from a full scale MBT plant after 18 h pre-treatment, followed by a 6-week negative aeration composting phase in agitated channels and a 5–6 week curing stage in static windrows. P-MSWC2 was also a compost derived from undersized fraction of commingled MSW but from a different MBT plant. The processing line included in-vessel active composting with pre-selection units for 6 weeks followed by curing in open piles for at least 4 weeks. P-OFMSW was an end-product obtained from a full scale MBT facility which treated the organic fraction of commingled MSW after 28 days of active composting. P-MSWB was the undersized fraction (<50 mm) of commingled MSW that were wrapped in bales for 12 months in an interim storage facility.
P-VERC1 and P-VERC2 were vermicomposts derived from mixtures of dewatered wastewater sludge and straw after composting times for around 100 and 30 days, respectively. The samples were obtained from the same vermicomposting facility. P-SWC was a sea weeds derived compost, mainly consisting of sea weeds (80% wb), cow manure (20% wb) and other agricultural by-products. The composting process lasted approximately two months, including curing. It was sold as a commercial end-product compost that was purchased from a local agricultural store.
P-HC1 was a home compost produced by kitchen and garden waste mixed with wood combustion residues, such as coal and ash. The active composting phase was developed in a plastic home composter bin, while sampling was conducted after one year of composting and curing within the same bin. P-HC2 was a home compost mixture of kitchen waste (60% wb) and wood chips (40% wb), which was produced after 21 days of active in-vessel composting and 14 days of open aired curing. Substrates P-HC3 to P-HC11 were also home composts, with composting times that varied from 6 to up to 12 months. The initial mixture consisted of daily kitchen wastes (fruits and vegetables, eggshells, coffee grounds), garden wastes (yard trimmings and grass clippings), nut shells, wood chips, ash, sawdust and straw. The composting for substrates P-HC3 to P-HC11 was achieved in 275 L plastic composters, while moisture addition and manual mixing of the material were performed at least once a week.
All substrates are included in Table 1.
2.2. Initial Substrate Characterization
Initial characterization of the substrates included measurements of moisture, organic matter, pH and elemental analysis quantification. The moisture content was measured by drying the material at 75 °C until constant weight [20]. Organic matter (OM) or volatile solids (VS) content was measured in a muffle furnace, through the loss on ignition (LOI), at 550 °C after 2 h [20,21]. pH was measured in a 5:1 liquid:solid (L/S) ratio by adding deionized (DI) water to the initial wet samples [20]. For the calculation of the empirical formulas, elemental analysis was performed according to the procedure described in Komilis et al. [22]. Oxygen content was calculated indirectly after subtraction of the sum of the C, H, N contents from the organic matter content (db: dry weight basis).
2.3. Manometric Liquid Phase Test
In the newly introduced manometric liquid phase test used here, microbial respiration activity (MRA) was quantified by measuring pressure drops in the headspace of a sealed bottle for 7 d under controlled conditions. The 7-d period is considered more representative of the whole composting process as opposed to the 48 h period of the SOUR test described in 2.4. Thus, this is considered an advantage of this newly proposed manometric liquid test over the SOUR test. The WTW® apparatus that was used for the manometric measurements included: BOD glass-made bottles with total operating volume of 520 mL, manometric heads (OxiTop-C/B®), an infrared controller and a stirring plate.
The methodology adopted was based on the standardized method for determining BOD in wastewater liquid samples, which is described below: approximately 8 g of wet samples were diluted in 220 mL of deionized water, in each bottle. Four different nutrient solutions were added as follow: 15 mL of phosphate buffer (without NH4Cl), 5 mL of magnesium sulfate, 5 mL of calcium chloride and 5 mL of ferric chloride. Moreover, 0.5 mL of allylthiourea solution (5 g/L, ATU) were also added in the bottles as a nitrification inhibitor. Nutrient solutions were prepared according to APHA and AWWA [21]. In the nozzle of each bottle, a rubber stopper was filled with 8 to 10 pellets of potassium hydroxide (KOH) to sorb CO2. A magnetic stirrer bar was placed in the bottom of each bottle to agitate the slurry.
Respirometers were tightly closed with the manometric head and were placed in a pre-heated incubator at 35 °C for 7 days at the absence of light. Manometric heads recorded instantaneous pressure values every 28 min for 7 days. Four to eleven replications (usually 8) were performed per substrate simultaneously. Manual aerations were performed by removing the manometric heads daily and prior to reaching a 100 mbar internal pressure into the bottle.
Oxygen consumptions were calculated using the principles of the ideal gas law, via the pressure drops recorded and logged separately for each bottle, as described in Equation (1) [6]:
where: ΔO2,t: mass of oxygen consumed at time interval t per dry mass of the substrate (g/dry kg) or per initial volatile solids mass of the substrate (g/kg VS); ΔPt: pressure decrease over the time interval t (mbar); Vfree: free air volume in the respirometer (L); 32: molecular weight of oxygen (g/mole); R: universal gas constant (83.14 L mbar/°K-mole); T: incubation temperature (°K); Wsub: initial dry mass (kg) or initial volatile solids mass of the substrate (kg VS) placed in the respirometer.
The respiration activity indices that were calculated from the manometric liquid phase method, were calculated using a similar methodology to the calculation of the solid-phase static test indices [6,7,23]. That is, a liquid cumulative respiration index (LCRI) was calculated as the sum of all ΔO2 values found by Equation (1) after 7 days. LCRI7 was expressed in g O2/kg VS, which is the total amount of O2 consumed at 7 days. In addition, a liquid static respiration index (LSRI) was also calculated over the 24 h period of highest biological activity (LSRI24). LSRI24 was defined as the maximum average O2 consumption rate that would occur over a 24-h period, and was expressed in mg O2/kg VS-h.
The biodegradability of each substrate was also expressed using an ad-hoc Biodegradable Fraction (BF), calculated by Equation (2):
where: BF: biodegradable decimal fraction after 7 d (BF < 1); LCRI7: mass of oxygen consumed after 7 days per dry mass of the substrate (g O2/dry kg); ThOD: theoretical oxygen demand (g O2/dry kg), calculated based on the stoichiometric complete oxidation equation using the corresponding empirical formula for each substrate (see Table 2).
Table 2.
Initial properties of the 27 organic substrates used in the study.
The BF is not used here as an additional proposed stability index, but rather as an additional parameter to aid in interpreting the results of the manometric liquid phase test and to allow comparisons among substrates.
2.4. SOUR Liquid Phase Test
This liquid phase test had been initially proposed by Lasaridi and Stentiford [2], based on the typical BOD analysis used for wastewater samples. Approximately 8 g of the as received substrates were used as the initial wet mass. The same nutrient solutions (as stated in Section 2.3) were added to each flask to ensure that nutrients or pH were not limiting. The SOUR liquid test used here was set-up according to Lasaridi and Stentiford [2] with the following modifications: the flasks were placed in a temperature-controlled incubator at 35 °C for 2 days at the absence of light, instead of a water bath; the intermittent aeration cycle was 15 min aeration (pumps in operation) followed by 30 min of no aeration.
In this test, microbial respiration activity is quantified directly by measuring dissolved oxygen (DO) into the solution. The DO probes recorded dissolved oxygen concentration with an interval of 30 s, throughout the 48 h experimental period. Three to eight replicates per substrate were carried out. Two (2) indices were calculated after processing the DO concentrations obtained from the data logging procedure; the specific oxygen uptake rate (SOUR) expressed as mg O2/kg VS-h and the cumulative oxygen demand after 48 h (OD48) expressed in mg O2/kg VS.
The oxygen uptake rates (OUR) were calculated via the DO concentration drops in the slurry during the 30 min non-aeration period. This OUR value was calculated as an average of around 60 individual uptake rates, during every 30 min period of non-aeration. The specific oxygen uptake rate (SOUR) was calculated according to (3) [2,9]:
where: SOUR: specific oxygen uptake rate (mg O2/kg VS-h); |Smax|: the absolute maximum oxygen consumption slope (mg O2/L-h) during the 48 h duration of the experiment; V: volume of the suspension (L); m: wet mass of the substrate (kg); DM: decimal fraction of dry matter (wb); VS: decimal fraction of volatile solids (db).
The cumulative oxygen demand after 48 h (OD48) was calculated according to Lasaridi and Stentiford [2], as the area below the SOUR curve and 48 h period, using the following Equation (4):
where: OD48: cumulative oxygen demand after 48 h (g O2/kg VS); |S|t: rate of oxygen consumption at time t (mg O2/L-h); the other parameters were defined in Equation (3).
The 48-h experimental period of the typical SOUR test may not be representative of the whole composting process. This is a drawback of the SOUR test, since this 48-h period may only be a snapshot of the composting process and cannot be typical of the extent of degradation of the material. This is particularly true for slowly degradable substrates (e.g., green wastes) that can have a rather large lag time, exceeding the 48-h hour period, due to their high content of slowly degradable components.
Although the DO probe does measure the O2 concentration directly in the liquid phase, the equipment necessary to setup such a test, particularly when several replications are needed, is far more expensive than the cost of bottles with manometric heads including the interface and logging system. In addition, the manometric head bottles are widely available and commonly used in most environmental laboratories to perform typical BOD5 analyses for wastewater. Due to that lower cost, several replications can be performed per substrate. Finally, manometric head bottles are convenient to use, they are fully automated (e.g., allow immediate logging of the data, generate directly graphed results of the O2 consumption profile and they do not rely on electrical power) and they are easier to setup compared to the DO probes and the corresponding logging system.
3. Results and Discussion
3.1. Substrates’ Characterization
Results for the initial characterization of the substrates are reported in Table 2, including moisture and organic matter content, pH, C/N ratio and the calculated empirical formulas. The as-received moisture contents of the nine raw materials ranged from 40% (wb) for R-MAN3, to 82% (wb) for the R-DSL. The range of the corresponding moisture content for the processed substrates was even wider; two MSW derived materials (P-MSWC1 and P-MSWC2) were below 10%, while the rest varied from 22% (wb) to almost 65%. These variations over the moisture content are attributed not only to the different origin of each substrate (raw or processed) but also to the variety of process applied (static piles, enclosed composting systems), duration and curing or not of the final end-products.
During the composting process, the organic matter content decreased steadily due to the reduction of available carbon sources and easily biodegradable organic fraction. Depending on the selected composting process, availability of easily degradable carbon and duration of the three main degradation phases (mesophilic, thermophilic and curing), organic matter reduction rates may vary for substrates of different origin and composition. As shown in Table 2, initial volatile solids for the majority of raw substrates were above 80 % (db). Food waste (R-FW1, R-FW2 and R-FW3) volatile solids content ranged from 95% to 98% (db) while in two raw manures the corresponding values were around 31% (db). As for the processed substrates, most of their organic matter content was below 50%, while only two of them (P-VERC1 and P-HC2) had relatively high values of 57% and 93%. However, organic matter content measured as volatile solids should not be used itself as an index or predictor of biodegradation activity [7], since such a fixed limit value cannot exist when expressing compost stability [24]. Moreover, volatile solids (as measured at 550 °C) do not included only the biodegradable organic matter, but can also contain the recalcitrant to biodegradation carbon, depending on the substrate.
In this study, pH ranged from 5.1 to 8.3 for the raw materials, while all the processed substrates had pH above 7.2. Both ranges of the initial and final composting samples agree with findings of previously published research [3,16,23,25,26]. End products that were sampled from home composters (P-HC2 to P-HC11) had a pH between 7.3 and 9.7.
The initial C/N ratio of the studied substrates, as measured through elemental analysis, found to vary for both categories. For the raw materials, total C/N ratio was between 7.7 and 34, while for the processed ones ranged from 7.6 to 25 (with the exception of three values, namely 40, 45 and 51). In this context, Puyuelo et al. [27] had measured total C/N ratios for MSW, for the organic fraction of MSW and for raw sludge equal to 34, 22 and 6.3, respectively. These values are comparable to the C/N ratios of substrates P-MSWB (45.2), P-OFMSW (21.9) and R-DSL (8.2).
3.2. Manometric Liquid Phase Indices
Typical cumulative oxygen consumption profiles from the manometric liquid phase test are included in Figure 1. Solid lines represent the seven replicates for a raw (R-FW3) and the eight replicates for a processed (P-HC9) substrate. Oxygen consumption for raw materials (e.g., R-FW3) starts immediately after the initiation of the experiment, without any lag phase. Raw substrates had higher O2 consumption rates during the first 2 days and lower rates thereafter until 7th day. On the other hand, in the processed substrates (e.g., P-HC9) the consumption curves were flatter and lower than the raw materials. The same graphical trend for different substrates has been also found in other studies that dealt with solid phase static stability methods using manometric principles [6,28].
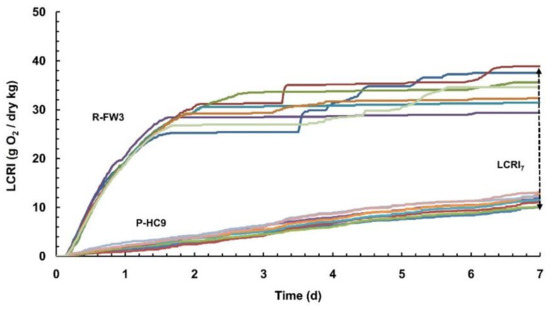
Figure 1.
Cumulative oxygen consumption profiles of raw (R-FW3) and processed (P-HC9) substrates for the manometric liquid phase test.
Figure 2 depicts the derived respirometric indices of manometric liquid phase test for all the raw and processed substrates. Figure 2i shows all the LCRI7 values of the studied substrates, expressed on a per dry kg basis (orange bars) and on a per kg volatile solids basis (grey bars). Maximum LCRI7 values for raw materials were around 60 g O2/dry kg, whilst all the processed substrates were below 35 g O2/dry kg. Differentiations between the cumulative indices when expressed in a per dry basis or per volatile solids basis, especially in the processed substrates, may be attributed to the different easily biodegradable organic fraction contents per substrate. Organic matter is not differentiated into readily and not readily biodegradable fraction here.
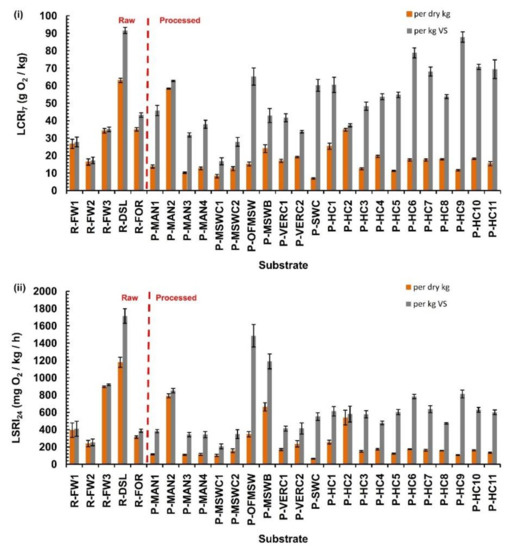
Figure 2.
Respirometric indices derived from the manometric liquid phase test for raw and processed substrates; (i) cumulative oxygen consumption index after 7 days (LCRI7); and (ii) maximum oxygen consumption rate over a 24 h period (LSRI24). In each graph indices are expressed both per dry kg and per organic matter basis.
The same trend is evident in Figure 2ii, which depicts the oxygen consumption rate over 24 h rate (LSRI24) of the manometric test, expressed both in a per dry kg basis (orange bars) and in a per organic matter kg basis (grey bars). The highest LSRI24 values were attributed to the dewatered sludge (1179 mg O2/dry kg-h or 1714 mg O2/kg VS-h) and the food waste (897 mg O2/dry kg-h or 920 mg O2/kg VS-h). On the other hand, most of the processed substrates had values below 200 mg O2/dry kg-h.
The biodegradability of studied substrates was also expressed using the Biodegradable Fraction (BF), as calculated by Equation (2). BF values varied from 0.009 (0.9%) to 0.035 (3.5%) for the raw substrates, while the range for the processed substrates was slightly higher, namely from 0.01 (1%) to 0.05 (5%). These relatively low BF values can be attributed to the fact that the denominator of the ratio (theoretical oxygen demand; ThOD), is calculated based on the notion that all total carbon measured via elemental analysis is biodegradable and eventually mineralizable to CO2. This is definitely not the case for any organic substrate. On the contrary, the nominator of the BF (LCRI7) is based on actual testing conditions, and thus indirectly accounts for the biodegradable carbon that consumes oxygen. The difference in the ranges of BF between the raw and processed materials is a result of the fact that processed substrates have already lost most of their easily degradable carbon, which affects both the nominator (actual measured O2 consumption) and the denominator (theoretical oxygen demand) in BF. This leads to BF being slightly higher for the processed materials than for the raw ones, although this may seem awkward. The fact that the processed substrates have already lost easily degradable carbon is evident by their oxygen consumption profiles (bottom curves of Figure 1) which are lower than the ones of the raw substrate (top curves). In the raw substrates, the easily (or readily) degradable carbon is consumed first leading to the relatively high oxygen consumption rates during the first couple of days of the experiment (see Figure 1). As a result, the raw substrates have two characteristic stages of degradation, namely the one with the steeper curve (easily degradable part) and the one with the flatter curve that follows (slowly degradable part). This is a result of the different solids hydrolysis rates of those two major groups of organic components that exist within any organic substrate (i.e., easily hydrolysable, slowly hydrolysable). In the processed substrates, the slowly degradable component is the dominant one that explains the relatively flat O2 consumption profile throughout the experiment.
3.3. SOUR Test Indices
Respirometric indices for the liquid SOUR test are shown in Figure 3.
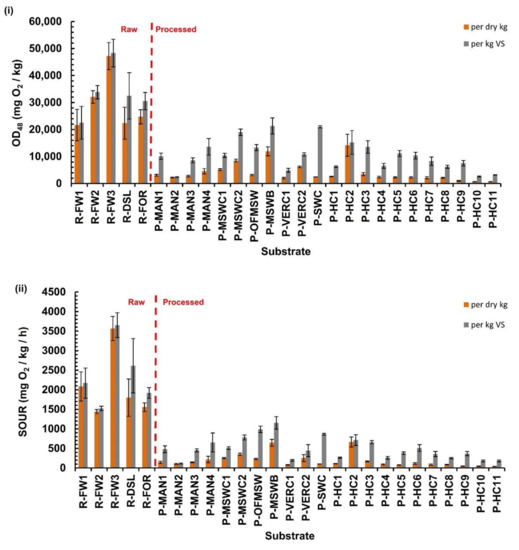
Figure 3.
Respirometric indices of Specific Oxygen Uptake Rate (SOUR) test for raw and processed substrates; (i) total oxygen demand after 48 h (OD48); and (ii) maximum oxygen uptake rate (SOUR). In each graph indices are expressed both per dry kg and per organic matter basis.
The cumulative oxygen demand index after 48-h (OD48) for all the studied substrates is shown in Figure 3i. Figure 3ii shows the corresponding peak rate indices over the whole duration of the test. All the processed substrates had SOURs below approximately 1000 mg O2/kg VS-h. This was a limit that had been initially proposed by Lasaridi and Stentiford [2] to differentiate “well matured, biosolids composts” from other less stable material, based on measurements of sludge composts obtained frοm turned windrows. In the study of Adani et al. [9], the SOUR of the end-products was higher and varied from 2940 to 8300 mg O2/kg VS-h, while substrates that had been sampled at the middle of the process had SOUR between 11,000 and 12,400 mg O2/kg VS-h. Scaglia et al. [17] used substrates derived from household wastes and the organic fraction of MSW, reporting high degree of biological stability for SOUR values around 2600 mg O2/kg VS-h. The limit that was proposed by Adani et al. [9] and Scaglia et al. [17] for materials of medium stability was 7000 mg O2/kg VS-h, which was derived from the corresponding dynamic respiration index (DRI) stability limit of 1000 mg O2/kg VS-h. However, this limit value was based only on MSW and household derived samples.
In our work, the five raw substrates had SOURs from around 1500 to 3700 mg O2/kg VS-h, being below the limit of 7000 mg O2/kg VS-h which classifies a substrate as “medium processed”.
3.4. Correlation Analysis
A statistically significant linear Pearson correlation coefficient (r = 0.63) was calculated between LCRI7 and LSRI24 (n = 184). This has been also demonstrated by Evangelou et al. [28], using the same indices but with a static solid-phase respirometer. That is, as the total O2 consumption increases, the maximum rate of O2 consumption increases too. A statistically significant Pearson correlation coefficient (r = 0.89) was also calculated between OD48 and SOUR (n = 151), which is also in agreement with the findings of Scaglia et al. [17]. This statistically significant correlation suggests that both SOUR and OD48 can be used as indicators for the assessment of biological stability. The same information is revealed with regard to the manometric test, since both the O2 consumption and the rates are highly correlated.
Figure 4 graphically depicts the correlations among the biodegradation indices for each of the two liquid tests. Correlations were checked among rates (Figure 4i) or among cumulative values (Figure 4ii) separately for the raw and processed substrates. As demonstrated, a graphical positive correlation trend exists only for the rate indices, namely the SOUR and the LSRI24 (Figure 4i). On the other hand, no significant correlation was found between the cumulative indices of the two tests (Figure 4ii).
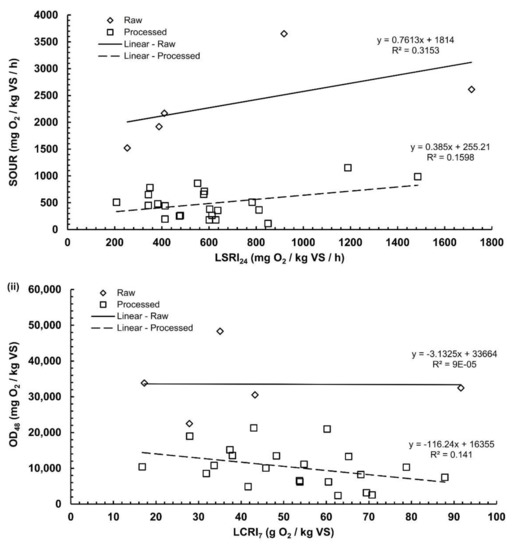
Figure 4.
Correlation plots between indices of the two tests: (i) SOUR (SOUR test rate) vs LSRI24 (manometric test rate); (ii) OD48 (SOUR test cumulative index) vs LCRI7 (manometric test cumulative index).
Table 3 includes all the statistically significant (at p < 0.05) Pearson correlation coefficients among the four respiration indices. Statistical analysis revealed that the only significant correlation was achieved between the oxygen consumption rates (SOUR and LSRI24) of the raw substrates, with a calculated coefficient of r = 0.459 (despite the small sample size n = 5, the coefficient was statistically significant). On the contrary, both SOUR test’s indices (OD48 and SOUR) found to be correlated negatively with LCRI7 (with Pearson’s coefficients equal to −0.360 and −0.326, respectively).
Table 3.
Statistically significant Pearson’s correlation coefficients among all respiration activity indices of the raw and processed substrates.
Α correlation was calculated using the average values of all indices per material used and the initial chemical characteristics of all substrates (VS, C, N). The sample size in this case was n = 27. The Spearman correlation coefficients (ρ) were chosen here since they can reveal any type of correlation and not only the linear one, as in the case of Pearson coefficient. The Spearman’s ρ coefficient among LCRI7-VS, LSRI24-VS, OD48-VS and SOUR-VS ranged from 0.67 to 0.76 and were all statistically significant at p < 0.05. Despite the above statistical finding, the graphs below reveal that those correlations are not very strong in the high values of VS (see Figure 5). For example, the graph of OD48 and VS reveals that there were at least 5 samples with a VS content of more than 90% db that had corresponding OD48 values between 200 to 48,000 mg O2/kg VS. This is not an indication of a strong correlation despite the fact that the corresponding Spearman correlation coefficient was 0.723 and statistically significant at p < 0.05 for that pair of variables. Other researchers [4,29] have also not found significant correlations between volatile solids and static respiration indices. For example, Bayard et al. [30] found that neither organic matter content nor cellulose and hemicellulose contents were correlated to the results of bioassays that assessed biodegradability via respiration activity. That is, organic matter content alone cannot be an adequate predictor of respiration activity, since it can contain both readily degradable and non-degradable organic matter. This is in agreement with the findings of Evangelou et al. [7] too, who had used solid-phase static respiration activity tests.
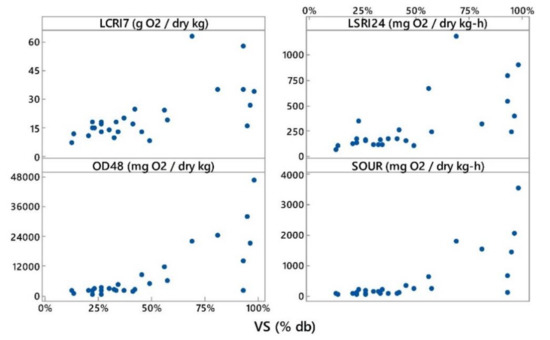
Figure 5.
Correlation plots between the initial volatile solids content and respiration activity indices for both liquid-phase tests (LCRI7, LSRI24, OD48, SOUR).
3.5. Statistical Differences among Substrate Groups and Types
Using one-way ANOVA, statistical differences were investigated among the characteristics of the individual substrates, between the two groups of substrates (raw, processed) and among different types (home composts, MSW derived composts, maures, etc.). The results are presented in Table 4. Analysis showed that all four respiration indices were statistically different between raw and processed substrates (expressed either on a per dry basis or per organic matter basis). The only exception was LSRI24 (when expressed in a per kg VS basis) for the manometric test, which was statistically similar for both the raw and the processed substrates (i.e., mean values were 623 and 571 mg/kg VS-h, respectively). On the other hand, the LCRI7 was statistically different between the Raw and Processed substrates (32.9 and 17.6 g/dry kg, respectively), based on 35 and 149 replicates for each test, respectively. This finding enhances the initial ad-hoc grouping of the 27 substrates into raw and processed.
Table 4.
Statistical differences between groups of substrates (Raw; Processed) and among types of substrates (MSW derived, home composts, etc.).
On the other hand, when the 27 substrates were categorized per source material, most respiration indices were statistically similar. For example, home composts, manures, MSW derived materials and seaweed compost were statistically similar with regard to the four indices of the two tests. Statistical similarities were found also for the categories of food wastes, sludges and forest debris with regard to our newly introduced manometric test indices (LCRI7 and LSRI24).
The newly proposed liquid phase manometric test is considered more representative of the whole composting process, due to its longer duration, as opposed to the relatively short time of the SOUR test (i.e., 48 h). Thus, the SOUR test risks to be a non-representative “snapshot” of the process without the capacity to reveal the extent of biodegradation of a substrate, which is of primary importance during stability assessment.
4. Conclusions
A newly introduced manometric liquid phase respirometric activity test to assess organic waste stability is presented here and compared to an already established liquid phase test (SOUR test). The conclusions from this work are:
- A significant correlation among the respiration indices of both tests was found for the raw substrates only (n = 5). On the other hand, no significant correlation was found for the processed substrates (n = 22).
- The limits of the SOUR that had been proposed in the past (1000 mg O2/kg VS-h for matured composts) are verified here too, since almost all processed materials had SOUR values below that limit.
- The newly introduced liquid phase test can be used as an alternative test to assess organic waste stability. The 24 h oxygen consumption rates (LSRI24) for the raw and processed substrates ranged from 240 to 1180 mg O2/dry kg-h (250 to 1700 mg O2/kg VS-h) and from 64 to 792 mg O2/dry kg-h (210 to 1480 mg O2/kg VS-h), respectively. A clearer differentiation between fresh and more stabilized substrates is thus achieved when the above index is expressed on a per dry matter basis than on a per VS basis.
- The respiration activity indices calculated here were significantly lower in the processed substrates compared to the raw ones. On the other hand, no statistical differences were found between substrates when grouped by source material (food waste, manures, MSW, etc.).
- The main advantage of the newly proposed manometric liquid phase respiration activity test is that it can provide stability indices more representative of the composting process, than the 48 h SOUR test, due to its longer experimental duration (7 days), which is closer to actual composting periods. In addition, it is cheaper to set up, than the SOUR test, since it uses equipment widely available in most environmental laboratories.
A comparison of the liquid phase indices with respiration activity indices derived from solid-phase tests is necessary to further investigate the potential of adopting this newly introduced liquid phase test in a wider scale.
Author Contributions
Both authors contributed equally to this work.
Acknowledgments
The authors did not receive any specific funding for this research from public, commercial, or not-for-profit sectors.
Conflicts of Interest
The authors declare no conflict of interest.
Abbreviations
| SOUR | specific oxygen uptake rate |
| VS | volatile solids |
| DO | dissolved oxygen |
| OD12,20,48 | cumulative oxygen demand after 12, 20, 48 h, respectively |
| OUR | oxygen uptake rate |
| db | dry weight basis |
| wb | wet weight basis |
| LOI | loss on ignition |
| MRA | microbial respiration activity |
| LCRI | liquid cumulative respiration index |
| LSRI | liquid static respiration index |
| BF | biodegradable fraction |
| ThOD | theoretical oxygen demand |
| C/N | carbon to nitrogen ratio |
| L/S | liquid to solid ratio |
| MBT | mechanical biological treatment |
| WWTP | wastewater treatment plant |
| BOD | biochemical oxygen demand |
| MSW | municipal solid waste |
References
- European Council. Directive, 2008/98/EC of 19 November 2008 on Waste and Repealing Certain Directives; Official Journal of the European Communities, L 312, 22/11/2008; European Council: Brusseles, Belgium, 2008. [Google Scholar]
- Lasaridi, K.; Stentiford, E. A simple respirometric technique for assessing compost stability. Water Res. 1998, 32, 3717–3723. [Google Scholar] [CrossRef]
- Oviedo-Ocana, E.R.; Torres-Lozada, P.; Marmolejo-Rebellon, L.F.; Hoyos, L.V.; Gonzales, S.; Barrena, R.; Komilis, D.; Sánchez, A. Stability and maturity of biowaste composts derived by small municipalities: Correlation among physical, chemical and biological indices. Waste Manag. 2015, 44, 63–71. [Google Scholar] [CrossRef] [PubMed]
- Barrena, R.; d’Imporzano, G.; Ponsa, S.; Gea, T.; Artola, A.; Vazquez, F.; Sánchez, A.; Adani, F. In search of a reliable technique for the determination of the biological stability of the organic matter in the mechanical-biological treated waste. J. Hazard. Mater. 2009, 162, 1065–1072. [Google Scholar] [CrossRef] [PubMed]
- Ponsá, S.; Gea, T.; Sánchez, A. Different indices to express biodegradability in organic solid wastes. J. Environ. Qual. 2010, 39, 706–712. [Google Scholar] [CrossRef] [PubMed]
- Komilis, D.; Kontou, I.; Ntougias, S. A modified static respiration assay and its relationship with an enzymatic test to assess compost stability and maturity. Bioresour. Technol. 2011, 102, 5863–5872. [Google Scholar] [CrossRef] [PubMed]
- Evangelou, A.; Calabrò, P.S.; Greco, R.; Sánchez, A.; Komilis, D. Biodegradation activity of eight organic substrates: A correlation study of different test methods. Waste Biomass Valoriz. 2016, 7, 1067–1080. [Google Scholar] [CrossRef][Green Version]
- Tremier, A.; de Guardia, A.; Massiani, C.; Paul, E.; Martel, J.L. A respirometric method for characterizing the organic composition and biodegradation kinetics and the temperature influence on the biodegradation kinetics, for a mixture of sludge and bulking agent to be composted. Bioresour. Technol. 2005, 96, 169–180. [Google Scholar] [CrossRef] [PubMed]
- Adani, F.; Gigliotti, G.; Valentini, F.; Laraia, R. Respiration index determination: A comparative study of different methods. Compost Sci. Util. 2003, 11, 144–151. [Google Scholar] [CrossRef]
- Scaglia, B.; Tambone, F.; Genevini, P.L.; Adani, F. Respiration index determination: A dynamic and static approach. Compost Sci. Util. 2000, 8, 90–98. [Google Scholar] [CrossRef]
- Adani, F.; Ubbiali, C.; Generini, P. The determination of biological stability of composts using the dynamic respiration index: The results of experience after two years. Waste Manag. 2006, 26, 41–48. [Google Scholar] [CrossRef] [PubMed]
- Komilis, D.; Kanellos, D. A modified dynamic respiration test to assess compost stability: Effect of sample size and air flowrate. Bioresour. Technol. 2012, 117, 300–309. [Google Scholar] [CrossRef] [PubMed]
- Binner, E.; Zach, A. Laboratory Tests Describing the Biological Reactivity of Pretreated Residual Wastes. In Proceedings of the ORBIT Symposium, Weimar, Germany, 2–4 September 1999. [Google Scholar]
- Iannotti, D.A.; Pang, T.; Toth, B.L.; Elwell, D.L.; Keener, H.M.; Hoitink, H.A.J. A quantitative respirometric method for monitoring compost stability. Compost Sci. Util. 1993, 1, 52–65. [Google Scholar] [CrossRef]
- Gea, T.; Barrena, R.; Artola, A.; Sánchez, A. Monitoring the biological activity of the composting process: Oxygen uptake rate (OUR), respirometric index (RI), and respiratory quotient (RQ). Biotechnol. Bioeng. 2004, 88, 520–527. [Google Scholar] [CrossRef] [PubMed]
- Villaseñor, J.; Pérez, M.A.; Fernández, F.J.; Puchalski, C.M. Monitoring respiration and biological stability during sludge composting with a modified dynamic respirometer. Bioresour. Technol. 2011, 102, 6562–6568. [Google Scholar] [CrossRef] [PubMed]
- Scaglia, B.; Erriquens, F.G.; Gigliotti, G.; Taccari, M.; Ciani, M.; Genevini, P.L.; Adani, F. Precision determination for the specific oxygen uptake rate (SOUR) method used for biological stability evaluation of compost and biostabilized products. Bioresour. Technol. 2007, 98, 706–713. [Google Scholar] [CrossRef] [PubMed]
- Stentiford, E. The SOUR Method; Biowaste Workshop: Brussels, Belgium, 2002. [Google Scholar]
- Barrena, R.; Vazquez, F.; Sanchez, A. The use of respiration indices in the composting process: A review. Waste Manag. 2006, 24, 37–41. [Google Scholar] [CrossRef]
- U.S. Department of Agriculture (USDA); U.S. Composting Council (USCC). Test Methods for the Examination of Composting and Compost; Thomson, W., Ed.; The Composting Council Research and Education Foundation, Holbrook: New York, NY, USA, 2002; pp. 03.09.1–03.09.4. [Google Scholar]
- American Public Health Association (APHA); American Water Works Association (AWWA). Standard Methods for the Examination of Water and Wastewater, 20th ed.; American Public Health Association: Washington, DC, USA, 1998; ISBN 0875532357. [Google Scholar]
- Komilis, D.; Evangelou, A.; Giannakis, G.; Lymperis, C. Revisiting the elemental composition and the calorific value of the organic fraction of municipal solid wastes. Waste Manag. 2012, 32, 372–381. [Google Scholar] [CrossRef] [PubMed]
- Komilis, D.P.; Tziouvaras, I.S. A statistical analysis to assess the maturity and stability of six composts. Waste Manag. 2009, 29, 1504–1513. [Google Scholar] [CrossRef] [PubMed]
- Bernal, M.P.; Alburquerque, J.A.; Moral, R. Composting of animal manures and chemical criteria for compost maturity assessment. A review. Bioresour. Technol. 2009, 100, 5444–5453. [Google Scholar] [CrossRef] [PubMed]
- Pognani, M.; Barrena, R.; Font, X.; Scaglia, B.; Adani, F.; Sánchez, A. Monitoring the organic matter properties in a combined anaerobic/aerobic full-scale municipal source separated waste treatment plant. Bioresour. Technol. 2010, 101, 6873–6877. [Google Scholar] [CrossRef] [PubMed]
- Sciubba, L.; Marzadori, C.; Cavani, L.; Grigatti, M.; Ciavatta, C. Relationships between stability, maturity, water-extractable organic matter of municipal sewage sludge composts and soil functionality. Environ. Sci. Pollut. Res. 2015, 22, 13393–13403. [Google Scholar] [CrossRef] [PubMed]
- Puyuelo, B.; Ponsá, S.; Gea, T.; Sánchez, A. Determining C/N ratios for typical organic wastes using biodegradable fractions. Chemosphere 2011, 85, 653–659. [Google Scholar] [CrossRef] [PubMed]
- Evangelou, A.; Gerassimidou, S.; Mavrakis, N.; Komilis, D. Monitoring the performances of a real scale municipal solid waste composting and a biodrying facility using respiration activity indices. Environ. Monit. Assess. 2016, 188, 302. [Google Scholar] [CrossRef] [PubMed]
- Aspray, T.J.; Dimambro, M.E.; Wallace, P.; Howell, G.; Frederickson, J. Static, dynamic and inoculum augmented respiration based test assessment for determining in-vessel compost stability. Waste Manag. 2015, 42, 3–9. [Google Scholar] [CrossRef] [PubMed]
- Bayard, R.; Benbelkacem, H.; Gourdon, R.; Buffière, P. Characterization of selected municipal solid waste components to estimate their biodegradability. J. Environ. Manag. 2017. [Google Scholar] [CrossRef] [PubMed]
© 2018 by the authors. Licensee MDPI, Basel, Switzerland. This article is an open access article distributed under the terms and conditions of the Creative Commons Attribution (CC BY) license (http://creativecommons.org/licenses/by/4.0/).