Article

Improving Soil and Water Conservation of Riparian Vegetation Based on Landscape Leakiness and Optimal Vegetation Pattern

1
College of Environment and Planning, Henan University, Kaifeng 475004, China
2
Key Laboratory of Geospatial Technology for the Middle and Lower Yellow River Regions, Ministry of Education, Kaifeng 475004, China
3
Center for Geodata and Analysis, Faculty of Geographical Science, Beijing Normal University, Beijing 100875, China
*
Author to whom correspondence should be addressed.
Sustainability 2018, 10(5), 1571; https://doi.org/10.3390/su10051571
Submission received: 1 April 2018 / Revised: 9 May 2018 / Accepted: 11 May 2018 / Published: 15 May 2018

Abstract

:
Soil erosion inflicts multiple and severe damage throughout the world. The importance of vegetation spatial patterns in conserving soil and water has been widely acknowledged. In this study, by using the leakiness index (LI), which indicates the soil and water conservation function of the landscape by integrating landscape patterns closely with hydrological processes, we analyzed the changes in this function of riparian vegetation under different patterns with the aim of identifying the optimal pattern for improving soil and water conservation in severely eroded riparian buffer zones. Prior to this, the relationship between the erosion modulus and LI was discussed to provide certain evidence for the potential application of LI to the study area given the limited empirical works. Results showed that LI illustrated a significantly linear correlation with the erosion modulus (R2 = 0.636, p < 0.01), thereby suggesting a promising application of LI in the Beijiang riparian vegetation buffer zone. A comparison of the LI values regarding four different vegetation patterns indicated that under the premise of the same coverage (40%), the aggregation degree and patch orientation with low LI values exerted improved performance for soil and water conservation, so we selected the horizontal distribution and compact aggregation as the optimal pattern for vegetation regulation. The spatial variations of LI values in the study area showed that five regions were suffering from severe erosion, thus becoming the targeted area for regulation. The final regulation with the optimal vegetation pattern in severely eroded areas performed well given that the soil and water conservation was improved to a high level with a LI value less than or equal to 0.2. The results described in this study provide an alternative screening method to figure out the severe erosion areas needing improvement, a further understanding of the effect of vegetation pattern on soil and water conservation and a theoretical basis for the extended application of LI.

1. Introduction

Soil erosion has been well documented as an environmental hazard and a powerful factor of ecological degradation because of its adverse impacts on land productivity and human well-being [1,2]. In the various measures for controlling soil erosion, the importance of vegetation coverage has been well demonstrated by many lines of experimental and empirical evidences [3,4,5]. Soil erosion from hillslopes and small watersheds will diminish with the increase in vegetation coverage, and this relationship is typically used to formalize the influence of vegetation on empirical and process-based soil erosion prediction models, such as the Universal Soil Loss Equation (USLE), in which soil erosion decreases linearly as the vegetation coverage increases [6]. In contrast, the field experiment conducted by Noble [7] illustrated that the relationship between vegetation coverage and soil erosion could be described as exponential and that the linear model was inapplicable. In addition, scientists and practitioners have been attempting to clarify the degree to which vegetation cover affects (or not) soil erosion. A model-based study in the Loess Plateau area of China suggested that 52% vegetation coverage was preferable for soil erosion control [8]. This result corresponds to the notion that the critical area for reducing soil erosion is equal to or more than 50% of vegetation coverage [9], while the study from Rogers and Schumm [10] revealed that 15% of vegetation coverage was ineffective in retarding soil erosion in arid or semiarid regions. However, there are still some studies that have not been so consistent with this finding. The research conducted by Zhou et al. [11] and Ouyang et al. [12] indicated that 60–80% of vegetation coverage was contributable to soil and water conservation, but less than 30% was unable to conserve soil and water efficiently.
These achievements of the variability observed in the vegetation coverage-soil erosion relationship demonstrate that only vegetation coverage is insufficient for interpreting its widespread impact on an erosion process. Vegetation spatial patterns, as a critical aspect for describing the relationship between vegetation coverage and erosion, have been reported as factors that influence soil erosion at different scales, from patch and slope to watershed. At the patch scale, Puigdefábregas [13] carried out some field observations and simulation experimentation to analyze the relationship between vegetation coverage, runoff, and sediment. At the slope scale, the experiment conducted by Boer et al. [4,9] demonstrated that the erosion from a mosaic distribution of vegetation and bare was more severe than that from a vegetation homogenization distribution. At the watershed scale, field monitoring developed by Bartley et al. [14] suggested that runoff and sediment decreased when vegetation was located near the watershed outlet. However, a few attempts have been made to investigate this quantitatively using the coupling index, let alone regulate soil and water conservation with an improved vegetation pattern to combat soil erosion.
Soil erosion is a dynamic process where soil particles or nutrients maintain movement and redistribution in each rainfall event. The moving pathway or connectivity is affected by the landscape pattern [15]. For example, runoff can keep moving on the bare soil patch, but the nutrients carried by runoff will be intercepted and redistributed on the vegetation patches, and the interception ability is also different due to different vegetation patterns. Accordingly, the ecohydrological linkage between erosion processes and vegetation spatial patterns has received considerable attention. Several scholars have persistently attempted to conduct such research through different methods, among which field monitoring has been well developed with a high controllable capability and flexible operation, but the favorable performance obtained at a small scale is not generally applicable at a large scale [16,17,18]. To cover this shortage, spatially distributed models have been established on the basis of field observation to predict large scale soil erosion with acceptable accuracy [18]. Beyond that, coupling indices provide a powerful and convenient tool for linking the vegetation pattern with soil erosion such as the flowlength index (FL), location-weighted landscape contrast index (LCI), directional leakiness index (DLI), and leakiness index (LI) [15,19,20,21]. Among the various coupling indices, the LI was developed based on the erosion process to reflect the effect of vegetation patterns on runoff connectivity, hence retaining soil and water in arid or semiarid regions, demonstrating an ideal performance in reflecting landscape water and soil conservation function [21,22], thus the application of LI is of high concern. Most studies regarding LI have been concentrated in arid and semiarid regions and rarely in subtropical regions, much less the riparian vegetation buffer zones in the subtropics [15,21]. The riparian vegetation buffer zone, as an important part of the landscape, can enhance soil and water conservation capability by uptaking runoff and decreasing velocity to prevent soil erosion [23]. However, deforestation, farmland reclamation, and urban land expansion caused by human activities have resulted in the rapid reduction, or even disappearance, of the riparian vegetation buffer zone and aggravation of soil erosion [24]. Consequently, improving the soil and water holding capacity of current riparian vegetation buffer zones with the coupling index (LI) is a practical and meaningful research subject.
The objective of this study was to analyze the potential application of LI in subtropical riparian vegetation buffer zones, identify optimal vegetation patterns that can effectively realize the landscape capability of soil and water conservation through scenario simulation, and present the vegetation regulation results using optimal vegetation patterns and strategies with the hope that the soil and water conservation capability of severe–erosion regions can be improved.

2. Materials and Methods

2.1. Description of the Study Area

This study was conducted in the 10 km buffer zone along the mainstream of the Beijiang River situated in Guangdong Province, Southern China. This area encompasses 14 administrative regions (Figure 1) and is mainly controlled by a subtropical monsoon climate with hot-rainy summers and wild-rainless winters, accompanied by a mean annual temperature of 22 °C and a mean annual precipitation that ranges from 1600 mm to 1800 mm, which mainly occurs during the rainy season from April to September [25]. This region is constituted of mountains and hills lowering from north to south with an average slope of 10.74°. As a result, this region is subjected to soil erosion, especially during rainfall events. The land use type in this area is composed of cultivated and construction lands, forests, and water areas. Soil with a clay-to-loam texture contains a high level of Fe and Al oxides due to the intense illuviation and eluviation under the influence of abundant water, which not only promotes plant growth but also exacerbates farmland reclamation causing high intensity human interference, thus aggravating soil erosion [26]. Therefore, soil erosion is an ecological problem that must be solved in this area.

2.2. Landscape Leakiness

The soil erosion process is closely related to landscape patterns, and further understanding their mutual relationship will contribute to the in depth study of soil and water conservation. LI, as a quantitative evaluation index based on raster data, can link vegetation patterns with soil and water conservation by indicating the connectivity between the first (starting from a given location) and last grid cell (out of interest) [21].
The data for LI calculation were mainly a digital elevation model derived from Google Earth and vegetation coverage observed from the Geospatial Data Cloud (www.gscloud.cn) in 2015 with the same resolution of 30 m. Previous studies related to leakiness have used various indices such as the stress-related vegetation index, PD54, and redness index to indicate vegetation coverage [27,28,29]. In this study, the Normalized Difference Vegetation Index (NDVI) was selected as a widely available indicator to reflect the proportion of ground covered by vegetation patches within a pixel. This index provides a robust estimate of vegetation in each pixel in the image [30,31] and then LI was computed using ARC Macro Language (AML) implemented in ArcInfo 9.3.
LI = 1 [ L max L c a l L max + L min ] k
The value of landscape leakiness ranges from 0 (no leakiness) to 1 (totally leaky) to indicate the landscape resource retention that ranges from 1 (full retention) to 0 (no retention). A minimal value characterizes the high capability of soil and water retention for landscape, and vice versa. Lmax is the maximum leakiness value (0% of vegetation coverage), and Lmin represents the minimum leakiness value (100% of vegetation coverage). The power number k denotes the slope of the decay curve of LI against the proportion of vegetation coverage. Here, k = 5 provides a good fit for LI to the decay curve according to the practical conditions for soil and vegetation in China [22,32]. Lcal represents the calculated value of the potential leakiness of a landscape and is determined by the multiple flow direction algorithm:
L cal = j = 1 m P i , j
where Pi,j is the progressive flow value of each grid cell, Lcal refers to the sum of contributions from all the neighboring grids (including both adjacent and diagonal), and m indicates the total number of grids adjacent to the targeted pixel. The progressive value of each grid (Pi,j) can be described as:
P i , j = n 1 8 ( P i , j , n × S n ) × [ L i , j × sin ( S i , j ) ]
where n (ranging from 1 to 8) is the representative of the eight grids adjacent to the targeted one. These adjacent pixels may contribute a proportion of their progressive flow to other adjacent pixels at low elevation, hence, the proportion of the progressive value from the adjacent pixels (n) to the pixel being considered is represented by Sn, which is determined by the gradient between the grids. Adjacent grids have different heights, which determine the flow direction, and in turn affect the grids receiving runon and the proportion that flows into adjacent cells as runoff. Li,j can be described as:
L i , j = e b × C i , j
where Li,j is an important parameter for Lcal, which indicates the soil erosion nonlinear decline with the increase in vegetation coverage. Parameter b defines the steepness of the decline in li,j with the increase in vegetation coverage (ci,j), and is suggested to be −0.065 in arid or semiarid areas [18], whereas we revised b to be −0.053 in the present study in accordance with the soil and vegetation conditions in Southern China [22,33]. In addition, b may be varied to fit li,j to soil erosion versus vegetation cover for a specific study.

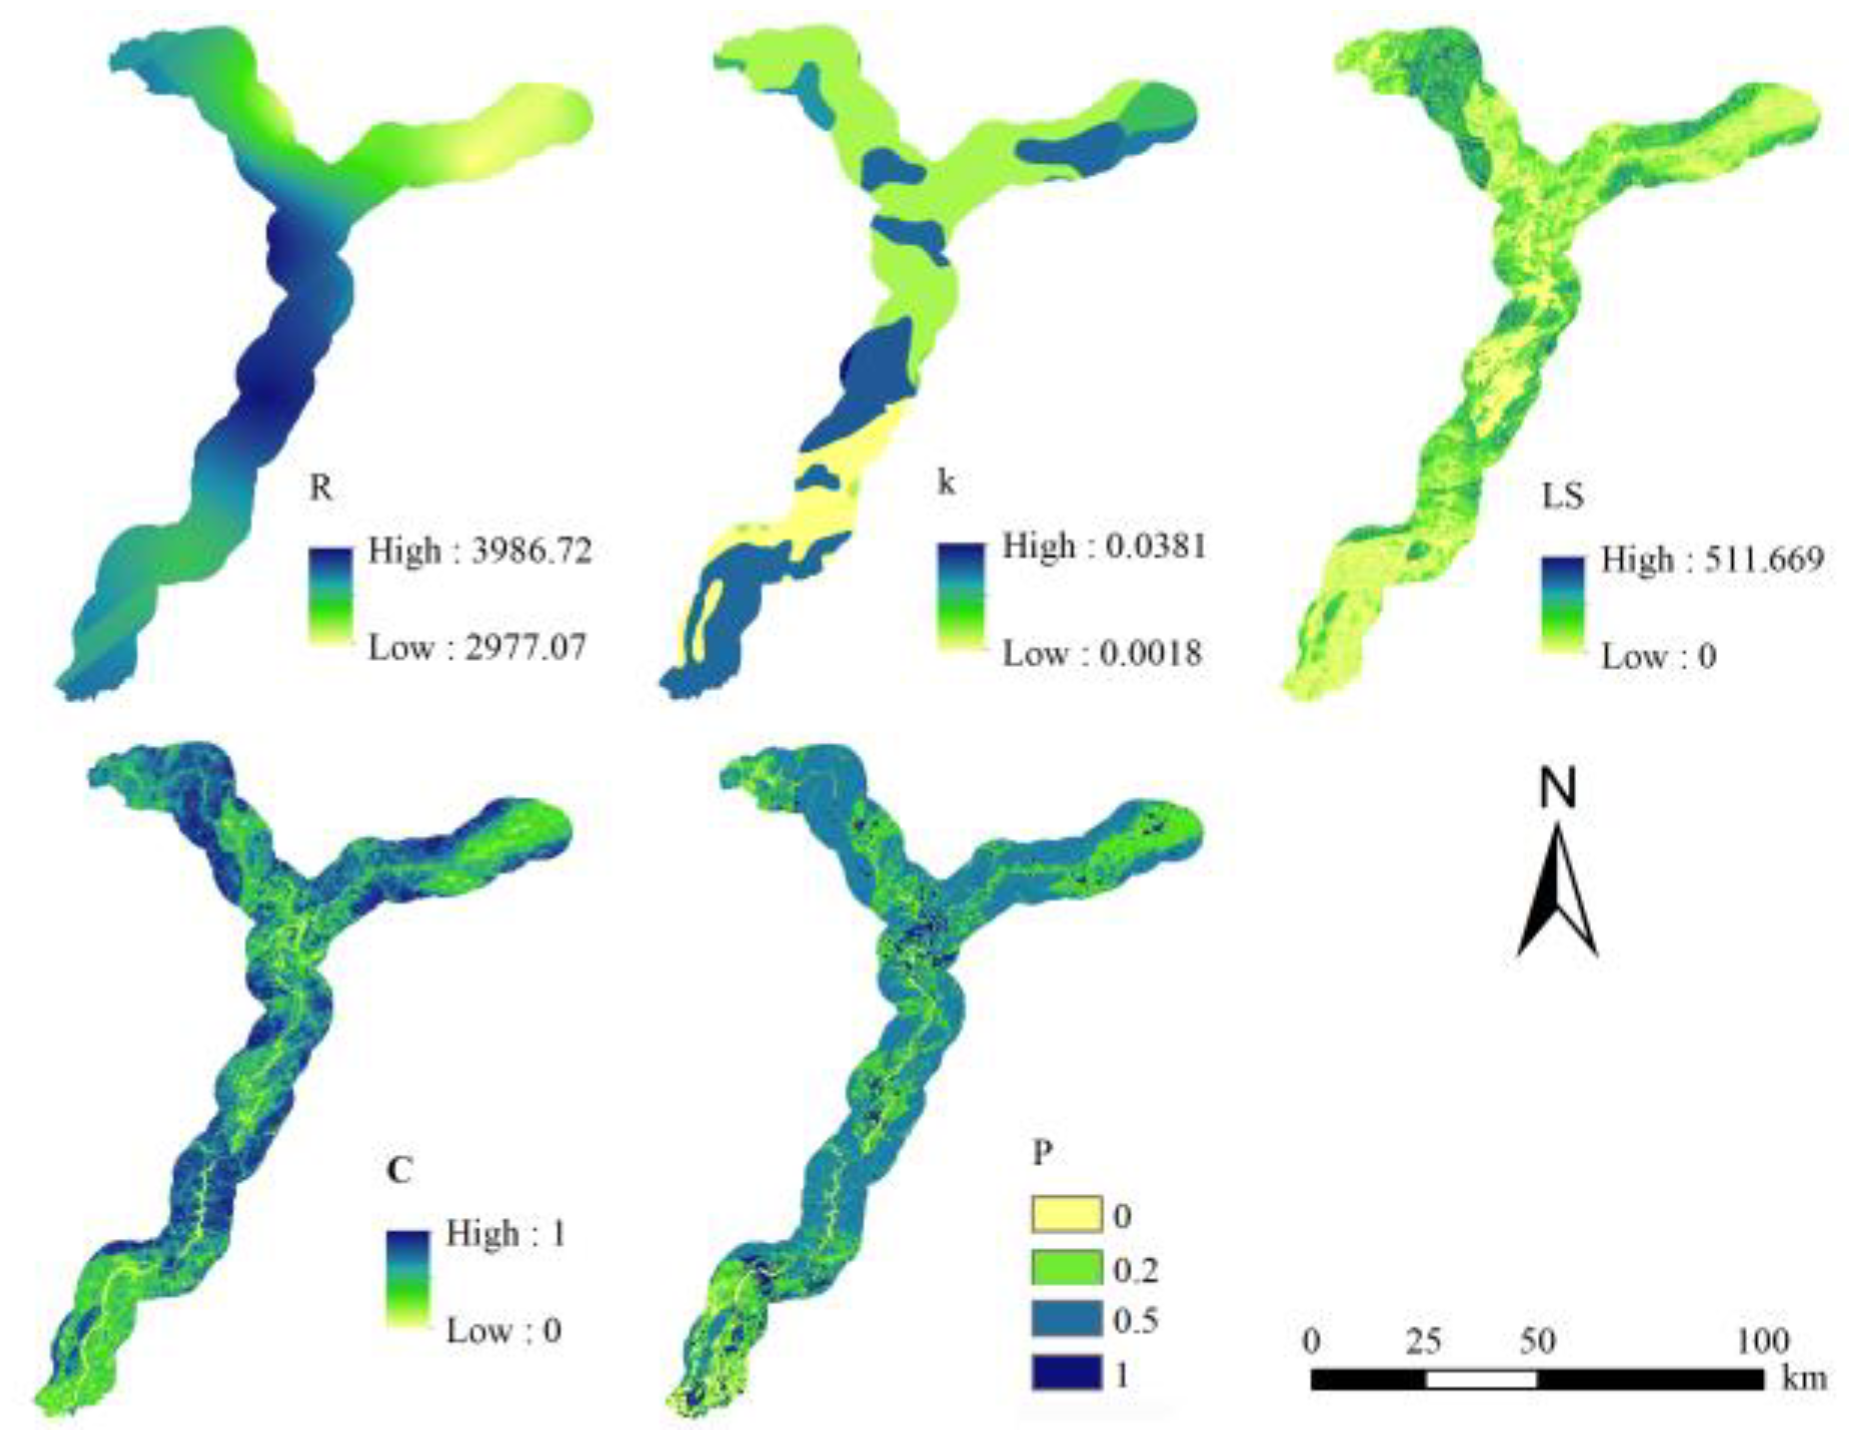
2.3. Calculation of Erosion Modulus

It is necessary to explore the potential application of LI in the study area given the seldom-used LI in subtropical regions. USLE, a widely applied empirical model for assessing erosion, has presented good performance not only in Northern China (such as the Loess Plateau) [34] but also in Southern China (such as the Fujian and Yunnan Provinces) [35,36], hence in Guangdong Province [37,38]. This model was introduced to confirm its application by using data from 2015. The erosion modulus can be defined by the following equation:
A = R × K × LS × C × P
where A is the soil erosion modulus (t·ha−1·a−1), R denotes the rainfall erosivity factor (MJ·mm·ha−1·h−1·a−1), K represents the soil erodibility factor (t·ha·h·ha−1·MJ−1·mm−1), and the soil type was described in Figure 2. LS refers to the topographic factor (slope steepness and length), C signifies the crop management factor, and P is the conservation supporting practice factor. The detailed algorithm is available in relevant studies [38,39,40].
The distribution of the six USLE related factors over the study area are illustrated in Figure 3, which were overlapped and multiplied to generate the erosion modulus by using ArcGIS 9.3. The correlation analysis between LI and erosion modulus was processed in SPSS 17.

2.4. Setting of Vegetation Patterns

According to previous studies [8,9,10,11,12], the critical vegetation coverage for soil erosion control exceeds 50%, thus in the present study, we selected 40% as the coverage of each vegetation pattern scenario, to differentiate the difference between the different vegetation patterns in conserving soil and water. Regarding the construction of different vegetation pattern scenarios, four types of vegetation patterns were configured and simulated in this study: position, orientation, aggregation degree, and fragmentation degree (Figure 4). Each scenario, which is a fishnet (vector data) with 5000 grids in total (100 rows and 50 columns), generated by ArcGIS 9.3, was constructed with 3000 grids expected to be assigned a random value ranging from 0% to 100%, following a corresponding function with the sum of 2000 for a fixed coverage of 40%, and then the vector data were converted to grid data. Based on the simulated grid, the LI value of the four types of vegetation patterns was calculated. The regulation of soil and water conservation is favorable when the LI value is small.

2.5. Improving Method for Regions with Severe Soil Erosion

Considering the effect of terrain and river flow direction on soil erosion, combined with the optimal vegetation pattern determined from different vegetation pattern scenarios, we developed regulation strategies for regions with severe soil erosion (Table 1).

3. Results

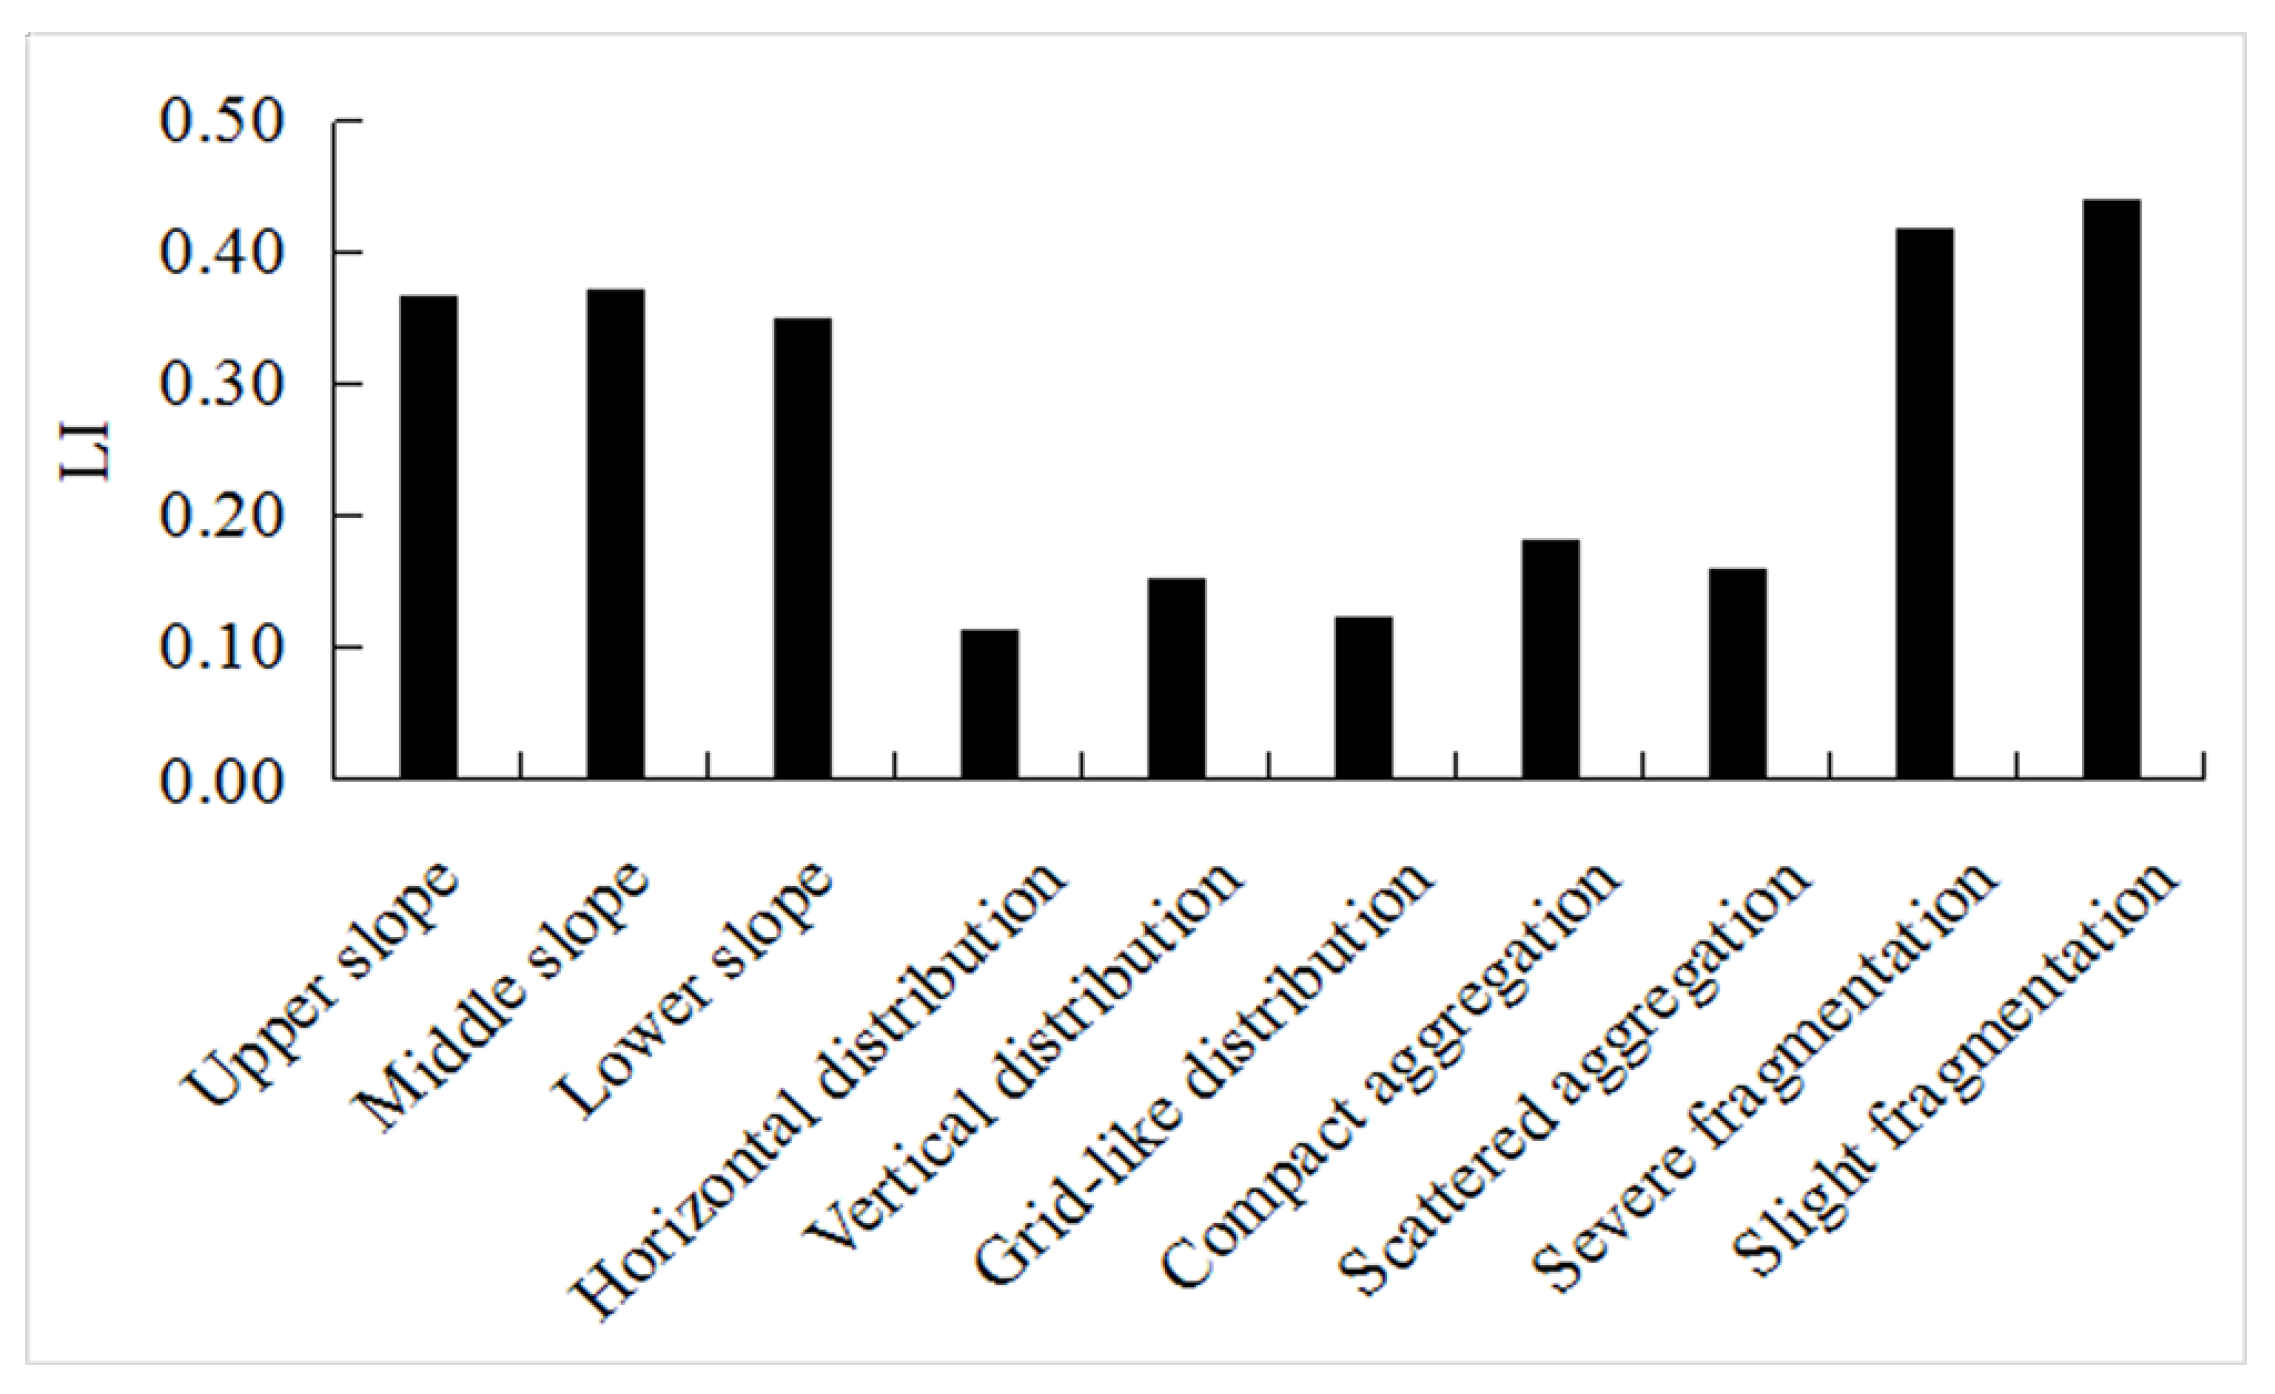
3.1. Verification of LI as an Effective Index in the Study Area

We analyzed the correlation between the erosion modulus and LI obtained from the 14 regions involved in the study area (Figure 1) to illustrate the potential application of LI.
Figure 5 shows that LI had a significantly linear correlation with the erosion modulus (R2 = 0.636, p = 0.001). This finding was in good agreement with that from Liu et al. [22], suggesting that LI can describe the theoretical soil loss mechanisms. Furthermore, it can potentially indicate the soil and water conservation function practically in the study area.

3.2. Scenario Analysis for Different Vegetation Patterns

Figure 6 shows the LI values according to the classification shown in Figure 4. It depicts that the changes in LI values in the four types of vegetation patterns were in the order of fragmentation degree > patch position > aggregation degree > patch orientation. Patch orientation and aggregation degree had lower LI values than the other changes, indicating that these two patterns can mitigate soil erosion with better performance. Considering the importance of compact aggregation near the outlet for intercepting runoff and sediment flowing into the river [32], the horizontal distribution and compact aggregation should be identified as optimal vegetation patterns to improve soil and water conservation.

3.3. Improvement of Soil and Water Conservation of Riparian Vegetation Based on Optimal Pattern

The improvement of soil and water conservation of the landscape has received considerable attention, especially for watershed management [42]. In this section, we first evaluated the spatial variation of LI values for all the regions in the study area and then regulated the soil and water conservation function of severely eroded regions according to the optimal vegetation pattern and strategy.
We implemented a grade division for LI by combining previous research with the actual situation of the study area to further develop the quantitative assessment of the soil and water conservation capacity of LI. Ludwig et al. [28] proposed that a plot with a leakiness greater than 0.5 was considered as an area with a low soil and water conservation function in arid and semiarid areas. Similarly, Liu et al. [22] applied LI to the Hanjiang watershed in China and suggested that the capacity of soil and water conservation was weak when the LI value was greater than 0.5. In addition, Ludwig et al. [21] selected a paddock in Central Australia as the study area to analyze the changes in LI values from 1980 to 2002 and found that the LI values dropped from 0.33 in 1980 to less than 0.1 in 2002, indicating that the soil and water conservation increased gradually. Based on these related studies, we divided LI values into three levels: 0–0.2, 0.2–0.5, and 0.5–1.

3.3.1. Spatial Variation of LI in the Vegetation Buffer Zone of the Beijiang River

Table 2 lists some detailed information for the related regions in the study area. Vegetation coverage was more than 40% in each region. The regions with an area proportion of more than 6% had high coverage, that is, more than 50%. These regions, except for Qingyuan, presented a relatively high slope (more than 7°) but had lower LI values, which further confirmed the significant positive correlation between vegetation coverage and soil and water conservation [43]. For example, the regions (Yingde, Qujiang and Lechang) with high coverage (more than 60%) had low LI values (less than 0.15), whereas low coverage regions like Hudu, Sanshui, and Sihui (slightly more than 40%), had high LI values (up to more than 0.4) although they had a relatively low average slope degree. The reason why Qingyuan possessed high LI values even with a lower slope is because this region is located in the lower reaches of the river with a dense population and serious human disturbance. Despite the high slope, other regions such as Wengyuan, Renhua, Fogang, and Ruyuan still had lower LI values, and this may be put down to the great vegetation coverage (more than 65%). However, the vegetation coverage and slope degree of Shaoguan and Qingyuan was similar to Nanxiong, but the former’s LI value was significantly higher than that of the latter. In addition, the coverage was higher in Sanshui than that in Huadu, but the LI value was approximately 11% higher in Sanshui than that in Huadu, which may be attributed to the changes in the spatial pattern of vegetation [44]. It can be seen from Table 2 that the regions with severe erosion are Shaoguan, Qingyuan, Sanshui, Sihui, and Huadu.

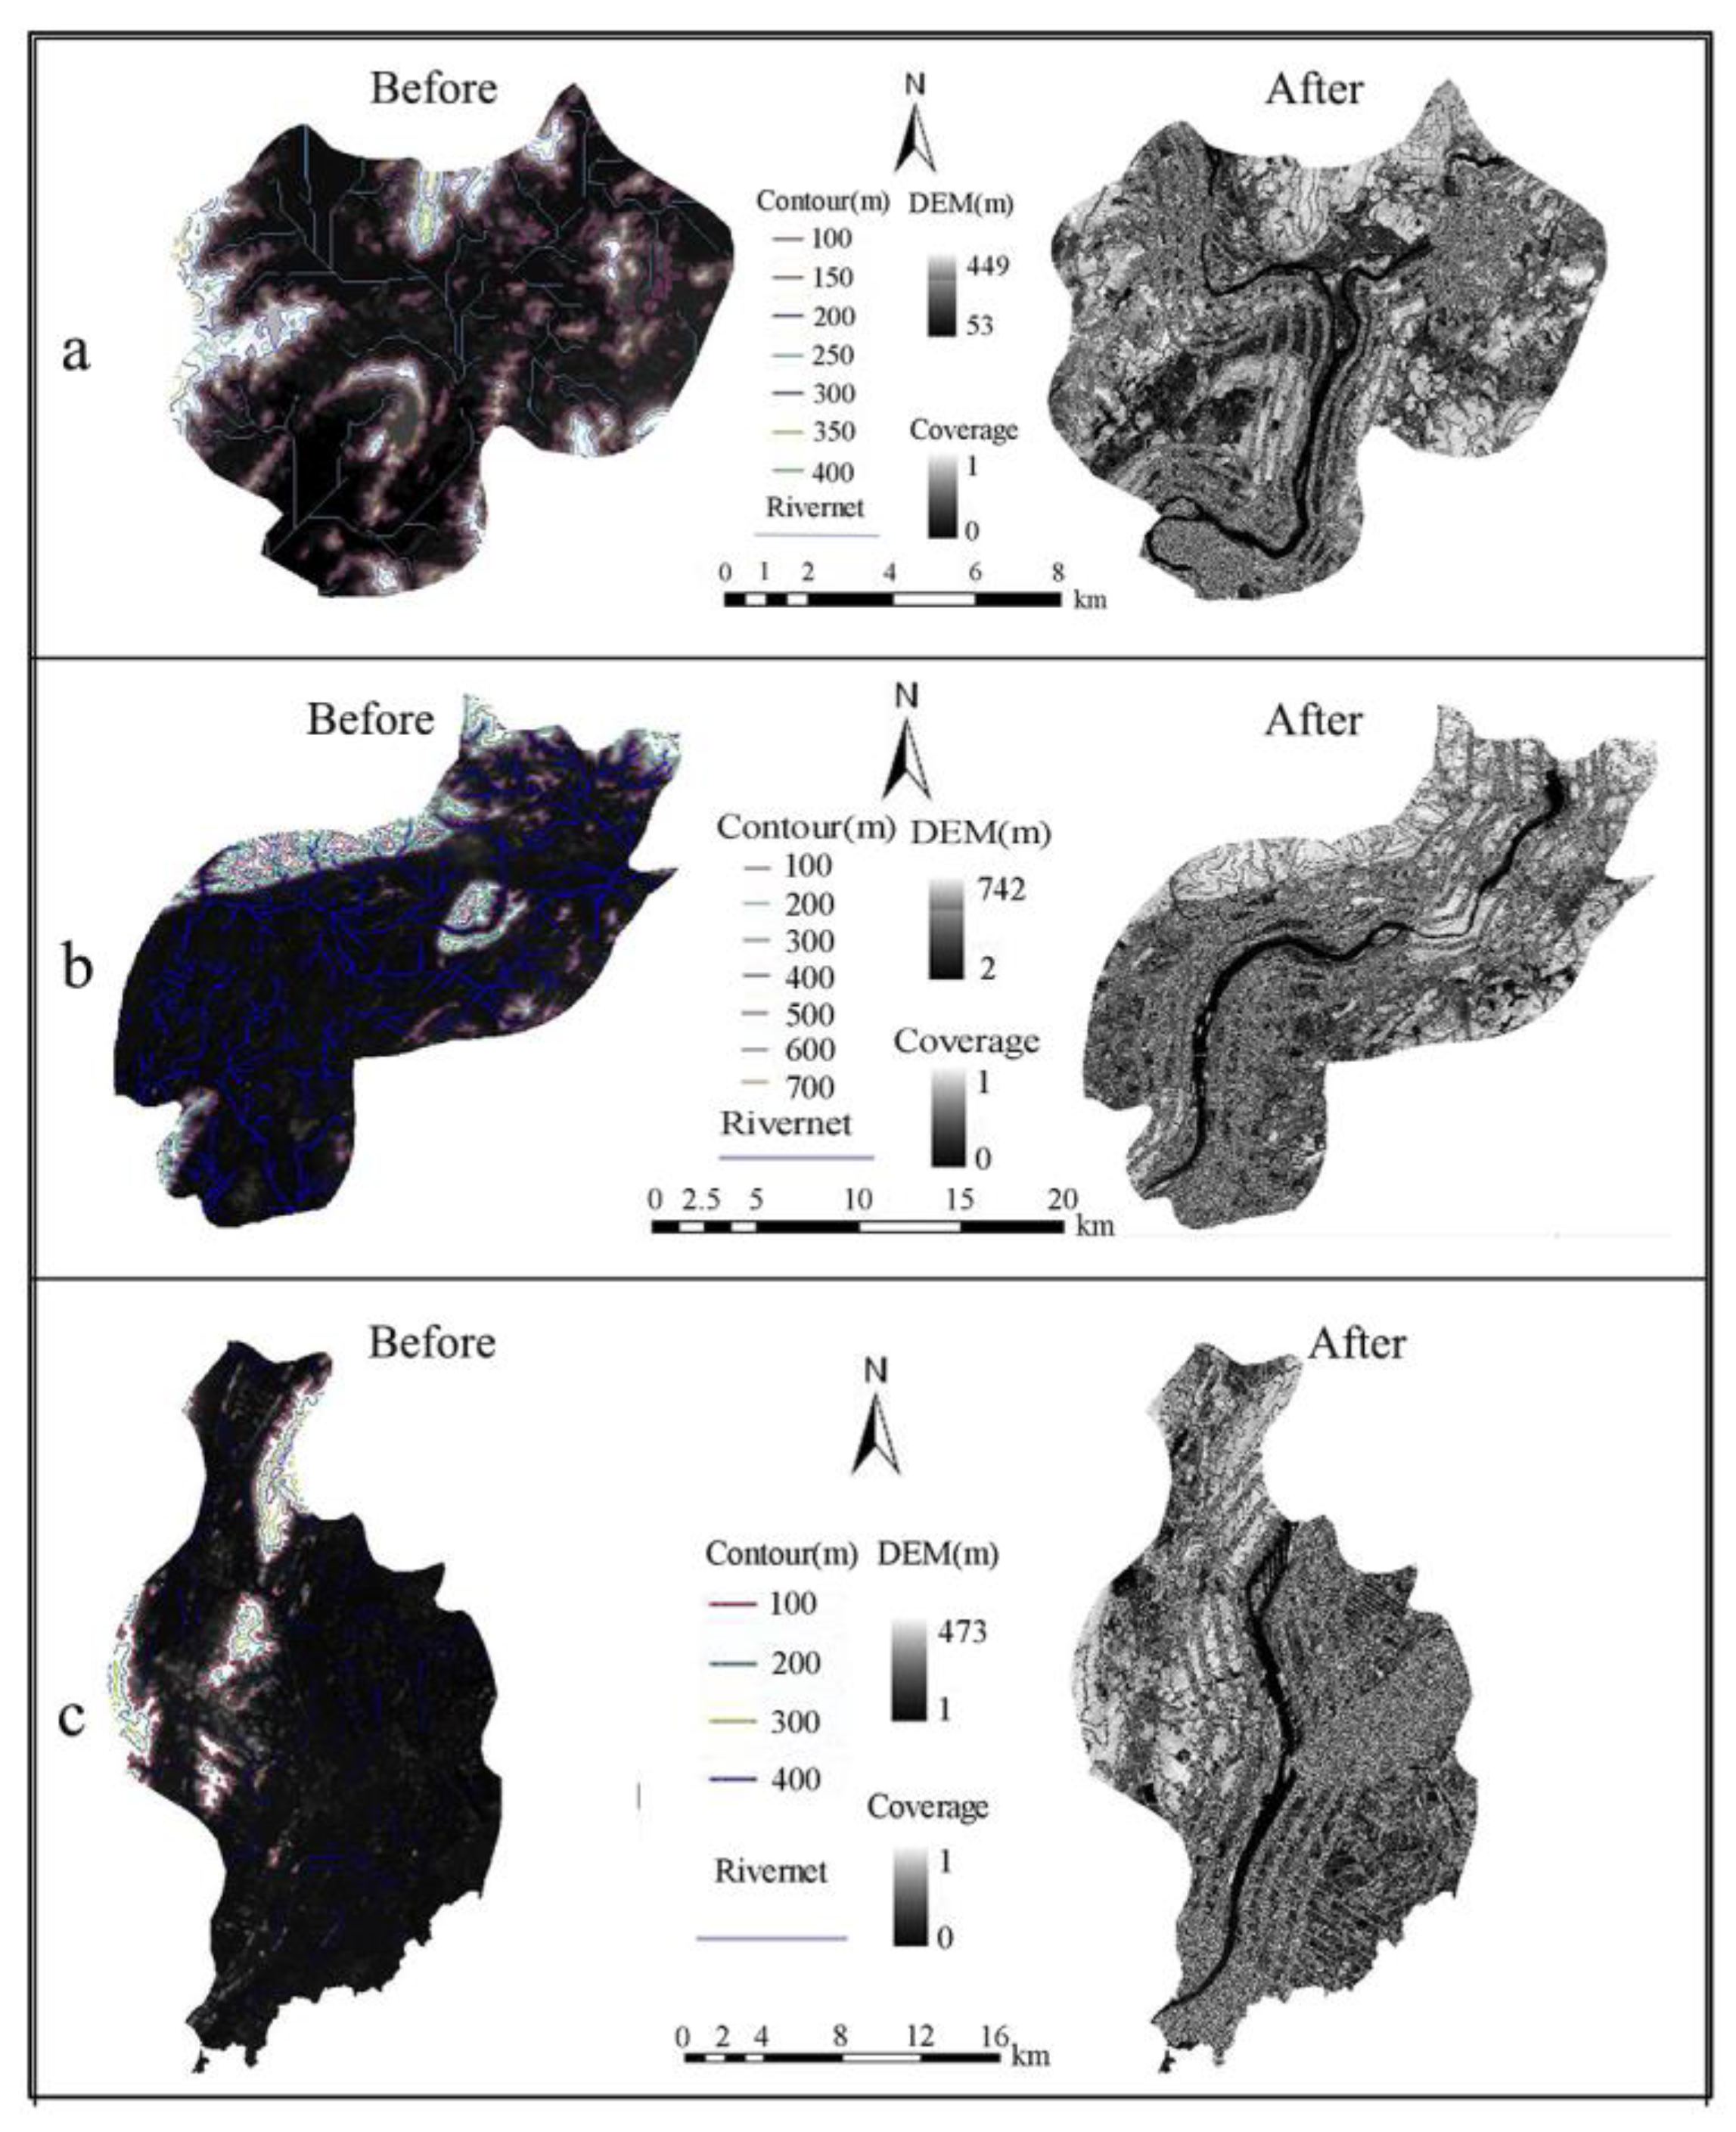
3.3.2. Improving Soil and Water Conservation for the Targeted Regions

The soil and water conservation function of severely eroded regions, in accordance with the above mentioned results (Shaoguan, Huadu, Qingyuan, Sihui, and Sanshui) as displayed in Table 1, was improved based on the landscape leakiness, optimal vegetation pattern, and specific strategy.
In order to implement the vegetation regulation, we converted the raster data of regions needing improvement to vector data and then altered the attribute of vector data to redistribute the vegetation pattern as expected. The contour line, river course, and river outlet were also considered as the factors affecting soil and water conservation, so we presented the DEM and contour line in the left panel of Figure 7. We arranged vegetation near the river outlet and horizontal relative to the contour line and river course shown in the right panel of Figure 7, which could contribute to the improvement of soil and water conservation. In addition, considering the feasibility of regulation in reality and the positive relationship between vegetation coverage and soil erosion, a 5% increase in vegetation coverage was conducted during regulation.
After vegetation regulation, the soil and water conservation capability of the targeted areas has reached a high level. The regulation in Shaoguan (Figure 7a) showed an increase in vegetation coverage from 49% to 54%. Accordingly, the LI values decreased from 0.46 to 0.19. In the regulation process, vegetation was distributed along the river course, contour direction, and aggregated at the outlet with an optimized pattern to intercept runoff and sediment, and hence reduce soil erosion. Qinyuan is a region located down river with a large population and high elevation in marginal areas [45]. The intensity of human disturbance led to a high LI value of 0.46 before regulation. Therefore, during the vegetation regulation, arranging the vegetation patch parallel to the river and contour was necessary. The vegetation coverage increased from 52% to 57% and the LI value decreased to 0.20 after vegetation regulation (Figure 7b). Sanshui is at the bottom of the watershed. In the vegetation regulation process, vegetation patches were distributed at the bottom and outlet of the watershed, which can intercept runoff and sediment from upstream. The improved LI value decreased from 0.53 to 0.14 (Figure 7c). In the same way, vegetation patterns in Sihui and Huadu were also redistributed, and then their LI values reduced to 0.17 and 0.12, respectively.

4. Discussion

4.1. Potential Application of LI in the Study Area

Riparian vegetation and its distribution pattern are crucial to intercept surface runoff, reduce water velocity, and retain resources to promote soil and water conservation [46,47,48]. In particular, the perennial vegetation plays a more important role in soil and water conservation in the long term. The dominant vegetation in the study area is evergreen broad-leaved forest, which is more conducive to soil and water conservation. Previous studies on landscapes have usually used indices or indicators that can be obtained with common software (such as Fragstats) and simple operations to analyze the correlation between indices and erosion variables [19,43,49]. For example, research has showed that a mosaic structure and boundary shape were the main factors influencing the sediment delivery ratio in a watershed [50,51], whereas an acceptable negative correlation was observed between the sediment delivery ratio and patch density, Shannon diversity index, and sediment yield [49]. These traditional indices were usually not based on the hydrologic process but on the biological processes that described the spatial or non-spatial characteristics of the landscape. Consequently, they exhibited limited utility in integrating vegetation patterns with landscape function [52], which is exactly what scholars are concerned about [5,53]. In order to further explore the connection between pattern and process, LI, a hydrologic connectivity index reflecting the effect of vegetation patterns on the separation, transportation, and deposition processes during soil erosion, has attracted much attention and achieved a successful application in arid and semiarid areas [21,54]. In addition to the international research on LI, some efforts have been made to address the use of LI in China. To explore the application of DLI, the antecedent of LI, Liu et al. [32] revised the DLI to link the vegetation cover patterns to hydrological responses in the Loess Plateau, Northwest China. In the same year, Liu et al. [22] assessed the impact of erosion on the water environment with LI in Central China. However, in this study, LI was applied for the first time to the riparian vegetation buffer zone of the subtropical region. Although there was a significantly linear correlation between LI and erosion modulus, indicating a promising application of LI in the study area, its performance requires further verification with the runoff of sediment data.

4.2. Effects of Vegetation on Soil and Water Conservation

4.2.1. Effects of Vegetation Coverage on Soil and Water Conservation

Vegetation coverage, an effective proxy for indicating the ability of the landscape to retain soil and water, has been empirically confirmed worldwide [43,55]. The current knowledge on the role of vegetation coverage in soil and water conservation has been well developed. The same is true in China, where this positive correlation has been demonstrated by numerous studies [5,56]. For example, in Southern China, studies conducted in the Fujian and Guangdong Provinces, which are subject to the similar geographical conditions as the study area, revealed that soil and water conservation decreased whilst vegetation cover increased [57,58,59,60]. Specifically, the effect mechanism of vegetation on soil and water conservation is related to canopy, ground cover, and plant roots. First, the canopy can intercept rainwater and reduce the energy produced by the raindrop to directly splash the surface soil, and can also decrease the amount of rainfall that reaches the surface along the stem or tree trunk to reduce the chance for runoff generation. Second, ground cover can enhance erosion resistance, mitigating runoff scouring with high water holding capacity. Third, plant roots can improve the soil physical characteristics (e.g., soil aggregates and hydraulic conductivity) and provide better living conditions for animals and microbes to promote the hydrological characteristics of soil, thereby increasing infiltration and improving soil and water conservation capacity [61].
As aforementioned, vegetation cover can modulate the generation, transport pathways, and intensity of runoff and sediment, hence improving soil and water conservation. Describing the differences in vegetation coverage among the different regions of the study area can provide some detailed context for interpreting the effect of vegetation coverage on soil and water conservation. In this study, the LI value decreased with the increase in vegetation coverage, e.g., the highest and lowest coverage was 70.22% and 40.81% in Ruyuan and Sihui, respectively, and their corresponding LI value was 0.15 and 0.51, respectively, suggesting that the soil and water conservation capability was significantly greater under high coverage than under low coverage.

4.2.2. Effects of Vegetation Pattern on Soil and Water Conservation

Increasing vegetation coverage is an effective measure for improving soil and water conservation. However, the reasonable distribution of the vegetation patch can exert direct action in influencing water flow connectivity at each rainfall event and then intercepting runoff and sediment. This interception can increase the retention of nutrients and inputs, which in turn promotes vegetation growth. This series of relationships is often referred to as positive feedback mechanisms to increase the ability of vegetation for soil and water conservation.
Different vegetation configurations at the slope result in different effects on soil and water conservation. Our research also mirrored this point. First, the soil and water conservation capability of the vegetation patch was higher at the lower position than that at the upper and middle positions of slope in this study, and this finding is consistent with that of Rey [4] and Kang et al. [9]. Second, the horizontal distribution of the vegetation patch can reduce runoff length along the downslope, thereby increasing the obstacle encountering probability, enhancing infiltration, and intercepting runoff and sediments. This has been verified by numerous studies [9,62,63,64]. Third, the soil and water conservation capability, under different aggregation degrees of the vegetation patch, showed that it was slightly higher under scattered aggregation than that under compact aggregation, and this result was in line with that of Rogers and Schumm [10], who suggested that vegetation with a relatively scattered distribution could moderate water flow and increase connectivity, and hence more runoff and sediment was captured by the vegetation patch. Finally, the soil and water conservation function of severe fragmentation of the vegetation patch was close to that of slight fragmentation with high LI values, indicating that fragmented vegetation patches may count against soil and water conservation [9,54].
At the watershed scale, a vegetation pattern with a small LI value is beneficial to the regulation of the riparian zone, but considering the importance of compact vegetation at the river outlet [32], we chose horizontal distribution and compact aggregation as the optimal vegetation pattern to regulate soil and water conservation function in the study area. The arrangement of the horizontal distribution vegetation patch parallel to the contour or river course is a preferred strategy to intercept runoff and sediment and improve soil and water conservation for riparian vegetation buffer zones [9]. An aggregated vegetation pattern distributed at the river outlet can increase infiltration, reduce runoff connectivity, and obstruct runoff flowing into the river [32]. In this study, scattered aggregation was not the same as sporadic distribution. Alternatively, this aggregation refers to the increase in the distance between vegetation patches. Therefore, some distance must be maintained between vegetation patches, especially for artificial planting, to enhance the conservation capacity of the riparian vegetation buffer.
An important issue to be mentioned here is that vegetation diversity also serves as an important function in conserving soil and water. This has been confirmed by several studies. For example, Hou et al. [65] conducted a study in the Three-River-Source region and found that the soil particles were significantly intercepted by the vegetation patch with numerous plant distributions. Berendse et al. [66] suggested the robust effects of plant species diversity on soil erosion. Despite the fact that LI potentially indicates the soil and water conservation function with different vegetation patterns [15,21,28], plant diversity is not taken into account for LI.

4.3. Key Area for Improving Soil and Water Conservation

It is of great importance to identify the key area for optimizing landscape patterns and improving soil and water conservation. The so called “key area” in this study refers to the strategic position of vegetation by considering river outlet, elevation, and the river course direction. Firstly, the closer the distance between the riparian vegetation patch and river outlet, the larger the contribution of vegetation to conserving soil and water and the less risk of sediment entering the river [67]. Secondly, the higher the elevation, the greater the runoff energy, hence the higher chance of soil erosion. Thirdly, vegetation non-parallel to the river course has been associated with a high risk of riverbank scouring and erosion [41,67]. Consequently, we developed a vegetation regulation strategy based on these related studies. Namely, the vegetation patches arranged near the discharge outlet, along the contour line, and parallel to river course were considered in this study to improve the soil and water conservation capability. Aside from the distribution pattern, the quantity of riparian vegetation is another high priority issue for improving soil and water conservation in the riparian zone. Generally, high vegetation coverage is associated with greater conservation capability, while increasing vegetation blindly is not a cost-effective solution. In the present study, given the benefit of realistic optimization for the purpose of minimum costs and maximum benefit, a 5% increase in vegetation coverage was selected. One can, of course, change the incremental solution according to the specific situation and determine an optimal solution.

4.4. Limitation and Potential Iimprovement

LI performs better than other traditional indices in linking landscape pattern with hydrological processes to reduce labor costs and time consumption. However, vegetation diversity modulated by the vegetation pattern also plays an important role in reserving soil and water and, as aforementioned [65], this notion was also disregarded in this study. The present study demonstrated the influence of different vegetation patterns on conserving soil and water and the optimal pattern for regulating severe–erosion areas. In addition to vegetation diversity, vegetation type is considered a factor that affects soil and water conservation. Different vegetation types will exert different functions in retaining resources [68]. In the present study, LI focused on the effect of vegetation patterns on soil and water conservation without involving vegetation type in the calculation process. The present work is a preliminary study, thus some improvements are needed to enhance the ability of LI in indicating soil and water conservation.
As for the wider application of LI in other regions except arid and semiarid areas, this tentative study suggested that LI had great potential to be applied to the study area. According to the fact that few studies have been involved in this attempt, the present study can more or less contribute to the wide use of the LI. Accordingly, additional field experiments for runoff and sediment data are required to further validate the applicability of LI in the subtropical region.

5. Conclusions

Our results provide certain evidence for the potential application of LI in the study area with the powerful relationship between erosion modulus and LI (p < 0.01). LI, as a connectivity index, can effectively link the vegetation pattern and erosion process. The changes in the spatial pattern of the vegetation patch will result in the changes in LI values, thus the soil and water conservation capability. The variation involving LI and vegetation pattern under different scenarios suggested that orientation and aggregation degree performed better for conserving soil and water with relatively low LI values. However, when considering the important effect of compact aggregation on intercepting runoff and sediment near the outlet, the horizontal distribution and compact aggregation were taken as the relatively optimal pattern, which could further promote the knowledge that vegetation with a band or strip and aggregation pattern can contribute significantly to controlling soil erosion. Therefore, these patterns must be highly considered for improving the function of riparian vegetation buffer zones.
The LI values of different regions indicated that severe soil erosion occurred in Shaoguan, Huadu, Qingyuan, Sihui, and Sanshui with high LI values (i.e., low level soil and water conservation), and these regions were selected as the targeted areas for vegetation regulation. Combining the optimal pattern and specific strategy, the regulation results demonstrated that soil and water leakiness in the five regions was controlled with an expected decrease below or equal to 0.2.
Admittedly, the present study is only one step towards the wider application of LI in subtropical areas and a comprehensive understanding of the effects of vegetation pattern on soil erosion. Meanwhile, it is required to further validate the applicability of LI with some field data. The improvement of LI and the exploration of more effective vegetation patterns for conserving soil and water in a broader scope are more challenging issues.

Author Contributions

All authors contributed equally to this work. All authors have read and approved the final manuscript.

Funding

This research was funded by the National Natural Sciences Foundation of China (41301197), the Colleges and Universities Key Scientific Research Projects of Henan Province (18A1700042), and the Program for Innovative Research Team (in Science and Technology) at the University of Henan Province (16IRTSTHN012).

Acknowledgments

The authors would like to thank Yu Liu for his technical guidance and support.

Conflicts of Interest

The authors declare no conflict of interest.

References

  1. Pimentel, D. Soil erosion: A food and environmental threat. Environ. Dev. Sustain. 2006, 8, 119–137. [Google Scholar] [CrossRef]
  2. Schmiedel, U.; Kruspe, M.; Kayser, L.; Oettlé, N. The ecological and financial impact of soil erosion and its control—A case study from the semiarid Northern Cape Province, South Africa. Land Degrad. Dev. 2017, 28, 1–9. [Google Scholar] [CrossRef]
  3. Mahmoudzadeh, A. Vegetation cover plays the most important role in soil erosion control. Pak. J. Biol. Sci. 2007, 10, 388–392. [Google Scholar] [CrossRef] [PubMed]
  4. Rey, F. Effectiveness of vegetation barriers for marly sediment trapping. Earth Surf. Process. Landf. 2010, 29, 1161–1169. [Google Scholar] [CrossRef]
  5. Lieskovský, J.; Kenderessy, P. Modelling the effect of vegetation cover and different tillage practices on soil erosion in vineyards: A case study in Vráble (Slovakia) using WATEM/SEDEM. Land Degrad. Dev. 2014, 25, 288–296. [Google Scholar] [CrossRef]
  6. Wischmeier, W.H. A rainfall erosion index for a Universal Soil-Loss Equation. Soil Sci. Soc. Am. J. 1959, 23, 246–249. [Google Scholar] [CrossRef]
  7. Noble, E.L. Sediment Reduction through Watershed Rehabilitation; US Department of Agriculture, Miscellaneous Publication: Washington, DC, USA, 1965; pp. 114–123.
  8. Zhou, Z.C.; Shangguan, Z.P.; Zhao, D. Modeling vegetation coverage and soil erosion in the Loess Plateau Area of China. Ecol. Model. 2006, 198, 263–268. [Google Scholar] [CrossRef]
  9. Kang, W.; Li, Z.B.; Li, P.; Shen, Z.Y. The effects of soil erosion with different vegetation disposals in slope. J. Xi’an Univ. Technol. 2007, 23, 261–264. [Google Scholar] [CrossRef]
  10. Rogers, R.D.; Schumm, S.A. The effect of sparse vegetative cover on erosion and sediment yield. J. Hydrol. 1991, 123, 19–24. [Google Scholar] [CrossRef]
  11. Zhou, P.; Luukkanen, O.; Tokola, T.; Nieminen, J. Effect of vegetation cover on soil erosion in a mountainous watershed. Catena 2008, 75, 319–325. [Google Scholar] [CrossRef]
  12. Ouyang, W.; Hao, F.; Skidmore, A.K.; Toxopeus, A.G. Soil erosion and sediment yield and their relationships with vegetation cover in upper stream of the Yellow River. Sci. Total Environ. 2010, 409, 396–403. [Google Scholar] [CrossRef] [PubMed]
  13. Puigdefábregas, J. The role of vegetation patterns in structuring runoff and sediment fluxes in drylands. Earth Surf. Process. Landf. 2005, 30, 133–147. [Google Scholar] [CrossRef]
  14. Bartley, R.; Corfield, J.P.; Abbott, B.N.; Hawdon, A.A.; Wilkinson, S.N.; Nelson, B. Impacts of improved grazing land management on sediment yields. Hillslope processes. J. Hydrol. 2010, 389, 237–248. [Google Scholar] [CrossRef]
  15. Ludwig, J.A.; Eager, R.W.; Bastin, G.N.; Chewings, V.H.; Liedloff, A.C. A leakiness index for assessing landscape function using remote sensing. Landsc. Ecol. 2002, 17, 157–171. [Google Scholar] [CrossRef]
  16. Fu, B.J. The integrated studies of geography: Coupling of patterns and processes. Acta Geogr. Sin. 2014, 69, 1052–1059. [Google Scholar] [CrossRef]
  17. Chen, L.D.; Li, X.Z.; Fu, B.J.; Xiao, D.N.; Zhao, W.W. Development history and future research priorities of landscape ecology in China. Acta Ecol. Sin. 2014, 34, 3129–3141. [Google Scholar] [CrossRef]
  18. Liu, Y. Landscape connectivity in soil erosion research: Concepts, implication and quantification. Geogr. Res. 2016, 1, 195–202. [Google Scholar] [CrossRef]
  19. Mayor, Á.G.; Bautista, S.; Small, E.E.; Dixon, M.; Bellot, J. Measurement of the connectivity of runoff source areas as determined by vegetation pattern and topography: A tool for assessing potential water and soil losses in drylands. Water Resour. Res. 2008, 44, 2183–2188. [Google Scholar] [CrossRef]
  20. Chen, L.D.; Fu, B.J.; Xu, J.Y.; Gong, J. Location-weighted landscape contrast index: A scale independent approach for landscape pattern evaluation based on “Source-Sink” ecological processes. Acta Ecol. Sin. 2003, 23, 2406–2413. [Google Scholar] [CrossRef]
  21. Ludwig, J.A.; Bastin, G.N.; Chewings, V.H.; Eager, R.W.; Liedloff, A.C. Leakiness: A new index for monitoring the health of arid and semiarid landscapes using remotely sensed vegetation cover and elevation data. Ecol. Indic. 2007, 7, 442–454. [Google Scholar] [CrossRef]
  22. Liu, Y.; Wu, B.F.; Zeng, Y.; Zhang, L. Assessment of the impacts of soil erosion on water environment based on the integration of soil erosion process and landscape pattern. Chin. J. Appl. Ecol. 2013, 24, 2581–2589. [Google Scholar] [CrossRef]
  23. Sahu, M.; Gu, R.R. Modeling the effects of riparian buffer zone and contour strips on stream water quality. Ecol. Eng. 2009, 35, 1167–1177. [Google Scholar] [CrossRef]
  24. Nakamura, F.; Yamada, H. Effects of pasture development on the ecological functions of riparian forests in Hokkaido in northern Japan. Ecol. Eng. 2005, 24, 539–550. [Google Scholar] [CrossRef]
  25. Luo, L.; Wu, G.C.; Wu, J.N. Analysis on the climatic characteristics of rainfall in flood season of Beijiang River Basin from 1965 to 2010. Guangdong Meteorol. 2012, 34, 13–15. [Google Scholar] [CrossRef]
  26. Zhao, Q.H.; Liu, Q.; Ma, L.J.; Ding, S.Y.; Xu, S.S.; Wu, C.S.; Liu, P. Spatiotemporal variations in rainfall erosivity during the period of 1960–2011 in Guangdong Province, southern China. Theor. Appl. Climatol. 2015, 128, 113–128. [Google Scholar] [CrossRef]
  27. Pickup, G.; Chewings, V.H.; Nelson, D.J. Estimating changes in vegetation cover over time in arid rangelands using Landsat MSS data. Remote Sens. Environ. 1993, 43, 243–263. [Google Scholar] [CrossRef]
  28. Ludwig, J.A.; Eager, R.W.; Liedloff, A.C.; Bastin, G.N.; Chewings, V.H. A new landscape leakiness index based on remotely sensed ground-cover data. Ecol. Indic. 2006, 6, 327–336. [Google Scholar] [CrossRef]
  29. Dunwoody, E.; Apan, A.; Liu, X.Y. Effects of spatial resolution on measurement of landscape function using the landscape leakiness calculator. In Proceedings of the Surveying and Spatial Sciences Conference (SSSC 2013): Collect, Connect, Capitalise, Canberra, Australia, 17–19 April 2013. [Google Scholar]
  30. Gillies, R.R.; Kustas, W.P.; Humes, K.S. A verification of the ‘triangle’ method for obtaining surface soil water content and energy fluxes from remote measurements of the Normalized Difference Vegetation Index (NDVI) and surface radiant temperature. Int. J. Remote Sens. 1997, 18, 3145–3166. [Google Scholar] [CrossRef]
  31. Qi, J.; Marsett, R.C.; Moran, M.S.; Goodrich, D.C.; Heilman, P.; Kerr, Y.H.; Dedieu, G.; Chehbouni, A.; Zhang, X.X. Spatial and temporal dynamics of vegetation in the San Pedro River basin area. Agric. For. Meteorol. 2000, 105, 55–68. [Google Scholar] [CrossRef]
  32. Liu, Y.; Fu, B.J.; Lv, Y.H.; Gao, G.Y.; Shuai, W.; Ji, Z. Linking vegetation cover patterns to hydrological responses using two process-based pattern indices at the plot scale. Sci. China Earth Sci. 2013, 56, 1888–1898. [Google Scholar] [CrossRef]
  33. Cai, C.F.; Ding, S.W.; Shi, Z.H.; Huang, L.; Zhang, G.Y. Study of applying USLE and geographical information system IDRISI to predict soil erosion in small watershed. J. Soil Water Conserv. 2000, 14, 19–24. [Google Scholar] [CrossRef]
  34. Schnitzer, S.; Seitz, F.; Eicker, A.; Guntner, A.; Wattenbach, M.; Menzel, A. Estimation of soil loss by water erosion in the Chinese Loess Plateau using Universal Soil Loss Equation and GRACE. Geophys. J. Int. 2013, 193, 1283–1290. [Google Scholar] [CrossRef]
  35. Zhang, Y.; Song, B.; Wang, J.; Sun, H. Soil erosion assessment in the watershed of Dehua District of Fujian Province. Adv. Mater. Res. 2013, 690–693, 890–894. [Google Scholar] [CrossRef]
  36. Zhou, Q.W.; Yang, S.T.; Zhao, C.S.; Cai, M.Y.; Luo, Y. A soil erosion assessment of the Upper Mekong River in Yunnan Province, China. Mt. Res. Dev. 2014, 34, 36–47. [Google Scholar] [CrossRef]
  37. Rao, E.M.; Ouyang, Z.Y.; Yu, X.X.; Xiao, Y. Spatial patterns and impacts of soil conservation service in China. Geomorphology 2014, 207, 64–70. [Google Scholar] [CrossRef]
  38. Wen, Y.; Liu, X.N.; Cheng, J. Assessment and feature analysis of soil erosion in mountainous area of Guangdong Province based on USLE. Bull. Soil Water Conserv. 2013, 33, 112–118. [Google Scholar] [CrossRef]
  39. Wischmeier, W.H.; Smith, D.D. Predicting Rainfall Erosion Losses, A Guide to Conservation Planning; USDA Agriculture Handbook: Washington, DC, USA, 1978; p. 537. [Google Scholar]
  40. Pan, M.H.; Wu, Y.Q.; Ren, F.P.; Dong, Y.F.; Jing, Y. Estimating soil erosion in the Dongjiang River Basin based on USLE. J. Nat. Resour. 2010, 25, 2154–2164. [Google Scholar] [CrossRef]
  41. Bai, J.H.; Zhu, B.C.; Guo, J.P. Study on the vegetation landscape spatial pattern of Wenyuhe watershed in Guandishan forest. J. Shanxi Agric. Univ. 2004, 24, 229–233. [Google Scholar] [CrossRef]
  42. Gao, C.Y.; Zhao, Q.H.; Liu, Q. Fractal characteristic of soil particle size under different vegetation types in riparian zone of the main stream of Beijiang Rive. Res. Soil Water Conserv. 2016, 23, 37–42. [Google Scholar] [CrossRef]
  43. Boer, M.; Puigdefábregas, J. Effects of spatially structured vegetation patterns on hillslope erosion in a semiarid Mediterranean environment: A simulation study. Earth Surf. Process. Landf. 2005, 30, 149–167. [Google Scholar] [CrossRef]
  44. Oost, K.V.; Govers, G.; Desmet, P. Evaluating the effects of changes in landscape structure on soil erosion by water and tillage. Landsc. Ecol. 2000, 17, 327–334. [Google Scholar] [CrossRef]
  45. Lin, S.W. New problems of population and family planning in Qingyuan. South China Pop. 2002, 17, 26–29. [Google Scholar] [CrossRef]
  46. Coelho, D.; Hughes, S.J.; Varandas, S.; Cortes, R.M.V. Conservation benefits of riparian buffers in urban areas: The case of the Rio Corgo (North Portugal). Fundam. Appl. Limnol. 2014, 185, 55–70. [Google Scholar] [CrossRef]
  47. Monteiro, J.A.F.; Kamali, B.; Srinivasan, R.; Abbaspour, K.; Gücker, B. Modelling the effect of riparian vegetation restoration on sediment transport in a human-impacted Brazilian catchment. Ecohydrology 2016, 9, 1289–1303. [Google Scholar] [CrossRef]
  48. Yan, H.; Zhan, J.; Liu, B.; Yuan, Y. Model estimation of water use efficiency for soil conservation in the lower Heihe River Basin, Northwest China during 2000–2008. Sustainability 2014, 6, 6250–6266. [Google Scholar] [CrossRef]
  49. Bautista, S.; Mayor, Á.G.; Bourakhouadar, J.; Bellot, J. Plant spatial pattern predicts hillslope runoff and erosion in a semiarid Mediterranean landscape. Ecosystems 2007, 10, 987–998. [Google Scholar] [CrossRef]
  50. Slattery, M.C.; Burt, T.P. Particle size characteristics of suspended sediment in hillslope runoff and stream flow. Earth Surf. Process. Landf. 1997, 22, 705–719. [Google Scholar] [CrossRef]
  51. Takken, I.; Beuselinck, L.; Nachtergaele, J.; Govers, G.; Poesen, J. Spatial evaluation of physically-based distributed erosion model (LISEM). Catena 1999, 37, 431–447. [Google Scholar] [CrossRef]
  52. Kupfer, J.A. Landscape ecology and biogeography: Rethinking landscape metrics in a post-FRAGSTATS landscape. Prog. Phys. Geogr. 2012, 36, 400–420. [Google Scholar] [CrossRef]
  53. Cerdà, A. The effect of patchy distribution of Stipa tenacissima L. on runoff and erosion. J. Arid Environ. 1997, 36, 37–51. [Google Scholar] [CrossRef]
  54. Qin, W.; Cao, W.H.; Guo, Q.K.; Yu, Y.; Yin, Z. Review of the effects of vegetation patterns on soil erosion and sediment yield. Acta Ecol. Sin. 2017, 37, 4905–4912. [Google Scholar] [CrossRef]
  55. Lesschen, J.P.; Schoorl, J.M.; Cammeraat, L.H. Modelling runoff and erosion for a semi-arid catchment using a multi-scale approach based on hydrological connectivity. Geomorphology 2009, 109, 174–183. [Google Scholar] [CrossRef]
  56. Sun, W.; Shao, Q.; Liu, J. Soil erosion and its response to the changes of precipitation and vegetation cover on the Loess Plateau. J. Geogr. Sci. 2013, 23, 1091–1106. [Google Scholar] [CrossRef]
  57. Sheng, J.A.; Liao, A.Z. Erosion control in South China. Catena 1997, 29, 211–221. [Google Scholar] [CrossRef]
  58. Chen, S.; Zha, X. Evaluation of soil erosion vulnerability in the Zhuxi watershed, Fujian Province, China. Nat. Hazards 2016, 82, 1589–1607. [Google Scholar] [CrossRef]
  59. Zhu, L.Q.; Zhu, W.B. Research on effects of land use/cover change on soil erosion. Adv. Mater. Res. 2012, 433–440, 1038–1043. [Google Scholar] [CrossRef]
  60. Woo, M.K.; Luk, S.H. Vegetation effects on soil and water losses on weathered granitic hillslopes, South China. Phys. Geogr. 2013, 11, 1–16. [Google Scholar] [CrossRef]
  61. Gyssels, G.; Poesen, J.; Bochet, E.; Li, Y. Impact of plant roots on the resistance of soils to erosion by water: A review. Prog. Phys. Geogr. 2005, 29, 189–217. [Google Scholar] [CrossRef]
  62. Laufer, D.; Loibl, B.; Märländer, B.; Koch, H.J. Soil erosion and surface runoff under strip tillage for sugar beet (Beta vulgaris L.) in Central Europe. Soil Till. Res. 2016, 162, 1–7. [Google Scholar] [CrossRef]
  63. Valentin, C.; D’Herbès, J.M.; Poesen, J. Soil and water components of banded vegetation patterns. Catena 1999, 37, 1–24. [Google Scholar] [CrossRef]
  64. Ludwig, J.A.; Wilcox, B.P.; Breshears, D.D.; Tongway, D.J.; Imeson, A.C. Vegetation patches and runoff-erosion as interacting ecohydrological processes in semiarid landscape. Ecology 2005, 86, 288–297. [Google Scholar] [CrossRef]
  65. Hou, J.; Wang, H.Q.; Fu, B.J.; Zhu, L.H.; Wang, Y.F.; Li, Z.S. Effects of plant diversity on soil erosion for different vegetation patterns. Catena 2016, 147, 632–637. [Google Scholar] [CrossRef]
  66. Berendse, F.; Ruijven, J.V.; Jongejans, E.; Keesstra, S. Loss of plant species diversity reduces soil erosion resistance. Ecosystems 2015, 18, 881–888. [Google Scholar] [CrossRef] [Green Version]
  67. Yue, J.; Wang, Y.L.; Li, C.C.; Wu, J.S. The conceptual framework of watershed landscape optimization concerning water environmental protection. Prog. Geogr. 2007, 26, 38–46. [Google Scholar] [CrossRef]
  68. Duan, L.; Huang, M.; Zhang, L. Differences in hydrological responses for different vegetation types on a steep slope on the Loess Plateau, China. J. Hydrol. 2016, 537, 356–366. [Google Scholar] [CrossRef]
Figure 1. Location of the Beijiang River riparian buffer zone.
Sustainability 10 01571 g001
Figure 2. The soil type of the study area.
Sustainability 10 01571 g002
Figure 3. Factors for the calculation of USLE.
Sustainability 10 01571 g003
Figure 4. Schematic of the different vegetation pattern scenarios.
Sustainability 10 01571 g004
Figure 5. Relationship between the erosion modulus and LI.
Sustainability 10 01571 g005
Figure 6. Changes in the LI values under different vegetation pattern scenarios.
Sustainability 10 01571 g006
Figure 7. Vegetation regulation in Shaoguan (a); Qingyuan (b); and Sanshui (c) regions.
Sustainability 10 01571 g007
Table 1. Method and purpose of vegetation regulations for soil and water conservation.
StrategyPurpose
Method 1Vegetation is parallel to the contour lineIntercepting runoff and sediment flowing from upland to lowland [9]
Method 2Vegetation is parallel to the river courseReducing riverbank scouring and soil erosion [41]
Method 3Vegetation is distributed at the river outletDecreasing the risk of sediment entering the river to pollute water [32]
Table 2. Information on different regions around the study area.
RegionsArea Proportion (%)Vegetation Coverage (%)Average Slope (°)LI Value
Shaoguan3.8649.096.330.46
Yingde19.7166.5410.360.15
Huadu0.2243.302.150.42
Wengyuan0.2169.8315.840.07
Qingyuan14.1352.035.800.46
Qujiang19.4663.499.390.13
Renhua0.7467.459.140.13
Shixing8.9059.848.650.18
Sihui1.7240.814.660.51
Nanxiong6.5451.867.330.12
Fogang0.6668.098.870.09
Ruyuan2.9170.2214.880.15
Lechang15.5267.7414.260.10
Sanshui5.4343.975.050.53

