Characteristics of Corporate Contributions to the Recovery of Regional Society from the Great East Japan Earthquake Disaster


1
School of Engineering, Department of Urban Engineering, The University of Tokyo, 7-3-1 Hongo, Bunkyo-ku 113-8656, Japan
2
Institute of Social Science, The University of Tokyo, 7-3-1 Hongo, Bunkyo-ku 113-0033, Japan
3
Faculty of Science and Engineering, Chuo University, 1-13-27 Kasuga, Bunkyo-ku 112-8551, Japan
*
Author to whom correspondence should be addressed.
Sustainability 2018, 10(6), 1717; https://doi.org/10.3390/su10061717
Submission received: 27 March 2018
/
Revised: 9 May 2018
/
Accepted: 20 May 2018
/
Published: 24 May 2018
(This article belongs to the Special Issue Resilience and Sustainability of Civil Infrastructures under Extreme Loads)
Abstract
:Municipalities in areas along the northeast coast of Japan were severely affected by the Great East Japan Earthquake. It was difficult for these municipalities to provide support to all devastated areas. It is important for communities in devastated areas to be resilient in order to autonomously and efficiently recover from natural disasters. This study focused on corporations, since they have various resources that can support disaster recovery. A postal questionnaire was sent to 1,020 corporations that included various industry types and small corporations located in Iwanuma and Natori, which were damaged by the Great East Japan Earthquake. The response rate was 39.22%. We analyzed the data using a logistic regression model. The study findings are as follows: (1) a total of 32.75% of corporations provided support for recovery after the disaster; (2) the ratio of corporations that provided actual support was lower than that of those that only had awareness of contributions; (3) the strongest characteristic was having not only awareness but also the opportunity to conduct support activities before the occurrence of disasters to enhance the efficient recovery of regional society; and (4) the characteristics of support differed according to industry type, location, and number of employees under certain conditions.
1. Introduction
Following large-scale disasters such as the Great East Japan Earthquake, it is difficult for municipalities to provide support to all devastated areas. Communities in devastated areas need to have resilient routine disaster response structures in place during non-disaster times (hereinafter referred to as “ordinary times”) in order to conduct efficient recovery, reconstruction, and revitalization. When considering such structures in devastated areas, it can be seen that corporations are one of the main actors that can support regional society by providing various resources such as human resources and financial support for recovery and disaster mitigation [1,2]. Regarding the efficient recovery, reconstruction, and revitalization of regional society after the Great East Japan Earthquake, many previous empirical studies have reported and focused on residents as the main actors [3,4,5,6]; however, only a few empirical studies have targeted corporations as disaster recovery actors. Most discussions about corporate activities in large-scale disasters have been focused on the recovery of the corporation itself or on business continuity planning (BCP) [7,8,9], corporate social responsibility (CSR) [1,10], capacity evaluation of corporations in disasters [11], or changes in employment or labor conditions [12]. Regarding corporate contributions to the recovery of regional societies after disasters, several studies focused on corporations’ awareness of the “possibility of providing support” [13,14,15,16,17]. Previous empirical studies have identified “facts regarding corporate contributions” through the cases of the Hanshin–Awaji Earthquake disaster [18], the Niigata-ken Chuetsu-oki Earthquake [19], and Hurricane Katrina [1,19]. These studies targeted relatively large corporations that were listed on the Tokyo Stock Exchange, or were among the 1% Club of the Japan Business Federation or the most profitable corporations in the United States [1]; small and local corporations were not included. There is remarkably little research on disaster support by local corporations located in devastated areas right after disasters. Regarding corporations’ contributions to disaster recovery, one study clarified the actual support to local communities provided by corporations located in devastated areas [20], although it only focused on local constructors after the Hanshin–Awaji Earthquake disaster.
While there is research related to the BCPs of local restaurants in devastated areas [9], there are few studies regarding the role of small corporations after the Great East Japan Earthquake. Through the abovementioned previous studies, it is clear that with regard to corporate contributions to recovery, reconstruction and revitalization after the Great East Japan Earthquake, no study has targeted corporations across various industry types, including small corporations whose headquarters are located in devastated areas. Moreover, no study has examined the gap between contributing awareness and the actual support provided by corporations. It is important to identify the characteristics of corporations that contribute to the recovery after disasters in order to formulate a regional disaster prevention plan and determine the characteristics of a regional society that can efficiently recover after disasters. Therefore, this study aims to understand the actual conditions of corporate contributions to the recovery of regional society after the Great East Japan Earthquake, and to identify the characteristics of the corporations that provided support.
2. Literature Review
In order to consider corporate contributions to recovery plans or local disaster prevention planning, it is necessary to identify the following: (1) the number of corporations that provided some support for the recovery of regional society; (2) the characteristics of those corporations; (3) the geographical spread or agglomeration of the corporations; and (4) the possibility of providing support by corporations in different situations. In this study, we focused on points 1 and 2 above as basic information for planning purposes. In this section, we review the current research in order to clarify which corporation variables are important to the planning process.
There are many basic theories related to corporations, focusing on economy [21], contract [22], behavior [23], evolution [24], and growth [25]. In this study, we focused on the theory of corporate behavior, since providing support is one of the behaviors of corporations. Since corporate behavior traditionally focuses on profit maximization, in our research, in order to understand this change, we focused on the corporate decision maker as a representative of the corporation. This approach is supported by Cyert and March [23].
Previous studies have shown a relationship between size, profitability, industry type, shareholder relation, financial factors and ownership structure among UK corporations and charitable donations [26,27,28].
Regarding corporate philanthropic disaster responses, relationships were found between response behavior and corporate size, profitability, geography, available cash, and leverage after the Sichuan earthquake in China in 2008 [29]. Murosaki and Iwami [18] examined the contents and triggers of support provided by 378 corporations after the Hanshin–Awaji Earthquake in Japan in 1995. Ohnishi [20] examined support contents and triggers, as well as corporation size, location, community relationship, and other local activities of 218 local construction corporations or carpenters after the Hanshin–Awaji Earthquake to identify the role of corporations in disasters. Toyota and Shoji [19] examined the provided support and industry type in order to identify the quantitative trends of the corporate contributions of 610 corporations during the Niigata-ken Chuetsu Earthquake in Japan in 2004, and of 345 corporations during Hurricane Katrina in the US in 2005.
We summarized the corporate variables in Table 1 to better organize the current research. We selected size, industry type, financial situation, community relationship, geographical location, and other local activities as important variables to illustrate recovery or local disaster prevention planning. In the next section, we examine actual conditions using results from an interview survey to formulate hypotheses.
3. Case Study
This study is based on the assumption that corporations located in devastated areas provided support for the recovery of the regional society after the Great East Japan Earthquake. The interview survey conducted first aimed to understand the context of corporate contributions to recovery; after the survey was conducted, hypotheses were formulated to explain the trends.
3.1. Interview Survey
3.1.1. Outline of the Interview Survey
This interview survey was conducted with the presidents or directors of the disaster prevention departments of corporations located in Iwanuma, which was selected as the study area. This area has been frequently used to interpret the resilience of regional society [3,4,5] and social capital or health [30,31,32,33,34,35]. The implementation period was from April 2012 to December 2014. The interviews were conducted to gain an understanding of the actual situation of the support provided by the corporations. From the survey results, we formulated four hypotheses to identify the characteristics of corporations’ disaster recovery support. With assistance from the Iwanuma City Society of Commerce and Industry, we selected six corporations located in devastated areas and six corporations from other areas. The survey method involved semi-structured interviews with questionnaires. An outline of the survey is shown in Table 2. We interviewed the corporations regarding disaster incidents, their thoughts, their actions, and the reasons for their actions from the time of their establishment to the current period, and organized the data in chronological order. Based on this context, we also interviewed the participants regarding the details of the provided support and the trigger of the support from right after the disaster until December 2011.
3.1.2. Ethics
Since the Great East Japan Earthquake, the authors have taken part in support activities and planning for the recovery and revitalization of devastated areas, and formed relationships with local residents, presidents of local corporations, and local public officers. One of the authors has fundamental knowledge of corporate management acquired from seven years of experience managing his own corporations; this author conducted the interview survey, which was carefully administered to each corporation several times and across several years starting in April 2012. We never forced the interviewees to share their story regarding their experience of anxiety and fear related to the disaster. We also created a chronology of the data collected from the corporations based on the survey results and gave them feedback after the interview. We obtained their consent to publish the relevant parts of this research for academic purposes without revealing the names and year of establishment of each corporation.
3.2. Understanding the Situation of Corporate Contributions to the Recovery of Regional Society
Table 3 shows a summary of corporate contributions to the recovery of regional society based on the interview survey results. Among the 12 corporations, five provided support for the recovery of regional society.
We found the following categories of support: “Daily commodities”, “Equipment and materials”, “Human resources”, “Useful information”, and “Temporary use of land and buildings”.
In this study, “Some support” was defined as the provision of one or more of the following: “Funding”, “Daily commodities”, “Equipment and materials”, “Human resources”, “Useful information”, and “Temporary use of land and buildings”.
Table 4 shows the descriptions of support for recovery provided by the corporations.
3.2.1. Daily Commodities Support
Based on the interview survey, it was found that two corporations provided support in the form of daily commodities. Corporation A provided water and food provisions, which were stocked by them during ordinary times, to the local evacuation center of the neighborhood association. Corporation L provided water and food provisions, blankets, and towels, which were collected by the corporation right after the disaster, to an elementary school. Both corporations had a relationship with their support recipients prior to the disaster. They said, “we saw a terrible scene that we had never seen before. We provided support to people affected by the disaster because we could not predict our corporation’s future, such as when it would be possible to resume business”.
3.2.2. Equipment and Materials Support
We found that five corporations provided support in the form of equipment and materials.
Corporation A helped restore a road in the nearby region, which was essential for residents, using their equipment for three days after the disaster. Starting on the fourth day, they could not conduct this support activity because the corporation received a formal business request from municipalities regarding their support, so they could not devote time to informal support.
Corporation E cooperated with corporations D and F and removed the mud and rubble piled up on roads and around buildings using heavy machines. Through their connections with unions in the same industry, they borrowed heavy machines, fuel, and tools for construction. They had participated in activities of the residential association during ordinary times, so the land to dump the removed mud and rubble was provided by the board members of the neighborhood association. Corporation E said that “it was necessary to restore roads in the regional area in order to continue our business and to receive recovery support from the municipality and government”. Corporations D and F said that they could not think about anything else apart from providing support because the disaster happened in their home town. They worked to solve the problem by cooperating with other corporations and procuring necessary resources together.
Corporation L provided materials and tools for the repair of the floors of houses located in areas devastated by the tsunami. The trigger for providing the support was that they received a request for construction materials from a builder who lived in an area that was completely destroyed by the tsunami. Corporation L also provided paper and fuel to doctors, nurses, pharmacies, and clinical psychologists who were engaged in medical treatment in devastated areas. The trigger for providing this support was a referral from the staff of the Social Welfare Council.
3.2.3. Human Resources Support
We found that five corporations provided support in the form of human resources. Corporations A, D, and E provided resources to the neighborhood association to remove mud and rubble. Corporation E also provided resources to a kindergarten to remove mud and rubble using construction tools. Corporation L provided resources to the neighborhood association to repair the floors of houses damaged by the tsunami.
3.2.4. Useful Information Support
Four corporations provided support in the form of useful information.
Corporation A provided local information (conditions of damage, operation status, and employee status of Iwanuma Rinku Industrial Park) to residents and supporters who assisted in the rescue work from the outside cities. The trigger for this support was a request from the residents after the disaster.
Corporation D provided information regarding local conditions and about the safety of children who lived in the region to an elementary school. The trigger of this support was that the elementary school was one of the local evacuation centers.
Corporation F provided information regarding land for the possible shifting of the local kindergarten. This corporation already had a relationship with the staff of the kindergarten and received a request to provide information after the disaster. Subsequently, Corporation F collected information from some real estate corporations, and gave the kindergarten staff this necessary information.
Corporation L provided information on local conditions and about people with medical needs to medical workers. The trigger of this support was that they were introduced to these workers by the Social Welfare Council.
3.2.5. Temporary Use of Land and Buildings Support
One corporation provided support in the form of granting permission for the temporary use of land and buildings.
Corporation A provided permission for the temporary use of land and buildings to a mutual fire association and police officers for their activities.
3.2.6. Funding Support
None of the corporations interviewed in this survey provided funding support. However, Corporation I provided heavy machines, fuel, and funds for Corporation E in the same industry, which in turn provided support for the recovery of regional society. In general, as seen with the Japan Platform [36] or the 1% Club of the Japan business federation [37], there were many cases where corporations provided funding support as donations. Therefore, it is possible that corporations that were located in the devastated areas also provided funding support to regional society.
3.3. Understanding the Characteristics of the Corporations That Provided Support for the Recovery of Regional Society
Based on the results of the interview survey and literature review, the characteristics of the corporations that provided recovery support were extracted in order to formulate hypotheses.
3.3.1. Damages Caused by the Tsunami
Based on the literature review, we decided that the most important corporation variables were financial situation and geographical location. In this study, “damages caused by the tsunami” was a comprehensive variable. Four of the five corporations that provided support for the recovery of regional society were damaged by the tsunami, which caused great destruction. Nonetheless, corporations damaged by the 2011 tsunami provided support to regional society. Therefore, it is possible that one characteristic that influences corporations to provide recovery support is damage caused by the tsunami.
3.3.2. Number of Employees
Based on the literature review, we decided that size was also an important variable. In this study, “Number of employees” was adopted as the indicator to measure size. The survey results indicated that four of the five corporations that provided recovery support had a small number of employees. In cases where the entire region suffered from the tsunami, it was necessary to restore roads in cooperation with residents. For this reason, small-scale corporations tend to provide recovery support, and there is a possibility that the number of employees in a corporation is one characteristic that leads to recovery support.
3.3.3. Awareness of Corporations to Contribute to the Recovery of Regional Society
Based on the literature review, we selected community relations and local activities as important variables. In this study, “Awareness of corporations to contribute to the recovery of regional society” was adopted as an indicator to describe community relations and local activities. In general, corporations that would like to contribute to the recovery of regional society after disasters can easily provide that support; five of the eleven corporations that wanted to contribute provided recovery support. In addition, five of the seven corporations that had an awareness of contributions and conducted practical activities provided recovery support. Thus, it is possible that awareness and the carrying out of related activities during ordinary times is correlated with recovery support.
3.3.4. Industry Type
We found five industry types that provided support for the recovery of regional society. After the Great Hanshin–Awaji Earthquake, local construction corporations provided recovery support in the form of “Rescue from collapsed houses”, “Providing equipment and materials”, and offering “Human resources” [20]. In addition, a survey conducted on the participation and contribution of corporations in Sendai, Ota Ward, Shizuoka, Nagasaki, and Kobe reported different results for the support provided by each industry type [13]. Therefore, there is a possibility that a corporation’s industry type is a relevant characteristic.
3.4. Formulating Hypotheses
Based on the characteristics discussed in the previous section, the following hypotheses were formulated. Hypothesis 1 was formulated based on “damages caused by the tsunami”.
Hypothesis 1.
No significant difference in damage exists between corporations responding and those not responding to the disaster.
Most corporations examined in this research are located on alluvial flats. Therefore, it is possible to estimate the damage they suffered based on the distance between their location and the nearest coastal line. To examine this hypothesis, it was necessary to investigate the differences between the recovery support provided by corporations in devastated areas and that provided by those in other areas.
Hypothesis 2 was formulated based on “number of employees”.
Hypothesis 2.
No significant difference exists in the number of employees between corporations responding and those not responding to the disaster.
For this, it was necessary to investigate the differences between small-scale, medium-scale, and large-scale corporations in terms of their contributions to recovery.
Hypothesis 3 was formulated based on “awareness of contributions to the recovery of regional society”.
Hypothesis 3.
Corporations that have an awareness of contributions to recovery support and had already conducted related activities before the disaster are more likely to provide support for the recovery of regional society than are other corporations.
To test this hypothesis, it was necessary to investigate the differences in recovery support provided by different corporations, corporations’ awareness of contributions to recovery and related activities conducted before the disaster, and their capacities to contribute to recovery.
Hypothesis 4 was formulated based on “corporations’ industry type”.
Hypothesis 4.
The content of support differs according to industry types.
For this, it was necessary to investigate the differences in recovery support between corporations with different industry types or based on the location of their main customers.
4. Research Design and Method
This research involved understanding the circumstances of support provided by corporations for the recovery of regional society after disasters, and identifying the specific characteristics of such corporations that provide recovery support.
4.1. Study Area
This study selected Iwanuma as the study area. In addition, Natori was included as a study area because Sendai Airport is located near the boundary between Natori and Iwanuma, and there was a large industrial zone near the Sendai Airport.
The industrial zone of the Iwanuma Rinku Industrial Park was adequate for this study to investigate the diverse characteristics of corporations, including small-scale and large-scale corporations in terms of the number of employees. Figure 1 shows the location of corporations on the land use map of the study site. Table 5 shows an overview of the damages from the Great East Japan Earthquake [38,39].
4.2. Data Collection
4.2.1. Questionnaire Survey
This survey collected data in order to understand the actual situation of recovery support and to test the hypotheses discussed in the previous section. A mail survey was administered to 1020 corporations from January to August 2015, whose headquarters were located in Iwanuma or Natori. Table 6 shows the outline of this survey. These corporations were chosen from a corporate database of Teikoku Databank, Ltd.; those categorized under “political, economic, and cultural group” and “local government” were not included in the questionnaire survey. The database is a corporate database of 1020 corporations corresponding to 36.82% of all 2941 corporations in the target area.
4.2.2. Description of the Questionnaire
The questionnaire items were categorized as shown in Table 7.
Provided Support for the Recovery of Regional Society after the Disaster
In order to understand the kind of support provided by the target corporations after the Great East Japan Earthquake, we asked questions about support recipients, the content of support, and the relationship between the corporation and support recipients before the disaster. “Support recipients” included “individuals”, “corporations of the same industry”, “corporations of other industries”, “neighborhood association”, “school (elementary, junior high, high), kindergarten, etc”., “hospital/medical worker”, “police station/police officers”, “fire station/mutual fire association”, “NPO/voluntary organization”, “Social Welfare Council/public interest group”, “university/research institution”, “economic organizations such as Chamber of Commerce”, “enterprise association and exchange organization”, “Iwanuma or Natori”, “Miyagi prefecture”, and “government”.
Among these recipients, “neighborhood association”, “school (elementary, junior high, high), kindergarten, etc”., “hospital/medical worker”, “police station/police officer”, “fire station/mutual fire association”, and “Iwanuma or Natori” were defined as the regional society for this research. The content of the support was divided into “funding support”, “everyday commodities such as water and food”, “equipment and material support”, “human resources”, “useful information”, and “temporary use of land and buildings”.
Regarding the relationship between the corporation and support recipients before the disaster, the questionnaire items included “a relationship before the disaster”, “no relationship before the disaster and contact made only after the disaster”, “no relationship before the disaster and were introduced by others after the disaster”, and “other”. For the contents of the relationship, the questionnaire items also included “have not conducted any particular activities”, “have done some business”, “have done some community activities”, “have done some exchange information” and “have done other activities”.
Damages Caused by the Tsunami
Regarding the damages suffered by the corporations due to the disaster, “approximate value of the damages up to September 2011 from the occurrence of the disaster” and “details of the damages” were investigated. The factors included in this questionnaire item were “equipment damage”, “inventory damage”, “surging personnel costs”, “surging outsourcing costs”, “decrease in customers”, “decrease in sales”, “surging purchases”, “increase in borrowing”, and “other”, with the option to select multiple factors. In addition, changes in “sales” and “employees” based on the latest accounting period and the accounting period before the disaster were investigated. The existence of a “shutdown period” was also investigated.
Awareness of Contributions and Support Activities for the Recovery of Regional Society
In order to determine target corporations’ awareness of contributions before the disaster, we included and investigated the following factors in this questionnaire item: “having awareness of contributions to regional society, and having already conducted related activities before the disaster occurred”, “having awareness of contributions to regional society, but having conducted no related activities before the disaster occurred”, “not having the capacity to contribute”, and “having never thought about making contributions”.
Fundamental Characteristics of Corporations
As fundamental characteristics before and after the disaster, “number of employees”, “annual sales”, “industry type”, “business contents”, “major business partner”, “location”, and “contact information” were investigated.
4.2.3. Information on the Locational Attributes of the Corporations
Regarding the locational attributes of the corporations, “distance between the corporation and the coastline” and “land use of the region around the corporation” were calculated based on the location information of the corporation. For calculating the “distance between the corporation and the coastline”, the National Land Numeral Information—Coastline data (FY 2006) [40] was used. Regarding information of land use, using land use subdivision mesh data (FY 2009) [40], a circular buffer with a radius of 500 m centered on the location information of the corporation was created, and the land use ratio in the buffer was calculated.
4.2.4. Ethics
We obtained the consent of the survey participants in advance through an informed consent statement [41] that included the following: (1) a brief description of the purpose and procedure of the research, including the expected duration of the study; (2) a statement regarding discomfort associated with participation by being reminded of the terrible experiences of the disaster; (3) a guarantee of the anonymity and confidentiality of the collected data; (4) the identity of the corresponding researcher and the location of information about participants’ rights or questions regarding the study; (5) a statement that participation is completely voluntary and can be terminated at any time without penalty; (6) a statement describing alternative procedures that may be used; (7) a statement regarding providing a ballpoint pen as compensation to participants; and (8) an offer to provide a summary of the findings.
4.3. Logistic Regression Model
The analysis was carried out using a logistic regression model to extract explanatory variables with a strong explanatory power for response variables. There were two values of response variables in this study (provided support or did not provide support), translated into the logit as −∞ +∞ values, which were adopted to comprehend their relationship with the explanatory variables. In general, the logistic regression model can be expressed using the following formula.
The provability of the provision of each support by corporation is p(x) and the provability of the non-provision of each support by corporation is 1 − p(x) in this study. The fixed value (constant) is b0, the regression coefficient of the xp is bp, and each explanatory variable is presented as x.
In the selection of explanatory variables, multiple sets of data largely influential on the response variables were selected as explanatory variables from the pre-processing data other than the response variables, using the stepwise method. The variance inflation factor (VIF) was also calculated to determine multicollinearity in each analysis. The results of the VIF are shown as notes in corresponding Tables. The sets of explanatory variables in each model were optimized by AIC (Akaike’s information criterion) to start with the full set of explanatory variables. In addition, the Wald confidence interval was used to investigate whether 0 is or is not included in the reliable section. The statistical analysis software R (version 3.3.2) was used for the analysis.
4.3.1. Response Variables
The response variables were the presence or absence of contributions for recovery of regional society and included the following: “some support”, “funding”, “daily commodities such as water and food”, “equipment and materials”, “human resources”, “useful information”, and “temporary use of lands and buildings”. In this research, we analyzed seven cases that had sets of each response variable and each explanatory variable.
4.3.2. Explanatory Variables
The explanatory variables in the analysis were “number of employees (dummy)”, “the ratio of damage amount to annual sales [%]”, “industry type (dummy)”, “location of main customers (dummy)”, “awareness of contributions to the recovery of regional society before the disaster (dummy)”, “damages caused by the tsunami based on distance from coastal line (dummy)”, and “ratio of the surrounding land use [%]”.
5. Results
5.1. Results of the Questionnaire Survey
The results of the questionnaire survey are shown in Table 8. The questionnaires were mailed to 1020 corporations located in Iwanuma or Natori. The response rate was 39.22% (400 corporations) by 31 August 2015, which was better than initially assumed. This was possibly due to two reasons. First, most corporations had already recovered from damages because four years had passed since the disaster. Hence, they were able to respond to the mail. Second, since the disaster, the authors had been engaged in revitalization activities and support planning in the devastated area, and they had thus formed a relationship with the residents.
5.1.1. Industry Types and Response Rates
Regarding the number of respondents by industry type, the number exceeded 40 (10%) for “Construction” (120 corporations), “Wholesale and Retail Trade” (78 corporations), “Manufacturing” (42 corporations), and “Miscellaneous Business Services, n.e.c”. (40 corporations).
Figure 2 shows the response rates for each industry type of the 1123 corporations, including 103 corporations that were closed down between March 2011 and December 2014. The response rates for most industry types were over 30.0%. It should be noted that the response rate of “Finance and Insurance” was 0%.
Figure 3 shows the location of the major business partners. The results were “within the same city limits” (39.50%), “outside the city and within Miyagi Pref. limits” (55.50%), and “outside of Miyagi Pref. limits” (29.75%).
5.1.2. Number of Employees and Annual Sales
Figure 4 shows the classification of the number of employees. The average number of employees was 32.23, with a median of 7, maximum of 3049, and minimum of 0. Corporations with more than 100 employees are defined as large-scale corporations in Japan; those with more than 20 but fewer than 100 are defined as medium-scale corporations; and those with fewer than 20 employees are defined as small-scale corporations. There is no definition of “micro corporation” in Japan. In this study, corporations with seven or less employees were defined as micro corporations. Therefore, the target corporations in this survey were classified into five categories according to the number of employees: “the number of employees is 0” (4.00%), “the number of employees is more than 1 but fewer than 7, micro corporation” (46.50%), “the number of employees is more than 8 but fewer than 20, small corporation” (29.50%), “the number of employees is more than 21 but fewer than 100, medium corporation” (16.00%), and “more than 100 employees, large corporation” (4.00%).
Figure 5 shows the classification of annual sales. The average annual sales were 1613.47 million yen with a median of 120 million yen, maximum of 155,381 million yen, and minimum of 0.18 million yen. Considering annual sales, small corporations were included in the target corporations, since the sales of most corporations were less than 500 million JPY.
Based on the number of employees and annual sales, it was confirmed that there were micro, small, medium, and large corporations among the target corporations. The average number of employees in the corporations in Iwanuma and Natori based on the Economic Census for Business Activity in Japan (FY 2009) [42] was about 11, and among the target corporations in this survey, the proportion of small corporations was relatively higher, since the median in this survey was less than that in the census. According to the census, the ratio of large corporations in the target area was 1.10% and the ratio of medium corporations was 10.12%. The ratio of large corporations in our survey was 4.00% and the ratio of medium corporations was 16.00%. Therefore, the data of the survey are comparable to those of the target area.
5.1.3. Damage Caused by the Disaster
Figure 6a shows the classification of the ratio of damage amount to annual sales. The average was 36.83%, with a median of 29.38%, maximum of 1500.00%, and minimum of 0.00%. It was found that most corporations were damaged by the disaster, since the rate of corporations with no damage was only 6.25%.
Figure 6b shows the types of damages: “equipment damage” (59.25%), “decrease in sales” (45.75%), “decrease in customers” (29.75%), “inventory damage” (26.50%), “increase in borrowing” (16.00%), “surging purchases” (13.75%), “surging outsourcing costs” (13.25%), and “surging personnel costs (9.50%)”. Further, 16.80% of corporations had to temporarily discontinue their business after the Great East Japan Earthquake.
5.1.4. Awareness of Contributions
Figure 7 shows the corporations’ awareness of contributions to the recovery of regional society before the disaster. The results were “having awareness of contributions, and having already conducted related activities before the disaster (HAA)” (29.25%), “having awareness of contributions, but having conducted no related activities before the disaster (HAN)” (28.00%), “not having the capacity to contribute before the disaster (NHC)” (35.25%), “having never thought about making contributions before the disaster (NTC)” (2.25%).
5.1.5. Location Attributes
The average distance from the coastline was 7.40 km, with a median of 7.31 km, a longest value of 17.45 km, and a shortest value of 1.12 km. Figure 8 shows the classification of damages caused by the tsunami based on the distance between the location of each corporation and the coastline. The results were as follows: the ratio of corporations located in the completely destroyed area (<1.50 km) was 1.25%, that of those located in the large-scale partially destroyed area (1.50 to 3.00 km) was 9.25%, that of those located in the partially destroyed or flooded areas (3.00 to 5.50 km) was 11.0%, that of those located in districts without tsunami damage near the devastated area (5.50 to 11.00 km) was 65.25%, that of those located in districts without tsunami damage far from the devastated area (>11.00 km) was 10.50%, and that of corporations with unknown locations was 2.75%. Many corporations were located in districts without tsunami damage near the devastated area, since Iwanuma station and Natori station are the main railway stations of both cities.
Regarding the land use ratio of the area surrounding the corporations, the results were as follows: “rice fields” (19.12%), “other agricultural lands” (5.36%), “forests” (4.87%), “wastelands” (0.48%), “buildings” (34.83%), “roads” (0.57%), “golf course area” (0.20%), and “river, lake, and pond area” (3.10%). As shown in Figure 1, many corporations were located in the commercial area near railway stations. In the tsunami-affected area, most corporations were located in the industrial park or the eastern residential area.
5.1.6. Provided Support for the Recovery of Regional Society
Figure 9 shows the ratio of corporations that made contributions. The corporations that provided some support to recipients represented 53.50% of the total. The ratio of corporations that provided support for the recovery of regional society was 32.75%.
Figure 10 shows the content of support provided for the recovery of regional society. The results are as follows: “human resources” (59.54%), “equipment and materials” (45.80%), “daily commodities such as water and food” (38.93%), “useful information” (15.27%), “funding support” (13.7%), and “temporary use of land and buildings” (11.45%).
Figure 11 shows the results of the questionnaire item regarding the relationship between the corporations and support recipients. The ratio of corporations that had a relationship with the support recipients before the disaster was 74.50%.
Figure 12 shows the results of the questionnaire item regarding the contents of the relationships. The ratio of “have not conducted any particular activities” was 50.40%.
Considering the characteristics of corporations discussed in the previous section, the following parts discuss the results regarding the ratio of corporations that provided each type of support for the recovery of regional society.
5.1.7. Differences between Groups Categorized by Damages Caused by the Tsunami
Figure 13 shows the rate of recovery support provided by corporations classified according to the damages caused by the tsunami. First, the response rates in each location were as follows: “completely destroyed area” (35.71%), “large-scale partially destroyed area” (56.92%), “partially destroyed or flooded area” (57.14%), “districts without tsunami damage near the devastated area” (36.97%), and “districts without tsunami damage far from the devastated area” (33.54%).
Next, the percentage of corporations that provided some support is as follows: “completely destroyed area (0.00%)”, “large-scale partially destroyed area” (24.32%), “partially destroyed or flooded area” (31.82%), “districts without tsunami damage near the devastated area” (34.10%), and “districts without tsunami damage far from the devastated area” (30.19%).
The percentage of corporations based on the type of support provided is as follows: regarding “funding support”, the percentage of corporations that provided this support was 0.00% in the devastated areas. Regarding “daily commodities support”, the percentage of corporations that provided this support in each district ranged from 10.81% to 13.21%, and it was found that there were no significant differences based on damages. Regarding “equipment and materials support”, the percentage of corporations that provided this support in each group based on this classification ranged from 13.79% to 16.22%, and no significant differences were found between the groups. Regarding “human resources support”, the percentage of corporations that provided this support in the districts without tsunami damage near the devastated area was 23.37%, higher than that in the other districts. Regarding “useful information support”, as the distance from the coastline decreased, the rate of corporations that provided this support increased. Regarding “temporary use of land and buildings support”, as the distance from the coastline decreased, the rate of corporations that provided this type of support increased.
5.1.8. Differences between Groups Categorized by the Number of Employees
Figure 14 shows the results of recovery support provided by corporations classified according to the number of employees. The percentage of corporations in each group that provided some support is as follows: 0 (25.00%), 1–7 (33.87%), 8–20 (29.66%), 21–100 (35.94%), and more than 101 (37.50%).
The percentage of corporations that provided each type of support is as follows: regarding “funding support”, the rate of corporations that provided this support in each group ranged from 1.56–6.25%, and it was found that there were no significant differences based on the size of the corporation. Regarding “daily commodities support”, the rate of corporations that provided this support in each district based on this classification ranged from 9.32% to 25.00%, and the rate of corporations that provided this support was higher in the “over 101 employees” group than in the other groups. The rate of corporations in this group that provided this support was also higher than the rate of corporations from this group that provided other types of support. Regarding “equipment and materials support”, the rate of corporations that provided this support in each group ranged from 6.25% to 23.44%, and the rate of corporations that provided this support in the “21–100 employees” group was higher than in the other groups. Regarding “human resources support”, the rate of corporations in each group that provided this support ranged from 6.25% to 25.0%, and the rate of corporations in the “over 101 employees” group was lower than in the other groups. Regarding “useful information support”, the rate of corporations that provided this support in each group ranged from 2.54% to 9.38%, and no significant differences between the groups were found. Regarding “temporary use of land and buildings support”, the rate of corporations in each group that provided this support ranged from 0.00% to 6.25%, and the rate of corporations that provided this support in the “0 employee” group was 0.00%.
5.1.9. Differences between Groups Classified by Their Awareness of Contributions
Figure 15 shows the rate of corporations that provided each support based on the classification by corporations’ awareness. The results are as follows: “having awareness of contributions to the recovery of regional society, and having already conducted related activities (HAA)” (55.56%), “having awareness of contributions to the recovery of regional society, but having conducted no related activities earlier (HAN)” (24.11%), “not having the capacity to contribute (NHC)” (20.14%), and “having never thought about making contributions (NTC)” (33.33%). The ratio of corporations that have an awareness of contributions was 57.25% (229 corporations). However, among these corporations, the ratio of those that also provided support was 40.17% (92 corporations). The number of corporations in the “having never thought about making contributions” group was fewer than that in the other groups. The rate of corporations that provided support in the “having awareness of contributions to the recovery of regional society, and having already conducted related activities” group was higher than that in the other two groups for all types of support.
Differences between groups according to industry type
Figure 16 shows the rate of corporations in each industry that provided each type of support. The response rate of each industry type is shown in Figure 2. The rate of corporations that provided any support in each industry type is as follows: “Construction” (40.83%), “Wholesale and Retail Trade” (34.62%), “Miscellaneous Business Services, n.e.c”. (29.55%), “Manufacturing” (23.81%), “Medical, Health Care, and Welfare” (31.03%), “Transport and Postal Services” (12.50%), “Real Estate and Goods Rental and Leasing” (35.00%), “Living-related and Personal Services and Amusement Services” (36.36%), “Electricity, Gas, Heat, and Water Supply” (30.00%), “Accommodation, Eating, and Drinking Services” (50.00%), “Information and Communications” (25.00%), “Education, Learning Support” (0.00%), “Scientific Research, Professional, and Technical Services” (33.33%), “Agriculture, Forestry, and Fisheries” (50.00%), and “Mining and Quarrying of Stone” (0.00%).
The rates of corporations in each industry type whose response rate was over 30.00%, whose sample was over 1.00% of the target corporations (N > 11), and who conducted each type of support, are discussed below.
Regarding “funding support”, the ratio of corporations that provided support in each industry type ranged from 0.00% to 10.00%, and no significant differences between industry type were found.
Regarding “daily commodities support”, the ratio of corporations that provided support in each industry type ranged from 4.17% to 50.00%, and the ratio of corporations that provided support in the “Accommodation, Eating, and Drinking Services” group was the highest in this survey. The ratios in the “Manufacturing” and “Construction” groups were also higher than those of the other groups.
Regarding “equipment and materials support”, the ratio of corporations that provided this type of support ranged from 5.00 to 21.67%, and the ratio in the “Construction” group was the highest in this survey. The ratio in the “Living-related and Personal Services and Amusement Services” and “Miscellaneous Business Services, n.e.c”. groups were also higher than that of the other groups.
Regarding “human resources support”, the ratio of corporations that provided support ranged from 4.17% to 31.03%, and the ratio in the “Medical, Health Care, and Welfare” group was the highest in this survey. The ratio in the “Construction”, “Living-related and Personal Services and Amusement Services”, “Miscellaneous Business Services, n.e.c”., “Real Estate and Goods Rental and Leasing”, and “Accommodation, Eating, and Drinking Services” groups were also higher than that of the other groups.
Regarding “useful information”, the ratio of corporations that provided support ranged from 0.00% to 20.00%, and the ratio in the “Real Estate and Goods Rental and Leasing” group was the highest in this survey.
Regarding “temporary use of land and buildings”, the ratio of corporations that provided this support ranged from 0.00% to 10.00%, and the ratio in the “Electricity, Gas, Heat, and Water Supply” group was the highest in this survey.
5.2. Results of Logistic Regression
In this section, we discuss the results of the logistic regression analysis based on the response variables (each type of support), as well as the explanatory variables for validating the hypotheses.
5.2.1. Parameter Estimation for “Some Support”
Table 9 shows the results of the parameter estimation for any support. The strongest positive relationship was found between providing “some support” and “having awareness of contributions to the recovery of regional society, and having already conducted related activities”. There was a strong positive relationship between providing “some support” and “building area”. In addition, there was also a positive relationship between providing “some support” and the location of main customers being “inside the same city limits”.
5.2.2. Parameter Estimation for Funding Support
Table 10 shows the results of the parameter estimation for “funding support”. There was a strong positive relationship between providing “funding support” and “having awareness of contributions to the recovery of regional society, and having already conducted related activities”.
5.2.3. Parameter Estimation for Daily Commodities Support
Table 11 shows the results of the parameter estimation for “daily commodities support”. The strongest positive relationship was found between providing “daily commodities support” and “having awareness of contributions to the recovery of regional society, and having already conducted related activities”. There was also a strong positive relationship between providing “daily commodities support” and “Accommodation, Eating, and Drinking Services”. Further, there were positive relationships between providing “daily commodities support” and the “Manufacturing” industry and the “location of main customers—inside the same city limits”.
5.2.4. Parameter Estimation for Equipment and Materials Support
Table 12 shows the results of the parameter estimation for “equipment and materials support”. There was an extremely strong positive relationship between providing “equipment and materials support” and “having awareness of contributions to the recovery of regional society, and having already conducted related activities”. There was also a strong positive relationship between providing “equipment and materials support” and the “construction” industry. Further, there were positive relationships between providing “equipment and materials support” and having 21–100 employees and “surrounding land use—rice field area”.
5.2.5. Parameter Estimation for Human Resources Support
Table 13 shows the results of the parameter estimation for “human resources support”. There was an extremely strong positive relationship between providing “human resources support” and “having awareness of contributions to the recovery of regional society, and having already conducted related activities”. There was also a strong positive relationship between providing “human resources support” and “surrounding land use—buildings area”. Further, there were positive relationships between providing “human resources support” and “located in districts without tsunami damage near the devastated area” and “location of main customers—inside the same city limits”.
5.2.6. Parameter Estimation for Useful Information Support
Table 14 shows the results of the parameter estimation for “useful information support”. There was an extremely strong positive relationship between providing “useful information supports” and the “Real Estate and Goods Rental and Leasing” industry. There was also a strong positive relationship between providing “useful information support” and “having awareness of contributions to the recovery of regional society, and having already conducted related activities”. In addition, there were positive relationships between providing “useful information support” and the “Agriculture, Forestry, and Fisheries” industry and “surrounding land use—building area”.
5.2.7. Parameter Estimation for Temporary Use of Land and Buildings
Table 15 shows the results of the parameter estimation for “temporary use of land and buildings support”. There was an extremely strong positive relationship between providing “temporary use of land and buildings support” and “having awareness of contributions to the recovery of regional society, and having already conducted related activities”. There was also a positive relationship between providing “temporary use of land and buildings support” and “located in large-scale partially destroyed area”.
6. Discussion
6.1. Actual Condition of Corporate Contributions to the Recovery of Regional Society
This study selected 1,020 corporations whose headquarters are located in Iwanuma or Natori. We conducted a mail survey, the response rate of which was 39.22%, and it was identified that 32.75% of corporations had provided some type of support for the recovery of regional society after the Great East Japan Earthquake. The data suggest that the target area already had some structures for the autonomous and efficient recovery of regional society set up by the corporations during ordinary times, because the ratio of the corporations that already had a relationship with the support recipients before the occurrence of the disaster was 74.50%. Many of those relationships had “not conducted any particular activities”. In other words, strong existing relationships such as business and community activities and information exchange triggered the provision of support, but weak relationships, such as only becoming acquainted with support recipients, also triggered the provision of support. Most previous studies on corporate contributions to the recovery of regional society have only focused on corporations’ awareness of contributions [13,14,15,16,17]. In this study, the ratio of corporations that had such an awareness was 57.25%, whereas the ratio of those that actually provided support among corporations with awareness was 40.17%. In addition, among those that provided support, the ratio of corporations “having awareness of contributions to regional society, and having already conducted related activities” was higher than that of those that only had the awareness but had not conducted any related activities. Thus, the data show that it is necessary to have an awareness of contributions as well as opportunities to conduct related activities and become acquainted with support recipients before the occurrence of a disaster to enhance the resilience of regional society in order to achieve autonomous and efficient recovery after disaster.
According to the report of an investigation by the Disaster Management Cabinet Office Japan [17], regarding the questionnaire item “Do you have cooperative ties or relationships with regional society for the purpose of preparation against disaster risk?”, it was found that the ratio of corporations that answered “having the opportunity to participate in activities of regional society, such as neighborhood association or independent anti-disaster organization” was 27.4%, and the ratio of corporations that answered “There was nothing that corresponded to that” was 56.6%. The results indicated that the majority of corporations do not have cooperative ties or relationships with regional society. Based on the results and our findings, we identified the problem that must be solved in order to make regional society resilient, namely how to enhance the “activities of corporations that do not have ties or relationships of cooperation with regional society” and “make connections between the corporations and regional society” during ordinary times. In order to resolve this issue, it is necessary to build a contact system and facilitate dialogue between corporations and the regional society through the building of relationships with support recipients, or through the development of not only various disaster-related activities such as drills and meetings but also other activities such as cleaning/beautification, crime prevention/patrols, local festivals/events, and so on.
Regarding corporate contributions to recovery after the Great East Japan Earthquake, previous studies have not documented that the targeted corporations are from various industry types and include small-scale corporations with headquarters in the devastated area. Thus, our results can contribute to the formulation of regional disaster prevention plans for large-scale disasters such as the Great East Japan Earthquake.
6.2. Characteristics of Corporate Contributions to the Recovery of Regional Society
Table 16 shows the summary of parameter estimation using the logistic regression model. It was found that there was one common characteristic and some other specific characteristics based on the analysis of the provided support. In this section, we discuss these characteristics. Our hypotheses were validated based on these characteristics.
First, the common characteristics influential in the provision of all types of support were the following: “having awareness of contributions to the recovery of regional society, and having already conducted related activities before the occurrence of disaster”, “location of main customers—inside the same city limits”, and “main surrounding land use—building area”. However, the latter two characteristics were significantly influenced by “human resources support”. Therefore, it was reasonable to exclude these two characteristics from the common characteristics.
Further, there were differences in individual characteristics between each support type. With the exception of awareness of contributions, these characteristics are described below by each support type.
Regarding providing “funding support”, only the characteristic of “having awareness of contributions to the recovery of regional society and having already conducted related activities before the disaster” were found to be influential. Most previous studies reported that most corporations provided funding support [1,18,19]. In this study, however, there were not many corporations that were found to have provided funding support. The differences between the target corporations were considered as one reason for this. The target corporations in previous studies were large corporations that were not located in devastated areas, such as those in the 1% Club, or those listed on the Tokyo Stock Exchange. However, the target corporations in this study were not only large corporations but also medium corporations, small corporations, and micro corporations that were located in the devastated area. The objective of funding support was not investigated in this study, though. Therefore, it is necessary to obtain detailed information based on each funding support objective to identify more characteristics of corporations that provide this type of support.
Regarding providing “daily commodities support”, the following were influential: “having the awareness of contributions to the recovery of regional society, and having already conducted related activities before the disaster”, the “Accommodation, Eating, and Drinking Services” and “Manufacturing” industries, and “location of main customers—inside the same city limits”. These characteristics were found to be reasonably influential. It was assumed that providing support was facilitated based on the condition of corporations because those in the “Accommodation, Eating, and Drinking Services” industry have a sufficient stock of daily commodities during ordinary times. Notably, corporations belonging to the food industries were also categorized under the “Manufacturing” industry. It was also assumed that “Manufacturing” had the same conditions as the “Accommodation, Eating, and Drinking Services” industry because it was reported by the Food Industry Affairs Bureau that, after the Great East Japan Earthquake, most staple foods were provided by corporations (85.9%) belonging to the “Manufacturing” industry [43]. In the case of the Hanshin–Awaji Earthquake Disaster, it was reported that the ratio of listed corporations that provided support was 62.3%; however, the industry types of the corporations were not identified [18]. In the case of the Niigata-ken Chuetsu-oki Earthquake, it was reported that the ratio of corporations that belonged to the 1% Club and provided support was 8.8% (household goods) and 21% (water or food provisions) [19]. It was also reported that the industry type of the corporations that provided water or food provision support was “Manufacturing” [19]. Regarding the provision of support of “water or food provisions”, it was suggested that industry type was more influential than other characteristics such as the size or location of corporations. It was reported that the industry type of the corporations that provided household goods support were “Insurance”, “Finance”, and “Business Services”, according to a previous study [19]. The industry type of “Accommodation, Eating, and Drinking Services”, as a characteristic, was not included in the previous study. Thus, it was implied that the size or location of a corporation were influential characteristics. The industry types of “Insurance” and “Finance” were not identified because there were no respondents from these industry types in this study.
Regarding the provision of “equipment and materials support”, the following were found to be influential: “having awareness of contributions to the recovery of regional society, and having already conducted related activities before the disaster”, “number of employees—21–100”, “Construction” industry, and “main surrounding land use—rice field areas”. The “Construction” industry was included because of previous studies [13,19,20], and the interview surveys from this research indicate that one of the roles of construction industries was to provide support for the recovery of regional society through machinery. The “number of employees—21–100” indicates that this support was provided by medium-sized corporations in the study area. As shown in Figure 1, it was found that “main surrounding land use—rice field areas” indicates that the corporations were located in the eastern part of the study area, probably near the eastern residential or industrial area.
Regarding the provision of “human resources support”, the following were found to be influential: “having awareness of contributions to the recovery of regional society, and having already conducted related activities before the disaster”, “location of main customers—inside the same city limits”, “main surrounding land use—building areas”, and “location of the corporations—districts without tsunami damage near the devastated area”. “Main surrounding land use—building areas” and “location of the corporations—districts without tsunami damage near the devastated area” indicate that the corporations were located near the Iwanuma or Natori railway stations. Therefore, it was reasonable to include these as influential characteristics because such corporations, located near stations that were not damaged by the tsunami, had the capacity to provide support after the disaster. On the other hand, industry types were not found to be influential characteristics in this study. Previous studies found that “Construction”, “Transport”, and “Manufacturing” were the main industry characteristics with the possibility of providing such support [13]. Figure 15 shows that the ratio of corporations that belonged to the “Construction” industry and provided such support was 27.50%, and the ratios of corporations that belonged to the “Transport” and “Manufacturing” industry and provided such support were 4.17% and 7.14%. It was suggested that belonging to the “Construction” industry was more influential than belonging to the “Transport” or “Manufacturing” industry in this study. However, belonging to the “Construction” industry was not an identified characteristic based on logistic regression analysis.
Regarding providing “useful information support”, the following were found to be influential: “having awareness of contributions to the recovery of regional society, and having already conducted related activities before the disaster”, the “Real Estate and Goods Rental and Leasing” and “Agriculture, Forestry, and Fisheries” industries, and “main surrounding land use—building areas”. However, the “Agriculture, Forestry, and Fisheries” industry was excluded from the characteristics because there were very few corporations belonging to this industry among the target corporations. The “Real Estate and Goods Rental and Leasing” industry was included since the interview survey indicated that the demand for information regarding land or buildings increased owing to the study area being designated as a disaster risk area due to the damage caused by the tsunami. The characteristics for providing this support were not found in previous studies.
Regarding providing “temporary use of lands and building support”, the following characteristics were found to be influential: “having awareness of contributions to the recovery of regional society, and having already conducted related activities before the disaster” and “located in large-scale partially destroyed area”. From the interview survey, it was found that most camps intended for rescue and recovery activities were located in a large-scale partially destroyed area. Thus, it was reasonable to include “located in large-scale partially destroyed area” as an influential characteristic for this support. In previous studies, it was found that “Construction” and “Manufacturing” were the characteristics with the most possibility of providing this support [13]. However, Figure 15 shows that the ratio of corporation that belonged to the “Construction” and “Manufacturing” industry and provided this support was 5.00% and 0.00%. It was suggested that “awareness” and “damage from the tsunami” were more influential as characteristics than industry type.
According to the above discussion, Hypothesis 1, “No significant difference in damage exists between corporations responding and those not responding to the disaster”, was correct except for the condition that the corporations provided “temporary use of lands and building support” and were located in a large-scale partially destroyed area.
As shown in Figure 13, the ratio of large-scale corporations that provided “daily commodities support” was higher than that of other corporations. Small-scale and micro-scale corporations provided this support to some extent. In short, corporations of all scales provided support; however, only the relationship between “medium-scale corporations” and providing “equipment and materials support” was identified as a characteristic based on statistical analysis.
According to the above discussion, Hypothesis 2, “No significant difference exists in number of employees between corporations responding and those not responding to the disaster”, was correct except for the condition that the corporations provided “equipment and materials support” and the number of employees was 21–100.
Hypothesis 3, “Corporations that have an awareness of contributions to recovery support and had already conducted related activities before the disaster are more likely to provide support for the recovery of regional society than are other corporations”, was also found to be correct because this characteristic has a strong relationship with all support types.
Hypothesis 4, “The content of support differs according to industry types”, was correct too, as it was found that, for example, “daily commodities support” was mostly provided by corporations belonging to the “Accommodation, Eating, and Drinking Services” and “Manufacturing” industries, “equipment and materials support” was mainly provided by those in the “Construction” industry, and “useful information support” was mostly provided by those in the “Real Estate and Goods Rental and Leasing” industry.
6.3. Limitations
This study discussed the characteristics of corporations that spontaneously contributed to the recovery of regional society. However, it has certain limitations, which are as follows.
First, the questionnaire survey targeted corporations that were still conducting business in January 2015; therefore, corporations that had closed their business between March 2011 and December 2014 were not included in this survey.
Second, we could not identify a “causal relationship” in this research, since the results (found by using a logistic regression model) used dummy variables that were translated from quantitative data.
Third, the study area was a provincial city developed from an agriculture-based society. The awareness of residents in the study area was relatively high, and they had strong connections; the area had a system for receiving support from the corporations. Hence, to help formulate disaster-management plans to deal with disasters in urban areas that do not have strong connections, in particular for inland earthquakes with an epicenter directly below big cities, it is necessary to conduct further studies focusing on the characteristics of urban areas.
Fourth, the data collected in this study were based on the observations and judgments of a single representative of the targeted corporations; data based on different individual circumstances or the situation of various people and associations related to the corporate contributions were not reflected in this study. The interview survey also showed that small-scale corporations cooperated with other corporations and associations; however, this study could not analyze this further. In order to examine the situation in more detail, it is necessary to investigate the support provided by local business networks or groups, the relationship between provided support and the geographical spread or agglomeration of corporations, case studies of some corporations that include employee activities, and the actual situation of corporate contributions to the recovery of regional society from the perspective of residents.
7. Conclusions
This study conducted a mail survey that was sent to 1020 corporations located in Iwanuma or Natori, Miyagi Prefecture, Japan, which were damaged due to the Great East Japan Earthquake and tsunami. Of the 1020 corporations, 400 responded to the mail survey. We drew two major conclusions based on the results.
- In order to understand the actual situation of corporate contributions to the recovery of regional society, we identified the following by simple totaling and cross-totaling.
- Among the target corporations, 32.75% provided some type of support for the recovery of regional society after the disaster.
- Further, 74.50% of corporations that provided support had a relationship with the support recipients before the occurrence of the disaster. This refer not only to those corporations with strong relationships such as business, community activities, and information exchanges, but also to those with weak relationships such as maintaining acquaintances with support recipients; both types of relationships were indicated as triggers for providing support.
- The contents of the support were as follows: “human resources” (59.54%), “equipment and materials” (45.80%), “daily commodities such as water and food” (38.93%), “useful information” (15.27%), “funding support” (13.74%), and “temporary use of land and buildings” (11.45%).
- The proportion of corporations that have awareness of contributions was 57.25%, and of these, the proportion of those that actually provided some type of support was 40.17%.
- The following was identified through the logistic regression analysis and helped determine the characteristics of the corporations that provided support for the recovery of regional society.
- In order to providing any type of support, it was found that corporations need to have an awareness of their possible contributions, as well as opportunities to conduct related activities before the occurrence of a disaster to enhance the resilience of regional society in order to achieve efficient recovery.
- The influential characteristics for each type of support differed by industry type, location, and number of employees, under the following conditions.
- For “temporary use of land and buildings support”, “location of the corporation—large-scale partially destroyed area” was an influential characteristic.
- For “equipment and materials support”, the influential characteristics were “medium-scale corporations” and the “Construction” industry.
- For “daily commodities support”, the influential characteristics were the “Accommodation, Eating, and Drinking Services” and “Manufacturing” industries.
- For “useful information support”, the “Real Estate and Goods Rental and Leasing” industry was an influential characteristic.
These findings provide evidence for formulating disaster support policies and building the relationships and agreements between corporations and municipalities/residential associations needed for disaster response and recovery.
Further studies are needed to overcome this study’s limitations, particularly the fourth one as discussed above. We especially want to identify the “the support provided by local business networks or groups” and “the actual situation of corporate contributions to the recovery of regional society from the perspective of residents” in future research.
Author Contributions
R.F. and M.I. conceived, designed and conducted the interview survey; R.F. and Y.G. conceived, designed and conducted the questionnaire survey; R.F. analyzed the data and wrote the paper.
Acknowledgments
The authors would like to thank Makoto Yokohari, Fumihiko Seta, U Hiroi, Toru Terada, Akiko Iida, Keisuke Sakamoto and Takeki Izumi for useful discussions. This research was supported by the Research Institute of Science and Technology for Society, Japan Science and Technology Agency (Category II Project, “Redevelopment of Tsunami Impacted Coastal Region to Save Life and to Implement Disaster Resilient Community”, Mikiko ISHIKAWA, R&D Focus Area: Creating Community-based Robust and Resilient Society).
Conflicts of Interest
The authors declare no conflict of interest.
Abbreviations
| CONS | Construction |
| MANU | Manufacturing |
| ACCO | Accommodation, Eating, and Drinking Services |
| MINI | Mining and Quarrying of Stone |
| ELEC | Electricity, Gas, Heat, and Water Supply |
| AGRI | Agriculture, Forestry, and Fisheries |
| REAL | Real Estate and Goods Rental and Leasing |
| HAA | Having awareness of contributions to the recovery of regional society, and having already conducted related activities before the occurrence of disaster |
| HAN | Having awareness of contributions to the recovery of regional society, but having conducted no related activities before the occurrence of disaster |
| NHC | Not having the capacity to contribute to the recovery of regional society before the disaster. |
| NTC | Having never thought about making contributions |
References
- Johnson, B.R.; Connolly, E.; Carter, T.S. Corporate social responsibility: The role of Fortune 100 companies in domestic and international natural disasters. Corp. Soc. Responsib. Environ. Manag. 2011, 18, 352–369. [Google Scholar] [CrossRef]
- Hatakeyama, S.; Sakata, A.; Kawamoto, A.; Itoh, N.; Shiraki, W. Drawing Concept of Company BCP with Considering District Continuity and Propose of Measures for Reinforcing Disaster Resilience. J. Jpn. Soc. Civ. Eng. 2013, 69, 25–30. [Google Scholar] [CrossRef]
- Ishikawa, M. A Study on Community-Based Reconstruction from Great East Japan Earthquake Disaster—A Case Study of Iwanuma City in Miyagi-Pref. J. Disaster Res. 2015, 10, 807–817. [Google Scholar] [CrossRef]
- Sonoda, C.; Sakamoto, K.; Ishikawa, M. A Study about the Function and Influence of the Workshops in City Reconstruction Planning Process Through the Reconstruction of Iwanuma City, Miyagi Pref. from the Tohoku Earthquake. J. City Plan. Inst. Jpn. 2013, 48, 849–854. [Google Scholar]
- Murakami, A.; Kumakura, E.; Ishikawa, M. Reconstruction of Coastal Villages Swept Away by Tsunami by 3D Digital Model. J. Disaster Res. 2015, 10, 818–829. [Google Scholar] [CrossRef]
- Kariya, T.; Ubaura, M. A Study of the process of Community Participation in the Initial Stage of Reconstruction from Disaster, A case Study of Recovery Process from Tsunami Disaster in Ishinomaki City. J. City Plan. Inst. Jpn. 2013, 48, 837–842. [Google Scholar]
- Olcott, G.; Oliver, N. Social Capital, Sensemaking, and Recovery: Japanese Companies and the 2011 Earthquake. Calif. Manag. Rev. 2014, 56, 5–22. [Google Scholar] [CrossRef] [Green Version]
- Isouchi, C.; Mano, K.; Shiraki, W.; Inomo, H. A Proposal of District Continuity Intensification Through Supporting Drowing Up Business Continuity Plan (BCP) for Construction Companies. J. Jpn. Soc. Civ. Eng. 2011, 67, 59–64. [Google Scholar] [CrossRef]
- Sakamoto, M.; Sato, S.; Abe, K.; Ogata, K.; Nakagawa, M.; Otsuka, T. Business Continuity by Small Business Owners -Business Continuity based on Disaster Experience Review by Ishinomaki Mebaekai. J. Soc. Saf. Sci. 2015, 26, 19–26. [Google Scholar]
- Twigg, J. Corporate Social Responsibility and Disaster Reduction: A Global Overview; Benfield Greig Hazard Research Centre: London, UK, 2001. [Google Scholar]
- Kaji, H.; Yamaki, T. Jishin ni taisuru Kigyou Bousairyoku Hyouka system: CMP hou no Kaihatsu (Evaluate system of Corporate Disaster Prevention against Earthquake Disaster: Development of CMP Method). Yobou Jihou 2004, 219, 40–48. [Google Scholar]
- Genda, Y. Higashi Nihon Daishinsai ga Shigoto ni Ataeta Eikyou ni tsuite (Influence on Labor and Employment caused by the Great East Japan Earthquake Disaster). Jpn. J. Labour Stud. 2014, 653, 100–120. [Google Scholar]
- Murosaki, Y. Minkan Kigyou no Bousai Taiou no Jittai (Trends in Corporate Disaster Prevention). In Proceedings of the Annual Conference of the Institute of Social Safety Science, Shizuoka, Japan, 15–16 May 1992; Volume 2, pp. 145–154. [Google Scholar]
- Ogawa, Y.; Nagano, Y. Nen Hanshin Daishinsai wo Keiki tosuru Kigyou no Bousai Ishiki no Henka ni kansuru Kentou (Changes in Corporate Awareness of Disaster Prevention after Hanshin-Awaji Great Earthquake). In Proceedings of the Annual Conference of the Institute of Social Safety Science, Shizuoka, Japan, 16–18 November 1995; Volume 5, pp. 141–144. [Google Scholar]
- Ito, M.; Kameno, T. Assistance Awareness of the Private Sector in Local Disaster Management: A Case Study of Coastal Areas in Oita. Rep. City Plan. Inst. Jpn. 2014, 13, 31–35. [Google Scholar]
- Nakamura, J.; Harada, K. A Survey of Corporate Efforts for Regional Disaster Prevention Related to Corporate Social Responsibility (CSR). J. Soc. Saf. Sci. 2014, 24, 53–60. [Google Scholar]
- Disaster Management Cabinet Office Japan. Heisei 27 Nendo Kigyou no Jigyou Keizoku oyobi Bousai no Torikumi ni kansuru Jittai Cyousa (Actual Conditions Survey of Business Continuity and Activities for Disaster Prevention); Disaster Management Cabinet Office Japan: Koshigaya, Japan, 2015.
- Murosaki, Y.; Iwami, T. Hanshin Awaji Daishinsai to Kigyou no Bousai Taiou (Corporate Disaster Prevention Activities after Hanshin Awaji Great Earthquake). In Proceedings of the Annual Conference of the Institute of Social Safety Science, Shizuoka, Japan, 16–18 November 1995; Volume 5, pp. 129–134. [Google Scholar]
- Toyoya, A.; Shoji, G. Clarification of Corporate Contribution in a Regional Disaster: A Case Study of 2004 Niigata-ken Chuetsu Earthquake and 2005 Hurricane Katrina. J. Soc. Saf. Sci. 2007, 9, 9–19. [Google Scholar]
- Ohnishi, K. A Study on the Role of Local Construction Companies and Carpenters in The Great Hanshin-Awaji Earthquake. In Proceedings of the Annual Conference of the Institute of Social Safety Science, Shizuoka, Japan, 7–9 November 1997; Volume 7, pp. 234–237. [Google Scholar]
- Henderson, J.M.; Quandt, R.E. Microeconomic Theory: A Mathematical Approach; McGraw-Hill: New York, NY, USA, 1958. [Google Scholar]
- Alcahian, A.A.; Demsetz, H. Production, Information Cost, and Economic Organization. Am. Econ. Rev. 1972, 62, 4. [Google Scholar]
- Cyert, R.H.; March, J.G. A Behavioral Theory of the Firm; Prentice Hall: Englewood Cliffs, NJ, USA, 1963. [Google Scholar]
- Nelson, R.; Winter, S. An Evolutionary Theory of Economic Change; Belknap: Louisville, KY, USA, 1982. [Google Scholar]
- Penrose, E. The Theory of Growth of the Firm; Wiley: Hoboken, NJ, USA, 1995. [Google Scholar]
- Adams, M.; Hardwick, P. An Analysis of Corporate Donations: United Kingdom Evidence. J. Manag. Stud. 1998, 35, 641–654. [Google Scholar] [CrossRef]
- Brammer, S.; Millington, A. The Development of Corporate Charitable Contributions in the UK: A Stakeholder Analysis. J. Manag. Stud. 2004, 41, 1411–1434. [Google Scholar] [CrossRef]
- Brammer, S.; Millington, A. Profit Maximization vs. Agency: An Analysis of Charitable Giving by UK Firms. Camb. J. Econ. 2005, 29, 517–534. [Google Scholar] [CrossRef]
- Zhang, R.; Rezaee, Z.; Zhu, J. Corporate Philanthropic Disaster Response and Ownership Type: Evidence from Chinese Firms’ Response to the Sichuan Earthquake. J. Bus. Ethics 2010, 91, 51–63. [Google Scholar] [CrossRef]
- Koyama, S.; Aida, J.; Kawachi, I.; Kondo, N.; Subramanian, S.V.; Ito, K.; Kobashi, G.; Masuno, K.; Kondo, K.; Osaka, K. Social Support Improves Mental Health among the Victims Relocated to Temporary Housing following the Great East Japan Earthquake and Tsunami. Tohoku J. Exp. Med. 2014, 234, 241–247. [Google Scholar] [CrossRef] [PubMed]
- Tsuboya, T.; Aida, J.; Hikichi, H.; Subramanian, S.V.; Kondo, K.; Osaka, K.; Kawachi, I. Predictors of depressive symptoms following the Great East Japan Earthquake: A Prospective study. Soc. Sci. Med. 2016, 161, 47–54. [Google Scholar] [CrossRef] [PubMed]
- Hikichi, H.; Aida, J.; Tsuboya, T.; Kondo, K.; Kawachi, I. Can Community Social Cohesion Prevent Posttraumatic Stress Disorder in the Aftermath of a Disaster? A Natural Experiment from the 2011 Tohoku Earthquake and Tsunami. Am. J. Epidemiol. 2016, 183, 902–910. [Google Scholar] [CrossRef] [PubMed]
- Sasaki, Y.; Aida, J.; Tsuji, T.; Miyaguni, Y.; Tani, Y.; Koyama, S.; Matsuyama, Y.; Sato, Y.; Tsuboya, T.; Nagamine, Y.; et al. Does Type of Residential Housing Matter for Depressive Symptoms in the Aftermath of a Disaster? Insights from the Great East Japan Earthquake and Tsunami. Am. J. Epidemiol. 2017, 187, 455–464. [Google Scholar] [CrossRef] [PubMed]
- Aida, J.; Hikichi, H.; Matsuyama, Y.; Sato, Y.; Tsuboya, T.; Tabuchi, T.; Koyama, S.; Subramanian, S.V.; Kondo, K.; Osaka, K.; et al. Risk of mortality during and after the 2011 Great East Japan Earthquake and Tsunami among older coastal residents. Sci. Rep. 2017, 7, 16591. [Google Scholar] [CrossRef] [PubMed]
- Hikichi, H.; Sawada, Y.; Tsuboya, T.; Aida, J.; Kondo, K.; Koyama, S.; Kawachi, I. Residential relocation and change in social capital: A natural experiment from the 2011 Great East Japan Earthquake and Tsunami. Sci. Adv. 2017, 3, e1700426. [Google Scholar] [CrossRef] [PubMed]
- Japan Platform. Available online: http://www.japanplatform.org/E/ (accessed on 9 March 2018).
- 1% club of Japan Business Federation. Available online: http://www.keidanren.or.jp/japanese/profile/1p-club/ (accessed on 9 March 2018). (In Japanese).
- Iwanuma City. 2011.3.11 Higashi Nihon Daishinsai Iwanuma Shi no Kiroku (Historical Records of Iwanuma City after the Great East Japan Earthquake, 11 March 2011). 2014. Available online: https://www.pref.miyagi.jp/pdf/kiki/iwanuma2603.pdf (accessed on 9 March 2018).
- Natori City. Higashi Nihon Daishinsai Natori Shi no Kiroku (Historical Records of Natori City after the Great East Japan Earthquake). 2014. Available online: http://www.city.natori.miyagi.jp/content/download/29726/173138/filenatorishi-kiroku-all.pdf (accessed on 9 March 2018).
- National Land Numerical Information Download Service. Available online: http://nlftp.mlit.go.jp/ksj-e/index.html (accessed on 9 March 2018).
- Neuman, W.L. Social Research Methods: Qualitative and Quantitative Approaches, 7th ed.; Pearson Education Limited: London, UK, 2014. [Google Scholar]
- Statistics Bureau, Ministry of Internal Affairs and Communications. Economic Census for Business Activity in Japan. Available online: http://www.stat.go.jp/english/data/e-census/2012/index.htm (accessed on 9 March 2018).
- Doi, K. Issue and Recommendation of Governmental Emergency Food Supply Based on the Great East Japan Earthquake Experience. J. Jpn. Soc. Irrig. Drain. Rural Eng. 2013, 81, 31–34. [Google Scholar]
Figure 1.
Location of corporations on the land use map in Iwanuma and Natori.

Figure 2.
Response rate of each industry.

Figure 3.
Location of the major business partners.

Figure 4.
Classification of the number of employees.

Figure 5.
Annual sales of the target corporations.

Figure 6.
(a) Ratio of the damage amount to annual sales; (b) Proportion of the type of damages.

Figure 7.
Corporations’ awareness of contributions to the recovery of the regional society.

Figure 8.
The classification of damages caused by the tsunami.

Figure 9.
The ratio of corporations that provided some type of support.

Figure 10.
The content of the provided support.

Figure 11.
The relationship between the corporations and support recipients.

Figure 12.
Contents of the relationships.

Figure 13.
The ratio of corporate contribution by damage caused by the tsunami.

Figure 14.
The ratio of corporate contribution by number of employees.

Figure 15.
The ratio of corporate contribution by corporations’ awareness.

Figure 16.
The ratio of corporate contribution by industry type.


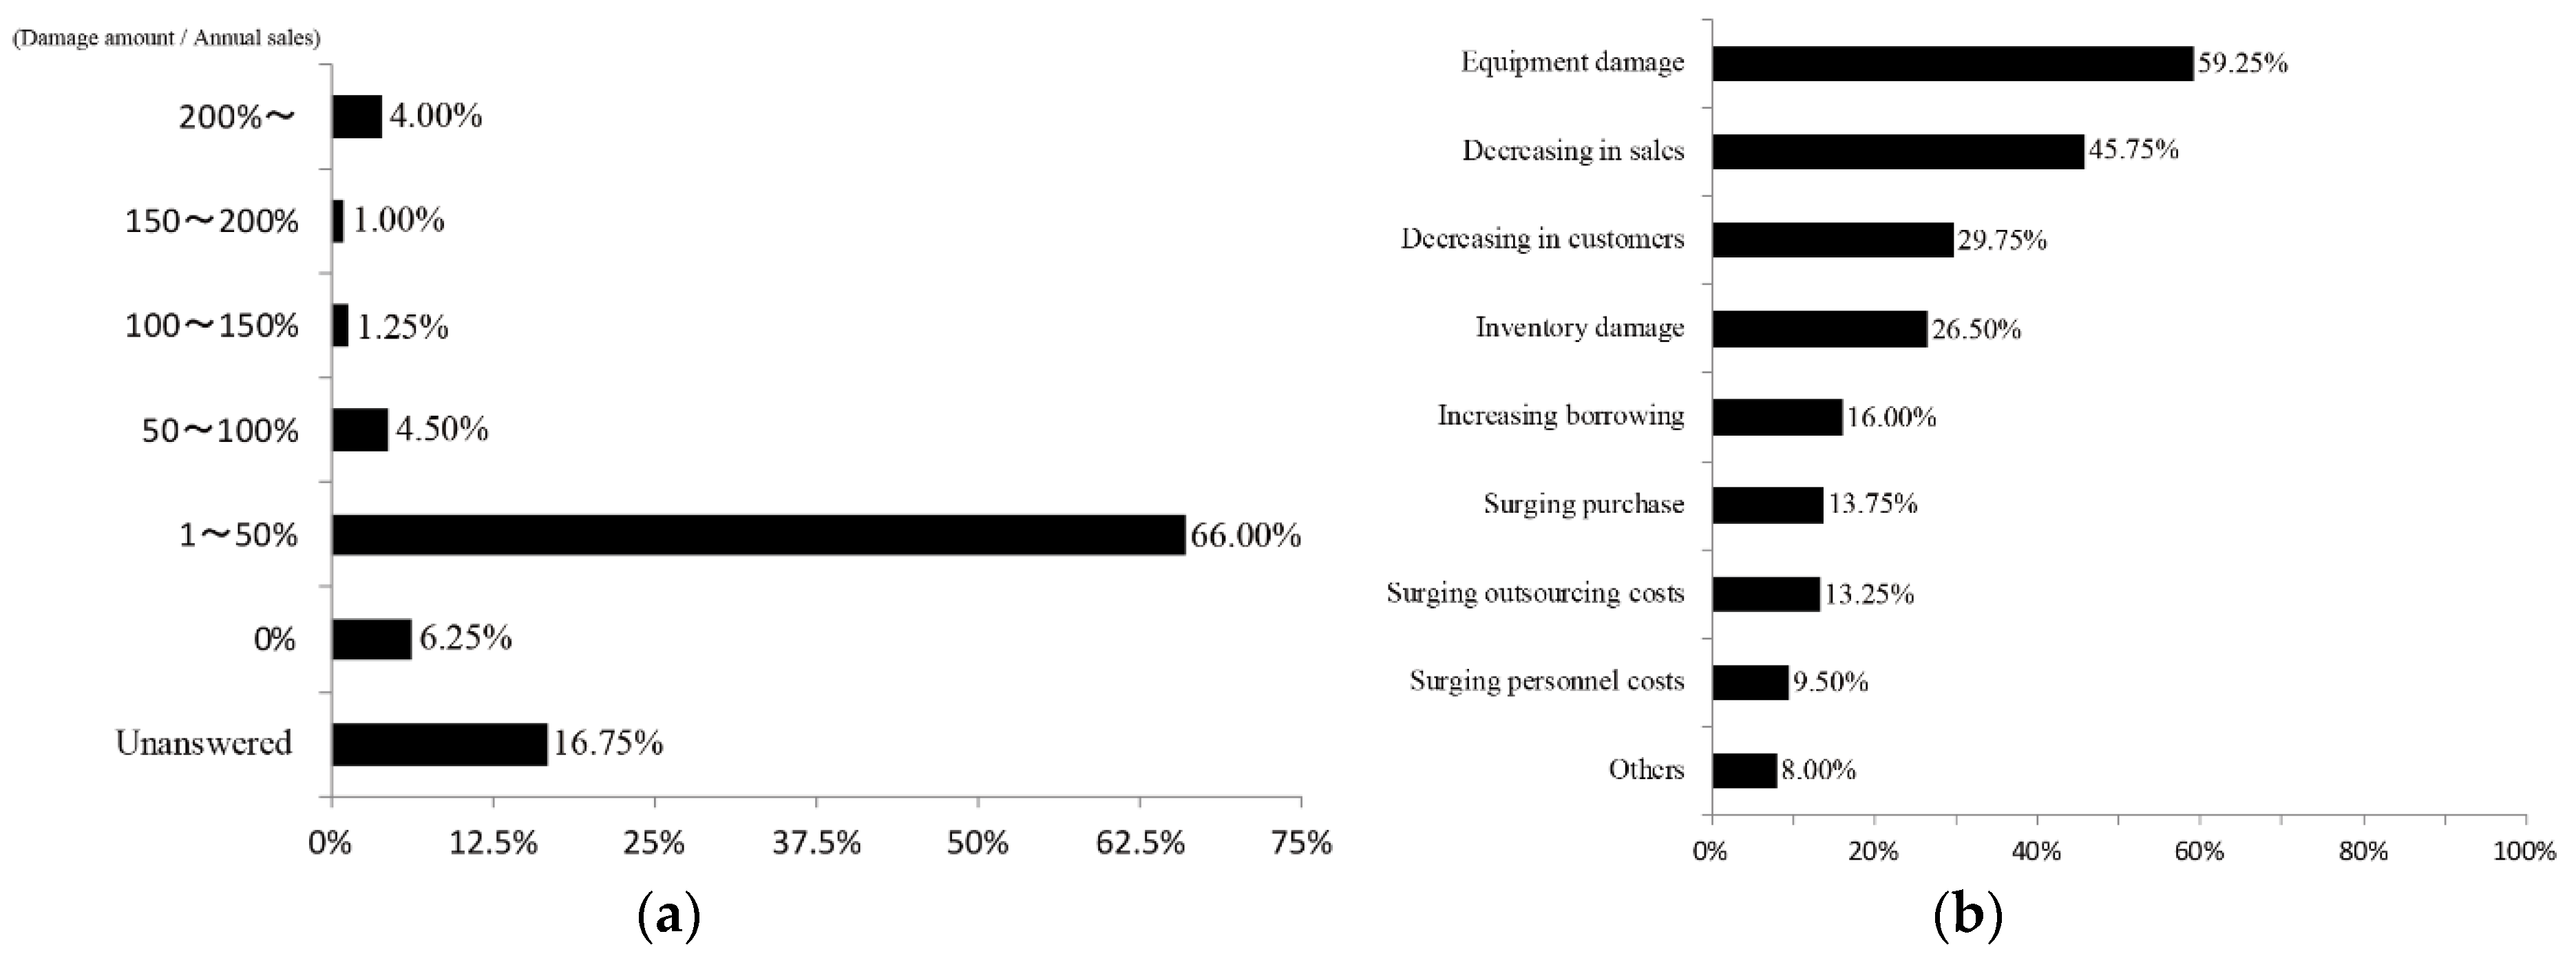
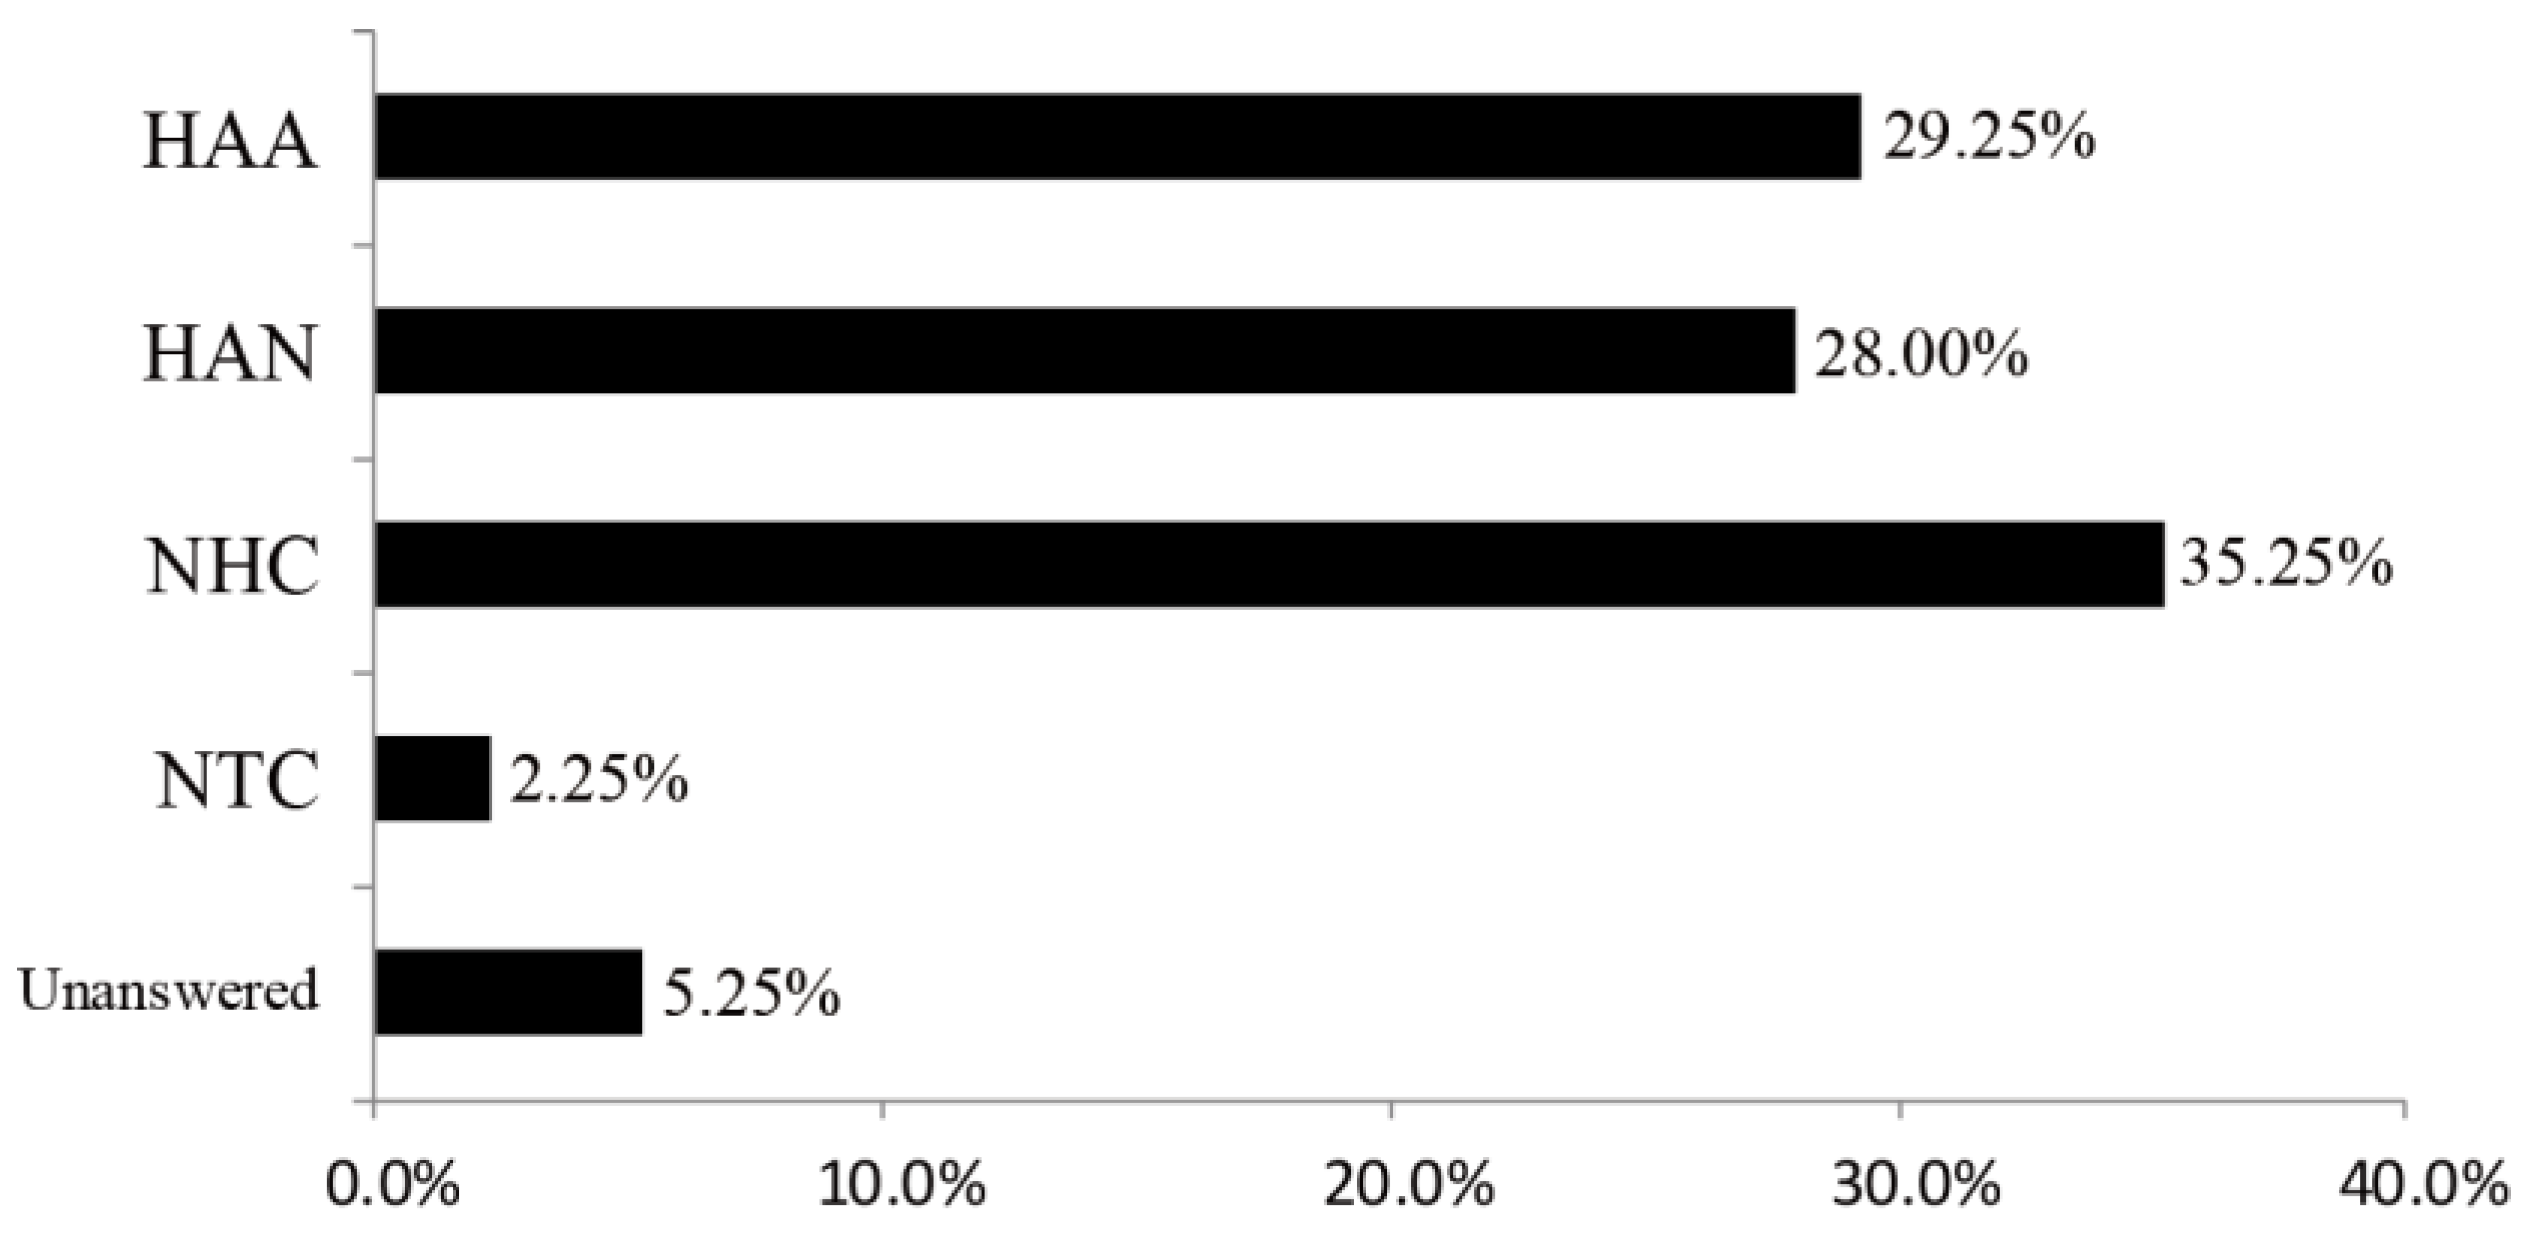
Table 1.
Summary of corporate variables.
| Target | N | Corporate Variables | Author |
|---|---|---|---|
| Listed corporation (UK) | 100 | Leverage, Size, Profitability, and Ownership structure | Adams and Hardwick (1998) |
| Listed corporation (UK) | 400 | Size, Industry type, and Location | Brammer and Millington (2004) |
| Large corporation (UK) | 550 | Industry type, Size, Shareholder relations, and Financial factors | Brammer and Millington (2005) |
| Listed corporation (CN) | 686 | Corporate size, Profitability, Geography, Cash resource available, and Leverage | Zhang et al. (2009) |
| Fortune 500 or Listed corporation (US) | 442 | Industry type, Size, Profitability, Advertising intensity, R&D intensity, Leverage, and Local presence | Muller and Kräussl (2010) |
| Listed or Insurance corporation (JP) | 378 | Damage from disaster, Contents of provided supports, and Future earthquake countermeasures | Murosaki and Iwami (1995) |
| Local construction corporations or Carpenters (JP) | 218 | Size, Location, Contents of provided supports, Trigger of supports, Community relations, and Local activities | Ohnishi (1997) |
| 1% Club of Japan Business Federation (JP) Corporations listed on National Donor Responses to Hurricane Katrina (US) | 610 345 | Contents of provided supports, Industry type | Toyota and Shoji (2007) |
Table 2.
Outline of the interview survey.
| Targets | 12 corporations located in Iwanuma |
| Interviewees | Presidents or directors of disaster prevention departments of each corporation |
| Implementation period | From April 2012 to December 2014 |
| Semi-structuralinterviews(with questionnaires) | Part 1: History of the corporation and the context of the interviewee (with a questionnaire including fundamental characteristics of the corporations such as industry type, number of employees, and annual sales) Part 2: Business continuity (with a questionnaire including damage caused by the disaster, such as damage amount and content of damages) Part 3: Support for recovery of the regional society (content of the support, support recipients, and trigger for support) |
Table 3.
Summary of the interview survey.
| Items | Target Corporations | |||||||||||
|---|---|---|---|---|---|---|---|---|---|---|---|---|
| A | B | C | D | E | F | G | H | I | J | K | L | |
| Industry type | CONS | MANU | MANU | CONS | ELEC | AGRI | MANU | CONS | ELEC | MINI | CONS | CONS |
| Number of employees | 70 | 240 | 98 | 5 | 7 | 7 | 15 | 30 | 16 | 26 | 4 | 6 |
| Awareness | HAA | HAN | HAN | HAA | HAA | HAA | HAN | HAN | HAN | HAA | NC | HAA |
| Distance from coastline | 2.68 | 2.24 | 1.58 | 2.18 | 2.29 | 2.49 | 5.89 | 6.94 | 7.37 | 10.98 | 6.90 | 8.03 |
| Damage/sales | 4.00% | 8.10% | 26.00% | 27.50% | 40.60% | 300.00% | 2.50% | 2.50% | 10.70% | 0.40% | 4.90% | 4.20% |
| Damage from tsunami | + | + | + | + | + | + | - | - | - | - | - | - |
| Some support | + | - | - | + | + | + | - | - | - | - | - | + |
| Funding support | - | - | - | - | - | - | - | - | - | - | - | - |
| Daily commodities support | + | - | - | - | - | - | - | - | - | - | - | + |
| Equipment and materials support | + | - | - | + | + | + | - | - | - | - | - | + |
| Human resources support | + | - | - | + | + | + | - | - | - | - | - | + |
| Information support | + | - | - | + | - | + | - | - | - | - | - | + |
| Temporary use of lands and buildings support | + | - | - | - | - | - | - | - | - | - | - | - |
Abbreviations: CONS: Construction, MANU: Manufacturing, ACCO: Accommodation, Eating, and Drinking Services, MINI: Mining and Quarrying of Stone, ELEC: Electricity, Gas, Heat, and Water Supply, AGRI: Agriculture, Forestry, and Fisheries, REAL: Real Estate and Goods Rental and Leasing, HAA: Having an awareness of contributions to the recovery of regional society, and having already conducted related activities before the occurrence of the disaster, HAN: Having an awareness of contributions to the recovery of regional society, but having conducted no related activities before the occurrence of the disaster, NC: Not having the capacity to contribute to the recovery of regional society before the disaster.
Table 4.
Descriptions of provided support based on the results of the interview survey.
| Support Type | Provider | Destination | Description |
|---|---|---|---|
| Funding | None | None | This type of support was not found in the interview survey. However, corporation I provided heavy machines, fuel, and funds for corporation E in the same industry that provided support to the regional society. |
| Daily Commodities | A | Neighborhood Association | Provided materials that were stocked by them during ordinary times to the local evacuation center of the neighborhood association. |
| L | Elementary School | Provided materials that were collected by the corporation right after the disaster to elementary schools. | |
| Equipment and Materials | A | Neighborhood Association | Removed mud and rubble piled up on roads using heavy machines for the neighborhood association. They could provide this support for only three days after the disaster. Starting on the fourth day after the disaster, they declined personal requests because they received official business orders from the local government and found it necessary to devote their efforts to these orders. |
| D | Neighborhood Association | Provided construction tools and materials for removing mud and rubble. They could not provide heavy machines for construction because the machines were damaged by the tsunami. | |
| Mutual Fire Association | Provided construction tools to mutual fire association for finding missing persons. | ||
| E | Neighborhood Association | Provided support in cooperation with other corporations and removed mud and rubble piled up on roads and near buildings using heavy machines. They borrowed heavy machines and fuel from unions in the same industry. | |
| Elementary School | Removed mud from elementary school grounds using heavy machines. | ||
| F | Neighborhood Association | Provided construction tools and materials for removing mud and rubble. They could not provide heavy machines for construction because the machines were damaged by the tsunami. | |
| Kindergarten | Removed mud from kindergarten grounds using heavy machines. | ||
| L | Neighborhood Association | Corporation L provided materials and tools for repairing the floors of houses located in areas devastated by the tsunami. | |
| L | Medical Worker | Provided paper and fuel to local medical workers for medical activities in devastated areas. | |
| Human Resources | A | Neighborhood Association | Provided human resources to the neighborhood association for removing mud and rubble. |
| D | Neighborhood Association | Provided human resources to the neighborhood association to remove mud and rubble. | |
| E | Neighborhood Association | Provided human resources to the neighborhood association to remove mud and rubble. | |
| F | Kindergarten | Removed mud from kindergarten grounds using construction tools. | |
| L | Neighborhood Association | Provided materials that were stocked by them during ordinary times to the local evacuation center of the neighborhood association. | |
| Useful Information | A | Iwanuma City | Provided information regarding the condition of recovery in Iwanuma Rinku Industrial Park to Iwanuma City, the neighborhood association, and police officers. |
| Neighborhood Association | |||
| Police officer | |||
| D | Elementary School | Provided information regarding the condition of recovery in the regional society and information regarding the safety of elementary school children. | |
| F | Kindergarten | Provided information regarding the condition of recovery in the regional society and land for the shifting of a kindergarten. | |
| L | Medical Worker | Provided information regarding the condition of recovery in the regional society and about people with medical needs to medical workers. | |
| Temporary use of lands and buildings | A | Mutual Fire Association | Provided permission for temporary use of lands and buildings for rescue activities. |
| Police officer | Provided permission for temporary use of lands for activities for the safety of the regional society. |
Table 5.
Overview of damages from the disaster.
| Item | Iwanuma City | Natori City |
|---|---|---|
| Dead or missing | 187 people | 923 people |
| Completely destroyed | 736 buildings | 2801 buildings |
| Large-scale partial destruction | 509 buildings | 219 buildings |
| Partial destruction | 1097 buildings | 910 buildings |
| Partial damage | 3086 buildings | 10,061 buildings |
Table 6.
Outline of the questionnaire survey.
| Targets | 1020 corporations located in Iwanuma or Natori |
| Survey method | Mail survey questionnaire |
| Implementation period | From January to August 2015 |
| Response rate | 39.22% |
Table 7.
Description of the questionnaire.
| Categories | Questionnaire Items | Factors |
|---|---|---|
| Provided Support | Support recipients in regional society | “Neighborhood Association”, “School (elementary, junior high, high), kindergarten, etc”., “Hospital/Medical worker”, “Police station/Police officer”, “Fire Station/Mutual fire association”, “Iwanuma/Natori” |
| Content of support | “Funding”, “Daily commodities such as water and food”, “Equipment and materials”, “Human resources”, “Useful information”, “Temporary use of lands and buildings” | |
| Relationship between the corporation and support recipients | “Relationship before the disaster” | |
| “No relationship before the disaster and contact made only after the disaster” | ||
| “No relationship before the disaster and were introduced by others after the disaster” | ||
| “Other” | ||
| Contents of the relationship | “Have not conducted any particular activities” | |
| “Have done some business” | ||
| “Have done some community activities” | ||
| “Have done some exchange information” | ||
| “Have done other activities” | ||
| Damages caused by the disaster | Approximate value of the damages up to September 2011 from the occurrence of the disaster | Numerical answer |
| Details of the damage | “Equipment damage”, “Inventory damage”, “Surging personnel costs”, “Surging outsourcing costs”, “Decrease in customers”, “Decrease in sales”, “Surging purchases”, “Increase in borrowing”, “Other”. | |
| Shutdown period | Numerical answer | |
| Awareness | Awareness of corporations to contribute to the recovery of regional society | “Having awareness of contributions to regional society, and having already conducted related activities” |
| “Having awareness of contributions to regional society, but having conducted no related activities earlier” | ||
| “Not having the capacity to contribute” | ||
| “Having never thought about making contributions” | ||
| Fundamental characteristics of corporations | Industry type | “Medical, health care, and welfare”, “Transport and postal services”, “Wholesale and retail trade”, “Scientific research, professional, and technical services”, “Education and learning support”, “Construction”, “Finance and insurance”, “Mining and quarrying of stone”, “Accommodation, eating, and drinking services”, “Information and communications”, “Living-related and personal services and amusement services”, “Manufacturing”, “Electricity, gas, heat, and water supply”, “Agriculture, forestry, and fisheries”, “Real estate and goods rental and leasing”, “Miscellaneous business services, n.e.c”. |
| Number of employees | Numerical answer | |
| Annual sales | Numerical answer | |
| Business contents | Descriptive answer | |
| Key business partner | Descriptive answer | |
| Location | Descriptive answer | |
| Contact information | Descriptive answer |
Table 8.
Descriptive statistics based on the results of the questionnaire survey.
| Variable | N | Mean | Median | SD | Min | Max |
|---|---|---|---|---|---|---|
| Response variable | ||||||
| Provided some support for the recovery of regional society (dummy) | 131 | - | - | - | 0 | 1 |
| Provided funding support (dummy) | 18 | - | - | - | 0 | 1 |
| Provided daily commodities support (dummy) | 51 | - | - | - | 0 | 1 |
| Provided equipment and materials support (dummy) | 60 | - | - | - | 0 | 1 |
| Provided human resources support (dummy) | 78 | - | - | - | 0 | 1 |
| Provided useful information support (dummy) | 20 | - | - | - | 0 | 1 |
| Provided temporary use of lands or buildings support (dummy) | 15 | - | - | - | 0 | 1 |
| Explanatory variable | ||||||
| Number of employees | 400 | 32.2 | 7 | 169.3 | 0 | 3049 |
| 0 (dummy) | 16 | - | - | - | 0 | 1 |
| 1–7 (dummy) | 304 | - | - | - | 0 | 1 |
| 8–20 (dummy) | ||||||
| 21–100 (dummy) | 64 | - | - | - | 0 | 1 |
| >101 (dummy) | 16 | - | - | - | 0 | 1 |
| The ratio of damage amount to annual sales [%] | 337 | 36.8 | 29.4 | 149.1 | 0.0 | 1500.0 |
| Industry type | ||||||
| Medical, Health Care, and Welfare (dummy) | 29 | - | - | 0 | 1 | |
| Transport and Postal Services (dummy) | 24 | - | - | 0 | 1 | |
| Wholesale and Retail Trade (dummy) | 78 | - | - | 0 | 1 | |
| Scientific Research, Professional, and Technical Services (dummy) | 3 | - | - | 0 | 1 | |
| Education and Learning Support (dummy) | 4 | - | - | 0 | 1 | |
| Construction (dummy) | 120 | - | - | 0 | 1 | |
| Mining and Quarrying of Stone (dummy) | 1 | - | - | 0 | 1 | |
| Accommodation, Eating, and Drinking Services (dummy) | 8 | - | - | 0 | 1 | |
| Information and Communications (dummy) | 4 | - | - | 0 | 1 | |
| Living-related and Personal Services and Amusement Services (dummy) | 11 | - | - | 0 | 1 | |
| Manufacturing (dummy) | 42 | - | - | 0 | 1 | |
| Electricity, Gas, Heat, and Water Supply (dummy) | 10 | - | - | 0 | 1 | |
| Agriculture, Forestry, and Fisheries (dummy) | 2 | - | - | 0 | 1 | |
| Real Estate and Goods Rental and Leasing (dummy) | 20 | - | - | 0 | 1 | |
| Miscellaneous Business Services, n.e.c. (dummy) | 44 | - | - | 0 | 1 | |
| Location of main customers | ||||||
| Inside the same city limits (dummy) | 157 | - | - | 0 | 1 | |
| Outside the city limits and inside Miyagi Pref. limits (dummy) | 227 | - | - | 0 | 1 | |
| Outside Miyagi Pref. limits (dummy) | 127 | - | - | 0 | 1 | |
| Awareness | ||||||
| Consideration toward the recovery of regional society before the disaster | ||||||
| Having awareness of contributions to the recovery of regional society, and having already conducted related activities (dummy) | 117 | - | - | - | 0 | 1 |
| Having awareness of contributions to the recovery of regional society, but having conducted no related activities earlier (dummy) | 112 | - | - | - | 0 | 1 |
| Not having the capacity to contribute (dummy) | 139 | - | - | - | 0 | 1 |
| Having never thought about making contributions (dummy) | 9 | - | - | - | 0 | 1 |
| Geographical location | ||||||
| Distance from coastal line [km] | 389 | 7.40 | 7.31 | 3.24 | 1.12 | 17.45 |
| Districts without tsunami damage far from the devastated area (dummy) | 42 | - | - | - | 0 | 1 |
| Districts without tsunami damage near the devastated area (dummy) | 261 | - | - | - | 0 | 1 |
| Partially destroyed or flooded area (dummy) | 44 | - | - | - | 0 | 1 |
| Large-scale partially destroyed area (dummy) | 37 | - | - | - | 0 | 1 |
| Completely destroyed area (dummy) | 5 | - | - | - | 0 | 1 |
| Surrounding land use | ||||||
| Rice field area [%] | 389 | 19.12 | - | 25.82 | 0 | 100 |
| Other farm area [%] | 389 | 5.36 | - | 11.07 | 0 | 100 |
| Forest area [%] | 389 | 4.87 | - | 12.51 | 0 | 86.27 |
| Waste land area [%] | 389 | 0.48 | - | 3.01 | 0 | 33.96 |
| Buildings area [%] | 389 | 34.83 | - | 34.66 | 0 | 100 |
| Roads area [%] | 389 | 0.57 | - | 1.97 | 0 | 18.75 |
| Golf area [%] | 389 | 0.20 | - | 3.13 | 0 | 61.54 |
| Rivers, lakes, and ponds area [%] | 389 | 3.10 | - | 11.02 | 0 | 50 |
Table 9.
Results of the parameter estimation for “some support”.
| Explanatory Variable | Estimate | S.E | Z | Pr(>|z|) | Crude OR (95% CI) | adj. OR (95% CI) | |
|---|---|---|---|---|---|---|---|
| Category | Value | ||||||
| (Intercept) | −2.041 | 0.282 | −7.241 | 4.46 × 10⁻¹³ *** | |||
| Number of employees | 1–7 | 0.325 | 0.237 | 1.372 | 0.170 | 1.10 (0.72–1.67) | 1.38 (0.87–2.20) |
| Awareness | Having awareness of contributions to the recovery of regional society, and having already conducted related activities | 1.481 | 0.245 | 6.039 | 1.55 × 10⁻⁹ *** | 4.11 (2.60–6.49) | 4.4 (2.72–7.11) |
| Location of main customers | Inside the same city limits | 0.471 | 0.234 | 2.017 | 0.044 * | 1.70 (1.11–2.59) | 1.60 (1.01–2.53) |
| Surrounding land use | Rice field area | 0.579 | 0.461 | 1.256 | 0.209 | 1.25 (0.56–2.78) | 1.78 (0.72–4.40) |
| Building area | 0.999 | 0.339 | 2.945 | 0.003 ** | 2.61 (1.43–4.75) | 2.72 (1.40–5.28) | |
Null deviance: 505.92 on 399 degrees of freedom. Residual deviance: 451.35 on 394 degrees of freedom. AIC: 463.35. None of the VIF was over 10.0. Mean VIF of the model was 1.058 with a maximum of 1.074 and minimum of 1.019. *** 0 is not included in 99.9% Wald confidence interval. ** 0 is not included in 99% Wald confidence interval. * 0 is not included in 95% Wald confidence interval.
Table 10.
Results of parameter estimation for funding support.
| Explanatory Variable | Estimate | S.E | Z | Pr(>|z|) | Crude OR (95% CI) | adj. OR (95% CI) | |
|---|---|---|---|---|---|---|---|
| Category | Value | ||||||
| (Intercept) | −3.726 | 0.417 | −8.936 | <2 × 10⁻¹⁶ *** | |||
| Number of employees | 21–100 | −1.484 | 1.056 | −1.406 | 0.160 | 0.3 (0.04–2.28) | 0.23 (0.03–1.80) |
| Awareness | Having awareness of contributions to the recovery of regional society, and having already conducted related activities | 1.484 | 0.517 | 2.869 | 0.004 ** | 4.09 (1.55–10.83) | 4.41 (1.60–12.16) |
| Industry type | Manufacturing | 1.010 | 0.688 | 1.468 | 0.142 | 1.76 (0.49–6.35) | 2.75 (0.71–10.57) |
| Agriculture, Forestry, and Fisheries | 2.242 | 1.457 | 1.538 | 0.124 | 22.41 (1.34–373.77) | 9.41 (0.54–163.64) | |
Null deviance: 146.82 on 399 degrees of freedom. Residual deviance: 132.06 on 395 degrees of freedom. AIC: 142.06. None of the VIF was over 10.0. Mean VIF of the model was 1.037 with a maximum of 1.056 and minimum of 1.020. ** 0 is not included in 99% Wald confidence interval.
Table 11.
Results of parameter estimation for daily commodities support.
| Explanatory Variable | Estimate | S.E | z | Pr(>|z|) | Crude OR (95% CI) | adj. OR (95% CI) | |
|---|---|---|---|---|---|---|---|
| Category | Value | ||||||
| (Intercept) | −3.322 | 0.398 | -8.343 | <2 × 10⁻¹⁶ *** | |||
| Awareness | Having awareness of contributions to the recovery of regional society, and having already conducted related activities | 1.378 | 0.322 | 4.279 | 1.88 × 10⁻⁵ *** | 3.56 (1.95–6.49) | 3.97 (2.11–7.46) |
| Industry type | Wholesale and Retail Trade | 0.631 | 0.472 | 1.337 | 0.181 | 1.01 (0.48–2.11) | 1.88 (0.74–4.75) |
| Construction | 0.603 | 0.409 | 1.473 | 0.141 | 1.20 (0.65–2.23) | 1.83 (0.82–4.07) | |
| Accommodation, Eating, and Drinking Services | 2.659 | 0.825 | 3.224 | 0.001 ** | 7.34 (1.78–30.34) | 14.28 (2.84–71.92) | |
| Manufacturing | 1.083 | 0.538 | 2.014 | 0.044 * | 1.43 (0.60–3.41) | 2.95 (1.03–8.47) | |
| Location of main customers | Inside the same city limits | 0.658 | 0.248 | −2.012 | 0.044 * | 1.87 (1.04–3.38) | 1.93 (1.03–3.61) |
Null deviance: 305.29 on 399 degrees of freedom. Residual deviance: 272.26 on 393 degrees of freedom. AIC: 286.26. None of the VIF was over 10.0. Mean VIF of the model was 1.257 with a maximum of 1.545 and minimum of 1.026. *** 0 is not included in 99.9% Wald confidence interval. ** 0 is not included in 99% Wald confidence interval. * 0 is not included in 95% Wald confidence interval.
Table 12.
Results of parameter estimation for equipment and materials support.
| Explanatory Variable | Estimate | S.E | Z | Pr(>|z|) | Crude OR (95% CI) | adj. OR (95% CI) | |
|---|---|---|---|---|---|---|---|
| Category | Value | ||||||
| (Intercept) | −3.463 | 0.428 | −8.088 | 6.05 × 10⁻¹⁶ *** | |||
| Number of employees | 21–100 | 0.758 | 0.375 | 2.024 | 0.043* | 1.98 (1.03–3.82) | 2.13 (1.02–4.45) |
| Awareness | Having awareness of contributions to the recovery of regional society, and having already conducted related activities | 1.225 | 0.301 | 4.074 | 4.62 × 10⁻⁵ *** | 3.72 (2.12–6.55) | 3.4 (1.89–6.13) |
| Industry type | Wholesale and Retail Trade | 0.655 | 0.454 | 1.443 | 0.149 | 0.91 (0.45–1.85) | 1.93 (0.79–4.69) |
| Construction | 1.008 | 0.382 | 2.639 | 0.008 ** | 1.81 (1.03–3.17) | 2.74 (1.30–5.79) | |
| Agriculture, Forestry, and Fisheries | 1.907 | 1.481 | 1.288 | 0.198 | 5.75 (0.35–91.13) | 6.73 (0.37–122.69) | |
| Miscellaneous Business Services, n.e.c. | 0.702 | 0.508 | 1.382 | 0.167 | 1.30 (0.57–2.95) | 2.02 (0.75–5.45) | |
| Surrounding land use | Rice field area | 1.166 | 0.577 | 2.022 | 0.043 * | 2.35 (0.87–6.33) | 3.21 (1.04–9.93) |
| Building area | 0.688 | 0.460 | 1.496 | 0.135 | 1.86 (0.86–4.0) | 1.99 (0.81–4.9) | |
Null deviance: 338.17 on 399 degrees of freedom. Residual deviance: 300.85 on 391 degrees of freedom. AIC: 318.85. None of the VIF was over 10.0. Mean VIF of the model was 1.235 with a maximum of 1.610 and minimum of 1.030. *** 0 is not included in 99.9% Wald confidence interval. ** 0 is not included in 99% Wald confidence interval. * 0 is not included in 95% Wald confidence interval.
Table 13.
Results of parameter estimation for human resources support.
| Explanatory Variable | Estimate | S.E | z | Pr(>|z|) | Crude OR (95% CI) | adj. OR (95% CI) | |
|---|---|---|---|---|---|---|---|
| Category | Value | ||||||
| (Intercept) | −3.208 | 0.368 | −8.729 | <2 × 10⁻¹⁶ *** | |||
| Awareness | Having awareness of contributions to the recovery of regional society, and having already conducted related activities | 1.452 | 0.276 | 5.270 | 1.37 × 10⁻⁷ *** | 4.12 (2.46–6.90) | 4.27 (2.49–7.33) |
| Distance from coastline | Districts without tsunami damage near the devastated area | 0.651 | 0.324 | 2.013 | 0.044 * | 2.19 (1.22–3.92) | 1.92 (1.02–3.62) |
| Location of main customers | Inside the same city limits | 0.659 | 0.275 | 2.402 | 0.016 * | 1.94 (1.18–3.20) | 1.93 (1.13–3.31) |
| Surrounding land use | Building area | 1.199 | 0.383 | 3.133 | 0.002 ** | 4.22 (2.10–8.46) | 3.32 (1.57–7.02) |
Null deviance: 394.71 on 399 degrees of freedom. Residual deviance: 340.90 on 395 degrees of freedom. AIC: 350.90. None of the VIF was over 10.0. Mean VIF of the model was 1.032 with a maximum of 1.053 and minimum of 1.012. *** 0 is not included in 99.9% Wald confidence interval. ** 0 is not included in 99% Wald confidence interval. * 0 is not included in 95% Wald confidence interval.
Table 14.
Results of parameter estimation for useful information support.
| Explanatory Variable | Estimate | S.E | z | Pr(>|z|) | Crude OR (95% CI) | adj. OR (95% CI) | |
|---|---|---|---|---|---|---|---|
| Category | Value | ||||||
| (Intercept) | −4.804 | 0.563 | −8.538 | < 2 × 10⁻¹⁶ *** | |||
| Number of employees | 21–100 | 0.918 | 0.573 | 1.602 | 0.109 | 2.38 (0.88–6.44) | 2.50 (0.81–7.70) |
| Awareness | Having awareness of contributions to the recovery of regional society, and having already conducted related activities | 1.495 | 0.524 | 2.854 | 0.004 ** | 4.93 (1.91–12.69) | 4.46 (1.60–12.44) |
| Industry type | Agriculture, Forestry, and Fisheries | 2.976 | 1.504 | 1.978 | 0.048 * | 19.95 (1.20–331.27) | 19.61 (1.03–374.13) |
| Real Estate and Goods Rental and Leasing | 2.456 | 0.725 | 3.390 | 7 × 10⁻⁴ *** | 5.69 (1.71–18.97) | 11.66 (2.82–48.27) | |
| Surrounding land use | Buildings area | 1.507 | 0.682 | 2.210 | 0.027 * | 4.85 (1.41–16.71) | 4.51 (1.19–17.16) |
Null deviance: 158.81 on 399 degrees of freedom. Residual deviance: 128.85 on 394 degrees of freedom. AIC: 140.85. None of the VIF was over 10.0. Mean VIF of the model was 1.100 with a maximum of 1.142 and minimum of 1.066. *** 0 is not included in 99.9% Wald confidence interval. ** 0 is not included in 99% Wald confidence interval. * 0 is not included in 95% Wald confidence interval.
Table 15.
Results of parameter estimation for temporary use of land and buildings.
| Explanatory Variable | Estimate | S.E | Z | Pr(>|z|) | Crude OR (95% CI) | adj. OR (95% CI) | |
|---|---|---|---|---|---|---|---|
| Category | Value | ||||||
| (Intercept) | −4.596 | 0.569 | −8.080 | 6.45 × 10⁻¹⁶ *** | |||
| The ratio of damage amount to annual sales | 0.0810 | 0.105 | 0.774 | 0.439 | 1.16 (0.96–1.39) | 1.08 (0.88–1.33) | |
| Awareness | Having awareness of contributions to the recovery of regional society, and having already conducted related activities | 1.478 | 0.573 | 2.577 | 9.95 × 10⁻³ *** | 5.20 (1.74–15.55) | 4.38 (1.42–13.48) |
| Location of main customers | Inside the same city limits | 0.750 | 0.555 | 1.352 | 0.176 | 2.38 (0.83–6.81) | 2.12 (0.71–6.27) |
| Distance from coastline | Large-scale partially destroyed area | 1.311 | 0.609 | 2.152 | 0.031* | 5.52 (1.78–17.12) | 3.71 (1.12–12.24) |
Null deviance: 127.93 on 399 degrees of freedom. Residual deviance: 111.02 on 395 degrees of freedom. AIC: 121.02. None of the VIF was over 10.0. Mean VIF of the model was 1.026 with a maximum of 1.041 and minimum of 1.006. *** 0 is not included in 99.9% Wald confidence interval. * 0 is not included in 95% Wald confidence interval.
Table 16.
Summary of the characteristics of the corporations that provided support.
| Type of Support | Awareness | Number of Employees | Industry Type | Location of Main Customers | Surrounding Land Use | Damage Caused by the Tsunami |
|---|---|---|---|---|---|---|
| Some of the support | HAA *** | |||||
| Funding | HAA ** | |||||
| Daily commodities | HAA *** | ACCO *** MANU * | Inside the same city limits * | |||
| Equipment and materials | HAA *** | 21–100 * | CONS ** | Rice field area * | ||
| Human resources | HAA *** | Inside the same city limits * | Building area ** | Districts without tsunami damage near the devastated area * | ||
| Useful information | HAA ** | REAL *** | Building area * | |||
| Temporary use of lands and buildings | HAA ** | Large-scale partially destroyed area * |
*** 0 is not included in 99.9% Wald confidence interval. ** 0 is not included in 99% Wald confidence interval. * 0 is not included in 95% Wald confidence interval.
© 2018 by the authors. Licensee MDPI, Basel, Switzerland. This article is an open access article distributed under the terms and conditions of the Creative Commons Attribution (CC BY) license (http://creativecommons.org/licenses/by/4.0/).
Share and Cite
MDPI and ACS Style
Fukumoto, R.; Genda, Y.; Ishikawa, M. Characteristics of Corporate Contributions to the Recovery of Regional Society from the Great East Japan Earthquake Disaster. Sustainability 2018, 10, 1717. https://doi.org/10.3390/su10061717
AMA Style
Fukumoto R, Genda Y, Ishikawa M. Characteristics of Corporate Contributions to the Recovery of Regional Society from the Great East Japan Earthquake Disaster. Sustainability. 2018; 10(6):1717. https://doi.org/10.3390/su10061717
Chicago/Turabian StyleFukumoto, Rui, Yuji Genda, and Mikiko Ishikawa. 2018. "Characteristics of Corporate Contributions to the Recovery of Regional Society from the Great East Japan Earthquake Disaster" Sustainability 10, no. 6: 1717. https://doi.org/10.3390/su10061717
Note that from the first issue of 2016, this journal uses article numbers instead of page numbers. See further details here.