Vehicle Weight, Modal Split, and Emissions—An Ex-Post Analysis for Sweden


Swedish National Road and Transport Research Institute, P.O. Box 55685, 102 15 Stockholm, Sweden
*
Author to whom correspondence should be addressed.
Sustainability 2018, 10(6), 1731; https://doi.org/10.3390/su10061731
Submission received: 27 April 2018
/
Revised: 18 May 2018
/
Accepted: 23 May 2018
/
Published: 25 May 2018
(This article belongs to the Special Issue Sustainable Freight Transport)
Abstract
:This study combines official statistics on freight transportation and emissions to present the long-run development of the use of longer and heavier road vehicles (LHVs), modal split, road freight efficiency, and GHG emissions and air pollution following the increase in the maximum permissible vehicle weight in Sweden in 1990 and 1993. We find that LHVs were quickly incorporated in the vehicle fleet and that road freight efficiency of the largest vehicles increased after the reforms. There was no discernable break in modal split trends as the modal share for road continued its long-run development. We show that road transportation contributes by far the most to emission costs. The composition of the emissions from road freight changed after the weight reforms, with an increasing share of GHG-emissions.
1. Introduction
The past decade has seen an active debate among policy-makers and researchers about the cost and benefits associated with allowing larger-than-conventional road freight vehicles [1,2]. This topic has gained much attention, not least considering the freight sector’s contribution to the emissions of greenhouse gases (GHG) and air pollution. Allowing higher road vehicle dimensions is hypothesized to influence many important outcomes, including infrastructure, traffic safety, modal split, vehicle operating cost, as well as emissions of GHG and air pollution. The impacts of LHVs on traffic safety, road infrastructure and investments are covered in Steer et al. [3], Ortega et al. [1], and Ericsson et al. [4] but are outside the scope of this study. However, despite the wide-spread interest in these impacts there is limited empirical evidence on the consequences of longer and heavier vehicles (LHVs).
The purpose of this study is to provide an ex-post analysis of the use of LHVs, modal split, road freight efficiency, and emissions of GHG and air pollution following the increased maximum truck weights in Sweden in 1990 and 1993. Sweden offers an ideal setting to study this topic since it is one of few countries in the world where full-scale implementation of LHVs has been in place for several decades. Table 1 shows the development of maximum vehicle weight and length in Sweden. Restrictions on the dimensions were first set in 1968 (37 tonnes, 24 m) and subsequently increased in 1974, 1990, 1993, 1997, and 2015. Our analysis focus on the reforms increasing the dimensions from 51.4 tonnes (and 24 m) to 60 tonnes (24 m) which we will refer to as the introduction of longer and heavier vehicles (LHVs). We refrain from analyzing the length reform in 1996 which increased the maximum length of vehicle combinations from 24 to 25.25 m.
The analysis is based on official statistics of annual domestic freight transportation by road, rail, and water covering the period 1985 to 2013, as well as calculations of GHG and air pollution spanning from 1990 to 2013. The regulation framework and our wide-spanning data coverage offer a unique setting for studying the large-scale implementation of LHVs over time. We find that, after the weight reforms, there was a substantial increase in the share of road transport performance by trucks with a load capacity above 40 tonnes. The development mainly came at the expense of the vehicles with the lowest capacity. This shows the high degree of incorporation of LHVs in the Swedish vehicle fleet, which may be explained by the relatively large vehicle dimensions in Sweden that existed prior to the first reform in 1990 (see Table 1).
Our analysis of the modal split shows that the road share in Sweden increased steadily before, during, and immediately after the weight reforms, whereas the rail and water shares were decreasing during this period. We document increases in the levels of tonne-km by both road and rail during this time interval, which implies that the falling rail share was driven by relatively higher tonne-km growth for road than for rail transportation. After a decade, rail had regained its pre-form share of the market. There was no discernable break in modal split trends at the time of the weight reforms. On the contrary, the road share continued on its long-run development.
We find modest evidence that the efficiency of road freight improved. The transport performance per vehicle-km rose in the years during and after the weight reform, particularly among vehicles of the highest maximum load capacity.
Finally, we show that the composition of emissions from road freight changed in the years following the weight reforms. While greenhouse gases increased, emissions of particulate matter (PM), nitrogen dioxides (NOx), sulfur dioxide (SO2), and non-methane volatile organic compounds (NMVOC) had dropped significantly at the end of the 1990s. The consistent increase in road transport performance during this period led to falling emission factors (emissions per tonne-km) for each pollutant. We synthesize these findings by showing that, in the 1990s, the cost of road freight emissions remained constant while the cost of emissions from all modes decreased. Overall, our results suggest that allowing higher weight dimensions on a large scale would increase the use of those vehicles fairly quickly but not lead to considerably adverse environmental impacts, at least not in terms of the outcomes and time period considered in this study.
2. Related Studies
A large and growing body of literature examines the costs and benefits of allowing LHVs (see overviews in Ortega et al. [1] and Sanchez et al. [2]). There is widespread agreement in these studies that LHVs bring about reductions in the operating cost of road freight, fuel consumption, and emissions per tonne-km [3]. Increased truck capacity enables companies to consolidate loads and reduce the number of vehicle journeys needed to move a given amount of freight [5]. This gives rise to fuel savings which in turn translates into reduced cost for operating the vehicles. Several studies point out that although LHVs increase emission per vehicle-kilometre driven, they will bring about a reduction in emissions per tonne-kilometre [6,7,8]. Gutberlet et al. [9] show that the fuel and emission savings can be significant for individual companies, while the overall impact is limited if LHVs are restricted to certain areas or road segments.
A main concern of LHVs is that the cost reduction will attract freight from less environmentally-damaging modes and induce additional demand for freight transportation. In other words, there is a risk that increasing road freight transportation off-sets the social benefits stemming from the reduced environmental impact per tonne-km. The extent of the modal shift is subject to wide debate and research [10]. Many analyses of the modal shift effects of LHVs use modelling approaches which require assumptions about input parameters, including price elasticities, reductions in road haulage cost, and load factors. The results from the modelling studies vary considerably. Some predict substantial modal shifts [6,11,12] whereas others forecast only minor changes [13]. Steer et al. [3] summarize this strand of literature and conclude that the variation in predicted modal shift from adopting LHVs indeed tends to stem from different assumptions regarding own- and/or cross-price elasticities of the modes.
Empirical evidence of the effects of LHVs is relatively scarce and covers either full-scale implementation or temporary trials. In Australia, high capacity vehicles with a maximum length of 26 m and weight of 68.5 tonnes were introduced in 1984 and were permitted extensive network access, including main roads in urban areas [14]. These vehicles were gradually incorporated in the Australian vehicle fleet during the 1990s and 2000s. Their share of road freight went from practically zero in 1991 to a third in 2007 [15]. During this period, both road and rail freight transportation experienced an increase in transport performance at the expense of coastal shipping. Rail increased or maintained its share in the market for long-distance transport and bulk products but lost shares on shorter distances for non-bulk goods [16]. The growth in road freight was also promoted by increased demand for reliable and timely delivery as well as improvements in road infrastructure and vehicle technology [15]. The introduction of high capacity vehicles was estimated to have reduced fuel consumption in the articulated fleet by at least 11% [17].
In Finland, permission was granted to operate trucks of 76 tonnes and 30 m on designated parts on the road network. An evaluation of the trial showed that as of 2017, some 40 heavy trucks were being used to transport forest and agriculture products [18]. The trucks were considered economically viable for large shipment volumes and where loading and unloading would not become considerably harder or more time-consuming. The report concluded that a shift from rail freight traffic was likely to be most substantial for forestry products and GHG emissions from road traffic would be reduced by 77,000 tonnes annually if the estimated changes were realized.
In the Netherlands, several trials were conducted during the 2000s in which trucks with a capacity of 60 tonnes were allowed temporarily. Kindt et al. [19] evaluated the third trial by means of a stakeholder survey of terminal operators, shipping companies and transporters. They found that the modal split in terminals had been unchanged compared to the situation before the trials started. Jonkeren and Aarts [20] concluded that the number of LHVs operating in the Netherlands had increased substantially from 2001 to 2016 but that the shift of freight to LHVs solely was derived from regular trucks and not from rail and inland waterway transportation. Results from the trials showed that although fuel consumption per vehicle-km increased, the fuel efficiency (measured in relation to load) rose which led to lower emissions of GHG, NOx, and PM [21].
An evaluation of the Norwegian trial where trucks up to 60 tonnes and 25.25 m were allowed found that the actual usage of the LHVs during the period of study (2008–2013) had been relatively low. The firms that were using the LHVs did indeed experience large reductions in costs, largely because they could move the same amount of goods using fewer vehicles [22]. The results pointed towards lower emissions per tonne-km and/or cubic meter-km for LHVs compared to regular trucks, which suggested that these vehicles would bring about reductions in GHG, NOx, and PM.
Trials have also been conducted in Denmark, where vehicle dimension up to 60 tonnes and 25.25 m were temporarily allowed in 2008. The Danish Road Directorate [23] found in their analysis that after two years of trials, around 400 LHVs contributed to 3.6% of annual transport performance and were mainly being used on trip distances of around 200–300 km. Comparing road freight transportation in 2007 and 2010, the report concluded that using LHVs would not have changed the emission GHG significantly.
In Germany, permission was granted to vehicles with a maximum length of 25.25 m, compared to the conventional length of 18.75 m. An evaluation of the trials between 2012 and 2014 found that forwarders reported LHVs to bring about a cost advantage of 16% compared to conventional vehicles, given that they managed a utilization rate above 83% [24]. Although the LHVs required more fuel, the fact that fewer vehicles were required to move the same amount of freight yielded the cost reductions for firms. The report also showed that LHVs were used as a replacement for conventional trucks and none of the companies in the study adopted the LHV in favor of rail freight transportation.
Evaluations of the Swedish weight reforms in the 1990s have focused on modal shift effects and cost–benefit analysis. Nelldal [25] reviews the development in the freight market in the 1990s and argues that rail transportation stagnated during this period due to the truck weight reforms in 1990 and 1993. He estimates that the reforms jointly entailed a price reduction for road freight of 22% at full capacity utilization which is in line with subsequent estimates [7,26]. Nelldal et al. [27] argue that the decline of rail transportation also depended on the extension of the road network, lack of industrial railway tracks, and increasing foreign trade.
Vierth et al. [7] make use the Swedish national freight model Samgods to analyze how LHVs affect the Swedish freight market. They show that allowing trucks of trucks of 60 tonnes and 25.25 m reduce road vehicle-km substantially and leads to a higher tonne-km road share. Haraldsson et al. [28] use the Samgods model to conduct a cost benefit analysis of an increase in maximum weight from 60 tonnes to 90 tonnes. They find that such measure reduces the amount of road vehicle-km by 21%. Vierth and Karlsson [29] study the effects of allowing road vehicle combinations up to 25.25 m and 60 tonnes on a designated freight corridor between Sweden and Germany. They find that this increases the tonne-kilometre road freight transportation by 0.5% and decreases rail freight by 0.7%.
3. Methodology and Data
3.1. Methodology
Our analysis of the increase in road vehicle weight limits starts off by examining the uptake of LHVs in the vehicle fleet following the reforms in 1990 and 1993. We subsequently investigate the development along three other dimensions of the freight transportation market: the modal split, the efficiency of road freight and the emissions of GHG, NOx, PM, NMVOC, and SO2. Our methodological approach is to first compile the statistics of freight transportation activity and emissions per year and generate a set of time series of these outcomes. We subsequently plot each time series in a graph and rely on visual inspection to compare the outcome of interest before, during, and after the weight reforms in 1990 and 1993. We expect any effects of the reforms to be the most visible from the year of the first reform up to some years after the last reform and focus our analysis on this time horizon. It is more difficult to attribute changes over a 10–15-year interval to the weight reforms.
The statistics allow us to identify time trends in the outcomes and try determining whether the reforms had any impact on the development over time. This is an important distinction from simply assessing the post-reform development if there were underlying trends in the outcomes of interest before the reforms. We therefore put more weight on findings showing that the development of a particular outcome changed substantially during or after the weight reforms. This kind of investigation could also be implemented in a time series regression analysis, but we opt for graphing the outcomes and using ocular inspection instead. In our view, this approach increases the transparency by allowing the reader to assess the development of the outcomes. The limited number of observations also makes it difficult to implement test of structural breaks at the weight reforms in a regression analysis with robustness and precision.
Our methodological approach lets us analyze the overall development in the freight market but does not allow an identification of the isolated impact of higher vehicle weight limits. Other events in the transportation sector coinciding with the weight reforms are likely to also have mattered for the development, as are other structural changes during this period. We return to this point in the analysis of the results.
3.2. Data
We combine data from several sources to conduct our analysis. Our measures of the use of LHVs in Sweden, the road freight efficiency and the modal split are based on annual freight transportation statistics for domestic transportation. The statistics cover road, rail, and waterborne transportation (the latter includes only short-sea shipping and not inland waterway transportation). The figures come from various governmental authorities which have been or are responsible for collecting the data during our sample period (State Railways, Statistics Sweden, SIKA and Transport Analysis). The modal split is measured in tonne-kms and covers domestic transportation because the weight reforms only applied in Sweden. Road freight surveys have been conducted annually in Sweden except for the period 1987–1993 when only three surveys were made. Statistics Sweden therefore imputed aggregate road freight statistics for the years 1988, 1989, 1991, and 1992, which we use in our analysis. However, disaggregated statistics are completely missing for these years which causes a break in the time series of the use of LHVs.
Our analysis of emissions is based on information about the emission of GHG and air pollution from domestic transportation on Swedish territory and is compiled by the Swedish Environmental Protection Agency. Vehicle-km performed by non-Swedish trucks on Swedish roads are excluded based on the statistics authority’s data for 2000–2013. The share ranged from 11% in 2000 to 17% in 2013. We extrapolate this trend from 1990 to 2000.
We assign monetary values on the yearly emissions based on the European handbook on external costs of transport and show the cost of emissions from each mode and by pollutant [30]. This exercise requires some assumptions about the transportation sector in Sweden. First, we assume that freight transportation constitutes 70% of the transport performance of rail (and that the rest is passenger transportation). Second, based on studies finding that the fuel consumption of water transportation is twice the size of that reported in the sales statistics, we multiply the emissions from water transportation by two [31]. These assumptions change the level of emissions from water transportation but affects emissions by rail only marginally as this mode is powered by electricity. Table 2 shows the value per tonne and pollutant based on our assumptions (in 2010 price levels). Each figure shows the external cost of a tonne emitted of the corresponding pollutant. The external cost refers to the cost to society due to freight transport (e.g., health cost, material and biosphere damages) that is not borne by the transport user.
Table 3 shows summary statistics for the outcomes of interest as well as the data coverage over time. Our analysis of the use of LHVs, modal split development and road freight efficiency covers the time 1985–2013 and the analysis of road freight emissions range from 1990 to 2013. See Vierth et al. [32] for further details about the data.
4. Results
In this section, we present the development of the four outcomes of interest. We start by the use of LHVs and subsequently investigate the modal split development, road freight efficiency, and emissions.
4.1. Use of LHVs
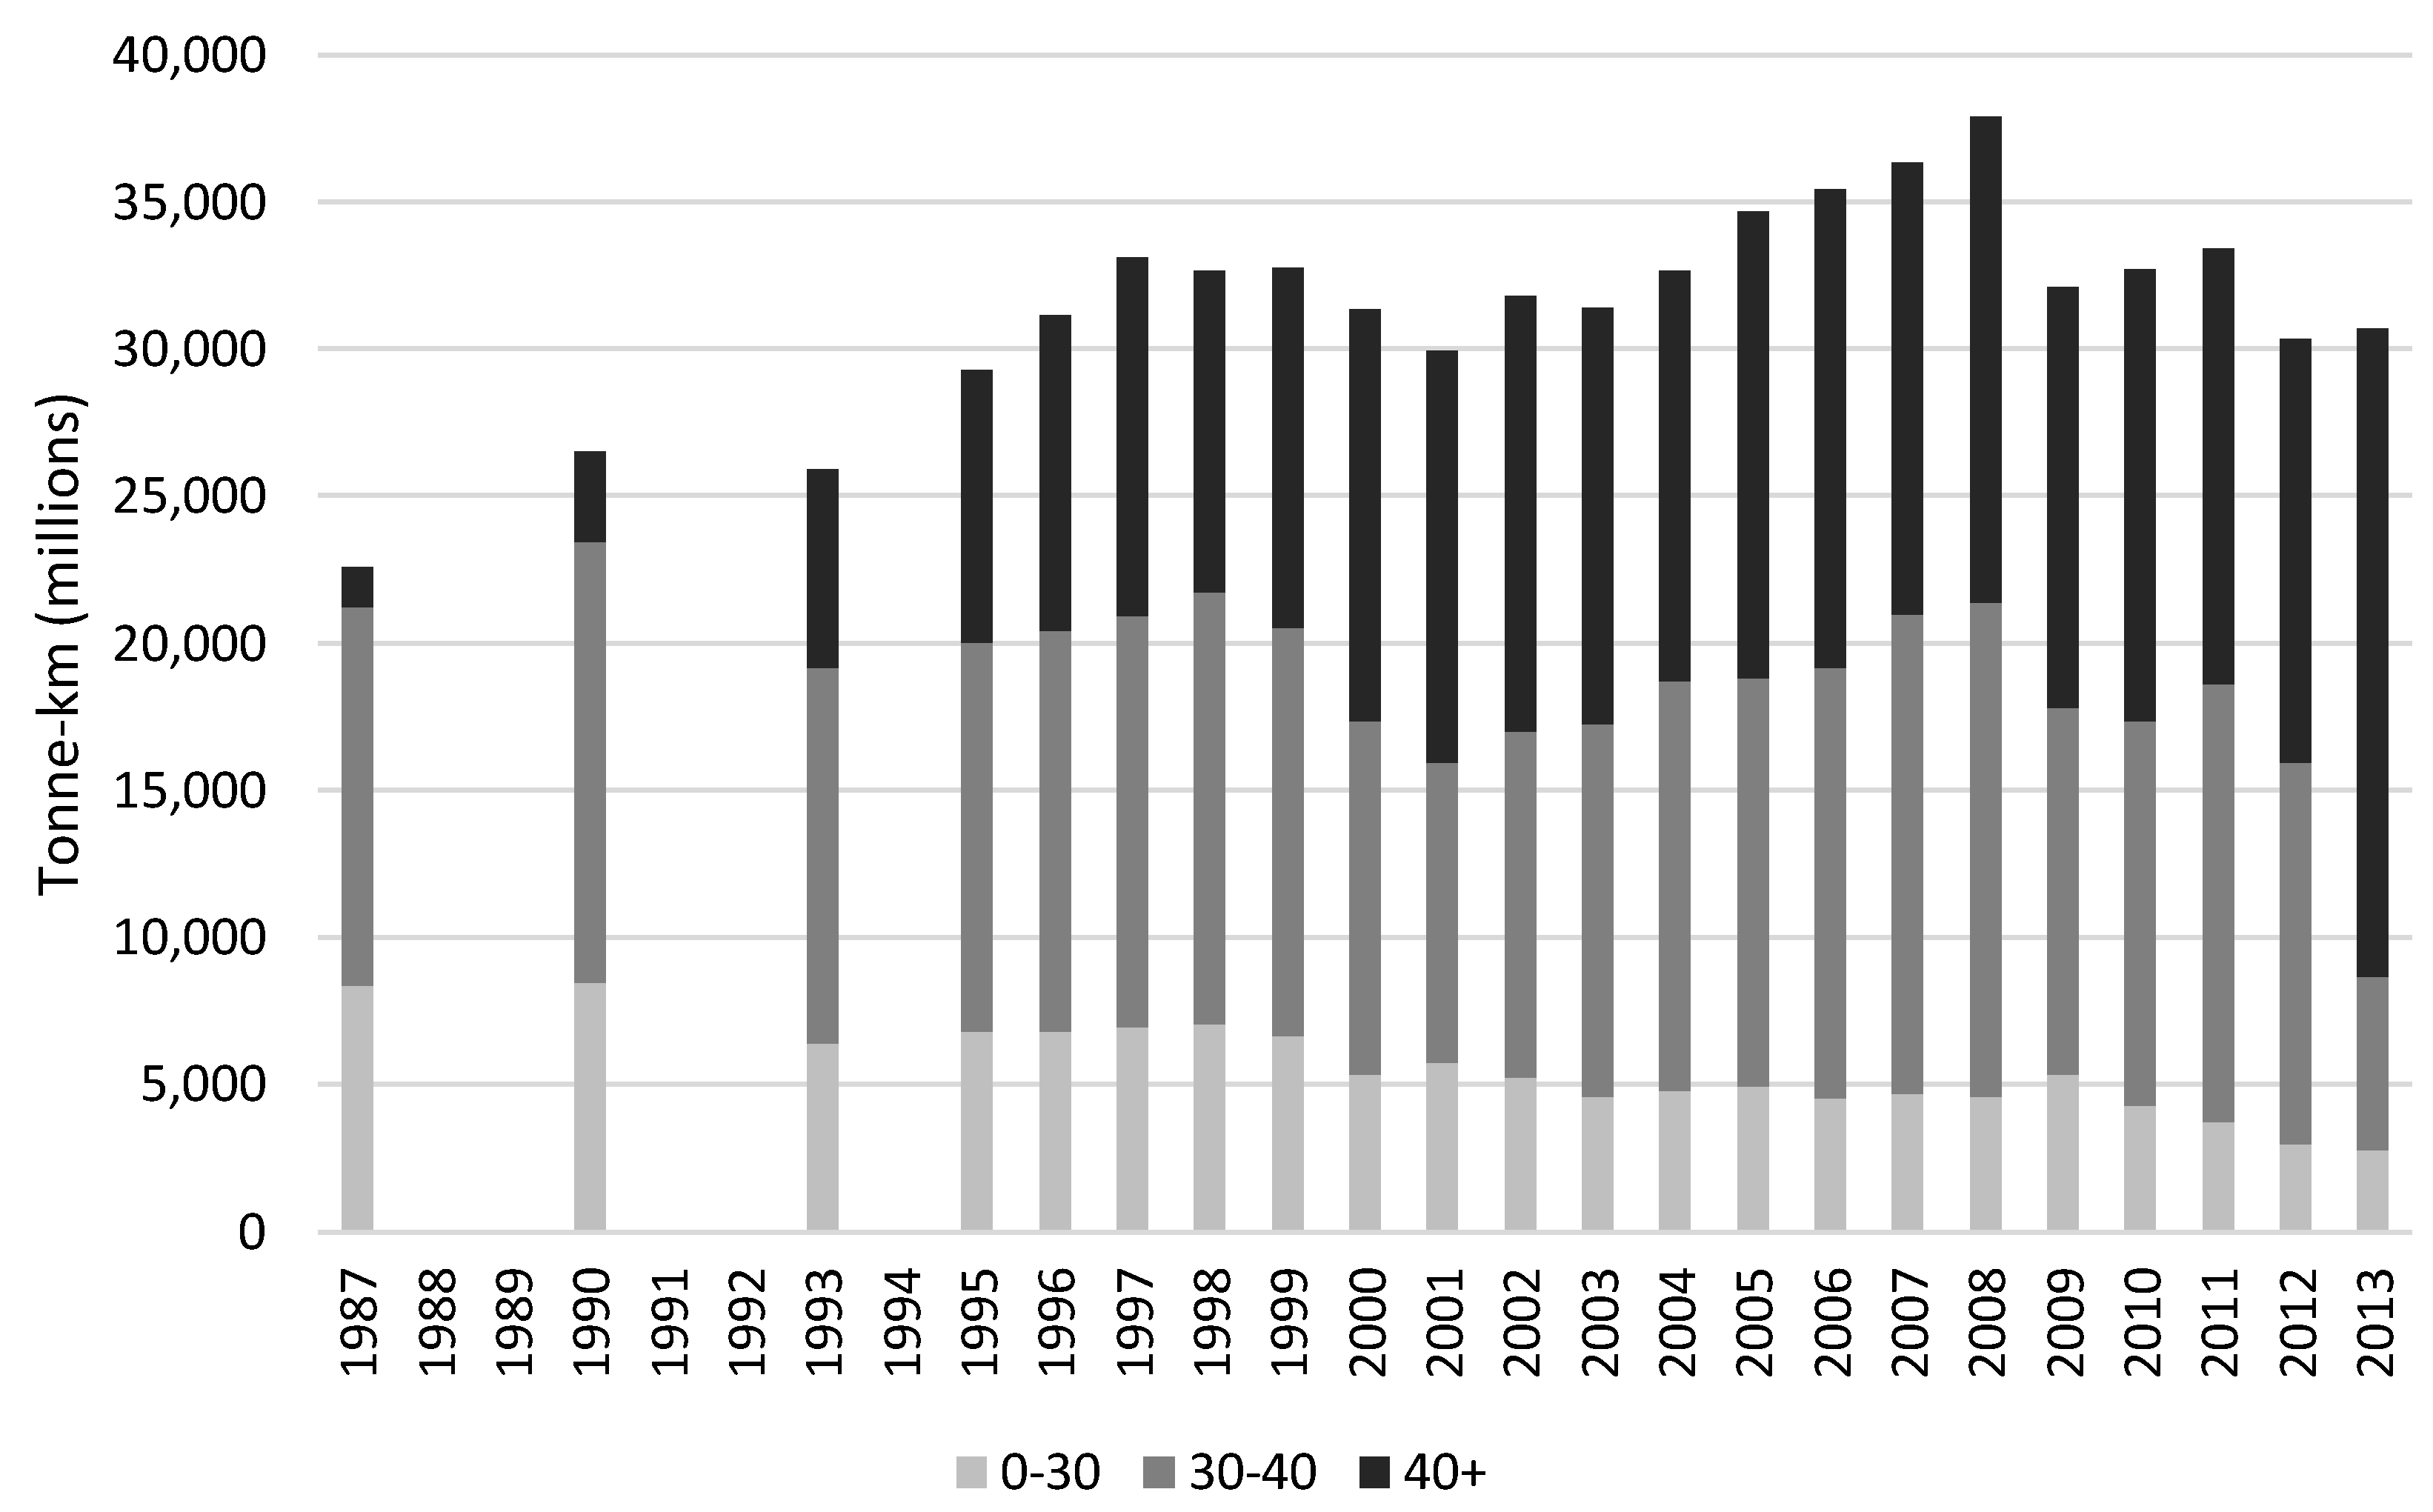
To track the uptake of LHVs in Sweden over time we use road freight statistics segmented by maximum payload of the road vehicle combinations, defined as the sum of the load capacity of the truck and the load capacity of trailers. We divide the vehicle combinations into three categories based on their maximum payload (0–30, 30–40, and 40+ tonnes) and show the tonne-km for each segment in Figure 1. As a rule of thumb, vehicles of length 24–25.25 m and weight of 60–64 tonnes, are assumed to have a maximum payload between 30–42 tonnes [33]. The absence of road freight surveys in the late 1980s and early 1990s causes breaks in the time series.
Figure 1 shows that at the time of the weight limit increase in 1990, trucks with a maximum load capacity above 30 tonnes already accounted for more than 60% of the road transport performance. This reflects the fact the maximum permissible weight had been high for a long period of time in Sweden. The share of tonne-km performed by trucks with a load capacity above 40 tonnes increased substantially in the 1990s, from 10% in 1990 to 45% in 2000, which shows the high degree of incorporation of LHVs in the Swedish vehicle fleet. The development mainly came at the expense of the vehicles with the lowest capacity, which saw its share go from 35% in 1990 to 15% in 2000.
During the 2000s, the tonne-km by trucks with a load capacity above 30 tonnes expanded moderately and peaked just before the economic recession in 2009. The activity by trucks in the smallest capacity segment declined somewhat during this period. Since 2009, the largest trucks have increased their share of road transport performance considerably and reached their peak in 2013.
4.2. Modal Split
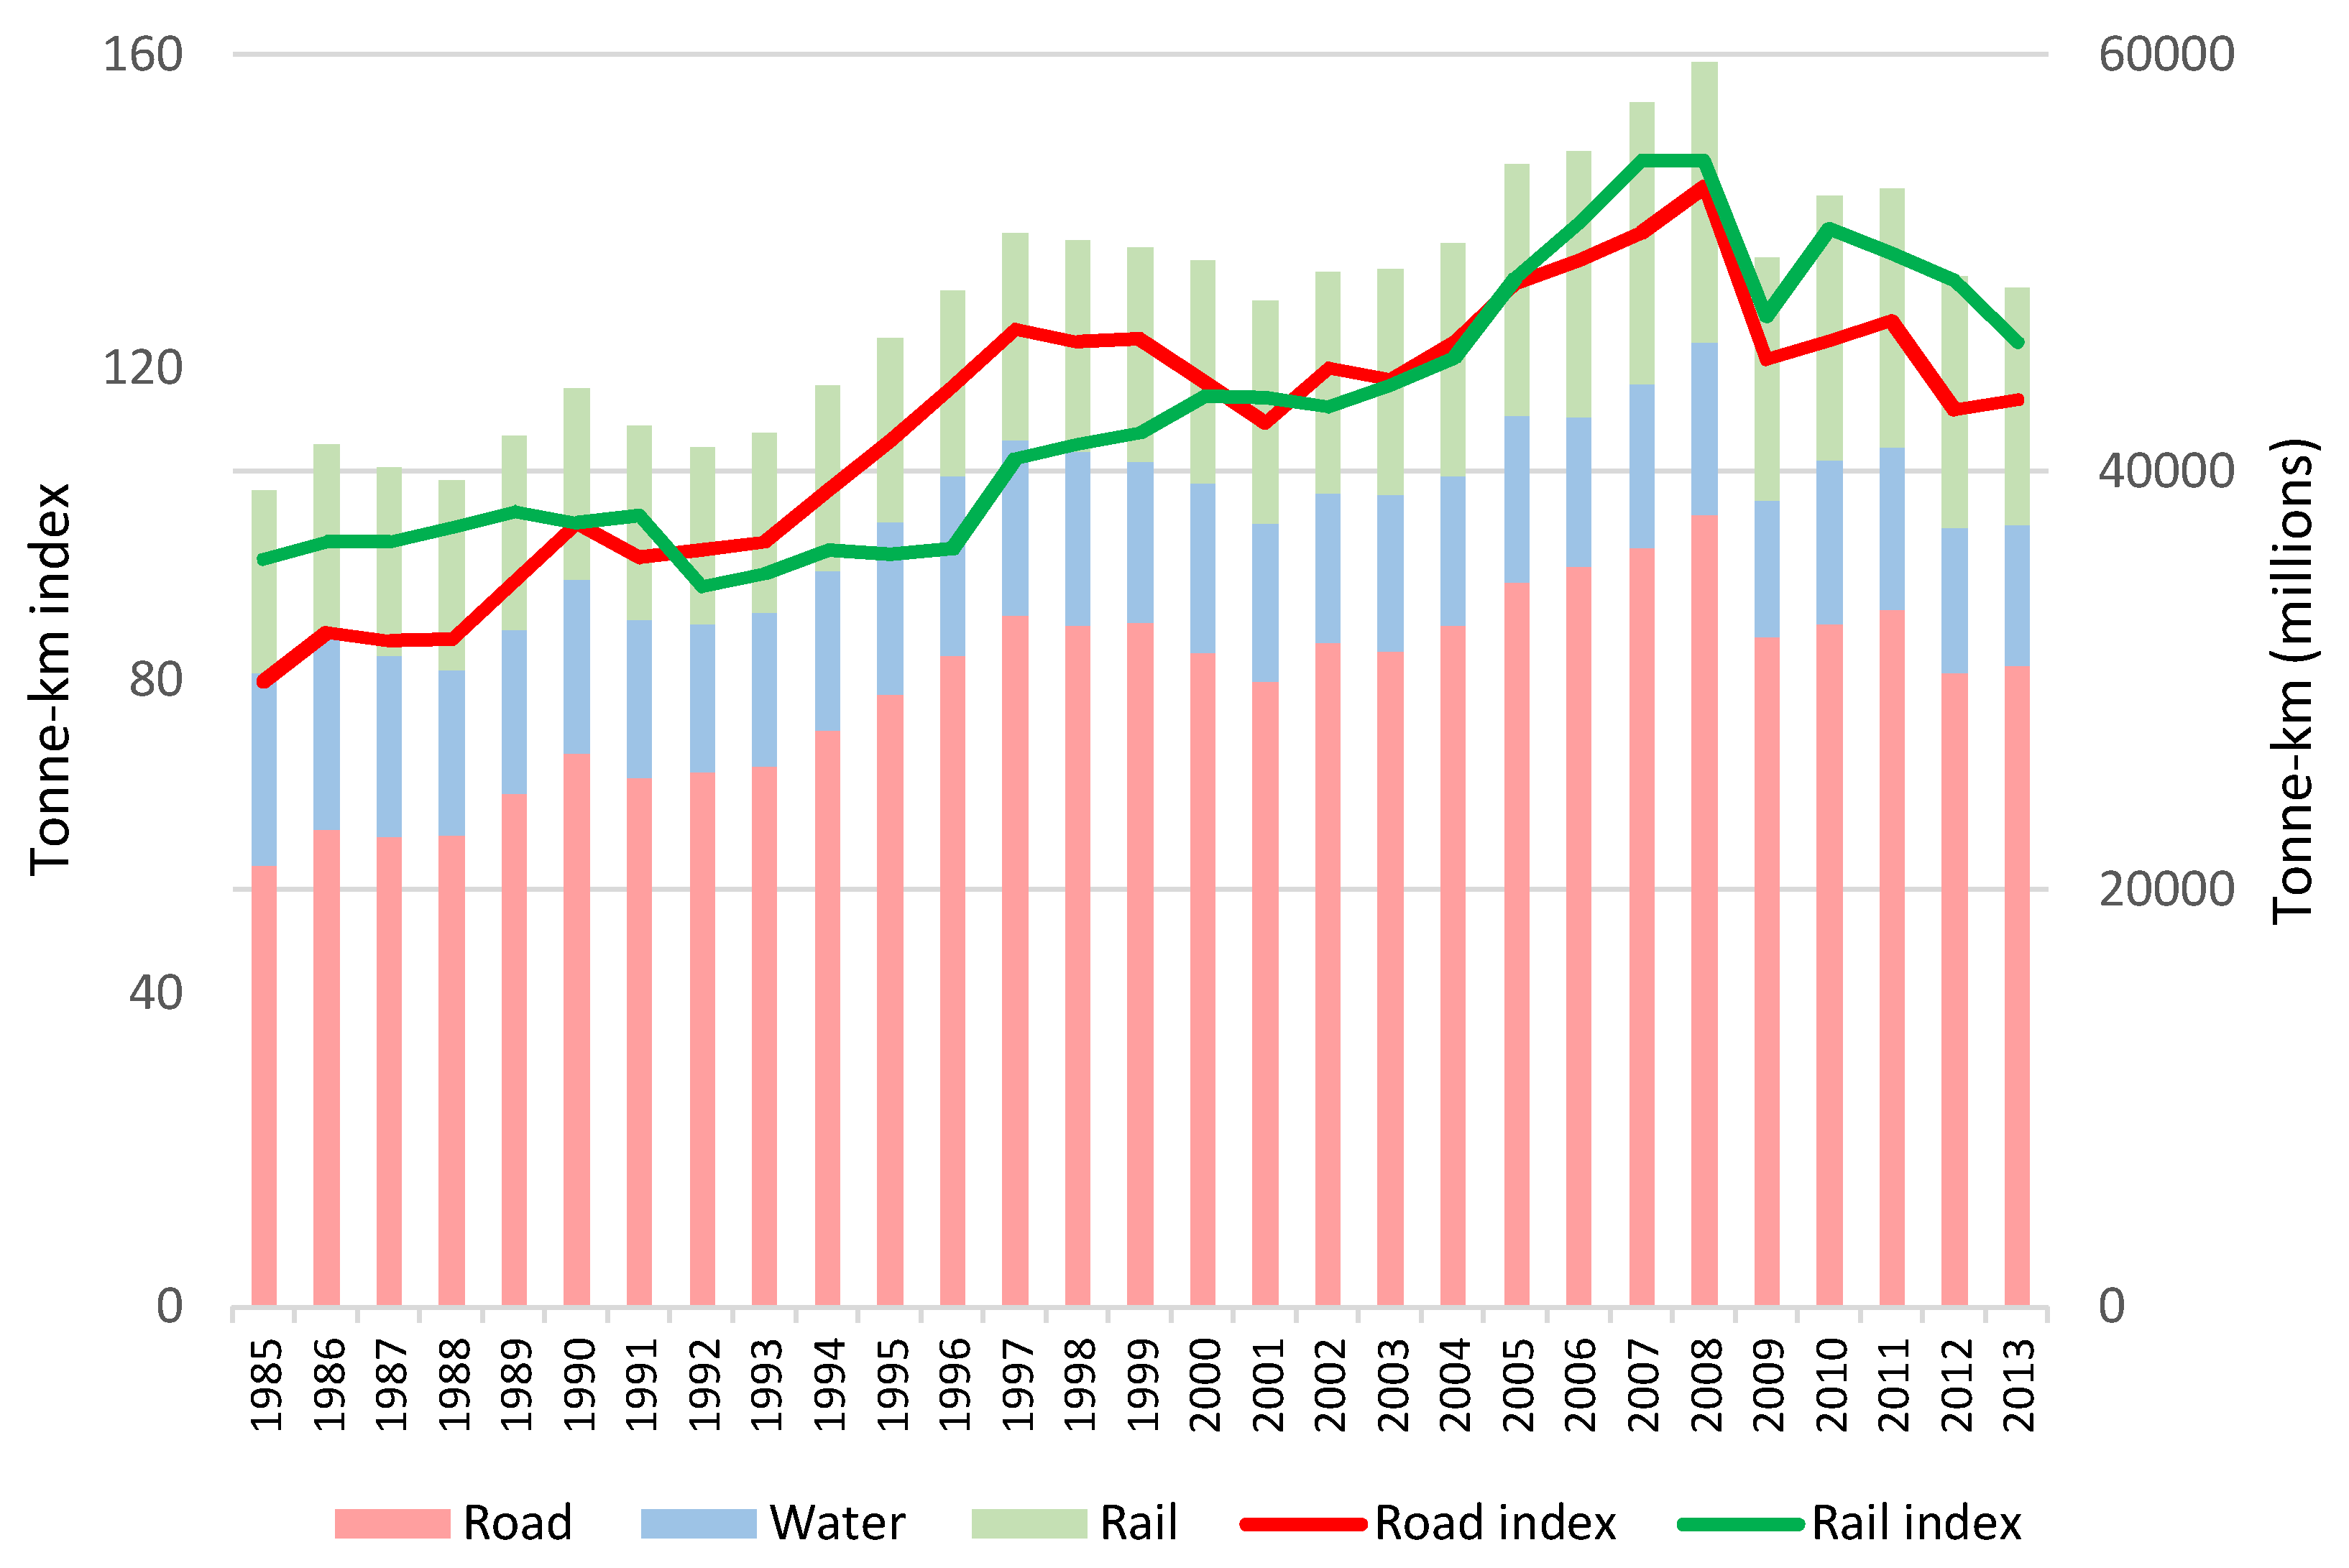
In Figure 2 we have stapled the share of each mode (road, rail, and water) of the total domestic transport performance for each year. We have also created an index of the share for road and rail, which shows the change in the share of each mode relative to the baseline year 1990. An index above 100 corresponds to a higher modal share for that particular year compared to the share in 1990. The figure shows how the rail share was decreasing from 1985 up until 1995 when the trend reversed. In 2000, the rail share was back to its pre-reform value and continued to rise in the 2000s. Waterborne transport was consistently losing market shares from 1985 and onwards. It went from having 24% of the market in 1985, to 19% in 1990, and then to 14% in 2013. Road freight developed in the opposite way. The road share increased steadily between 1985–1990 and continued this way during most of the 1990s, until it stabilized around 60–65%. What is noticeable is the lack of break in the modal split trends at the time of the increasing in maximum weights in 1990 and 1993. On the contrary, the share for each mode is continuing its long-term development.
Figure 3 shows the level of tonne-km for each mode. It also includes the tonne-km index for road and rail, which shows the percentage change in transport performance for each mode relative to the baseline year 1990. From this figure, it is apparent that the tonne-km was growing both for road and rail in the 1990s. The increase in the road share that was documented in the previous figure therefore seems to be driven by the fact that the tonne-km growth rate was higher for road than for rail. Overall, it is difficult to trace out substitution patterns based on the aggregate statistics. In addition, the weight reforms coincided with the 1990–1993 economic recession in Sweden [34], deregulation of the Swedish railway freight sector in 1996 [35], and the replacement of the distance-based road tax by a tax on diesel fuels in 1995, which may have influenced the development.
In Vierth et al. [30] we use the weight reforms to estimate short- and long-run demand elasticities of road and rail with respect to road freight cost. We also show that the modal split developed differently for various commodity groups, which may reflect that LHVs are more suitable for commodities with certain volume and weight characteristics.
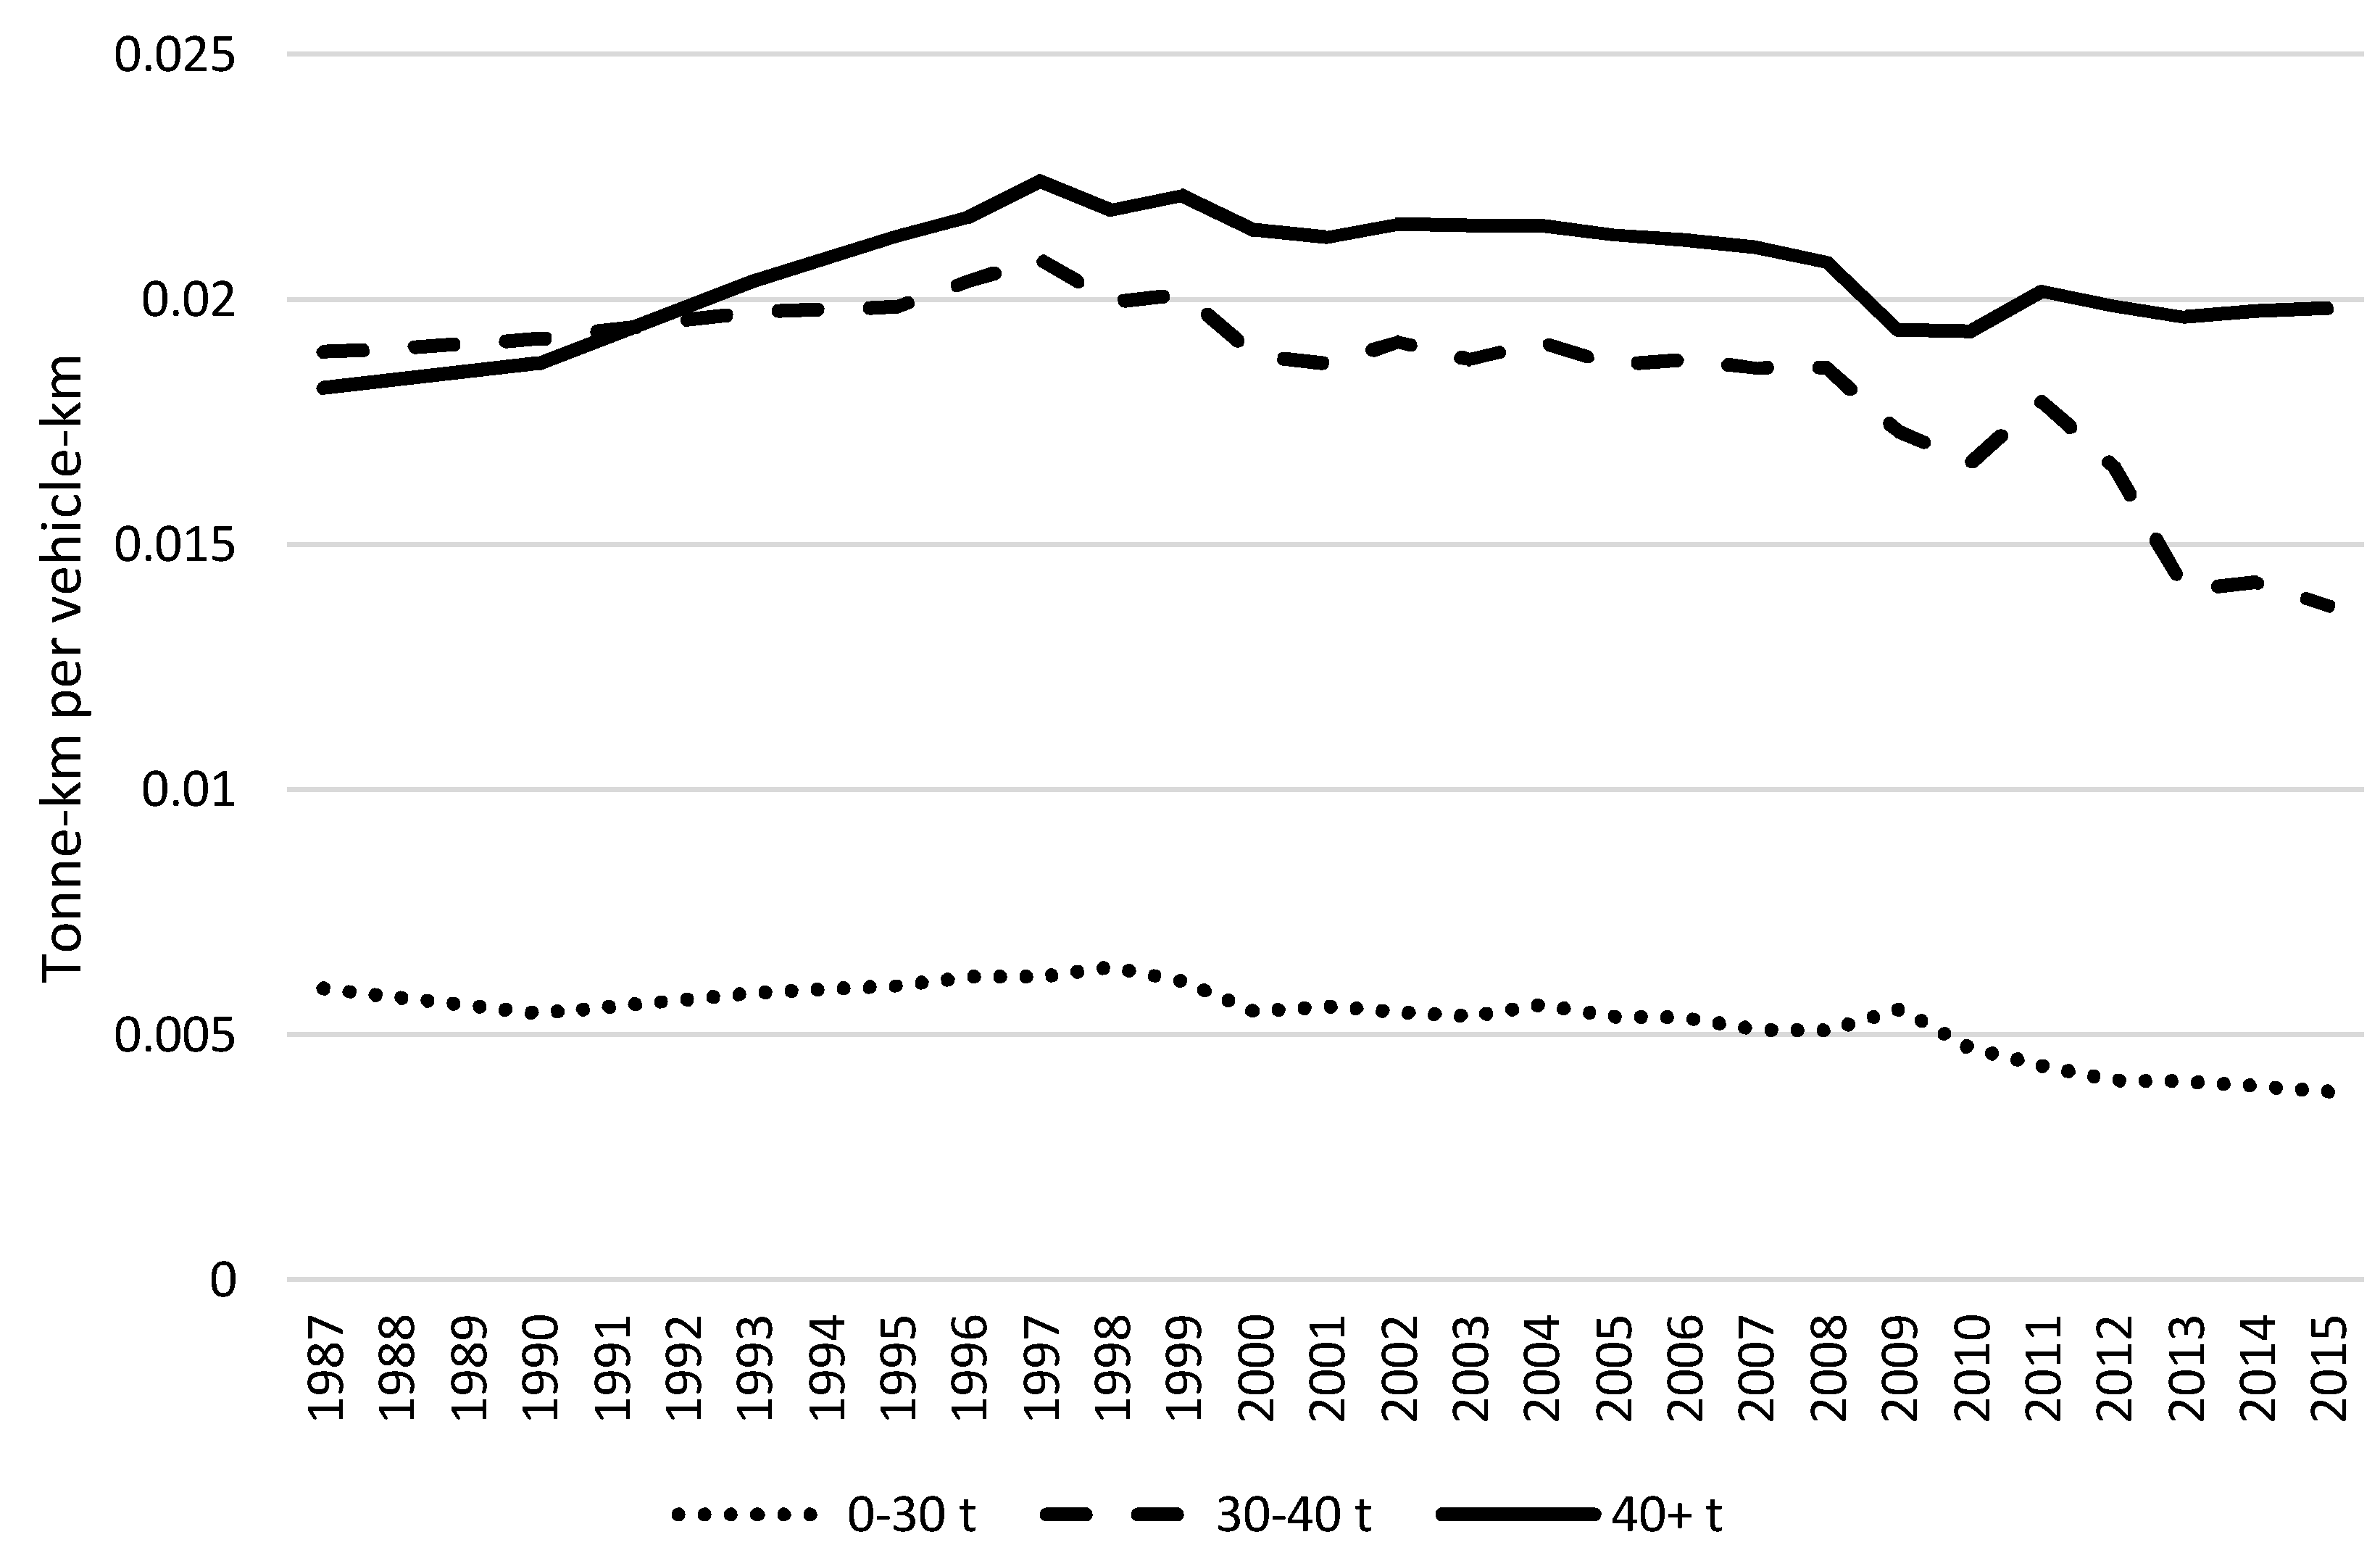
4.3. Road Freight Efficiency
Figure 4 shows the amount of tonne-km per vehicle kilometre for the three road vehicle categories based on maximum payload (0–30, 30–40, and 40+ tonnes). This gives a crude measure of the transportation efficiency of each class but highlights important dimensions of the development in the road freight sector. As expected, vehicles with higher load capacity have a higher transport performance per vehicle-km driven. What is noticeable is the increase in the ratio for vehicles in the larger capacity class between 1990 and 1997, compared to the development in the other classes. Their ratio of tonne-km to vehicle-km increase by 23% between 1990 and 1997 whereas the corresponding change was 4% and 10% for vehicles in the smallest and medium capacity classes respectively. This illustrates the differential change in road freight efficiency for the heaviest vehicles following the weight reforms.
4.4. Emissions
Our analysis relates the level of emission of each pollutant to the road freight transport performance between 1990–2013. Figure 5 shows the road freight emissions of GHG and its ratio to transport performance by road. Both the emissions and transport performance rose in the years following the weight reforms. The large drop in the emission factor (GHG per tonne-km) during this period shows that the surge in tonne-km surpassed that of emissions. However, from 1997 and onwards, the GHG per tonne-km has risen consistently.
Figure 6 and Figure 7 show the amount of emissions of PM, NOx, SO2, and NMVOC and their relationship to the transport performance by road. There is a clear downward trend in the emission factor (emissions per tonne-km) for all pollutants, in particular for SO2 and NMVOC. The drop in PM and NOx appears to wear off in the end of the 1990s. The development of the emissions of pollutants in the 1990s is also likely to affected by the Swedish and European environmental and energy policies during this period. This includes the introduction of an energy- and carbon dioxide tax on fuels [36], restrictions on the sulfur content of fuel [37], a NOx charge on energy producers [38], as well as the European Union emissions standards.
We conclude our analysis of the emissions by assigning a monetary value on the yearly emissions based on the Ricardo valuation and show the cost of emissions from each mode and by pollutant.
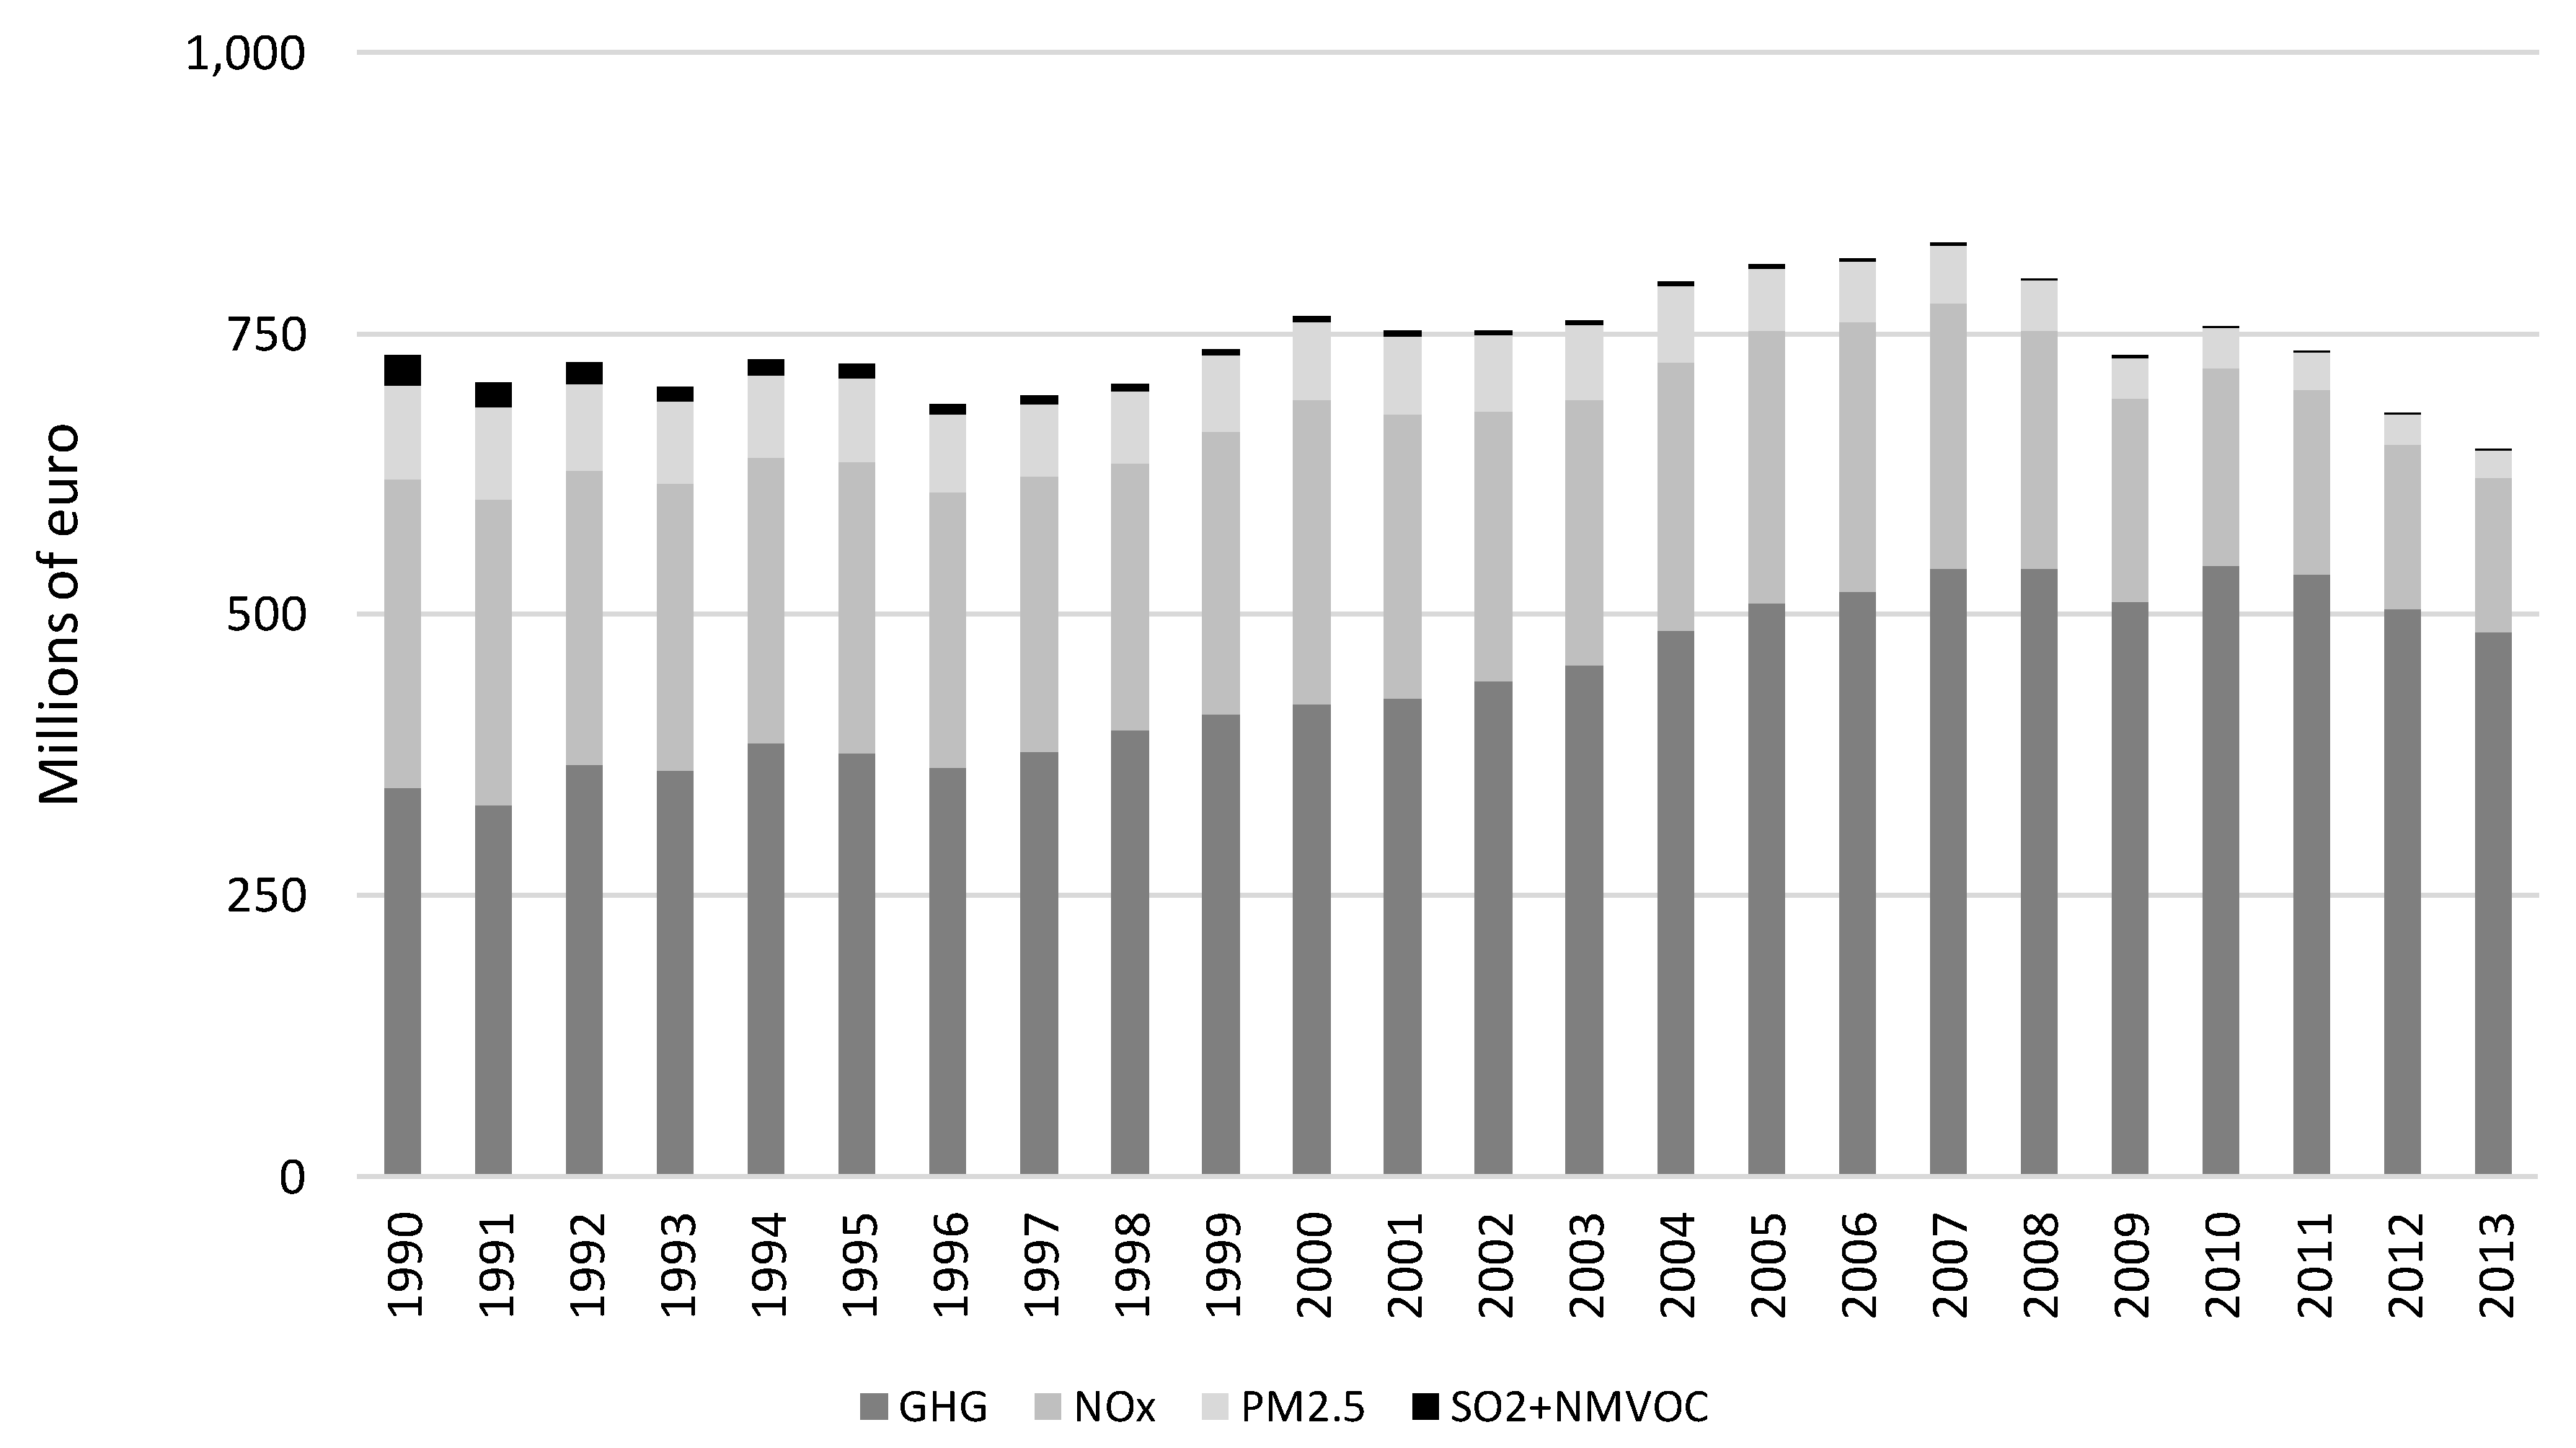
Figure 8 shows the development of the cost of GHG and air pollution between 1990–2013. Road transportation contributes by far the most to emission costs, followed by water transportation. The reduction in the cost of emissions from freight transportation in the early 1990s is likely to be driven by the drop in transport performance coinciding with the economic recession in Sweden during this time. The annual cost of road freight emissions is relatively constant in the 1990s and there is no noticeable change coinciding with the weight reforms. One explanation for this is two counteracting forces reviewed in the previous sections. As documented in Section 4.2, the road transport performance increased in the 1990s which would increase emissions, all else equal. On the other hand, road freight appears to have increased its efficiency judging by the results in Section 4.3. This means that fewer vehicle-km were needed for a given amount of tonne-km. The reductions in the emission factors also suggest that trucks became more fuel efficient and/or that fuel have become cleaner during this period. A zero-net effect of these forces could therefore explain the constant cost of road freight emissions in the 1990s. To further investigate this hypothesis, Figure 9 shows the value of the road freight emission of each pollutant. The composition of road freight emissions has changed significantly over time, with the cost of GHG rising consistently, both in levels and as a share of the total cost of emissions. This development is line with that in the rest of the EU [39].
5. Discussion
In this study, we have compiled domestic freight statistics and emissions data to investigate how the use of LHVs, modal split, road freight efficiency, GHG emissions, and air pollution have developed before, during, and after the increases in maximum permissible weight for vehicle combinations in Sweden. We have focused on the increase from 51.4 tonnes to 56 tonnes in 1990 and to 60 tonnes in 1993 and the period 1985–2013.
We find that the share of tonne-km by trucks with a load capacity above 40 tonnes increased substantially in the 1990s, which mainly came at the expense of the vehicles with the lowest capacity. This shows the high degree of incorporation of LHVs in the Swedish vehicle fleet and is similar to the full-scale introduction of LHVs in Australia during the same time period.
Our analysis of the modal split shows that the road share in Sweden increased steadily before, during, and after the weight reforms. Rail and water transportation on the other hand were decreasing between 1985 and 1995. We document increases in the levels of tonne-km by both road and rail during this period, which implies that the falling rail share was driven by relatively higher tonne-km growth for road. What is noticeable is the lack of break in the modal split trends at the time of the weight reforms. On the contrary, the share for each mode is continued on its long-term development. It is difficult to trace out substitution patterns between the modes. Whether the freight that was shifted away from waterborne transportation benefitted road or rail the most is not apparent. Neither is any shift of freight between road and rail transportation.
We document an increase in road freight efficiency after the weight reforms, meaning that fewer vehicle-km were needed for a given amount of tonne-km. This increase was particularly noticeable among vehicles of the highest maximum load capacity. This suggests that carriers managed to increase the use of LHVs while being able to utilize the extra load capacity.
Finally, we show that road transportation contributes by far the most to emission costs, followed by water transportation. The composition of emissions from road freight changed in the years following the weight reforms. While GHG emissions increased, emissions of PM, NOx, SO2, and NMVOC dropped significantly since the end of the 1990s. The consistent increase in road transport performance during this period lead to falling emission factors (emissions per tonne-km) for each pollutant. We synthesize these findings by showing that the external costs of road freight emissions remained constant in the 1990s. We hypothesize that the observed development is due to higher road freight efficiency off-setting the increase in road transport performance.
In conclusion, our results suggest that allowing higher weight dimensions on a large scale would increase the use of those vehicles fairly quickly but not lead to considerably adverse environmental impacts, at least not in terms of the outcomes considered in this study. These findings may be limited to the specific country and time period of study and future research should conduct ex-post analyses of the implementation of LHVs on various scales to assess whether these results hold in the current freight transportation market and in other countries.
Author Contributions
H.L. and S.L. collected the data, all authors analyzed and interpreted the data and wrote the paper.
Funding
This research was funded by Centre for Transport Studies, Sweden.
Acknowledgments
We would like to thank Thomas Asp, Swedish Road Administration, and Tom Andersson, Transport Analysis for useful comments on an earlier version of this study. We are also grateful to Mohammad-Yeza Yahya, IVL Swedish Environmental Research Institute and Tobias Lindé, VTI, for helpful assistance with the data.
Conflicts of Interest
The authors declare no conflict of interest.
References
- Ortega, A.; Vassallo, J.M.; Guzmán, A.F.; Pérez-Martínez, P.J.; Ortega, A.; Vassallo, J.M.; Guzmán, A.F.; Pérez-Martínez, P.J. Are longer and heavier vehicles (LHVs) beneficial for society? A cost benefit analysis to evaluate their potential implementation in Spain. Transp. Rev. 2014, 34, 150–168. [Google Scholar] [CrossRef]
- Sanchez-Rodrigues, V.; Piecyk, M.; Mason, R.; Boenders, T. The longer and heavier vehicle debate: A review of empirical evidence from Germany. Transp. Res. Part D 2015, 40, 114–131. [Google Scholar] [CrossRef]
- Steer, J.; Dionori, F.; Casullo, L.; Vollath, C.; Frisoni, R.; Carippo, F.; Ranghetti, D. Review of Megatrucks. Major Issues and Case Studies; European Commission Directorate General for Internal Policies: Brussels, Belgium, 2013. [Google Scholar]
- Ericsson, J.; Lindberg, G.; Mellin, A.; Vierth, I. Co-modality—The socio-economic effects of longer and/or heavier vehicles for land-based freight transport. In Proceedings of the 12th WCTR, Lisbon, Portugal, 11–15 July 2010. [Google Scholar]
- McKinnon, A. The economic and environmental benefits of increasing maximum truck weight: The British experience. Transp. Res. Part D 2005, 10, 77–95. [Google Scholar] [CrossRef]
- De Ceuster, G.; Breemersch, T.; Van Herbruggen, B.; Verweij, K.; Davydenko, I.; Klingender, M.; Jacob, B.; Arki, H.; Bereni, M. Effects of Adapting the Rules on Weight and Dimensions of Heavy Commercial Vehicles as Established within Directive 96/53/EC; European Commission Directorate General Energy and Transport: Brussels, Belgium, 2008. [Google Scholar]
- Vierth, I.; Berell, H.; McDaniel, J.; Haraldsson, M.; Hammarström, U.; Yahya, M.-R.; Lindberg, G.; Carlson, A.; Ögren, M.; Björketun, U. The Effects of Long and Heavy Trucks on the Transport System; VTI: Stockholm, Sweden, 2008. [Google Scholar]
- Leach, D.Z.; Savage, C.J. Impact Assessment: High Capacity Vehicles; University of Huddersfield: Huddersfield, UK, 2012. [Google Scholar]
- Gutberlet, T.; Kienzler, H.P.; Labinsky, A.; Eckert, S.; Faltenbacher, M. Longer Heavy Goods Vehicles in Germany—“Ecocombis” or “Climate Killers”? In Proceedings of the European Transport Conference, Barcelona, Spain, 4–6 October 2017. [Google Scholar]
- McKinnon, A. Improving the Sustainability of Road Freight Transport by Relaxing Truck Size and Weight Restrictions. In Supply Chain Innovation for Competing in Highly Dynamic Markets; Evangelista, P., McKinnon, A., Sweeney, E., Esposito, E., Eds.; IGI Global: Hershey, PA, USA, 2012. [Google Scholar]
- Doll, C.; Fiorello, D.; Pastori, E.; Reynaud, C.; Klaus, P.; Lückman, P.; Hesse, K.; Kochsiek, J. Long-Term Climate Impacts of the Introduction of Mega-Trucks; Study for the Community of European Railways and Infrastructure Companies; CER: Brussels, Belgium, 2008. [Google Scholar]
- Knight, I.; Newton, W.; McKinnon, A.; Palmer, A.; Barlow, T.; McCrae, I.; Dodd, M.; Couper, G.; Davies, H.; Daly, A.; et al. Longer and/or Longer and Heavier Goods Vehicles (LHVs)—A Study of the Likely Effects if Permitted in the UK: Final Report; DfT: London, UK, 2008. [Google Scholar]
- Salet, M.; Aarts, L.; Honer, M.; Davydenko, I.; Quak, H.; de Bes van Staalduinen, J.; Verweij, K. Longer and Heavier Vehicles in The Netherlands. Facts, Figures and Experiences in the Period 1995–2010; Rijkswaterstaat: The Hague, The Netherlands, 2010. [Google Scholar]
- OECD. Moving Freight with Better Trucks: Improving Safety, Productivity and Sustainability; ITF Research Reports; OECD Publishing: Paris, France, 2011. [Google Scholar]
- Bureau of Infrastructure, Transport and Regional Economics. Truck Productivity: Sources, Trends and Future Prospects; Report 123; Bureau of Infrastructure, Transport and Regional Economics: Canberra, Australia, 2011.
- Mitchell, D. Heavy Vehicle Productivity Trends and Road Freight Regulation in Australia. In Proceedings of the Australasian Transport Research Forum 2010 Proceedings, Canberra, Australia, 29 September–1 October 2010. [Google Scholar]
- State of Victoria. Victorian Freight Network Strategy; Victoria Dept. of Transport: Melbourne, Australia, 2008. [Google Scholar]
- Lapp, T.; Ikkanen, P. Transport System Impacts of HCT Vehicles; Research Reports of the Finnish Transport Agency 57/2017; Finnish Transport Agency: Helsinki, Finland, 2017. [Google Scholar]
- Kindt, M.; Burgess, A.; Quispel, M.; van der Meulen, S.; Bus, M. Monitoring Modal Shift. Longer and Heavier Vehicles. The Follow-Up Measurement; Rijkswaterstaat: The Hague, The Netherlands, 2011. [Google Scholar]
- Jonkeren, O.; Aarts, L. Dutch Experience of Modal Split. In Proceedings of the ITF Cambridge Workshop on Modal Shift, Cambridge, UK, 7 December 2016. [Google Scholar]
- Arcadis. Monitoringsonderzoek Vervolgproef LZV: Resultaten van de Vervolgproef Met Langere en Zwaardere Voertuigcombinaties op de Nederlandse Wegen; Rijkswaterstaat: The Hague, The Netherlands, 2006. [Google Scholar]
- Brevik-Wangsness, P.; Bjørnskau, P.; Hovi, I.B.; Madslien, A.; Hagman, A. Evaluation of Norwegian Trials with European Modular System (EMS) Vehicles; Report 1319/2014; Institute of Transport Economics: Oslo, Norway, 2014. [Google Scholar]
- Danish Road Directorate. Evaluation of Trial with European Modul System; Final Report; Danish Road Directorate: Copenhagen, Denmark, 2011. [Google Scholar]
- Limbeck, S.; Gail, J.; Schwedhelm, H.; Jungfeld, I. Configurable and Adaptable Trucks and Trailers for Optimal Transport Efficiency. Appendix A of Deliverable D5.5. Available online: http://modularsystem.odeum.com/download/bast_report.pdf (accessed on 23 May 2018).
- Nelldal, B.L. Järnvägssektorn efter Järnvägsreformen 1988—Förändringar i Omvärlden, Trafikpolitiken och Järnvägsbranschen och i Järnvägens Marknad 1990–2000; Royal Institute of Technology: Stockholm, Sweden, 2002. [Google Scholar]
- Pålsson, H.; Winslott, L.; Wandel, S.; Khan, J.; Adell, E. Longer and heavier road freight vehicles in Sweden: Effects on tonne- and vehicle-kilometres, CO2 and socio-economics. Int. J. Phys. Distrib. Logist. Manag. 2017, 47, 603–622. [Google Scholar] [CrossRef]
- Nelldal, B.L.; Troche, G.; Wajsman, J. Effekter av Lastbilasavgifter; Royal Institute of Technology: Stockholm, Sweden, 2009. [Google Scholar]
- Haraldsson, M.; Jonsson, L.; Karlsson, R.; Vierth, I.; Yahya, M.; Ögren, M. Cost Benefit Analysis of Round Wood Transports Using 90-Tonne Vehicles; Report 758/2014; VTI: Stockholm, Sweden, 2008. [Google Scholar]
- Vierth, I.; Karlsson, R. Effects of Longer Lorries and Freight Trains in an International Corridor between Sweden and Germany. Transp. Res. Procedia 2014, 1, 188–196. [Google Scholar] [CrossRef]
- Korzhenevych, A.; Dehnen, N.; Bröcker, J.; Holtkamp, M.; Meier, H.; Gibson, G.; Varma, A.; Cox, V. Update of the Handbook on External Costs of Transport; Final Report; MOVE/D3/2011/571; Ricardo-AEA: London, UK, 2011. [Google Scholar]
- Windmark, F.; Jakobsson, M.; Segersson, D. Modellering av Sjöfartens Bränslestatistik Med Shipair; Report 2017-10; Swedish Meteorological and Hydrological Institute: Norrköping, Sweden, 2017. [Google Scholar]
- Vierth, I.; Lindgren, S.; Lindgren, H. Impact of Higher Road Vehicle Dimensions on Modal Split: An Ex-Post Analysis for Sweden; Report 34A-2017; VTI: Stockholm, Sweden, 2018. [Google Scholar]
- Nelldal, B.L. Competition and co-operation between railways and trucking in long distance freight transport—An economic analysis. In Proceedings of the 3rd KFB-Research Conference “Transport Systems—Organisation and Planning”, Stockholm, Sweden, 13–14 June 2000. [Google Scholar]
- Englund, P. The Swedish Banking Crisis. Roots and Consequences. Oxf. Rev. Econ. Policy 1999, 15, 80–97. [Google Scholar] [CrossRef]
- Nilsson, J.E. Restructuring Sweden’s railways: The unintentional deregulation. Swed. Econ. Policy Rev. 2002, 9, 229–254. [Google Scholar]
- Swedish Code of Statutes. General Energy Tax Act, 1994: 1776. Available online: https://www.riksdagen.se/sv/dokument-lagar/dokument/svensk-forfattningssamling/lag-19941776-om-skatt-pa-energi_sfs-1994-1776 (accessed on 23 May 2018).
- Swedish Code of Statutes. Sulfur Tax Act, 1990: 587. Available online: http://riksdagen.se/sv/dokument-lagar/dokument/svensk-forfattningssamling/lag-1990587-om-svavelskatt_sfs-1990-587 (accessed on 23 May 2018).
- Swedish Code of Statutes. Act on an Environmental Charge on Emissions of Nitrogen Oxides in Energy Production, 1990: 613. Available online: https://www.riksdagen.se/sv/dokument-lagar/dokument/svensk-forfattningssamling/lag-1990613-om-miljoavgift-pa-utslapp-av_sfs-1990-613 (accessed on 23 May 2018).
- European Commission. Strategy for Reducing Heavy-Duty Vehicles’ Fuel Consumption and CO2 Emissions; COM 2014:285 Final; European Commission: Brussels, Belgium, 2014. [Google Scholar]
Figure 1.
Domestic road transport performance by maximum load capacity.

Figure 2.
Domestic modal shares (in tonne-km) and share index (1990 = 100).

Figure 3.
Domestic transport performance and tonne-km index (1990 = 100).

Figure 4.
Domestic road freight efficiency (tonne-km per vehicle-km) by max load capacity.

Figure 5.
GHG emissions in levels and per domestic road tonne-km.

Figure 6.
(a) PM2.5 emissions in tonnes (right axis) and per domestic tonne-km by road (left axis); (b) NOx emissions in levels (right axis) and per domestic tonne-km by road (left axis).
Figure 6.
(a) PM2.5 emissions in tonnes (right axis) and per domestic tonne-km by road (left axis); (b) NOx emissions in levels (right axis) and per domestic tonne-km by road (left axis).

Figure 7.
(a) SO2 emissions in 100s tonnes (right axis) and per domestic tonne-km by road (left axis); (b) NMVOC emissions in levels and per tonne-km by road.
Figure 7.
(a) SO2 emissions in 100s tonnes (right axis) and per domestic tonne-km by road (left axis); (b) NMVOC emissions in levels and per tonne-km by road.
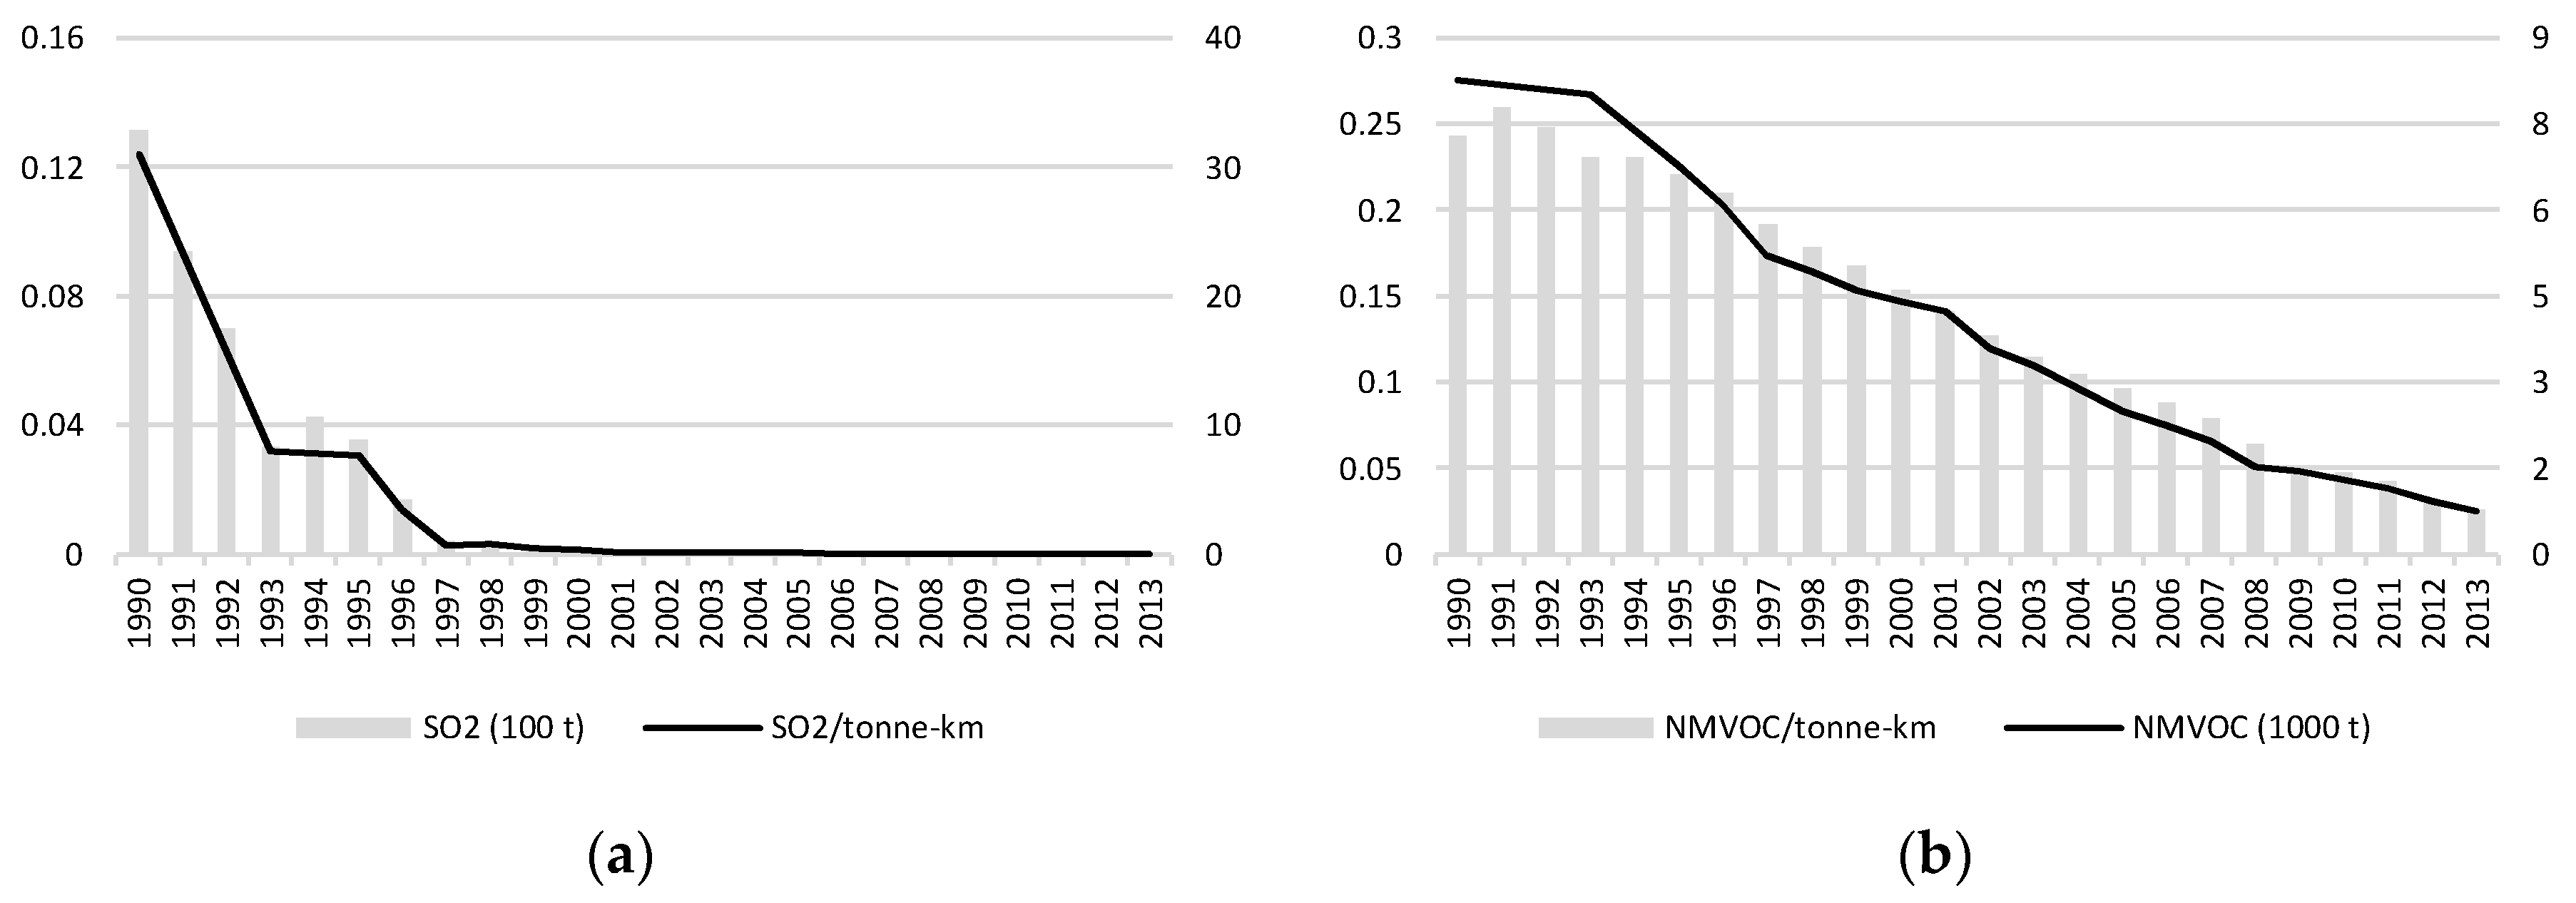
Figure 8.
Valuation of all emissions from freight transportation by mode (2010 price level).

Figure 9.
Valuation of emissions from road freight by source (2010 price level).

Table 1.
Timeline of maximum vehicle dimensions in Sweden.
| Year | Max. Length (m) | Max. Weight (t) |
|---|---|---|
| 1968 | 24 | 37 |
| 1974 | 24 | 51.4 |
| 1990 | 24 | 56 |
| 1993 | 24 | 60 |
| 1996 | 25.25 | 60 |
| 2015 | 25.25 | 64 |
| 2018 1 | 25.25 | 74 |
1 To be implemented.
Table 2.
Euro per tonne and pollutant.
| Mode | NOx | NMVOC | SO2 | PM2.5 | GHG |
|---|---|---|---|---|---|
| Rail | 5247 | 974 | 5389 | 29,208 | 90 |
| Water | 4700 | 1100 | 5250 | 13,800 | 90 |
| Road | 5247 | 974 | 5389 | 42,009 | 90 |
Source: Korzhenevych et al. [30] and own calculations.
Table 3.
Summary statistics.
| Variable | Unit | Mean | Min | Max | Coverage |
|---|---|---|---|---|---|
| Transportation activity | |||||
| Rail freight | Million tonne-km | 10,515 | 8463 | 13,450 | 1985–2013 |
| Water freight | Million tonne-km | 7755 | 6504 | 9447 | 1985–2013 |
| Road freight | Million tonne-km | 32,167 | 22,611 | 38,807 | 1985–2013 |
| Road freight (0–30 t) | Million tonne-km | 5365 | 2805 | 8506 | 1987–2013 |
| Road freight (30–40 t) | Million tonne-km | 12,695 | 5904 | 16,771 | 1987–2013 |
| Road freight (40+ t) | Million tonne-km | 14,106 | 1347 | 28,164 | 1987–2013 |
| Road efficiency (0–30 t) | Tonne-km per vehicle-km | 0.12 | 0.10 | 0.16 | 1985–2013 |
| Road efficiency (30–40 t) | Tonne-km per vehicle-km | 0.14 | 0.12 | 0.16 | 1985–2013 |
| Road efficiency (40 t) | Tonne-km per vehicle-km | 0.17 | 0.13 | 0.20 | 1985–2013 |
| Emissions | |||||
| GHG by road | Kilo-tonne | 4337 | 3379 | 5196 | 1990–2013 |
| GHG by rail | Kilo-tonne | 50 | 37 | 71 | 1990–2013 |
| GHG by water | Kilo-tonne | 541 | 296 | 812 | 1990–2013 |
| PM2.5 by road | Tonne | 1264 | 487 | 1840 | 1990–2013 |
| PM2.5 by rail | Tonne | 22 | 16 | 30 | 1990–2013 |
| PM2.5 by water | Tonne | 494 | 194 | 854 | 1990–2013 |
| NOx by road | Tonne | 38,972 | 21,825 | 48,445 | 1990–2013 |
| NOx by rail | Tonne | 888 | 467 | 1326 | 1990–2013 |
| NOx by water | Tonne | 7849 | 4557 | 11,443 | 1990–2013 |
| SO2 by road | Tonne | 465 | 12 | 3294 | 1990–2013 |
| SO2 by rail | Tonne | 10 | 0 | 81 | 1990–2013 |
| SO2 by water | Tonne | 3666 | 1173 | 7013 | 1990–2013 |
| NMVOC by road | Tonne | 4194 | 783 | 7800 | 1990–2013 |
| NMVOC by rail | Tonne | 74 | 39 | 107 | 1990–2013 |
| NMVOC by water | Tonne | 142 | 76 | 212 | 1990–2013 |
| Cost of road emissions | Million euros | 741.5 | 647.5 | 831.9 | 1990–2013 |
| Cost of rail emissions | Million euros | 9.9 | 6.3 | 14.8 | 1990–2013 |
| Cost of water emissions | Million euros | 111.8 | 60.2 | 168.4 | 1990–2013 |
© 2018 by the authors. Licensee MDPI, Basel, Switzerland. This article is an open access article distributed under the terms and conditions of the Creative Commons Attribution (CC BY) license (http://creativecommons.org/licenses/by/4.0/).
Share and Cite
MDPI and ACS Style
Vierth, I.; Lindgren, S.; Lindgren, H. Vehicle Weight, Modal Split, and Emissions—An Ex-Post Analysis for Sweden. Sustainability 2018, 10, 1731. https://doi.org/10.3390/su10061731
AMA Style
Vierth I, Lindgren S, Lindgren H. Vehicle Weight, Modal Split, and Emissions—An Ex-Post Analysis for Sweden. Sustainability. 2018; 10(6):1731. https://doi.org/10.3390/su10061731
Chicago/Turabian StyleVierth, Inge, Samuel Lindgren, and Hanna Lindgren. 2018. "Vehicle Weight, Modal Split, and Emissions—An Ex-Post Analysis for Sweden" Sustainability 10, no. 6: 1731. https://doi.org/10.3390/su10061731
Note that from the first issue of 2016, this journal uses article numbers instead of page numbers. See further details here.