Article

Assessing the Sustainability Performance of Organic and Low-Input Conventional Farms from Eastern Poland with the RISE Indicator System

1
Department of Systems and Economics of Crop Production, Institute of Soil Science and Plant Cultivation, State Research Institute, Czartoryskich 8, 24-100 Puławy, Poland
2
School of Agricultural, Forest and Food Sciences in Zollikofen, Bern University of Applied Sciences, Länggasse 85, CH-3052 Zollikofen, Switzerland
*
Author to whom correspondence should be addressed.
Sustainability 2018, 10(6), 1792; https://doi.org/10.3390/su10061792
Submission received: 3 April 2018 / Revised: 27 April 2018 / Accepted: 28 May 2018 / Published: 29 May 2018

Abstract

:
The aim of this study was to examine the sustainability performance of organic and low-input conventional farms with the sustainability assessment tool—RISE 3.0. It is an indicator-based method for holistic assessment of sustainability of agricultural production at farm level. Ten organic and 10 conventional farms from eastern Poland, Lublin province were assessed. According to the thresholds levels of the RISE method, organic farms performed positively for 7 out of 10 themes, while the values of the other 3 topics, biodiversity, working conditions, and economic viability, were at medium level. Conventional farms reached positive scores for 9 out of 10 themes. The only middle-performing theme was biodiversity. None of the two farm types had the lowest, problematic scores for examined themes. For the theme biodiversity and two indicators (greenhouse gas balance and intensity of agricultural production), significant differences between farming systems were found. Biodiversity performance, an important indicator of sustainability, estimated with the RISE system, was highly correlated with measured on-field weed flora and Orthoptera biodiversity of farms. High soil acidity and low crop productivity, improper weed regulation, and energy management were the most common problems in both types of farms. Working hours and wage and income levels were also assessed as being low. Recommendations to improve the sustainability of both organic and conventional farms are presented.

1. Introduction

A strong process of specialisation and concentration of agricultural production has been observed in Poland since it joined the EU. Average farm size in Poland increased from 6.3 ha in 1990 to 9.2 ha in 2012. At the same time, production intensity increased, while the number of people working in agriculture decreased by around 63,000 persons annually [1]. This process of transformation strengthens the differences of intensity of production between regions [2]. There are large, still growing intensive farms in western Poland, while in the eastern part of the country, including Lublin province, small-structured family farms are dominating. At the same time, the eastern part of Poland is an area of high biodiversity, with numerous species that are endangered with extinction in other European countries [3]. Fifteen percent of the area of the Lublin province is covered with Natura 2000 nature protection sites, which include Special Protection Areas (SPAs) (13%) [4] and Special Areas of Conservation (SACs) (4%) [5,6]. Greater richness of wild plant and animal species is associated with an extensive and traditional way of farming which is still common, especially in small family farms [7]. The challenge for agricultural policy in the region under consideration is how biodiversity and natural resources can be protected without compromising their sustainability and viability. This raises the question of how the farms of prevalent agricultural farming systems perform with respect to sustainability, both in general and with regard to biodiversity in particular.
In Poland there are over 1.4 mln of individual farms. Over 180,000 of them are located in the province of Lublin. 50% of all farms of the province have less than 5 ha of agricultural area. Most of those are traditional, conventional low-input farms. In crop production they are usually using limited amounts of mineral fertilizers and synthetic plant protection products [8]. Those low-input farms are of great importance to society, as they most often produce agricultural goods mainly for self-subsistence or for the local market. They are also of great importance to the environment and biodiversity conservation, as they create low environmental risk of production and provide a vast number of ecosystem services [7,8]. Since such farms are more environmentally friendly, it can be expected that they will contribute to the biodiversity conservation [9,10,11]. On the other hand, Dicks et al. [12] have found no evidence for the effects of supporting or maintaining low intensity agricultural systems on farmland wildlife in northern and western Europe.
Beside conventional farms, in Lublin province there are also organic farms (8% of total farms, twice as much as an average for Poland) [13] producing crops without mineral fertilizers and synthetic plant protection products [14]. Many studies showed a positive effect of organic production on biodiversity [15,16]. Moreover, some authors state that organic agriculture would be the one nearest to the idea of sustainability [17]. According to a literature study by Rigby and Cáceres (2001) [18], the relationship between organic agriculture and sustainability is complex. Some authors find organic agriculture as a model of sustainable agriculture system, while others see organic and sustainable agriculture as two separate systems [18].
Our hypothesis was that low-input traditional farms perform similarly to organic farms concerning sustainability. The objective of the study was to analyse whether there are differences in sustainability performance between organic farms and traditional, conventional, low-input-farms in eastern Poland (Lublin province) as a case study. Therefore, strengths and weaknesses in the performance of these two groups were analysed using the RISE 3.0 method.

2. Materials and Methods

2.1. The RISE Method
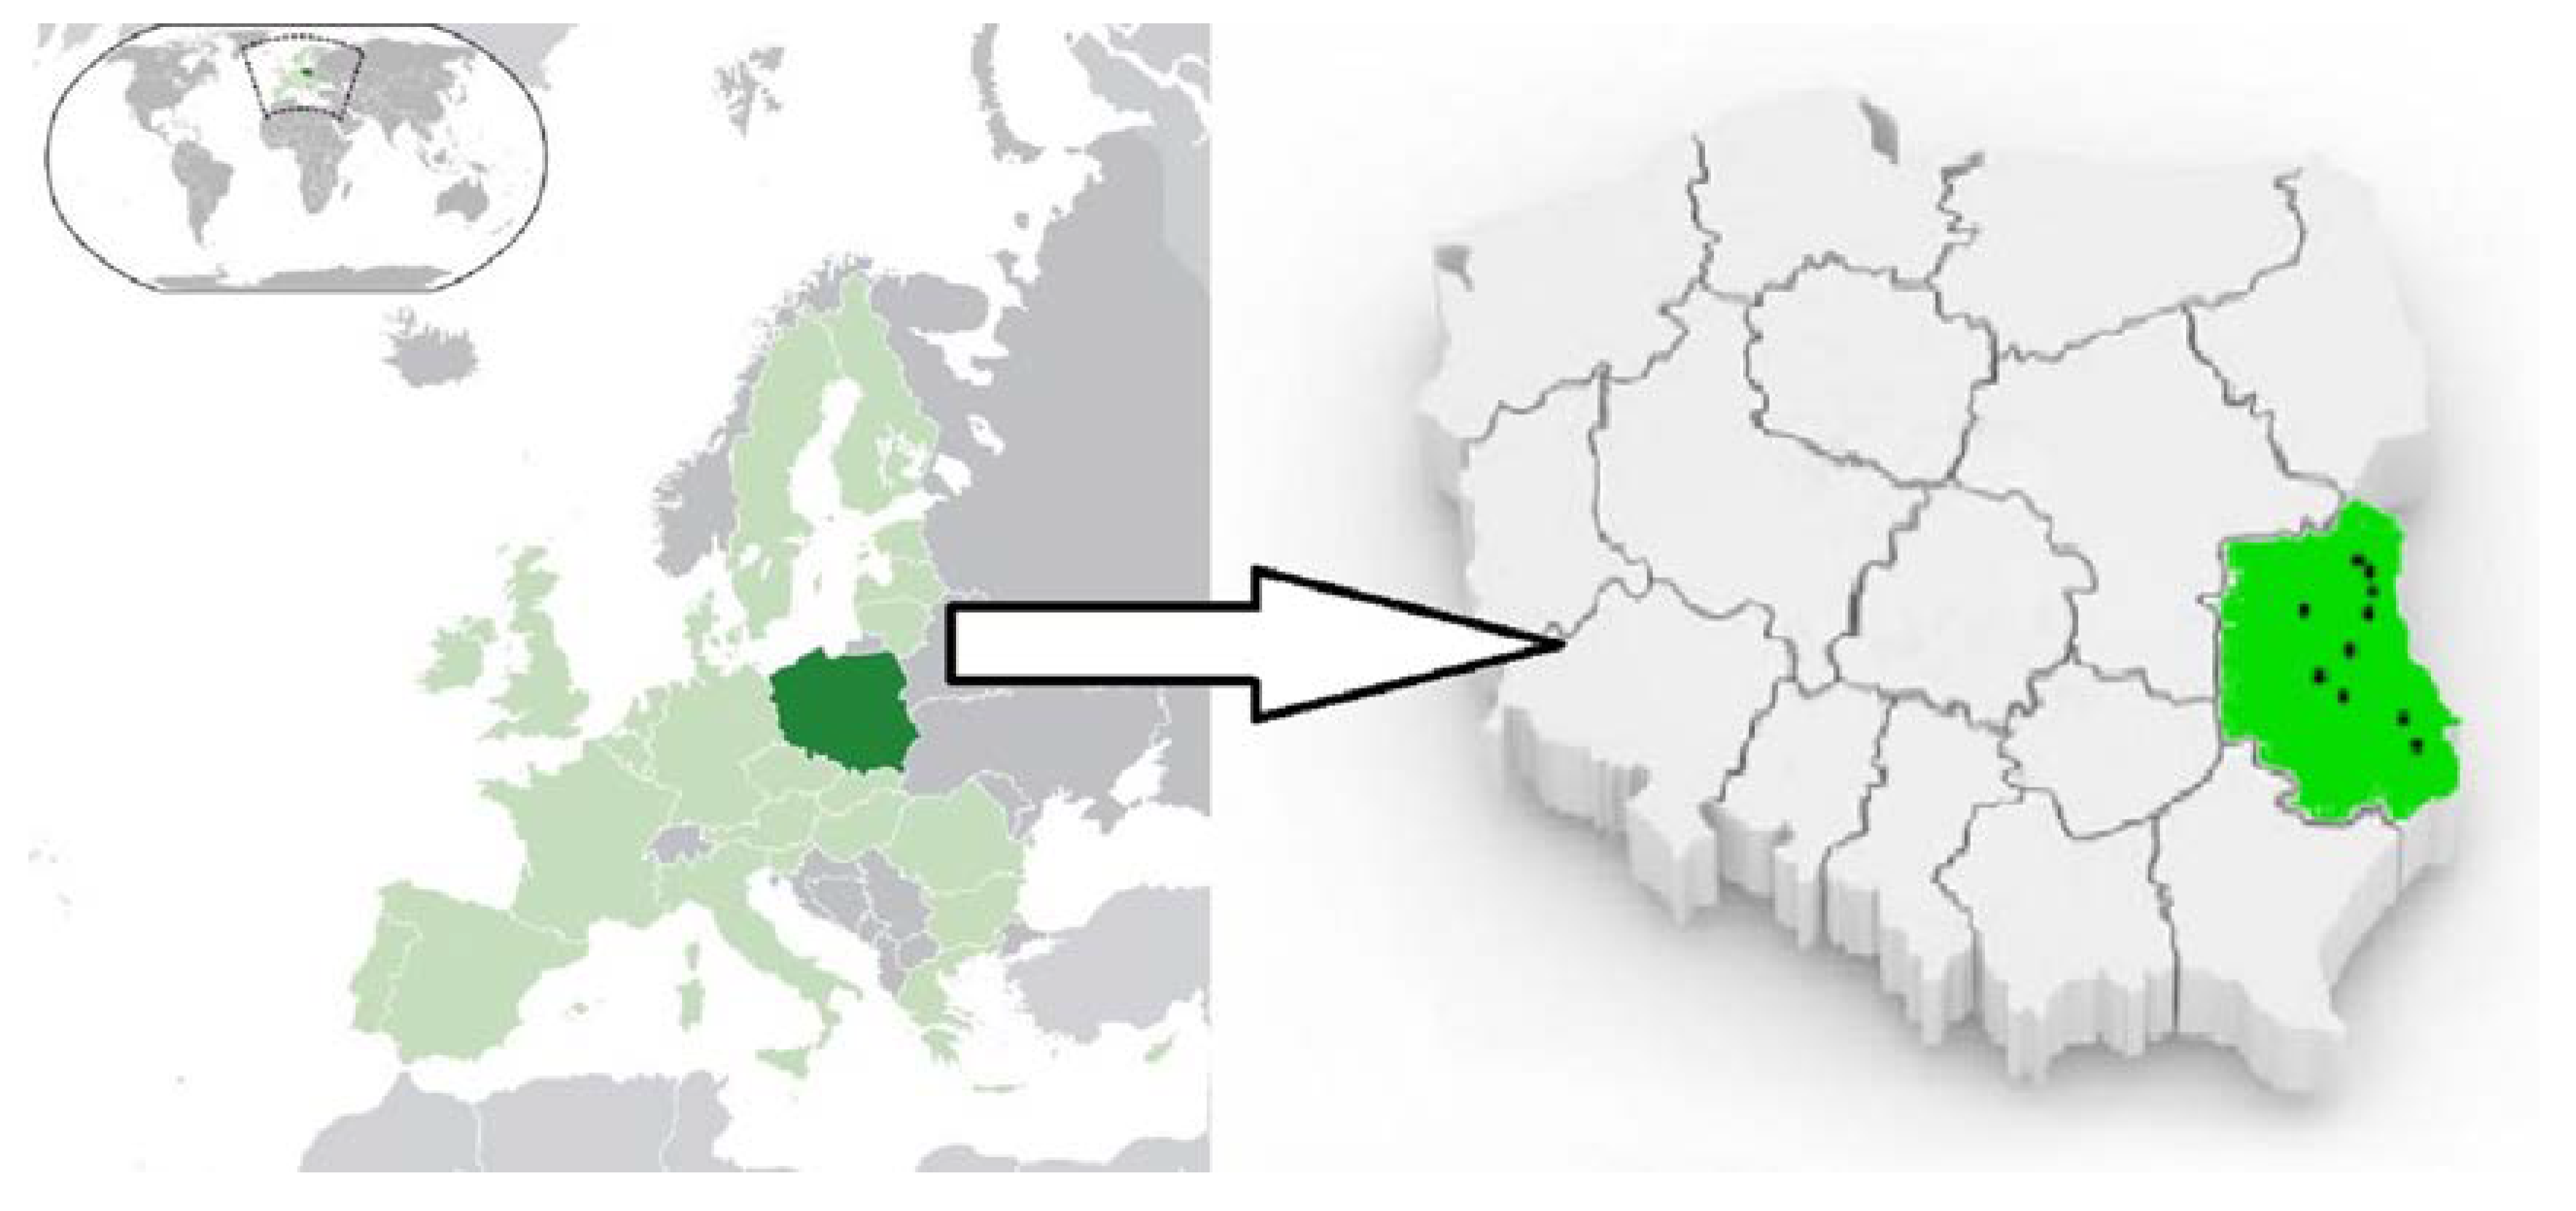
The RISE 3.0 (the Response-Inducing Sustainability Evaluation) is an indicator-based method for holistic assessment of sustainability of agricultural production at farm level. It seeks to create a tangible yet science-based evaluation, enabling the initiation of measures to improve sustainability [19,20]. It has been developed at the Bern University of Applied Sciences, School of Agricultural, Forest, and Food Sciences (HAFL) in Switzerland and applied in many countries [20]. Experiences with previous versions of RISE 1.0 and 2.0 have been presented in the literature [19,20,21,22,23]. There was an iterative development process of the RISE method considering user feedbacks, expert consultations (extension workers, scientists, tool developers, and farmers), and cross-comparisons against other sources. Adaptations to the thematic scope of the indicators were made compared to previous RISE versions. Version 3.0 of RISE has a partially generic character, reflected by a flexible indicator set, to better reflect the diversity of production conditions in the agricultural sector and the different requirements of its users. In this study, the indicator set was fixed at regional level for all farm analyses for better comparability. RISE analysis starts with the collection of information on the ecological, economic, and social aspects on a visited farm through a questionnaire-based interview with farmer. A computer program uses these data to calculate 47 sustainability indicators, condensed into 10 themes (Table 1).
To compute the sustainability performance of a farm, four types of data are used: quantitative farm data (e.g., crop areas, yields, amount of fertilizers, number of working hours, and debts), qualitative farm data (implementation of water-saving measures, level of satisfaction, and impact of farm strategy on social aspects), regional reference data (e.g., moisture index, humidity zone) and global reference data (e.g., toxicity of plant protection products, energy density of energy carriers, and water consumption of different livestock categories). The farm raw data are entered to a computer program (www.farmrise.ch) during the interview. Calculation functions compare these data with threshold values and normalize them onto a scale that ranges from 0 to 100 points. A performance between 0 and 33 points is considered to be problematic, between 34 and 66 points to be medium, and between 67 and 100 points to be good. For example, realized yields are compared to threshold values that represent high (100 points), medium (67 points), low (33 points), and very low yield level for this specific crop and region (0 points).
High scores stand for farms that create and maintain an environmental, economic, and social buffering capacity and that maintain or increase the productivity of its natural, financial, and human capital. Depending on the indicator, positive scores reflect, for example, good agricultural practice (e.g., no preventive antibiotic treatments, integrated pest management, recycling of wastes, erosion and soil compaction prevention, active management of natural, and financial and human resources), low emission risk (e.g., no run-off from manure storage, drift-reducing nozzles for plant protection product application, and low greenhouse gas and ammonia emissions), low intensity of agricultural production (e.g., low nutrient loads, low stocking density, and low energy use), high performance (e.g., high crop yields, good cash flow), and fair and responsible behaviour (e.g., no (gender) discrimination, awareness of side effects).
The theme scores, termed as “degrees of sustainability”, are the arithmetic means of four to six equally-weighted indicators. While not all indicators should be expected to be equally important in all situations, differential weighting comes at the price of reduced communicability of results and reduced transparency to farmers. Therefore, prioritization is left to the farmer and consultant in the RISE process, rather than being integrated into the model’s algorithms. Composition and valuation schemes of RISE themes are given in Table 2 in a biodiversity theme example.
Scores of themes and indicators are visualized in a sustainability polygon (Figure 1), along with detailed result tables employing the above-described colour code. An optimal result would be one where all theme scores have positive values rather than a maximisation of score representing single aspects of sustainability [20]. Results were presented to and discussed with farmers.

2.2. Study Design

The study was conducted in organic and conventional farms located in eastern part of Poland (Lublin province) (Figure 2). Ten pairs of organic and conventional farms located in similar soil and weather conditions were randomly selected. The main selection criterion was the coverage percentage of organic agriculture (certified) in the study area. 10 pairs of study squares (organic + conventional, 10 ha of surface each) near NATURA 2000 protection sites were selected. “Organic” squares were selected, which had to have at least 80% of their surface covered by organic agriculture. Conventional squares were chosen to have no more than 20% of area under organic agriculture. Pairs were located at a small distance from each other, in similar soil conditions. From few to over a dozen agricultural plots were located within each square. A random plot of appropriate farming system from these squares was selected to carry out biodiversity sampling research and to do the RISE analysis of farm holding that plot. Farms holders that volunteered to participate in the RISE analysis were included in presented study. Organic farms were certified according to organic agriculture rules [14]. The selection criteria were chosen so that impact of forests and woodlands on biodiversity research results could be minimized (at least 500 m apart from forests and shelterbelts). It is assumed that slightly larger farm areas than the regional average may be the consequence of the selection criteria (Table 1).

2.3. RISE Assessments

The regional data and regional reference values for Polish agriculture were entered to the RISE program. These data were collected from different sources, including Central Statistical Office databases [8,24,25] and expert consultation. Regional reference values are based on Polish standards (e.g., weather, income levels, and working hours) and the performance of Polish agriculture sector (not specifically organic agriculture). The process of preparation contained also training of interviewers from Institute of Soil Science and Plant Cultivation—State Research Institute (IUNG-PIB) in Puławy by the RISE developers from HAFL, farms selection, and getting acceptance of farmers to perform research.
Before the RISE assessment started, each farmer was asked to provide farm data (i.e., farm accounts, crop rotation plan, and fertilization plan). These data were entered into RISE database prior to the interview in order to reduce on-farm assessment time. Each farm assessment started with a short farm tour, to get the knowledge about, for example, what the living conditions of livestock are, what the surroundings of a farm are, etc. After the tour, the questionnaire-based interview with the farmer was carried out. All assessments were carried out by the same interviewer (first author). When all data were gathered, the outcomes were calculated in RISE program, and a report was prepared. The results were discussed with the farmer during a second farm visit. Based on the outcomes of the tool and priorities of the farmer, a brief action plan for improvement was made.
The assessments of farms were done in October and November 2016 and covered agricultural and financial data from the most recent completed calendar year, 2015.

2.4. Biodiversity Analyses

Biodiversity monitoring of two groups of indicator organisms, weed flora and Orthoptera, were done in conventional and organic farms in the years 2012–2014. Weed flora was assessed using frame method (0.5 m2) in five replications on selected fields with spring cereals. The analyses were done each year between 10 June and 10 July. Moreover, weed soil seed bank in 0–20 cm layer was assessed using germination methods for 12 months [26].
Orthoptera insects were captured with a sweep net and pit-fall traps on the same fields as flora monitoring. Three pit-fall traps were set on each field, at a distance of 10 m between them. Pit-fall traps were set four times during vegetation season: in April, May, June, and July. The invertebrates caught in pit-fall traps were collected on a 2-week basis (along with sweep net collection). The collection of insects with sweep net was made by a double-sided swing with a scoop of about 120 degrees, on two parallel transects, in which a total of 50 sweeps were made, 25 in each transect. Both transects were parallel to the traps, at a distance of 5 m from both sides of pit-fall traps. Invertebrates were caught every 2 weeks from the beginning of May to the end of July.
In both weed flora and Orthoptera analyses, the species richness (N), species abundance (n), and Shannon’s diversity index (H’) [27] were calculated.

2.5. Statistical Analyses

The theme and indicator results were not normally distributed according to Shapiro-Wilk test. Therefore, the non-parametric Mann–Whitney U test [28] was used for identifying significant differences between the organic and conventional samples at significance level p = 0.05. Calculations were performed using IBM SPSS Statistics 21.0 software.
The comparison of RISE Biodiversity theme scores and on-farm biodiversity sampling results was done by Spearman’s correlation matrix. Average data from 2012–2014 was included in the correlation analysis. Statistical significance of correlation coefficients (rs) was calculated with PAST 3.0 software [29].

3. Results

3.1. General Characteristics of the Farms

Conventional farms were larger than organic ones, which was in line with the average distribution (Table 3). Both types of farms were slightly larger than average for Lublin region and Poland. The share of arable lands in total agricultural area was 75% in organic and conventional farms. Cereals dominated both farming systems. A larger share of cereals in crop rotations was observed on conventional farms, while organic system was characterized by more diversified cropping pattern. The livestock density and CO2 emissions were higher in conventional farms (Table 3 and Table 4). Organic farms used mostly manure that was produced on the farm, but the input of nutrients was low (N and P input = 8.6 kg/ha AA). Such low N and P input was due to the low livestock density. The main source of nitrogen in organic farms was biological fixation by legumes and input from air (Table 4). Plant production in conventional farms was rather extensive, as they were using 60 kg of nitrogen in mineral fertilizers per ha of AA and less than 7 kg of phosphorous in mineral fertilizers per ha. The total N input from all sources was 144 kg/ha in these farms. Although there were rather low yields of cereals in both types of farms, the yields in conventional farms were significantly greater (3.1 t/ha on average) than in organic farms (2.0 t/ha). Employment per hectare of AA was higher in organic farms than in conventional ones (Table 4).
The productive potential of an average hectare of Polish soils equal to the potential of 0.6 ha of arable lands in European Union, which mostly due to the high acidity of soils. That is why the management of soil resources in the context of protection of highly productivity soils and proper functioning of ecosystems is so important [30].

3.2. Assessment of Sustainable Performance of Organic and Conventional Farms

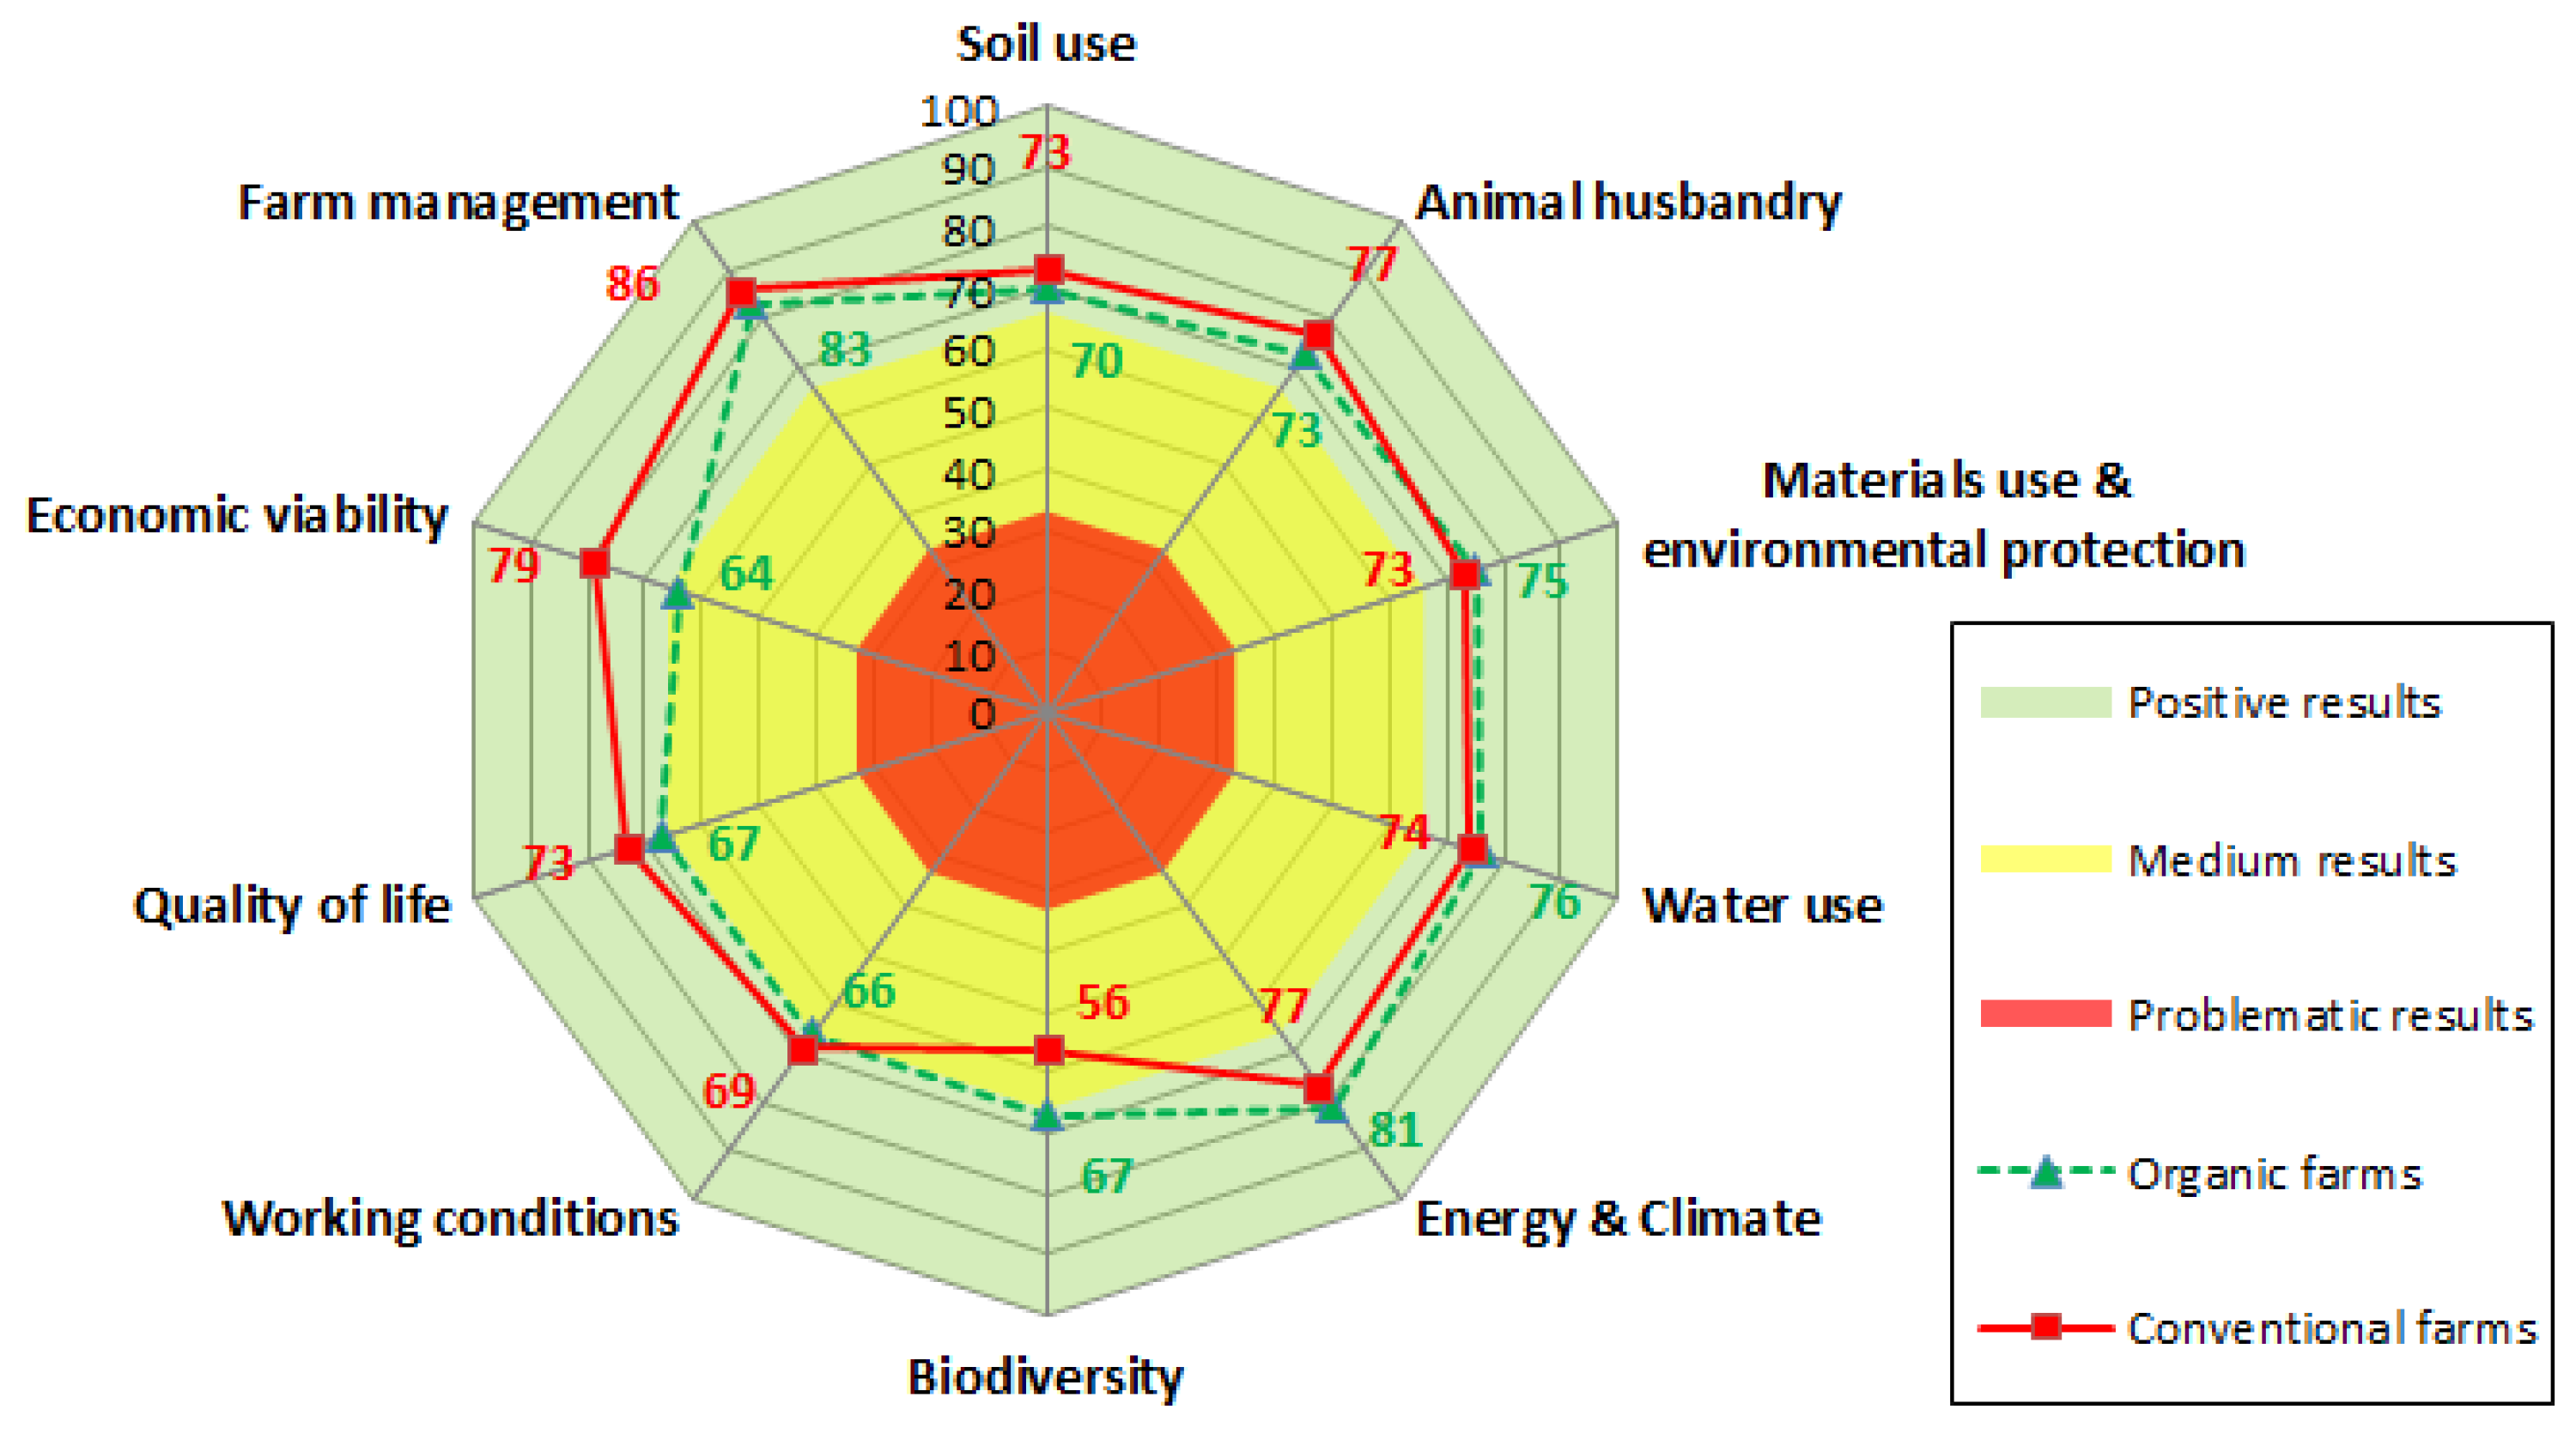
3.2.1. Sustainability Polygon

To summarize the RISE 3.0 sustainability evaluation, the scores of single themes for organic and conventional farms are presented in polygon (Figure 2).
According to the RISE calculations, organic farms achieved a very good overall result. They performed positively (67 and more points) for 7 of 10 themes. The values of the remaining three themes, biodiversity, working conditions, and economic viability, were very close to positive scores (64 to 66 points). Conventional farms reached positive scores of 9 from 10 themes, besides biodiversity (53 points), which was in the middle zone.
None of the types of farms had problematic (<34) median scores for themes, while at the indicator level, 7% of indicators of both farming systems could be considered as problematic. Examples of such indicators include soil reaction (topsoil pH), distribution of ecological infrastructures, and diversity of agricultural production.
The share of indicators of the “medium” category (34–66) ranged from 22% for conventional farms to 26% for organic farms. 67% of indicators of organic farms and 71% of indicators of conventional farms were in the category “positive”. The sustainability performance on one theme (biodiversity) and two indicators (greenhouse gas balance and intensity of agricultural production) differed significantly between farming systems.

3.2.2. Soil Use

There was no significant difference between organic and conventional farms in soil use theme, nor in any of its 6 individual indicators (Table 5). Yet, there were no significant differences in soil management indicators, and the score was higher for conventional farming system.
Crop productivity score was in the medium area in organic system (Table 5) due to smaller yields of crops (Table 4).
The results for soil organic matter indicator were positive for both farming systems, but the score was insignificantly higher in organic than in conventional system. The results depended on the share of agricultural lands, which can contribute to the surplus in organic matter balance (grasslands, pastures, permanent crops, arable lands with plant residues left on a field, and share of leguminous plants).
High soil acidity (average pHKCl of 4.8 in organic and 4.9 in conventional farms) was the main reason for very low (problematic) scores of soil reaction indicators for both types of farms. Soil acidity for 85% of farms area was lower than 5. Such low acidity is common in 60% of soils in Poland, as they are located on sandy soils. Furthermore, four of ten conventional farms used acidifying fertilizers (e.g., ammonium based fertilizers, urea).
Both soil erosion and soil compaction indicators reached very high positive values for both types of farms due to no visible erosion on the farms and usage of rather light machinery.

3.2.3. Animal Husbandry

The median of animal husbandry theme scores, as well as the five individual indicators of it, had positive values and did not differ significantly between organic and conventional farms. However, some tendencies were observed (Table 6).
The median of herd management score was insignificantly higher in conventional (67) than in organic farms (50). Conventional farms collected more information about performance, reproduction, animal transport, and diseases than organic farms. It was mostly due to high share of conventional farms with animal production for the market, while organic farmers kept their animals mostly for self-supply and local market.
The same trend was observed for the livestock productivity indicator. Lower productivity in organic farms (medium value 43) was due to the use of fodder of low-energy content, as well as a preference for high quality rather than high growing-rates. The average large animal unit (LU) per hectare of farms with animal production was 1.10 in conventional farms and 0.21 in organic farms (Table 4).
The indicator of the opportunity for species-appropriate behavior varied a lot between the farms within these two analyzed groups. In some, animals were kept alone, in others there was not enough free space available, but in most of them animals had moderately good conditions in which to socialize.
Both living conditions and animal health were rather good in two tested farming systems, with very few exceptions, which resulted in very good scoring of these two indicators in both farming systems (89–97) (Table 6).

3.2.4. Material Use & Environmental Protection

Both groups of analysed farms, organic and conventional, reached high sustainability scores for materials use & environmental protection theme according to RISE methodology (73–75) (Table 7). The analysis of this theme and indicators showed that no significant differences between organic and conventional farms were found.
Indicator material flows reached high values (77–81) for both types of farms due to high level of self-sufficiency in animal feed and fertilizers (the median for N self-sufficiency in fertilizers was 100% for organic farms and 68% for conventional ones; for P self-sufficiency in fertilizers it was 100% for both systems). Medium scores of the fertilization indicator were caused by insufficient replacement of phosphorous (P balance was 27% in organic farms and 66% in conventional ones) (Table 4) on the one hand, and a surplus of potentially available N compared to the removal with the harvested products (N balance was 134% in organic and 143% in conventional) on the other. Not enough manure was available because of usually low animal densities, especially in organic farms. In both types of farms, N supply in mineral and natural fertilizers on arable fields was frequently too low. At meadows, fixation of nitrogen by leguminous plants improved the overall result.
The value of plant protection indicator was higher for organic farms (75—positive value) than for conventional (50—medium value). These differences were due to the fact that organic farms did not use synthetic chemical plant protection products, but agrotechnical and mechanical methods, which are less damaging to environment. Farmers from both groups reported problems with weed infestation due to the large share of cereals in crop rotation and inappropriate weed management. In organic farms, harrowing was carried out too rarely, because of the lack of machinery and a lack of agrotechnical knowledge. Some conventional farmers had problems with selection of herbicides suitable for weed species composition on the field. They often used repeatedly the same, cheapest herbicides, not targeted to weeds, which resulted in low effectiveness of these measures. This may have caused a problem with compensation and resistance of some weed species. Many conventional farms did not consider resistance to pest and pathogens. Only one conventional farmer used products other than herbicides. In both types of farms, seeding material of low quality could influence the energy of germination and, as a result, the density of plant canopy. This resulted in low competitiveness of crop against weeds.
The indicators air pollution and soil and water pollution reached positive sustainable scores because of low livestock densities, which resulted in low environmental risk, as well as compliance with the policy rules.

3.2.5. Water Use

The assessment of water use theme showed positive results for organic and conventional farms, but the scores for indicator water management were medium (37) in both groups (Table 8). This is probably because water availability was good, and this topic was not actively managed. There were only two farms (organic with vegetable and fruit production) that were using irrigation systems of their land. Nevertheless, water supply was very good in all conventional and organic farms (median for sustainability score 100 points for both types of farms). Only distribution of precipitation within vegetative season was sometimes problematic and could negatively affect crop yields.

3.2.6. Energy & Climate

The main scores for energy and climate theme did not differ significantly between organic and conventional farms and had positive values (Table 9). Energy management indicator reached lower values (medium, according to RISE methodology in both farming systems). This could be the result of low level of mechanisation. Most of machines were old and not efficient, but most large farms decided to buy new machines. Small farms should check opportunities for cooperation with other farms in using their highly-effective machinery. Another possibility for improving energy management is dissemination of renewable energy sources, such as PV plants and solar heating panels, especially because local subsidies are available. The barrier for the development of these initiatives is the risk and the fear of farmers to make investments.
Indicator of greenhouse gas balance showed significantly higher median values for organic farms (100) than for conventional (80), although both were positive. It is connected with higher livestock density in conventional farms, because emissions from ruminants are the main cause of emissions. In the organic system, livestock production meets more limitations than in the conventional one, mostly due to lower yields of fodder crops and a limited local market for organic animal products.

3.2.7. Biodiversity

A significant difference in the performance of biodiversity between organic and conventional farms in Lublin province was recorded (Table 10). The value of median was higher for organic (67) than for conventional farming system (56). The values were influenced by the low scores of two indicators: Distribution of ecological infrastructures and diversity of agricultural production.
In the case of distribution of ecological infrastructures, low indicator values were caused by simplified landscapes in arable fields. Number of ecological structures on arable lands was quite stable over the last years. There was a minor increase in number of those structures on pastures, caused by abandonment of pasture management due to decline or lack of livestock production.
Low score of diversity of agricultural production indicator is the effect of rather simple rotations dominated by cereals (Table 3), no cultivation of rare/endangered crops, no rare/endangered breeds, and low diversity in livestock production. Only one farmer participated in special breeding programme of old Pulawska pig breed (resistant breed, low growth rate, and meat of high quality). To improve the diversity of agricultural production, farmers should tap the potential of local breeds and varieties.
High scores of biodiversity management indicator were due to better availability of information about the role of biodiversity in agroecosystems for organic farmers. Moreover, during the study interviewers noticed that organic farmers were more interested in information about the biodiversity of their land, and they also had higher ecological awareness than conventional farmers.
The values of ecological infrastructure indicators showed high variability within the groups. Some farms had a high share of valuable zones, as they were placed in the Natura 2000 areas; others had almost no ecological infrastructures. The same refers to the distribution of ecological infrastructure, which also varied a lot between single farms.
Intensity of agricultural production differed significantly among tested groups of farms. In the organic system, lower stocking density, lower input of nitrogen per hectare, and fewer applications of plant protection products were recorded in comparison to those in conventional farming (Table 4).
RISE biodiversity theme score correlated positively and strongly with all biodiversity sampling indicators for both above-ground weed flora and soil seed bank (with the exception of the density of weeds)(correlation coefficient 0.63–0.66) (Table 11). There was no significant correlation between RISE biodiversity theme score and Orthoptera biodiversity. Distribution of ecological infastructures and intensity of agricultural production were two indicators that correlated the most with measured on-field biodiversity. Distribution of ecological infrastructures correlated significantly with all weeds biodiversity indicators and also with Shannon index for Orthoptera insects. Indicator of intensity of agricultural production correlated significantly with almost all weeds and soil seed bank biodiversity indicators (with the exception of the abundance of above-ground weeds), and also with Shannon index and number of species of Orthoptera insects. Diversity of agricultural production indicator correlated positively with soil seed bank abundance and Shannon index.

3.2.8. Working Conditions

The working conditions in both types of farms were at moderately good level, and no significant differences were found (Table 12). It is worth noticing that only two farms hired full-time employees. The other farms were rather small and relied mostly on the work of self-employed workers (farmer and farmer’s family).
The personnel management, one of four indicators of working conditions theme, scored similarly in both types of farms. Farmers depended mostly on on-farm labor, with most of them expecting sons to take over the farm in the future. However, some did not have successors. All farmers had obligatory, sufficient health and pension insurance.
Most of farms suffered from too high workload. The score for this indicator was rather poor in both farming systems (median of 50 in organic farms, and 59 in conventional farms). Too many working hours per day and week occurred particularly on farms with animal production. In crop production, there were work peaks at summertime, but it was possible to compensate them during the winter time, when farmers had more time to rest. Furthermore, some organic farmers who conducted vegetable production had problems with working time due to time-consuming hand weeding.
Safety at work was at rather good level, with no significant differences between the two types of farms. Since most of farms were rather small and with a low level of mechanization in animal production, few minor accidents have happened when working with animals. Users of chemicals were trained, and also the equipment was tested regularly to minimize the health-risk from the toxic plant protection products.
No differences between organic and conventional farms were found in wage and income levels. Most farmers were rather unhappy with their income level. There was no clear pattern as to which type of farm had higher income. It depended mostly on individual farmers. The most successful farmers produced high quality products (also for export), cultivated canola and wheat for the market, and collaborated with universities to improve the yields. In organic farms, spelt had some potential, but the most successful farm was one with vegetables of very high-quality production. Furthermore, due to the low prices of milk, some dairy farms were switching to meat production. This change required investments, and it also influenced farm wage and income levels at the time, as farmers were awaiting their first return from the investment (selling of animals).

3.2.9. Quality of Life

There were no significant differences between the two farm types in the median value for quality of life (Table 13). The topic scores for both farm types were at moderately high level. Moreover, there were no significant differences between farms for 5 individual indicators of the quality of life topic. The general quality of life was rather high, but it varied strongly between individual farmers.
The median of occupation & training score was at good level in both farming systems. Most farmers were happy with their education, and they had good availability of training, mostly hosted by advisory centers. Also, most farmers used the internet service of agricultural advisors.
Satisfaction with the financial situation was at moderate level in both types of farms. It depended strongly on individual farmers, their land resources, current strategy, strategy changes, farm investments, and loans costs, but also on current health of a farmer. Health problems caused problems with productivity, because most of the work was usually done by farmers themselves.
The social relations were at very good level in assessed farms. In most cases, farmers lived in on the farmstead with their family. Those farms were mostly located in rather small villages, with good neighborly relationships of a whole community. Farmers claimed that they had no or rather minor social problems within family members. Most farmers claimed that they had friendly relationships within local community and, if necessary, the neighbors were willing to help one another.
The personal freedom & values indicator scored poorly in both farming system. This was mostly because some farmers were dissatisfied with political and economic situation. Most of them mentioned that law changed too often (for example agri-environment schemes), and it was sometimes hard for farmers to keep up with the changes and adapt to them. On the other hand, organic famers often appreciated subsidies for their production system. Some of them claimed that without those subsidies agricultural production would be unprofitable. Another often-mentioned issue was overwork and insufficient leisure time.
The score for health indicator was at moderately good level in both farms. Most of farmers claimed that they had good health, but few of them stated their health problems.

3.2.10. Economic Viability

The score of the economic viability theme showed no differences between organic and conventional farms (Table 14). There were no significant differences in economic viability in any of five individual indicators of the theme, but it seemed that conventional farms performed slightly better than organic farms on each single indicator score.
The median for liquidity indicator was the lowest of all 5 indicators of economic viability theme. About one third of the farmers mentioned they had liquidity problems due to the change from milk to meat production, which required investments. Other problems for those farms were decreasing price of milk, overinvestment and high costs of loans, saving money for land investments, health issues (back problems), and low prices of cereals (even organic).
The median score of profitability indicator was high in both farming systems, but insignificantly higher in conventional farms than in organic farms. Good overall result of profitability was due to low level of inputs, such as plant protection products, fertilizers, and other production materials. A large share of income, especially in organic farms, came from subsidies. Stability of farms was at a moderately good level. Farmers usually did not have problems with finding buyers for their products, but the prices were rather low and unsatisfying for most of them. Good-quality products, e.g., high-quality vegetables from organic farms, or traditional breeds of pigs (Pulawska) in conventional farms, were sold for prices which satisfied farmers. Ability to invest and maintain the farm was limited in many farms, especially in the smallest ones, due to low total income.
Indebtedness scores had positive values. Most of farms had no long-term loans, which affected the score. Livelihood security scores were at moderately good level for both farming systems. Most farm holders claimed that new machines like tractors and tillage machinery were bought recently. Smaller farmers made small investments in their farm (e.g., better insulation and other minor renovation of farm buildings), but as the initial level was rather low, those improvements had considerable effects.

3.2.11. Farm Management

Farm management theme scored similarly in both farming systems (Table 15). However, out of four indicators of which the topic consists of, one (resilient relationships) scored significantly higher in conventional farms than in organic farms. The median for organic farming system was 75, while the median for conventional farming was 100. The reason was mostly that organic farms, especially the smaller ones, depended strongly on the subsidies for organic farming. The share of subsidies in total income was so high that some farmers even claimed that they could not make any profit without these subsidies. The indicator includes also information about satisfaction with current situation in terms of cooperation. Most farmers said that they did not need any partnerships. They did not have any cooperators even for selling products.
The scores for business goals indicator had positive values in both kinds of farms. Farmers were aware of the problems on their farms and tried to adapt best to the situation. Generally, they were trying to keep risks as low as possible.
The availability of information was assessed well in both types of farms. The main sources of information were agricultural advisory centers, agricultural web sites, and advisors of plant protection product and fertilizers companies. Some farmers were participating in scientific conferences and workshops, others collaborated with universities. Most of them were satisfied with the opportunities for obtaining information, but at the same time some farmers felt the need to have more expert knowledge, which was hard to get from the most common source, which was the internet.
The median for risk management indicator for both groups of farms scored very well (100 points). That was because most of farmers did not see any major threats to their farms. The risk noticed by some farmers was dropping prices of cereals and milk, but farmers had no possibilities to mitigate it. Also, one farmer pointed out that diseases of livestock were a big risk for him, but he took care to mitigate them.

4. Discussion

Agriculture, which is strongly linked with the natural environment, is essential to achieving the goal of sustainable development. New methods of agricultural food production should integrate both biological and ecological processes, while the negative environmental impact of non-renewable inputs should be kept as low as possible. Sustainable agriculture should also focus on farmers and their knowledge, skills, and qualifications [31]. A growing ecological awareness of farmers is making them look for solutions and strategies that will bring them closer to the idea of the sustainable development. This is why a still-growing number of tools designed to support decision making in agricultural farms is being developed. Those tools are needed for both defining the current status of sustainability of a farm and also for finding the weaknesses of a farm management and the possible ways of improvement. Furthermore, comparisons between farms can be made when using those tools [23,32,33]. According to Rodrigues et al. (2010) [34], the main differences between tools are the level of complexity and the scale of the assessment (field plot, farm, and national level) and the number of indicators that contribute to the final sustainability assessment score. The authors [34] also noticed that it is an important task to assess the environmental and landscape indicators (share of ecological infrastructure, risk of plant protection product contamination, nitrogen balance, etc.) and integrate them with social, economic, and cultural and farm management indicators. Other authors also pointed out that animal welfare is an important indicator of sustainability, especially in developed countries [35,36]. Comparison of 35 different approaches to sustainability assessment made by Schader et al. (2014) [37] indicated that animal welfare was evaluated only in the RISE method. Singh et al. (2009) [38] concluded that indices used for sustainability assessment should be picked up carefully, and should cover all environmental, social, and economic aspects that are important to the community. According to Marchand et al. (2014) [39] and de Olde (2016) [40], farm assessment with RISE software provides holistic results of farm sustainability and also visualizes weaknesses and strong sites of a farm, which can be useful in finding and implementing new management strategies.
The presented study showed that according to RISE evaluation, there are not many differences in sustainability among organic and conventional (traditional) farms in Lublin province. Significant differences were found only for the biodiversity theme and for two indicators: greenhouse gas balance and intensity of agricultural production. Other themes and indicators were at similar level in both farming systems, probably due to similar level of intensity of agricultural production. If the conventional farms conducted more intensive production, the sustainability assessment results could be worse for conventional system and better for organic system [33].
On the other hand, some authors found that organic farming system could be more sustainable than other systems. In the study of Pimentel et al. (2005) [41], the main features of organic farming system that makes it more sustainable than conventional systems were higher soil organic matter content, which results in better soil quality and higher level of available water resources; lower inputs of fossil energy; higher labour inputs, which were more evenly distributed in time; reduced soil erosion and fewer diseases due to better crop rotation and cover cropping; and higher biodiversity level that provides biological pest control. Organic agriculture, compared to conventional, is less dependent on off-farm inputs and is more corresponsive with ecosystem functions [42]. Pimentel et al. [41] also noticed that sustainability of conventional farming systems can be improved by introducing some traditional organic farming technologies to that system. On the other hand, one of the most common issues with organic farming system is rather low economic viability due to rather low yields level. The study of Liu et al. (2016) [43] showed that economic result of organic farms could be improved significantly by introducing techniques to manage farm biodiversity. Those management practices provide improvement of soil properties, more effective control of pests and weeds, and, as a result, higher yields. Pacini et al. (2003) [44] found that organic farming system was more sustainable than integrated and conventional system due to generally lower nitrogen losses, risk from plant protection products, and higher biodiversity in organic farming system. Rasul and Thapa (2004) [45] stated that some indicators of sustainability (crop diversification, soil fertility management, pests and diseases management, and use of plant protection products) differed significantly between organic and conventional farming systems, but others are on the same level in those two farming systems.
According to Fedele et al. (2014) [46], main advantages of organic farming system compared to conventional one are soil fertility building, biodiversity preservation, and the reduced losses of nitrogen, phosphorous, and pesticides through leaching, surface run-offs, erosion, and drainage. Presented study showed that in the Lublin province only biodiversity level, greenhouse gas balance, and intensity of agricultural production performed better for organic than for conventional farms. Nevertheless, both groups of farms reached quite good level of sustainability. This was mainly due to rather low intensity of production of conventional farms in Lublin province, and thus they did not differ much from organic farms. On the other hand, De Olde et al. [23] have found differences in RISE score for one topic (water use) and 17 indicators even between different types of organic farms (vegetable, dairy, pig, and poultry).
The performance on biodiversity theme was “medium” for both farm types, mainly because of rather low number of ecological infrastructures and their poor distribution in tested farms. In the previous study that was conducted in Lublin province with RISE 1.0 model, the tendency of the low values of biodiversity indicator in conventional and organic farms was also observed [33]. This was also true of farms participating in agri-environment schemes [47]. It may indicate the existing threats to biodiversity due to simple crop rotation, low diversity of cultivated crop species, and varieties, as well as ineffective usage of plant protection products by farmers. In the study by de Olde et al. (2016) [23] conducted in the organic farms of different types of production in Denmark, the performance on the materials use & environmental protection, and energy and climate themes, was medium for all sectors. Moreover, the performance of the economic viability theme was medium for vegetable, dairy, and pig farms. In Poland, similar problems with economic viability and wage and income levels and financial situation existed in some farms. Economic viability and quality of life were assessed more favourably in conventional than in organic farms. This could be associated with local organic farming market, which is still in its infancy in many places. The prices for organic products are not high enough to cover the differences in yields between conventional and organic farms. Farmers may have problems with selling organic goods (especially cereals) at higher prices. High soil acidity and low crop productivity, improper weed regulation, and energy management were the most common problems in both types of farms. The quality of Polish soils is one of the poorest in Europe due to the prevalence of sandy, light soils of high acidity. The productive potential of an average hectare of Polish soils equals the potential of 0.6 ha of average quality arable lands in the European Union [29]. That is why the management of soil resources in the context of sustainable agricultural production and proper functioning of ecosystems is so important in Poland.
The assessments of sustainability of organic and conventional farms showed that in both groups of farms there are some problems connected with agricultural production which should be solved to improve sustainability level. Authors of the presented research suggest some recommendations for improvements which in some cases are similar for both types of farms (Table 16).

5. Conclusions

The results of the RISE assessment of sustainability levels of farms in high nature value areas of Lublin province in Poland suggest that low-input conventional farms perform similarly to organic farms. Organic farms scored better on the biodiversity theme and on the indicators greenhouse gas balance and intensity of agricultural production. According to the RISE model outputs, organic farms performed positively for 7 out of 10 themes, while conventional farms reached positive scores for 9 out of 10 themes. Moreover, our study showed that the biodiversity performance, an important indicator of sustainability, estimated with the RISE system, was highly correlated with measured on-field weed flora and Orthoptera biodiversity of farms. The presented assessments of sustainability of organic and conventional farms showed that in both groups of farms there are some problems connected with agricultural production (high soil acidity and low crop productivity, improper weed regulation, and energy management) which should be solved to improve the sustainability level. Working hours and wage and income levels were also assessed to be low in both organic and conventional farms. Recommendations on how to improve the sustainability of both organic and conventional farms were presented. The results of our study showed organic and low-input conventional farms to have achieved similar sustainability levels. Also, both can contribute to biodiversity protection. The results of the comparison of these two types of farms could contribute to fact-based discussions on the future of the Common Agricultural Policy and agri-environmental schemes and their regionalization, as different regions have different needs, and the relative effects of conversion to organic farming differ between regions.

Author Contributions

A.K.B. coordinated the data collection and sustainability assessments on the farms and analyzed farm statistical data. A.K.B., B.F.-S., and C.T. analyzed the data and wrote the paper. Statistical data on farms, both regional & countrywide, were provided by J.K. A.K.B. provided weed and soil seed bank biodiversity data, and P.R. provided Orthoptera biodiversity data. J.S. created a methodology and coordinated biodiversity research. All authors participated in reviewing the manuscript and discussing the results.

Acknowledgments

The study was conducted within the: KIK/25 project “Protection of species diversity of valuable natural habitats on agricultural lands on Natura 2000 areas in the Lublin Voivodeship”, co-financed from the Swiss-Polish Cooperation Programme and as a part of task 1.8. in the IUNG-PIB Multiannual Program. The publication was funded by Bern University of Applied Sciences, School of Agricultural, Forest, and Food Sciences.

Conflicts of Interest

The authors declare no conflict of interest.

References

  1. Halamska, M. The Evolution of Family Farms in Poland: Present Time and the Weight of the Past. East Eur. Countryside 2016, 22, 27–51. [Google Scholar] [CrossRef]
  2. Kopiński, J. Agri-environmental effects of changes in agricultural production in Poland. Econ. Reg. Stud. 2015, 8, 5–18. [Google Scholar]
  3. Stalenga, J.; Brzezińska, K.; Stańska, M.; Błaszkowska, B.; Czekała, W.; Feledyn-Szewczyk, B.; Gutkowska, A.; Hajdamowicz, I.; Kaliszewski, G.; Kazuń, A.; et al. Code of Good Agricultural Practices Supporting Biodiversity; Institute of Soil Science and Plant Cultivation—State Research Institute: Pulawy, Poland, 2016; p. 306. ISBN 978-83-7562-249-2. [Google Scholar]
  4. Directive 2009/147/EC of the European Parliament and of the Council of 30 November 2009 on the Conservation of Wild Birds (Codified Version). Off. J. Eur. Union 2009, 20, 7–25. Available online: http://extwprlegs1.fao.org/docs/pdf/eur92236.pdf (accessed on 29 May 2018).
  5. Council Directive 92/43/EEC of 21 May 1992 on the Conservation of Natural Habitats and of Wild Fauna and Flora. Off. J. Eur. Union 1992, 206, 7–50. Available online: https://eur-lex.europa.eu/legal-content/EN/TXT/PDF/?uri=CELEX:31992L0043&from=EN (accessed on 29 May 2018).
  6. Maps of General Directorate for Environmental Protection. Available online: http://geoserwis.gdos.gov.pl/mapy (accessed on 15 January 2018).
  7. Sutcliffe, L.M.E.; Batary, P.; Kormann, U.; Báldi, A.; Dicks, L.V.; Herzon, I.; Kleijn, D.; Tryjanowski, P.; Apostolova, I.; Arlettaz, R.; et al. Harnessing the biodiversity value of Central and Eastern European farmland. Divers. Distrib. 2015, 21, 722–730. [Google Scholar] [CrossRef] [Green Version]
  8. Central Statistical Office of Poland. Użytkowanie Gruntów i Powierzchnia Zasiewów w 2015 r.; Central Statistical Office: Warszawa, Polska, 2016. [Google Scholar]
  9. Belfrage, K.; Björklund, J.; Salomonsson, L. The Effects of Farm Size and Organic Farming on Diversity of Birds, Pollinators, and Plants in a Swedish Landscape. AMBIO J. Hum. Environ. Syst. 2005, 34, 582–588. [Google Scholar] [CrossRef]
  10. Schmitzberger, I.; Wrbka, T.; Steurer, B.; Aschenbrenner, G.; Peterseil, J.; Zechmeister, H.G. How farming styles influence biodiversity maintenance in Austrian agricultural landscapes. Agric. Ecosyst. Environ. 2005, 108, 274–290. [Google Scholar] [CrossRef]
  11. Marini, L.; Fontana, P.; Klimek, S.; Battisti, A.; Gaston, K.J. Impact of farm size and topography on plant and insect diversity of managed grasslands in the Alps. Biol. Conserv. 2009, 142, 394–403. [Google Scholar] [CrossRef]
  12. Dicks, L.V.; Ashpole, J.E.; Dänhardt, J.; James, K.; Jönsson, A.M.; Randall, N.; Showler, D.A.; Smith, R.K.; Turpie, S.; Williams, D.R.; et al. Farmland Conservation: Evidence for the Effects of Interventions in Northern and Western Europe; Synopses of Conservation Evidence, Volume 3; Pelagic Publishing Ltd.: Exeter, UK, 2013; p. 504. [Google Scholar]
  13. Agricultural and Food Quality Inspection. Condition of Organic Farming in Poland; The Report 2013–2014; Main Agricultural and Food Quality Inspection: Warsaw, Poland, 2015; p. 80. Available online: http://www.ijhar-s.gov.pl/pliki/A-pliki-z-glownego-katalogu/ethernet/2015/wrzesien/Raport%20o%20stanie%20rolnictwa%20ekologicznego%20w%20Polsce%20w%20latach%202013-2014.pdf (accessed on 29 May 2018).
  14. Council Regulation (EC). No. 834/2007 of 28 June 2007 on Organic Production and Labelling of Organic Products and Repealing Regulation (EEC) No. 2092/91. Off. J. Eur. Union 2007, 189, 1–23. Available online: https://eur-lex.europa.eu/legal-content/EN/TXT/PDF/?uri=CELEX:32007R0834&from=EN (accessed on 29 May 2018).
  15. Gomiero, T.; Pimentel, D.; Paoletti, M.G. Environmental impact of different agricultural management practices: Conventional vs. organic agriculture. Crit. Rev. Plant Sci. 2011, 30, 95–124. [Google Scholar] [CrossRef]
  16. Tuck, S.; Winqvist, C.; Mota, F.; Ahnström, J.; Turnbull, L.; Bengtsson, J. Land-use intensity and the effects of organic farming on biodiversity: A hierarchical meta-analysis. J. Appl. Ecol. 2014, 51, 746–755. [Google Scholar] [CrossRef] [PubMed]
  17. Reganold, J.P.; Wachter, J.M. Organic agriculture in the twenty-first century. Nat. Plants 2016, 2, 1–8. [Google Scholar] [CrossRef] [PubMed]
  18. Rigby, D.; Cáceres, D. Organic farming and the sustainability of agricultural systems. Agric. Syst. 2001, 68, 21–40. [Google Scholar] [CrossRef]
  19. Grenz, J.; Thalmann, C.; Stämpfli, A.; Studer, C.; Häni, F. RISE—A method for assessing the sustainability of agricultural production at farm level. Rural Dev. News 2009, 1, 5–9. [Google Scholar]
  20. Grenz, J.; Mainiero, R.; Schoch, M.; Sereke, F.; Stalder, S.; Thalmann, C.; Wyss, R. RISE 3.0—Manual. Sustainability Themes and Indicators; HAFL: Zollikofen, Switzerland, 2016; p. 96. [Google Scholar]
  21. Häni, F.; Braga, F.; Stämpfli, A.; Keller, T.; Fischer, M.; Porsche, H. RISE, a tool for holistic sustainability assessment at the farm level. Int. Food Agribus. Manag. Rev. 2003, 6, 78–90. [Google Scholar]
  22. Häni, F.; Gerber, T.; Stämpfli, A.; Porsche, H.; Thalmann, C.; Studer, C. An evaluation of tea farms in southern India with the sustainability assessment tool RISE. In Proceedings of the First Symposium of the International Forum on Assessing Sustainability in Agriculture (INFASA) (Symposium ID-105), Bern, Switzerland, 16–17 March 2006; pp. 1–14. Available online: https://www.researchgate.net/profile/Christian_Thalmann2/publication/228467030_An_Evaluation_of_Tea_Farms_in_Southern_India_with_the_Sustainability_Assessment_Tool_RISE/links/558cf53908ae40781c206ac4.pdf?inViewer=true&disableCoverPage=true&origin=publication_detail (accessed on 29 May 2018).
  23. De Olde, E.; Oudshoorn, F.; Bokkers, E.; Stubsgaard, A.; Sørensen, C.; de Boer, I. Assessing the Sustainability Performance of Organic Farms in Denmark. Sustainability 2016, 8, 957. [Google Scholar] [CrossRef]
  24. Central Statistical Office Databases. Available online: http://stat.gov.pl (accessed on 15 January 2018).
  25. Lublin Statistical Office 2016. Rolnictwo w Województwie Lubelskim w 2015 r; Informacje i Opracowania Statystyczne; Urząd Statystyczny w Lublinie: Lublin, Poland, 2016; p. 59. (In Polish)
  26. Price, J.N.; Wright, B.R.; Gross, C.L.; Whalley, W.R.D.B. Comparision of seedling emergence and seed extraction techniques for estimating the composition of soil seed banks. Methods Ecol. Evol. 2010, 1, 151–157. [Google Scholar] [CrossRef]
  27. Shannon, C.E. A mathematical theory of communications. Bell Syst. Tech. J. 1948, 27, 379–423. [Google Scholar] [CrossRef]
  28. Field, A. Discovering Statistics Using IBM SPSS Statistics; Sage: Newcastle, UK, 2005. [Google Scholar]
  29. Hammer, Ø. PAST Paleontological Statistics Version 3.14: Reference Manual; University of Oslo: Oslo, Norway, 2016. [Google Scholar]
  30. Skłodowski, P.; Bielska, A. Właściwości i urodzajność gleb Polski-podstawą kształtowania relacji rolno-środowiskowych. Woda-Śr.-Obsz. Wiej. 2009, 9, 203–214. [Google Scholar]
  31. Pretty, J. Agricultural sustainability: Concepts, principles and evidence. Philos. Trans. R. Soc. B Biol. Sci. 2008, 363, 447–465. [Google Scholar] [CrossRef] [PubMed]
  32. Hayati, D.; Ranjbar, Z.; Karami, E. Measuring Agricultural Sustainability. In Sustainable Agriculture Reviews; Springer Nature: Berlin/Heidelberg, Germany, 2010; pp. 73–100. [Google Scholar]
  33. Feledyn-Szewczyk, B.; Kopiński, J. The comparison of sustainability of agricultural production of organic and conventional farms using the RISE model. J. Res. Appl. Agric. Eng. 2015, 60, 28–32. [Google Scholar]
  34. Rodrigues, G.S.; Rodrigues, I.A.; de Almeida Buschinelli, C.C.; de Barros, I. Integrated farm sustainability assessment for the environmental management of rural activities. Environ. Impact Assess. Rev. 2010, 30, 229–239. [Google Scholar] [CrossRef]
  35. McGlone, J.J. Farm animal welfare in the context of other society issues: Toward sustainable systems. Livest. Sci. 2001, 72, 75–81. [Google Scholar] [CrossRef]
  36. Broom, D.M. Animal Welfare: An Aspect of Care, Sustainability, and Food Quality Required by the Public. J. Vet. Med. Educ. 2010, 37, 83–88. [Google Scholar] [CrossRef] [PubMed]
  37. Schader, C.; Grenz, J.; Meier, M.S.; Stolze, M. Scope and precision of sustainability assessment approaches to food systems. Ecol. Soc. 2014, 19, 1–15. [Google Scholar] [CrossRef]
  38. Singh, R.K.; Murty, H.R.; Gupta, S.K.; Dikshit, A.K. An overview of sustainability assessment methodologies. Ecol. Indic. 2009, 9, 189–212. [Google Scholar] [CrossRef]
  39. Marchand, F.; Debruyne, L.; Triste, L.; Gerrard, C.; Padel, S.; Lauwers, L. Key characteristics for tool choice in indicator-based sustainability assessment at farm level. Ecol. Soc. 2014, 19. [Google Scholar] [CrossRef] [Green Version]
  40. De Olde, E.M.; Oudshoorn, F.W.; Sørensen, C.A.G.; Bokkers, E.A.M.; de Boer, I.J.M. Assessing sustainability at farm-level: Lessons learned from a comparison of tools in practice. Ecol. Indic. 2016, 66, 391–404. [Google Scholar] [CrossRef]
  41. Pimentel, D.; Hepperly, P.; Hanson, J.; Douds, D.; Seidel, R. Environmental, Energetic, and Economic Comparisons of Organic and Conventional Farming Systems. BioScience 2005, 55, 573–582. [Google Scholar] [CrossRef]
  42. Niggli, U. Sustainability of organic food production: Challenges and innovations. Proc. Nutr. Soc. 2014, 74, 83–88. [Google Scholar] [CrossRef] [PubMed]
  43. Liu, H.; Meng, J.; Bo, W.; Cheng, D.; Li, Y.; Guo, L.; Li, C.; Zheng, Y.; Liu, M.; Ning, T.; et al. Biodiversity management of organic farming enhances agricultural sustainability. Sci. Rep. 2016, 6, 23816. [Google Scholar] [CrossRef]
  44. Pacini, C.; Wossink, A.; Giesen, G.; Vazzana, C.; Huirne, R. Evaluation of sustainability of organic, integrated and conventional farming systems: A farm and field-scale analysis. Agric. Ecosyst. Environ. 2003, 95, 273–288. [Google Scholar] [CrossRef]
  45. Rasul, G.; Thapa, G.B. Sustainability of ecological and conventional agricultural systems in Bangladesh: An assessment based on environmental, economic and social perspectives. Agric. Syst. 2004, 79, 327–351. [Google Scholar] [CrossRef]
  46. Fedele, A.; Mazzi, A.; Niero, M.; Zuliani, F.; Scipioni, A. Can the Life Cycle Assessment methodology be adopted to support a single farm on its environmental impacts forecast evaluation between conventional and organic production? An Italian case study. J. Clean. Prod. 2014, 69, 49–59. [Google Scholar] [CrossRef]
  47. Feledyn-Szewczyk, B.; Kopinski, J. Ocena zrównoważenia produkcji rolniczej w gospodarstwach uczestniczących w programie rolnośrodowiskowym za pomocą modelu RISE. Rocz. Naukowe SERIA 2015, 17, 45–51. [Google Scholar]
  48. Kuś, J. Produkcyjne i środowiskowe następstwa specjalizacji gospodarstw rolniczych. Stud. Rap. IUNG-PIB 2012, 29, 103–120. [Google Scholar]
  49. Stein-Bachinger, K.; Reckling, M.; Grandstedt, A. Volume I: Farming Guidelines. In Ecological Recycling Agriculture. Guidelines for Farmers and Advisors; Nikola Acuti: Berlin, Germany, 2013; p. 136. ISBN 978-3-00-042440-3. Available online: http://www.beras.eu/implementation/images/pdf/farming_guidelines.pdf (accessed on 29 May 2018).
  50. Anderson, R.L. Managing weeds with a dualistic approach of prevention and control. A review. Agron. Sustain. Dev. 2007, 2, 13–18. [Google Scholar] [CrossRef]
  51. Armengot, L.; José-María, L.; Chamorro, L.; Sans, F.X. Weed harrowing in organically grown cereal crops avoids yield losses without reducing weed diversity. Agron. Sustain. Dev. 2013, 33, 405–411. [Google Scholar] [CrossRef]
  52. Bond, W.; Grundy, A.C. Non-chemical weed management in organic farming systems. Weed Res. 2001, 41, 383–405. [Google Scholar] [CrossRef]
  53. Chikowo, R.; Faloya, V.; Petit, S.; Munier-Jolain, N.M. Integrated Weed Management systems allow reduced reliance on herbicides and long-term weed control. Agric. Ecosyst. Environ. 2009, 132, 237–242. [Google Scholar] [CrossRef]
  54. Davies, D.H.K.; Welsh, J.P. Weed control in organic cereals and pulses. In Organic Cereals and Pulses: Papers Presented at Conferences Held at the Heriot-Watt University, Edinburgh, and at Cranfield University Silsoe Campus, Bedfordshire, 6 and 9 November 2001; Younie, D., Taylor, B.R., Welch, J.M., Wilkinson, J.M., Eds.; Chalcombe Publications: Southampton, UK, 2002; Chapter 5; pp. 77–114. [Google Scholar]
  55. Kolb, L.N.; Gallandt, E.R. Weed management in organic cereals: Advances and opportunities. Org. Agric. 2012, 2, 23–42. [Google Scholar] [CrossRef]
  56. Olesen, J.; Trnka, M.; Kersebaum, K.; Skjelvåg, A.; Seguin, B.; Peltonen-Sainio, P.; Rossi, F.; Kozyra, J.; Micale, F. Impacts and adaptation of European crop production systems to climate change. Eur. J. Agron. 2011, 34, 96–112. [Google Scholar] [CrossRef]
  57. Valentinov, V. Why are cooperatives important in agriculture? An organizational economics perspective. J. Inst. Econ. 2007, 3, 55–69. [Google Scholar] [CrossRef]
  58. Boller, E.F.; Häni, F.; Poehling, H.-M. Ecological Infrastructures: Ideabook on Functional Biodiversity at the Farm Level; Landwirtschaftliche Beratungszentrale Lindau (LBL): Berkeley, CA, USA, 2004. [Google Scholar]
  59. Tscharntke, T.; Klein, A.M.; Kruess, A.; Steffan-Dewenter, I.; Thies, C. Landscape perspectives on agricultural intensification and biodiversity â ecosystem service management. Ecol. Lett. 2005, 8, 857–874. [Google Scholar] [CrossRef]
  60. Finley, L.; Chappell, M.J.; Thiers, P.; Moore, J.R. Does organic farming present greater opportunities for employment and community development than conventional farming? A survey-based investigation in California and Washington. Agroecol. Sustain. Food Syst. 2017, 42, 552–572. [Google Scholar] [CrossRef]
  61. Reder, H.; Redelberger, H.; Schmidt, S. Volume II: Economic Guidelines. In Ecological Recycling Agriculture. Guidelines for Farmers and Advisors; Nikola Acuti: Berlin, Germany, 2013; p. 64. Available online: http://beras.eu/wp-content/uploads/2013/08/new-farming-guidelines.pdf (accessed on 15 January 2018).
  62. Jonczyk, K.; Stalenga, A.; Heinonen, S.; Koreleska, E. Volume III: Marketing Guidelines. In Ecological Recycling Agriculture. Guidelines for Farmers and Advisors; Nikola Acuti: Berlin, Germany, 2013; p. 48. Available online: http://beras.eu/wp-content/uploads/2013/08/new-farming-guidelines.pdf (accessed on 15 January 2018).
  63. Koker, W.; Stein-Bachinger, K. Volume IV: Farm examples. In Ecological Recycling Agriculture. Guidelines for Farmers and Advisors; Nikola Acuti: Berlin, Germany, 2013; p. 88. Available online: http://beras.eu/wp-content/uploads/2013/08/new-farming-guidelines.pdf (accessed on 15 January 2018).
Figure 1. Comparison of sustainability performance of conventional and organic farms.
Sustainability 10 01792 g001
Figure 2. Localization of pairs of organic and conventional tested farms.
Sustainability 10 01792 g002
Table 1. Themes and indicators in RISE 3.0.
ThemeIndicatorsThemeIndicators
1. Soil use1.1. Soil management
1.2. Crop productivity
1.3. Soil organic matter
1.4. Soil reaction
1.5. Soil erosion
1.6. Soil compaction
6. Biodiversity6.1. Biodiversity management
6.2. Ecological infrastructures
6.3. Distribution of ecological infrastructures
6.4. Intensity of agricultural production
6.5. Diversity of agricultural production
2. Animal husbandry2.1. Herd management
2.2. Livestock productivity
2.3. Opportunity forspecies-appropriate behaviour
2.4. Living conditions
2.5. Animal health
7. Working conditions7.1. Personnel management
7.2. Working times
7.3. Safety at work
7.4. Wage and income levels
3. Material use & environmental protection3.1. Material flows
3.2. Fertilization
3.3. Plant protection
3.4. Air pollution
3.5. Soil and water pollution
8. Quality of life8.1. Occupation and education
8.2. Financial situation
8.3. Social relations
8.4. Personal freedom and values
8.5. Health
8.6. Other aspects of life
4. Water use4.1. Water management
4.2. Water supply
4.3. Water use intensity
4.4. Irrigation
9. Economic viability9.1. Liquidity
9.2. Profitability
9.3. Stability
9.4. Indebtedness
9.5. Livelihood security
5. Energy and climate5.1. Energy management
5.2. Energy intensity ofagricultural production
5.3. Greenhouse gas balance
10. Farm management10.1. Business goals, strategy, implementation
10.2. Availability of information
10.3. Risk management
10.4. Resilient relationships
Table 2. Composition of the RISE theme biodiversity: indicators, aspects, and valuation schemes. AA = agricultural area; ha = hectare; LAU = large animal unit (= 1 lactating dairy cow); N = nitrogen; pts. = points.
6. BiodiversityValuation Scheme
6.1 Biodiversity management
(a)
Receiving advice about biodiversity and/or own active management of species protection and ecosystem conservation
(b)
Measures to promote biodiversity (arable crops, grassland, permanent crops, and woodland (optionally))
(a)
Qualitative valuation of management
(b)
Qualitative valuation of crop type specific measures (e.g., mowing techniques, undersown crops, no use of plant protection products, and no burning); weighted by area
6.2 Ecological Infrastructures
Share of AA (optionally whole farm area) with high ecological value (planar, linear, and point structures).
17% = 100 pts.
0% = 0 pts.
Contribution of the farm to UN Nagoya biodiversity goal.
6.3 Distribution of ecological infrastructures
(a)
Share of AA near ecologically valuable structures (<50 m)
(b)
Ecological structures’ development over time
(a)
100% = 100 points
0%= 0 pts.
(b)
Bonus/malus 40 pts.
6.4 Intensity of agricultural production
(a)
Fertilization
(b)
Plant protection (number of applications, toxicity, and persistence)
(c)
Stocking density
(a)
0 kg N/ha = 100 pts.
100 kg N/ha = 33 pts.
300 kg N/ha = 0 pts.
(b)
0 application/ha = 100 pts.
3 applications/ha = 0 pts.
Toxicity and persistence: qualitative valuation
(c)
1 LAU/ha = 100 pts.
3 LAU/ha = 0 pts.
Per ha AA and per production oriented area (pAA) (pAA = AA – ecological valuable structures (6.3))
6.5 Diversity of agricultural production
(a)
No. of land use types
(b)
No. of arable and permanent crops
(c)
No. of old/rare crop varieties
(d)
No. of livestock breeds on the farm
(e)
No. of old/rare livestock breeds
(f)
Beekeeping
(g)
Biodiversity score of permanent grassland based on frequency of use and yield
100 pts. when
(a)
5 land use types (minimum area > 8% AA)
(b)
1 additional crop for each hectare of AA; cap at 10 ha AA
(c)
3 old/rare crop varieties
(d)
6 livestock breeds on the farm
(e)
3 old/rare livestock breeds
(f)
Keeping bees at the farm
(g)
High biodiversity score of permanent grassland (extensive use)
Table 3. The main characteristics of the 10 tested organic farms and 10 tested conventional farms in Lublin region (mean values). Source: own data, Central Statistical Office 2016 [8], Lublin Statistical Office 2016 [25].
ItemTested Farms (Mean Lublin Region)
OrganicConventional
Agricultural area (AA) (ha), including:27.2 (18.5)49.7 (38.8)
arable lands20.3 (14.4)37.3 (32.5)
grasslands7.2 (2.3)15.9 (4.1)
permanent crops0.8 (0.0)0 (0.0)
Cropping pattern (%), including:
cereals59.073.3
mixture of cereals and legumes9.82.0
industrial crops (sugar beet, rape)07.8
fodder crops on arable lands3.98.1
remaining crops27.38.7
Catch crops (% AA of farm in winter)14.526.5
Livestock density (large unit per ha AA) (LU/ha)0.13 0.54
Table 4. Characteristics of agricultural production in tested organic and conventional farms (median values).
ItemType of Farms
OrganicConventional
Livestock density for farms with livestock (LU/ha AA)0.211.10
N input (kg/ha AA):54.5144.3
from mineral fertilizers1.059.5
from manure6.732.8
from legumes, N input from air46.952.0
P input kg/ha AA:2.115.8
from mineral fertilizers06.7
from manure1.99.1
from imported organic fertilizers0.20
N balance (%)134143
P balance (%)2766
N balance (kg/ha AA)1249
P balance (kg/ha AA)−8−3
Number of chemical plant protection measures in cereals00.9
Yields of cereals and their mixture (t/ha AA)2.03.1
GHG emissions (t/ha/year CO2-eq.)0.92.7
Number of family members employed (full-employment person according to RISE method)1.81.6
Number of employees00.5
Total employment per ha0.060.04
Source: own data.
Table 5. Sustainability score for soil use theme and its indicators for organic and conventional farms (median, min-max); p-value of Mann–Whitney U test.
Theme and IndicatorsOrganicConventionalp-Value
1. Soil use70 (64–77)73 (58–84)0.165
  1.1. Soil management67 (50–100)84 (50–100)0.393
  1.2. Crop productivity54 (16–94)77 (42–100)0.123
  1.3. Soil organic matter84 (50–98)81 (56–90)0.436
  1.4. Soil reaction3 (0–50)3 (0–70)0.912
  1.5. Soil erosion100 (84–100)100 (100–100)0.739
  1.6. Soil compaction100 (70–100)100 (30–100)0.280
Colours indicate: Green—good performance, orange—medium performance, red—problematic performance.
Table 6. Sustainability score for animal husbandry theme and its indicators for organic and conventional farms (median, min-max); p-value of Mann–Whitney U test.
Theme and IndicatorsOrganicConventionalp-Value
2. Animal husbandry73 (61–84)77 (53–94)0.613
  2.1. Herd management50 (33–100)67 (33–100)0.867
  2.2. Livestock productivity43 (18–56)72 (22–100)0.072
  2.3. Opportunity for species-appropriate behavior74 (45–100)67 (53–100)0.189
  2.4. Living conditions97 (83–100)89 (69–100)0.397
  2.5. Animal health92 (83–100)90 (67–95)0.152
Colours indicate: Green—good performance, orange—medium performance.
Table 7. Sustainability score for materials use & environmental protection theme and its indicators for organic and conventional farms (median, min-max); p-value of Mann–Whitney U test.
Theme and IndicatorsOrganicConventionalp-Value
3. Materials use & environmental protection75 (55–87)73 (69–81)0.796
  3.1. Material flows81 (63–88)77 (50–93)0.190
  3.2. Fertilization43 (0–79)64 (48–69)0.089
  3.3. Plant protection75 (25–100)50 (25–100)0.218
  3.4. Air pollution77 (56–88)77 (65–85)1.000
  3.5. Soil and water pollution97 (94–100)97 (86–99)0.190
Colours indicate: Green—good performance, orange—medium performance.
Table 8. Sustainability score for water use theme and its indicators for organic and conventional farms (median, min-max); p-value of Mann–Whitney U test.
Theme and IndicatorsOrganicConventionalp-Value
4. Water use76 (70–87)74 (66–93)0.393
  4.1. Water management37 (21–67)37 (10–91)1.000
  4.2. Water supply100 (100–100)100 (100–100)1.000
  4.3. Water use intensity91 (76–97)87 (78–97)0.481
  4.4. Irrigation94 (88–100)No irrigation
Colours indicate: Green—good performance, orange—medium performance.
Table 9. Sustainability score for energy & climate theme and its indicators for organic and conventional farms (median, min-max); p-value of Mann–Whitney U test.
Theme and IndicatorsOrganicConventionalp-Value
5. Energy & Climate81 (57–91)77 (44–91)0.481
  5.1. Energy management64 (18–77)58 (25–100)0.684
  5.2. Energy intensity of agricultural production94 (7–100)94 (78–100)0.912
  5.3. Greenhouse gas balance100 (67–100) *89 (11–100) *0.043
Colours indicate: Green—good performance, orange—medium performance. * Significant differences between organic and conventional farms at p = 0.05.
Table 10. Sustainability score for biodiversity theme and its indicators for organic and conventional farms (median, min-max); p-value of Mann–Whitney U test.
Theme and IndicatorsOrganicConventionalp-Value
6. Biodiversity67 (46–76) *56 (24–70) *0.043
  6.1. Biodiversity management72 (37–83)56 (33–73)0.123
  6.2. Ecological infrastructures88 (29–100)74 (0–100)0.481
  6.3. Distribution of ecological infrastructures33 (15–80)18 (5–70)0.089
  6.4. Intensity of agricultural production99 (92–100) *76 (47–97) *<0.001
  6.5. Diversity of agricultural production31 (25–72)29 (13–48)0.165
Colours indicate: Green—good performance, orange—medium performance, red—problematic performance. * Significant differences between organic and conventional farms at p = 0.05.
Table 11. Spearman’s correlation coefficient matrix (rs) between on-farm biodiversity indices for weeds, weed soil seed bank and Orthoptera, and RISE theme and its indicators.
On-Farm Biodiversity IndicesRISE Biodiversity Theme and Indicators
BiodiversityBiodiversity ManagementEcological Infrastructu-ResDistribution of Ecological Infrastructu-ResIntensity of Agricultural ProductionDiversity of Agricultural Production
OrthopteraN **0.310.250.330.320.45 *−0.11
N0.210.320.340.120.380.03
H′0.310.030.260.45 *0.48 *0.01
WeedsN0.66 *0.280.420.71 *0.69 *0.22
n0.410.240.300.58 *0.350.03
H′0.63 *0.120.48 *0.70 *0.56 *0.33
Soil seed bankN0.66 *0.140.410.61 *0.67 *0.46 *
n0.63 *0.230.400.65 *0.66 *0.39
H′0.63 *0.120.410.59 *0.57 *0.45 *
* p = 0.05, ** explanation of symbols: N-species richness, n-species abundance, H’-Shannon’s diversity index.
Table 12. Sustainability score for working conditions theme and its indicators for organic and conventional farms (median, min-max); p-value of Mann–Whitney U test.
Theme and IndicatorsOrganicConventionalp-Value
7. Working conditions66 (53–77)69 (55–77)0.853
  7.1. Personnel management83 (56–89)80 (67–89)0.684
  7.2. Working hours50 (13–79)59 (38–83)0.353
  7.3. Safety at work80 (75–100)80 (62–92)0.529
  7.4. Wage and income levels53 (13–75)50 (19–72)1.000
Colours indicate: Green—good performance, orange—medium performance.
Table 13. Sustainability score for quality of life theme and its indicators for organic and conventional farms (median, min-max); p-value of Mann–Whitney U test.
Theme and IndicatorsOrganicConventionalp-Value
8. Quality of life67 (54–84)73 (31–85)0.481
  8.1. Occupation & training75 (50–92)83 (25–100)0.315
  8.2. Financial situation57 (38–100)63 (13–100)0.684
  8.3. Social relations88 (63–100)82 (63–100)0.796
  8.4. Personal freedom & values58 (25–75)50 (0–83)0.796
  8.5. Health69 (38–88)69 (25–88)0.853
Colours indicate: Green—good performance, orange—medium performance.
Table 14. Sustainability score for economic viability theme and its indicators for organic and conventional farms (median, min-max); p-value of Mann–Whitney U test.
Theme and IndicatorsOrganicConventionalp-Value
9. Economic viability64 (40–100)79 (34–99)0.481
  9.1. Liquidity50 (0–100)63 (25–100)0.912
  9.2. Profitability88 (50–100)94 (38–100)0.579
  9.3. Stability66 (44–100)72 (25–100)0.631
  9.4. Indebtedness79 (0–100)96 (33–100)0.315
  9.5. Livelihood security69 (38–100)75 (38–100)0.481
Colours indicate: Green—good performance, orange—medium performance.
Table 15. Sustainability score for farm management theme and its indicators for organic and conventional farms (median, min-max); p-value of Mann–Whitney U test.
Theme and IndicatorsOrganicConventionalp-Value
10. Farm management83 (58–97)86 (58–94)0.631
  10.1. Business goals, strategy, implementation82 (65–100)86 (54–92)0.739
  10.2. Availability of information77 (43–89)76 (33–85)0.796
  10.3. Risk management100 (50–100)100 (11–100)0.315
  10.4. Resilient relationships75 (63–100) *100 (92–100) *<0.001
Colours indicate: Green—good performance. * Significant differences between organic and conventional farms at p = 0.05.
Table 16. Recommendations to improve the sustainability of farms.
IndicatorOrganic FarmsConventional FarmsExamples from Literature
1. Soil use
  • Improve soil pH by liming, use of compost, and use of less acidifying fertilisers.
  • Adopt a more diverse crop rotation (lower share of cereals, more legumes, and other break crops).
  • In situations of a lack of manure, use more green manures. Grow more legumes as main crop and intercrop to increase nitrogen fixation and prevent soil erosion.
  • Incorporate straw into the soil to improve soil organic matter balance.
[48,49]
2. Animal husbandry
  • Different problems in small and large farms; thus, there is a need for individual advice.
  • Adapt regulation considering animal welfare.
  • Dairy cows mainly tied: check possibilities for moving free and for pasturing.
[49]
3. Material use & environmental protection
  • Improve weed management (harrow more often).
  • More N fixation plants to improve the N balance in the case of deficiency.
  • Use more organic fertilizers to improve the nutrient balance.
  • Use herbicides more targeted to species composition, take into account resistance problems.
  • Use fewer toxic plant protection products.
  • Respect buffer zones along creeks, hedgerows, forest edges, etc.
[50,51,52,53,54,55]
4.
Improve crop rotation: more legumes and other dicots. Use cover crops, intercrops (e.g., Phacelia), mixtures of crops, lupines, etc. Avoid maize on nutrient-poor soils with bad water supply during summer.
5.
Use certified seeds.
4. Water use
  • Adopt more conscious water management to save water.
[56]
5. Energy & Climate
  • Small farms should check for opportunities for cooperate with other farms especially on using machinery.
  • Check possibilities for solar panels and solar water heating. Subsidies for prosumers are available.
[57]
6. Biodiversity
  • Spread knowledge on ecological infrastructures and their linkage.
  • Train conventional farmers on the importance of biodiversity maintenance in agroecosystems.
[43,58,59]
2.
Tap the potential of local breeds and varieties.
3.
Farmers should have a certain share of ecologically valuable zones (area of ecological compensation). Most important for farms located in Natura 2000 areas.
4.
Proper agricultural practices on meadows and grasslands.
[43]
7. Working conditions
  • Mechanize livestock production, e.g., cleaning stables, total mixed ration vehicle, milking parlour, to reduce working hours and improve working conditions.
[60]
8. Quality of life
  • More free time is needed (overwork).
  • Where highly toxic chemicals are used, check with advisory services about how to replace them with less toxic ones or how to reduce dosage.
[41]
2.
Different problems in small and large farms, so individual advice is needed.
9. Economic viability
  • Higher potential for growth in market for organic farming than for conventional.
  • Different problems in small and large farms, so need individual advice.
[61]
2.
Ability to invest and maintain the farm is limited at many farms. Bulk risk is individual. Dairy farmers have higher bulk risks but have many buyers although at low prices. Vegetable farms usually have many buyers. Products of high quality always find buyers (special products).
3.
Farmers should be aware of risk of overinvestment.
10. Farm management
5.
Create platforms for improve organic market.
  • Try to create cooperatives for cereals. Working with the cooperative could be an efficient way for dissemination of information.
[62]
2.
Work with model farms. There is a need for good examples of real-life farms.
3.
Subsidies or loans for innovative projects.
4.
Increase farmers’ awareness concerning environmental effects of pesticides.
5.
Farmers need assistance in developing clear visions and strategies of farm developing in the future—the role of agricultural advisory services.
6.
Help older farmers get access to information.
7.
Check possibility to link benefits of biodiversity to product label for these farms.
[63]

