Dynamic Economic Analysis of Subsidies for New and Renewable Energy in South Korea

1
Department of Energy Systems Engineering, Seoul National University, 1 Gwanak-ro, Gwanak-gu, Seoul 08826, Korea
2
New and Renewable Energy Research Division, Korea Energy Economics Institute, 405-11 Jongga-ro, Jung-gu, Ulsan 44543, Korea
*
Author to whom correspondence should be addressed.
Sustainability 2018, 10(6), 1832; https://doi.org/10.3390/su10061832
Submission received: 18 April 2018
/
Revised: 23 May 2018
/
Accepted: 28 May 2018
/
Published: 1 June 2018
(This article belongs to the Special Issue Sustainable Energy Policy and Policy Implications—Good Examples and Critical Reflections)
Abstract
:Many countries are increasing the supply of new and renewable energy to reduce greenhouse gas emissions and promote energy security. Subsidies for new and renewable energy are considered a useful means to increase supply, although a close assessment is needed of whether the subsidies improve the economic feasibility of new and renewable energy. Thus, this study conducted an economic analysis on South Korea’s housing support program for new and renewable energy sources from the perspectives of the government and consumers. The results showed that, in 2014, the use of solar photovoltaics (PV) led to constant improvements in economic feasibility, which benefited both the government and consumers, but fuel cell failed to do so from both perspectives. Solar thermal and geothermal heat showed improved economic feasibility throughout the program for consumers. In particular, solar PV reported high economic feasibility in 2014 and 2015 for consumers, indicating that a significant subsidy amount was provided for solar PV facilities. This also confirmed the possibility of achieving economic feasibility for other energy sources within a limited budget by distributing subsidies across the various sources.
1. Introduction
With the globally emerging issue of climate change, many countries are striving to reduce greenhouse gas emissions. As a result, new and renewable energy is receiving attention as an alternative to traditional fossil fuels, which has high carbon emission levels. In addition to environmental benefits, new and renewable energy has gained much popularity in terms of energy security. However, despite its advantages, there is a lack of economic incentives for consumers to voluntarily use this energy since the installation of related facilities generally entails high initial costs. Accordingly, as Meier et al. [1] said, the governments of various countries are striving to promote the supply of new and renewable energy by adopting policy measures such as economic incentives for consumers or the imposition of quotas.
In South Korea, particularly, it is essential to expand the supply of new and renewable energy to achieve the goal of environmental and energy security. In 2014, fossil fuels (i.e., coal, oil and natural gas) accounted 83.9% of primary energy in South Korea [2] and it is forecasted that, from 2012 to 2040, carbon dioxide (CO2) emissions will continue to increase by 1% annually, which is about three times the CO2 emissions predicted for OECD countries (0.3%) [3]. Moreover, the overseas dependence of primary energy in South Korea is 95.2% [2]. To tackle the global issue of climate change and promote national energy security by supplying new and renewable energy, South Korea is currently implementing various policies and systems such as providing subsidies under the Act on the Promotion of the Development, Use and Diffusion of New and Renewable Energy or making it mandatory to supply a part of generated amount using new and renewable energy.
However, the efforts to supply new and renewable energy in South Korea remain unsuccessful. According to EIA [3], in 2012, the share of renewable energy in South Korea was 2.2% of the total generated amount, which is remarkably lower than that of other OECD countries, including the United States (12.8%), Europe (29.5%), and Japan (16.4%). Moreover, South Korea’s ratio of renewable energy in the same year based on primary energy was 1.5%, which is lower than that for OECD countries (9.4%) [4] (According to the Korea New and Renewable Energy Center [5], in 2015, new and renewable energy accounted for 4.54% of primary energy, which exceeded 4.2%, the goal for new and renewable energy supply; however, this ratio also includes large-scale hydropower and industrial wastes.). Thus, South Korea’s policy to supply new and renewable energy must be closely analyzed in terms of performance and, accordingly, the direction of these policies must be reconsidered.
Therefore, this study evaluated the economic performance of South Korea’s housing support program for new and renewable energy (Figure 1). The housing support program is a policy measure to supply new and renewable energy to homes, and, thus, the government subsidizes a part of the installation costs for related facilities. As pointed out by Srinivasan [6], government policies are a precondition for consumers to opt for new and renewable energy, and, thus, it is necessary to examine whether economic incentives exist for each household to install new and renewable energy facilities under the housing support program. Moreover, it is necessary to analyze performance in comparison to cost from the government’s perspective. The contributions of this study are as follows. First, a comparative analysis of changes in economic feasibility of new and renewable energy was conducted by focusing on solar PV (photovoltaic) in power generation, fuel cells, and solar thermal and geothermal heat under South Korea’s housing support program. Second, the effects of dynamic subsidies were analyzed by observing changes in economic feasibility by year and for each new and renewable energy source. Third, the economic feasibility resulting from the program from both the consumer and government perspective was examined. To the best of our knowledge, no study has been conducted on the South Korean market and the findings of this study may have implications for the generation of new and renewable energy in other countries as well.
This remainder of this study is organized as follows. Section 2 reviews existing economic analyses of new and renewable energy policies and highlights how the present study differs from them. Section 3 briefly introduces the South Korean housing support program and Section 4 explains the method and perspective of the economic analysis. Section 5 presents the data used in the analysis and discusses the results. Section 6 provides a summary, policy implications, and conclusions.
2. Literature Review
As new and renewable energy is receiving attention, many engineering studies, such as those by Duong et al. [7] and Lei et al. [8] for wind power and Chow [9] and Eltawil and Zhao [10] for solar PV systems, have been conducted to increase reliability of facilities or systems. Along with the questions on their technology, most academic and industrial circles have questioned whether using new and renewable energy has sufficient financial benefits, given the high initial costs involved in new and renewable energy. Accordingly, studies have been conducted on the benefits and costs of new and renewable energy systems using their data. Battocletti and Glassley [11] quantified the benefits and costs of geothermal heat pumps in the United States and Sharma [12] calculated the costs of hydroelectric power generation. Studies have also presented economic analyses that widely vary by energy source (e.g., see O’mahoney et al. [13] and Lantz et al. [14] for bioenergy, Pelsoci [15] and Bergmann and Hanley [16] for wind power, O’connor et al. [17] for solar PV, and Gallaher et al. [18] for geothermal heat).
However, the aforementioned studies analyze the technical economic feasibility of new and renewable energy systems and ignore specific policy conditions. Many studies have suggested the implementation of policies to increase the supply of new and renewable energy. Whether related policies provide sufficient economic incentives for program participants is key to their performance, and, thus, an economic analysis that accounts for specific policies is needed. Some studies have been conducted on the economic feasibility of programs implemented under specific policies for new and renewable energy supply in each country, which are discussed as follows.
Abu-Bakar et al. [19] conducted an economic analysis of solar thermal systems under the renewable heat incentive (RHI) in England. They divided solar thermal systems into those for housing and non-housing and each analysis was performed according to the size of solar thermal systems and amount of solar radiation. The results showed that, while solar thermal systems for non-housing benefit in all cases under the RHI policy, householders with gas heating had no economic incentive to install such systems given the annual solar radiation of 800 kWh/m2.
Dusonchet and Telaretti [20,21] conducted an economic analysis of solar PV generation under the feed-in-tariff (FIT) or tradable green certificates (TGC) in 14 western European Union (EU) countries and nine eastern EU countries. The results showed that, of the 14 western EU countries, Italy, Greece, and France had the most profitable support strategies and, among the nine eastern EU countries, Czech Republic, Bulgaria, and Slovakia achieved high economic feasibility, although their payback period was longer than those of Italy, Greece, and France.
In line with Dusonchet and Telaretti [20,21], Dusonchet and Telaretti [22] conducted an economic analysis of solar PV generation to examine the economic feasibility of building integrated photovoltaic (BIPV) systems and ground-mounted photovoltaic plants in France, Germany, Greece, Italy, and England. The results showed that ground-mounted photovoltaic plants had lower economic feasibility than the BIPV systems.
Lin et al. [23] examined solar heat hot-water supply systems in Taiwan households. Taiwan has increased its supply of solar heat facilities through government subsidies for installation costs. Given that economic feasibility may vary by installation condition, they analyzed the payback period of the solar heat hot-water supply system based on substituted fuels, price of solar heat hot-water supply systems, and daily load volume. They found that solar heat systems in Taiwan households had the shortest payback period when replaced by electric power, followed by liquefied petroleum gas (LPG) and liquefied natural gas (LNG).
Kaldellis et al. [24] focused on the sluggish behavior of the Greek local solar collectors’ market during the last 10 years and conducted an economic analysis on the Greek solar water heating system. The analysis shows that, in northern, central and southern parts of Greece, without subsidies, the solar water heating system is not economically feasible despite an abundant supply of solar energy. The subsidies, which had been terminated at the time of the analysis, for them, were found to make the solar water heating systems economically feasible.
Campoccia et al. [25] compared the economic feasibilities of solar PV and wind power generation under different support policies to expand the renewable energy generation system in France, Germany, Italy, and Spain. It was found that Italy has the most profitable FIT strategy for small and medium PV systems. In the case of wind power, Italy’s green tags system is most profitable for 20 MW on-shore wind farm and 50 MW off-shore wind farm.
Papadopoulos and Karteris [26] analyzed the economic feasibilities of solar PV generation under the FIT scheme introduced in 2006. In their study, it was found that investors had higher profits in large-scale PV applications than in small-residential PV applications. On the other hand, the net social benefits of the FIT were calculated as negative values, which are socially expensive, and they argued that an efficient redesign of the FIT’s terms should be considered.
The above-mentioned studies certainly contribute to the literature: they analyze the economic feasibility of new and renewable energy supply policies and establish a direction and standards for future ones; however, these studies are limited to one or two sources of new and renewable energy. The RHI policy in England or FIT policy in multiple countries is not restricted to certain new and renewable energy sources but simultaneously assists multiple energy sources. For example, the RHI program provides support for solar heat as well as air source heat pumps, biomass, and ground source heat pumps [27]. The FIT includes renewable energy sources for power generation in addition to solar PV and wind power. Thus, policies for multiple sources of new and renewable energy can be fully assessed only after examining each energy source.
In addition, these studies “predict” static economic feasibility under specific conditions but do not analyze the dynamic “performance” of actual policies from an economic perspective. Predicting economic feasibility under various conditions is necessary to design policies and programs; however, when policies are already being implemented, a post-evaluation or re-review is important to determine their performance. By doing so, dynamic changes in performance can be caught, and implications for revision and supplementation of a target policy can be drawn.
In light of these limitations, this study analyzed South Korea’s housing support program for new and renewable energy supply by source (i.e., solar PV, fuel cells and solar thermal and geothermal heat) and assessed dynamic changes in economic feasibility by year using the program’s performance data.
3. Housing Support Program in South Korea
The One Million Green Homes Program aims to increase the supply of new and renewable energy, in which the government subsidizes a part of the installation costs for related facilities in conventional houses and apartment buildings. The program has been implemented under Article 27 (Distribution Projects) of the Act on the Promotion of the Development, Use and Diffusion of New and Renewable Energy. The housing support program originates from the 100,000 solar-roof deployment program, which was implemented in 2004 and focused on solar PV. In 2009, this program was reformed to the One Million Green Homes Program to supply new and renewable energy to homes based on regional and housing characteristics.
The housing support program aims to supply new and renewable energy such as solar PV, solar thermal, geothermal heat, and fuel cells to one million out of the total 12.5 million households as of 2005 in phases by 2020. As mentioned, the implementation is contingent on regional and housing characteristics such as the amount of solar radiation, wind velocity, and water quantity and has reported national as well as industrial ripple effects and the creation of jobs [28]. According to the Korea Energy Agency [28], the supply of new and renewable energy will be 1.558 million TOE (Tonne of Oil Equivalent) by 2020 as a result of the program, thereby accounting for 9.4% of total generated new and renewable energy.
Table 1 shows the cumulative performance of the housing support program as of the end of 2015 and the ratio of subsidies in 2012. Approximately 220,000 houses participated in the program, which falls short of the target of 277,000 for 2015. In 2004, there were 100,000 solar PV houses, suggesting that, in terms of number of houses, solar PV was most widely supplied, following solar thermal and geothermal heat. The ratio of subsidy as of 2012 was the lowest for solar PV (maximum 40%) and highest for fuel cells (maximum 75%). For solar thermal and geothermal heat, the government sponsors up to 50% of the installation cost [29].
4. Methodologies for Economic Evaluation and Scenarios
4.1. Economic Evaluation
To evaluate the economic feasibility of each new and renewable energy source under the housing support program, this study conducted an economic analysis based on various indicators using methods such as benefit–cost ratio (B-C ratio), net present value (NPV), internal rate of return (IRR), and payback period (PP). The economic analysis aimed to estimate the economic feasibility by comparing and analyzing the costs and benefits in monetary values. As Korea Development Institute [30] indicates, the economic analysis is mainly conducted using the benefit–cost analysis, which has the advantage that the subjectivity of the evaluator is small and the comparison is possible on a uniform measure. Since post evaluation of the program or policy is essential to maintain objectivity, this study conducted a benefit–cost analysis.
4.1.1. Benefit–Cost Ratio
Suppose that benefits accrue and costs are incurred on a cash flow of a certain program, which is the housing support program in this study, during a certain period, such as the economic life of a facility. Benefit–cost ratio (B-C ratio) presents a ratio of the total present benefits over the total present costs and it can be defined as
where Bt is benefit in period t, Ct is cost in period t, i is discount rate, and n is economic life. In Equation (1), the numerator represents the total present value of the benefit, and the denominator represents the total present value of the cost. In other words, the B-C ratio indicates benefits obtained against invested costs. If the calculated B-C ratio is greater than one, the total present value of benefits is greater than that of costs, thereby proving that the relevant project has economic feasibility. On the other hand, if the B-C ratio is smaller than one, the total present value of benefits is smaller than that of costs, thereby indicating that the relevant project has no economic feasibility.
4.1.2. Net Present Value
Net present value (NPV) is a measure of pure benefits incurred in the cash flow of the project excluding costs. NPV is obtained by subtracting the sum of the present value of costs from that of benefits by discounting the present and future cash flows:
The first term on the right had side of Equation (2) represents the present value of the total benefit, which is the numerator of the B-C ratio, and the second term represents the present value of the total cost, which is the denominator of the B-C ratio. Thus, if NPV is positive, the relevant project has economic feasibility, but, if it is negative, the project has greater costs than benefits, thereby showing no economic feasibility.
4.1.3. Internal Rate of Return
Internal rate of return (IRR) is a measure of the rate of return based on the costs that are incurred in the project and benefits (returns) that accrue from the project. Based on this meaning, IRR can be understood as a discount rate that makes the sum of benefits equal to that of costs incurred in the project, and thereby IRR can be obtained by calculating the discount rate in which NPV is 0:
IRR measures the economic feasibility by comparing it with the discount rate used in the analysis. If IRR is greater than the discount rate, the relevant project is considered to be economically feasible, in which case, NPV has a positive value. On the other hand, the relevant project is not economically feasible if IRR is smaller than the discount rate, in which case, NPV has a negative value.
4.1.4. Payback Period
Payback period (PP) is a measure that is mainly applied to projects that require a large initial investment cost as, in this analysis, and that are continuously benefited in the future. PP indicates the minimum period required to recover the investment cost and can be calculated as follows:
Thus, if PP is smaller than n, the economic life of facilities, the invested costs can be paid back within the economic lifespan, and, thus, the project is economically feasible. On the other hand, if invested costs cannot be paid back within the economic life of facilities, the project is not economically feasible.
4.2. Perspective of Economic Evaluation
To evaluate a program economically, it is necessary to first set a perspective. As Thuesen and Fabrycky [31] pointed out, it is important to analyze a program from a proper point of view that takes into account all the important consequences of the project. This study examined the economic feasibility of the housing support program from two perspectives: a government that implements a policy and the consumer who benefits from the program. Undoubtedly, the government must consider the cost-efficient aspects of the housing support program when implementing policies. However, since the government subsidizes only a certain amount of the installation costs for the new and renewable energy facilities, the remaining costs must be incurred by consumers. Therefore, houses are more likely to participate if the economic feasibility is sufficient, thereby achieving the goal of increasing the supply of new and renewable energy. This emphasizes the need for an economic evaluation from a consumer perspective.
4.2.1. Cost and Benefit: Government Perspective
From a government perspective, the costs incurred to implement a housing support program include those to install new and renewable energy facilities in each house and, thus, can be represented by the sum of the government’s installation subsidy and installation costs incurred by consumers (Table 2). As mentioned, under the housing support program, the government subsidizes a part of the costs of installing new and renewable energy facilities, and, thus, the sum of the government subsidy and costs incurred by consumers can be considered the total installation costs for new and renewable energy facilities.
The government can obtain three benefits through these costs: energy production, greenhouse gas reduction, and air pollution reduction (Table 2). The benefit of energy production is relevant to the “energy goal”, which is among the objectives of renewable energy policies summarized by Komor and Bazilian [32], and as per the replacement cost approach, the fuel cost of replaced energy sources is assumed to be a benefit. By installing facilities for solar PV and fuel cells, power generation from existing facilities (e.g., coal-fired thermal power generation and LNG combined cycle generation) can be reduced to the amount generated by new and renewable energy facilities. This study assumed that new and renewable energy facilities for power generation replace the amount of power generated from LNG combined cycles, which are responsible for middle and peak loads in South Korea [33]. Therefore, for power generation using new and renewable energy, the fuel cost of the LNG combined cycle is calculated as the energy production benefit (Equation (5)). In Equation (5), 860 is a conversion factor from kilowatt-hours to kilocalories of generation of electricity and the auxiliary power ratio means the ratio of consumed electricity in the power plant over the electricity generated (i.e., internal consumption rate). Thus, in Equation (5), 860 divided by 1-auxiliary power ratio, thermal efficiency, and heating value represents the amounts of the source (kg) to generate 1 kWh of electricity. On the other hand, the use of solar thermal and geothermal heat is assumed to replace the heat production of individual heating systems in each home. City gas boilers are generally used as individual heating systems in South Korean homes [34], and, thus, the fuel cost of gas for households is calculated as the energy production benefit (Equation (6)).
From the viewpoint of the government, greenhouse gas and air pollution reduction benefits are relevant to the “environmental goal”, which is among the goals of renewable energy policies summarized by Komor and Bazilian [32]. The greenhouse gas reduction benefit is gained through the reduction of CO2 from existing energy sources by using new and renewable energy. This can be calculated by multiplying the price of South Korea’s certified emission reductions by the amount of CO2 generated from the use of fossil fuels to produce the same amount of energy as new and renewable energy (Equation (7)). As mentioned, CO2 emissions of the LNG combined cycle generation are calculated in the case of power generation using new and renewable energy and those of city gas boilers are estimated in the case of new and renewable energy using heat.
The benefit of reduced air pollution is considered an economic benefit from reduced CO2. Reduced greenhouse gas also decreases other pollutants and causes an additional economic effect, also known as the co-benefit effect [35]. The co-benefit effect is the economic benefit derived from reducing 1 ton of CO2. Therefore, the monetary value of reduced air pollution can be estimated by calculating CO2 generated when using fossil fuels instead of new and renewable energy and multiplying it by the co-benefit coefficient (Equation (8)).
4.2.2. Cost and Benefit: Consumer Perspective
For consumers, the costs incurred to participate in the housing support program include those for installing new and renewable energy facilities. Consumers incur all costs excluding those subsidized by the government (Table 2). In addition to installation costs, consumers are required to pay fuel costs for certain new and renewable energy facilities, which are generally for fuel cells. In South Korea, fuel cells using hydrogen obtained by reforming LNG are targeted for supply [36], and, thus, must be considered additionally.
Energy saving, that is, reduced consumption of electric energy and heat, through new and renewable energy facilities can be considered a consumer’s benefit (Table 2). Solar thermal and geothermal heat is assumed to reduce the use of city gas boilers, thus allowing households to benefit by reducing their gas consumption. Here, energy saving benefits can be calculated by multiplying new and renewable energy heat production by consumers’ gas price.
Solar PV and fuel cells can also contribute to saving electricity; however, since South Korea adopts a progressive stage system for power rates, the benefits cannot be calculated by multiplying new and renewable energy generation and electric power price for housing. In the case of new and renewable energy for power generation, the monthly average power consumption of households is assumed to be 400 kWh and the difference in power rates before and after installing each energy (i.e., solar PV and fuel cells) facility denotes the energy saving benefit. The installed capacity of solar PV and fuel cells in each house is obtained by dividing the total supply capacity by the total number of supplied houses based on cumulative performance as of late 2015, which are 3 kW and 1 k. For consumers, reduced greenhouse gas and air pollution does not have direct benefits and, thus, are not included in the economic analysis. Table 2 summarizes the costs and benefits for the government and consumers.
4.3. Economic Evaluation and Analysis System
The housing support program was implemented in 2004 and since then has supported various new and renewable energy facilities every year. Thus, a discussion on how an economic evaluation should be performed in this context is necessary. This study estimated the benefits and costs of new and renewable energy by treating the programs for each year and energy source as independent programs. For example, if the housing support program is implemented for new and renewable energy sources every year, economic evaluation was performed for independent programs. In other words, the lifecycle of each new and renewable energy facility installed throughout the housing support program is assumed to be an individual program and its economic feasibility is evaluated accordingly. Although each program is conducted under the government’s housing support program, the market situation might change over time and the performance of the support program may vary by year and learning effect of the government and program management authorities. This suggests that even programs implemented in the same year may show varying performance in terms of new and renewable energy owing to the difference in subsidies and facilities. Thus, energy source should be individually evaluated to improve future policies.
5. Empirical Analysis
5.1. Data
To perform an economic evaluation of South Korea’s housing support programs, this study used the 2015 quarterly program statistics by Korea Energy Agency’s New and Renewable Energy Center [29]. The New and Renewable Energy Center is a supervising agency of the housing support program in South Korea. Since the New and Renewable Energy Center supervises the entire process from receiving application forms of each household to checking the capacity installed and subsidizing the installation costs, the program statistics of the Center are reliable and contain detailed data. The data summarized the annual performance, such as the number of supplied houses, the amount of supply, the energy output (TOE), and subsidies for solar PV, fuel cells, solar thermal, and geothermal heat (see Section 3 and Table 1). As mentioned, new and renewable energy (i.e., solar PV and fuel cells) for power generation is obtained by directly calculating annual generation (kWh) and applying the capacity factor to supply (kW). For new and renewable energy (i.e., solar thermal and geothermal heat), energy output (TOE) is calculated using the energy conversion factor reflecting the capacity factor.
The annual government subsidy for the installation of each new and renewable energy facility is reported by the Korea Energy Agency’s New and Renewable Energy Center [29]. Private shares are calculated using the standard unit installation costs for each energy source (Equation (9)) according to a public announcement regarding the housing support program. As we could not obtain the standard unit installation cost for solar PV in 2004, it is extrapolated from the data for the period from 2005 to 2015. Similarly, the standard unit installation cost of fuel cells in 2010 and 2011 is extrapolated from the data for the period from 2012 to 2015.
To calculate government and consumer benefits from South Korea’s housing support program, this study used various types of data under certain assumptions. Table 3 summarizes the data and sources. The assumptions and data used in this study are as follows.
For energy output, this study applied the capacity factor (solar PV: 14.93%, fuel cells: 74.56%) and energy conversion factor (solar thermal: 0.0679 toe/m2, geothermal heat: 0.207 toe/RT (heating), 0.122 toe/RT (cooling)) used in statistical conversions by the Korea New and Renewable Energy Center [29]. For the economic lifecycle of new and renewable energy facilities, data are from the Ministry of Economy, Trade and Industry, Japan [37]; Korea Institute of Energy Research [38]; and Intergovernmental Panel on Climate Change (IPCC) [39], all of which are consistent for a period of 20 years. For efficiency of LNG combined cycle generation and auxiliary power ratio, this study applied the annual efficiency and internal consumption rate data by the Korea Power Exchange [40] and assumed that the efficiency (48.24%) and internal consumption rate (3.03%) as of 2014 have been consistently maintained since 2015.
The efficiency of city gas boiler was consistent at 80% based on the minimum consumption efficiency of home gas boilers according to the Regulation on Energy Efficiency Labeling and Standards of Korea’s Ministry of Trade, Industry and Energy (MOTIE) [41] and the internal consumption rate is 0%. For power rates, the rate of each section of housing by the Korea Electric Power Cooperation [42] is applied and it was assumed to be consistent throughout all years. For city gas price, this study applied the annual average consumer price for city gas, data for which were taken from the Korea Energy Economics Institute [43], and assumed that its increase is consistent with that of LNG fuel costs (1.88%), that is, from 947 KRW/m3 since 2014.
For the CO2 emission factor, this study adopted the emission factor by the Korea Energy Agency [44] (power 0.45 tCO2/MWh). City gas boiler (2.43 tCO2/1000 m3) was calculated based on the LNG carbon coefficient (0.637 tC/TOE). For carbon price, the annual average price of CERs in 2015 (10,506 won/tCO2) in the Korea Exchange Emissions Market was used and it was assumed to remain consistent during the analysis period. As for co-benefit, the average of developed countries, US $44/tCO2 (as of 2008), calculated by Nemet et al. [35] was used. This was converted to Korean won using the 2008 annual average won–dollar exchange rate (1102.59 won = 1 USD) published by the Bank of Korea [45] and co-benefit was assumed to increase by 2.74% of the annual increase in consumer price.
For LNG fuel cost, the annual LNG fuel cost was adopted from the Korea Power Exchange [40] and assumed that it rises equally to the rate of increase in LNG fuel cost (680,119 won/ton in 2016). Cost for fuel cells and city gas price were calculated by applying 60%, rate of efficiency for molten carbonate fuel cell (MCFC), and city gas price [28]. Fuel unit cost was estimated using Japan’s LNG introduction price (US $16.2/Mbtu) in 2014 [46], the forecasted introduction price in 2040 (US $26.3/Mbtu), and the annual average rate of increase (1.88%).
5.2. Results and Discussion
Table 4 and Figure 2 present the B-C ratio for the economic analysis results of South Korea’s housing support program for new and renewable energies. Solar PV failed to fulfill economic feasibility from the government perspective, although economic feasibility clearly improved. However, it has fulfilled economic feasibility since 2004, except in 2007 and 2008, from the consumer perspective. The B-C ratio has exceeded one for the government (S1) since 2014, thereby satisfying economic feasibility. In other words, the government had no incentive to support the installation of solar PV facilities, although an economic incentive was finally realized in 2014, thus establishing a balance with the economic incentive for consumers to participate in the housing support program. The B-C ratio from the consumer perspective (S2) in 2015 was relatively high. This can be attributed to the subsidy for installation costs, which compared to benefit obtained by consumers was somewhat high. Therefore, the economic feasibility of various energy sources can be achieved within a limited budget by reducing excessive subsidies for solar PV and distributing them across energy sources in South Korea.
Fuel cells failed to satisfy the economic feasibility for both the government (S1) and consumers (S2) throughout the program. Therefore, there is insufficient economic incentive for consumers to install fuel cell facilities by participating in the housing support program. It is the same result of KEEI [36] that pointed out the lack of economic feasibility of fuel cells. As in the case of PV, fuel cells also showed improved economic feasibility, but failed to accomplish the target. This economic infeasibility is probably due to the cost of fuel cells in South Korea. As it is assumed that fuel cells consume city gas as fuel, Korean consumers have to pay city gas charges to use their fuel cells. Thus, the economic feasibility of fuel cells is exposed to the risk of volatility in city gas prices and LNG prices in South Korea. The housing support program aims to increase the supply of new and renewable energy, and, thus, consumer participation is essential. Therefore, it is important to establish economic incentives for consumers to smoothly participate in the program and increase installation subsidies for fuel cells in South Korea. Solar thermal and geothermal heat also failed to satisfy economic feasibility from a government perspective (S1), except in the case of the 2007 solar thermal support program; however, they satisfied economic feasibility from a consumer perspective (S2) in all years of the program. For the Korean government, encouraging houses to install solar thermal facilities leads to lower benefits compared to cost, but for consumers, there is an economic incentive to install solar thermal facilities, given the continuous government subsidies. The B-C ratio of the solar thermal program from the consumer perspective in 2015 is similar to the case of South Greece as shown in Abu-Bakar et al. [19].
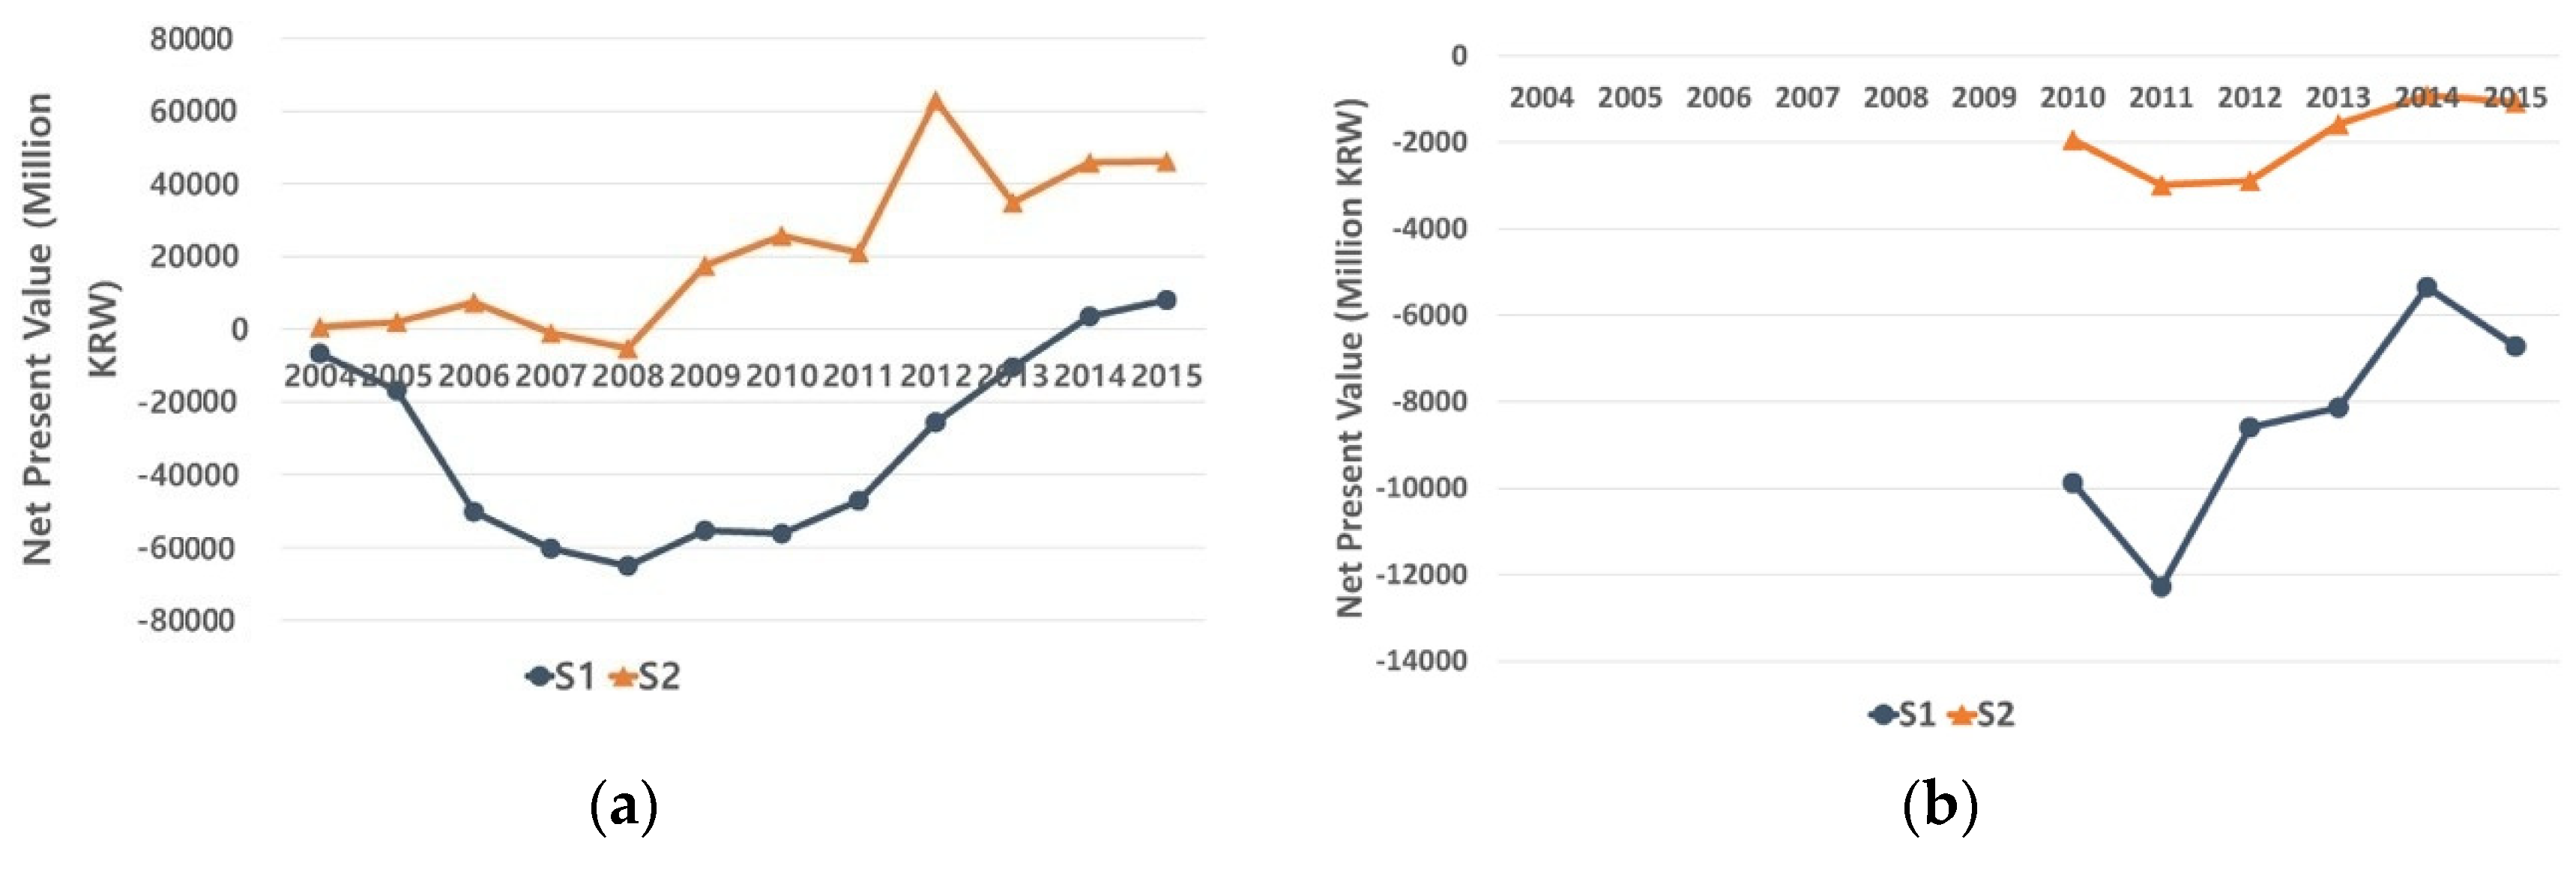
Table 5 and Figure 3 present the NPV for South Korea’s housing support program for new and renewable energy. Similar to the results for the B-C ratio (Table 4), NPV was found to be 0 or higher for economically feasible programs. From the Korean government’s perspective (S1), the NPV of the solar PV program supported in 2008 was the lowest. Since benefits cannot be paid back to the government during the 20 years the facility has been used, a total of 65.1 billion KRW is incurred as net cost. However, the solar PV facilities installed in 2015 are expected to provide a net benefit of approximately 8.1 billion KRW from the government perspective, which is contrary to other new and renewable energy facilities that still generate net costs, such as fuel cell (−6.7 billion KRW), solar thermal (−1.2 billion KRW), and geothermal heat (−12.6 billion KRW).
From a consumer perspective (S2), consumers who participated in the housing support program in 2015 are expected to generate net benefits, except those who have installed fuel cell facilities in South Korea. Based on the total benefits of houses that participated in the program, the net benefit was highest for solar PV (46.1 billion KRW), followed by geothermal heat (12.4 billion KRW) and solar thermal (5.4 billion KRW). However, the number of houses that participated in the housing support program in 2015 was 12,676 for solar PV, 1848 for geothermal heat, and 977 for solar thermal [20] and, thus, the net benefit obtained by each house was highest for geothermal heat (6.7 million KRW), followed by solar thermal (5.6 million KRW) and solar PV (3.6 million KRW). The number of houses that installed fuel cell facilities by participating in the program in 2015 was 316 and the use of the facilities for a period of 20 years is expected to generate a total net cost of 3.4 million KRW.
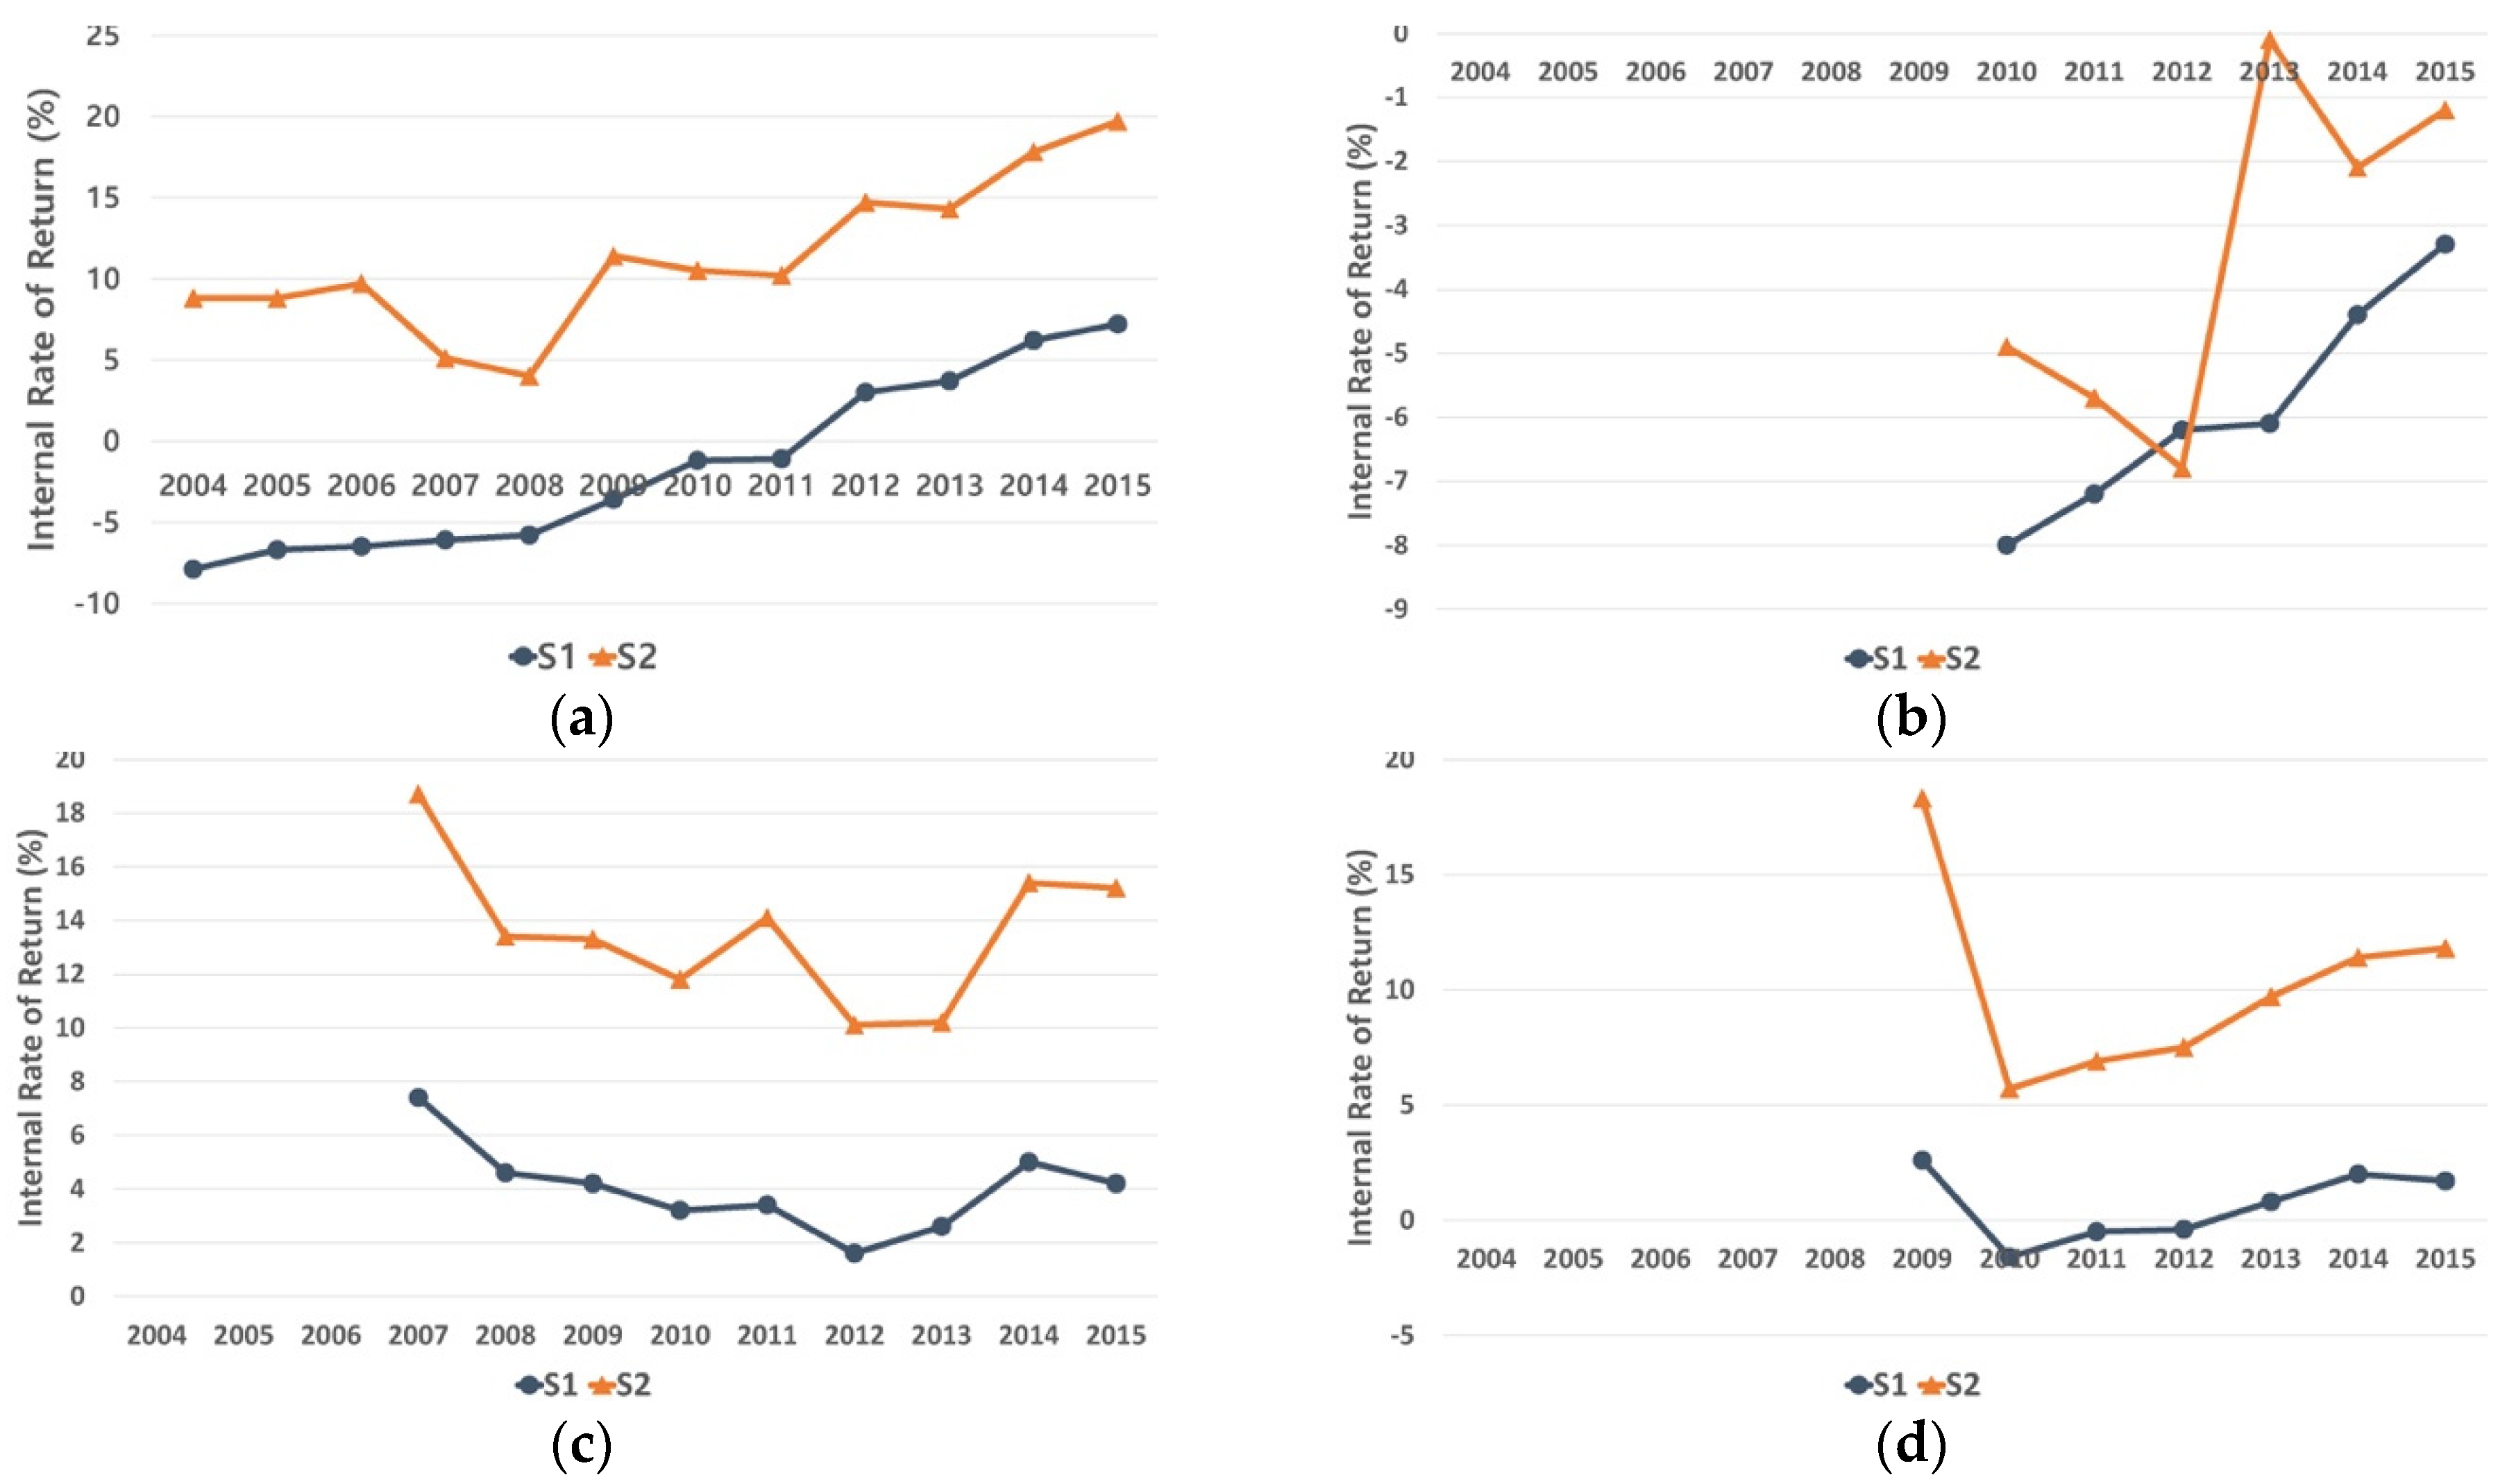
Table 6 and Figure 4 present the IRR for South Korea’s housing support program for new and renewable energy. The social discount rate used in this economic analysis was 5.5%, and, thus, programs that lacked economic feasibility reported an IRR of less than 5.5%, which is theoretically the same as the result for NPV. From the Korean government’s perspective (S1), there is a section of housing in which the IRR is negative for solar PV and fuel cells that are new and renewable energy for power generation and a section where the profitability for operating the program is extremely low. On the other hand, solar thermal and geothermal heat had a positive IRR, except in 2010, 2011 and 2012. From the Korean consumer’s perspective (S2), new and renewable energy facilities that achieved a high rate of return by participating in the program in 2015 were solar PV (19.7%), followed by solar thermal (15.2%) and geothermal heat (11.8%). On the other hand, the IRR for consumers who installed fuel cell facilities in 2015 was −1.2%, which shows a serious lack of profitability.
Table 7 presents the payback period for the housing support program. Most new and renewable energy facilities from the government’s perspective (S1) and some facilities, such as fuel cells, from the consumer’s perspective (S2) were unable to recover costs during the economic lifespan of the facilities in South Korea. Programs that could recover costs from the government perspective (S1) were the solar PV support programs in 2014 and 2015, which satisfied the economic feasibility, and 2007 solar thermal support program, the payback periods of which are expected to be 2033, 2032 and 2024, respectively.
The new and renewable energy facility with the shortest PP for consumers (S2) in 2015 was solar PV (7 years), followed by solar thermal (10 years) and geothermal heat (12 years) in South Korea. As of 2016, no support program has collected costs incurred by each house except the solar thermal support program in 2007. Except for a few solar PV support programs, PP exceeds 10 years, which is more than half the economic lifespan (20 years) in South Korea. This analysis did not consider the performance deterioration of new and renewable energy facilities; it is necessary to constantly check and repair facilities to prevent performance deterioration for each house to effectively collect costs in the long run.
Economic feasibility improved solar PV and fuel cell facilities, because of the unit installation costs for each facility in South Korea. Figure 5 illustrates the changes in unit installation costs by year in South Korea. The new and renewable energy sources that show clear changes are those for power generation such as solar PV (Figure 5a) and fuel cells (Figure 5b), which show a constant decrease in total installation costs per unit capacity and, thus, improved economic feasibility throughout the program. In particular, solar PV, which achieves economic feasibility through the constant decrease of unit installation costs, can serve as a good reference case for fuel cells to achieve economic feasibility.
In contrast, solar thermal (Figure 5c) and geothermal heat (Figure 5d) show no improvement in unit installation costs, whereas solar thermal shows an increase in South Korea. Thus, to improve the economic feasibility of solar thermal and geothermal heat facilities under the housing support program, it is necessary to implement technical support policies to reduce the unit installation costs of these facilities. Furthermore, as mentioned, the case of solar PV can be used as a benchmark.
In addition to a decline in unit installation costs, solar PV is excellent in terms of government subsidy design in South Korea. As shown in Figure 5a, the gap (subsidy) between total installation cost and consumer share is gradually decreasing. The gradual decrease of subsidy indicates that, with solar PV facilities starting to satisfy economic feasibility, the government is gradually reducing the subsidy amount. This is in line with the original purpose of the subsidy and a similar approach must be adopted for other new and renewable energy sources and programs.
6. Summary and Conclusions
This study conducted an economic analysis of South Korea’s housing support program for new and renewable energy supply. The benefit–cost analysis was performed to post-evaluate the program objectively using four measures, namely, the B-C ratio, NPV, IRR and PP, from the perspective of both the government and the consumer. In addition, support programs conducted each year were examined to determine the dynamic characteristics of economic feasibility of each new and renewable energy source. The results show that solar PV achieved economic feasibility for both the Korean government and consumers, in 2014. Fuel cells demonstrated no economic feasibility for the Korean government and consumers, but showed improvements, and, thus, can be considered to have potential. Solar thermal and geothermal heat, which are energy sources that use heat in South Korea, depict no clear tendencies in terms of economic feasibility, but seem to satisfy economic feasibility for consumers across all years.
The following policy implications can be obtained from this study’s findings. First, it is necessary to carefully establish economic incentives for each energy source in new and renewable energy supply programs. As demonstrated in the case of solar PV, there is a relatively high subsidy and economic feasibility can be achieved through many programs by increasing subsidies for other energy sources within a limited budget. Therefore, it is necessary to compare all energy sources to support new and renewable energy supply programs that institutionally have economic incentives and determine whether the ratio of subsidy for each energy source is appropriate.
Second, new and renewable energy policies and programs that are consecutively implemented must also be subject to evaluations for their dynamic performance. The housing support program in South Korea illustrated that, while energy sources show clear improvements in economic feasibility as the program progresses, the same cannot be said for other sources. If a policy does not show performance improvements, it is necessary to closely re-examine it by comparing the dynamic performance of new and renewable energy sources or policies. The new and renewable energy or policy that showed a clear performance improvement can be used as a benchmark.
Third, policy support for the development of renewable energy technologies is needed. To achieve sustainability using various new and renewable technologies, it is necessary to develop technologies that can reduce installation costs or enhance performances of facilities. Future research must consider conducting a more comprehensive policy evaluation by analyzing and comparing other new and renewable energy subsidy programs in South Korea. Since this study only considered the subsidy program in households in Korea, its implications are somewhat limited. By evaluating other subsidy policies in South Korea, it can lend more meaningful conclusions and implications on new and renewable energy subsidy. In addition, researchers should conduct an economic analysis of subsidies for new and renewable energies in households of other countries and make a global comparison. This study only shows the case of South Korea, thereby it could not study its superiority or inferiority when compared to other country’s policies to promote new and renewable energies in households. The global comparison of the household subsidy program on new and renewable energies will make it possible to determine a more cost-efficient policy to expand the supply of subsidies.
Author Contributions
G.C. reviewed the related literature, collected the data, conducted the economic analysis of this study, and wrote Section 2, Section 3, Section 4 and Section 5. C.-Y.L. and E.H. conceived and designed the research and provided research materials. In addition, C.-Y.L. interpreted the results of the economic analysis and wrote Section 1 and Section 6. All three authors provided and discussed the implication of this research.
Acknowledgments
This work was supported by Ministry of Trade, Industry and Energy of Republic of Korea (Grant No. 2016-04-0040-0-000).
Conflicts of Interest
The authors declare no conflict of interest.
Abbreviations
| B-C Ratio | Benefit–Cost Ratio |
| BIPV | Building Integrated Photovoltaic |
| CO2 | Carbon Dioxide |
| EIA | U.S. Energy Information Administration |
| EU | European Union |
| FIT | Feed-in-Tariff |
| IEA | International Energy Agency |
| IPCC | Intergovernmental Panel on Climate Change |
| IRR | Internal Rate of Return |
| KRW | South Korean Won |
| LNG | Liquefied Natural Gas |
| LPG | Liquefied Petroleum Gas |
| METI | Ministry of Economy, Trade and Industry (Japan) |
| MOTIE | Ministry of Trade, Industry and Energy (South Korea) |
| NPV | Net Present Value |
| OECD | The Organisation for Economic Co-operation |
| PP | Payback Period |
| PV | Photovoltaic |
| RHI | Renewable Heat Incentive |
| S1 | Scenario 1—Government’s perspective |
| S2 | Scenario 2—Consumer’s perspective |
| TGC | Tradable Green Certificate |
| TOE | Ton of Oil Equivalent |
References
- Meier, P.; Vagkuasindi, M.; Imran, M. The Design and Sustainability of Renewable Energy Incentives: An Economic Analysis; The World Bank: Washington, DC, USA, 2014; pp. 1–15. [Google Scholar]
- Korea Energy Economics Institute (KEEI). Yearbook of Energy Statistics 2015; KEEI: Ulsan, Korea, 2016; p. 4. [Google Scholar]
- U.S. Energy Information Administration. International Energy Outlook 2016. Available online: https://www.eia.gov/outlooks/ieo/emissions.cfm (accessed on 7 December 2016).
- OECD/IEA. Renewables Information 2016. Available online: http://www.oecd-ilibrary.org/energy/renewables-information-2016_renew-2016-en (accessed on 7 December 2016).
- Korea New and Renewable Energy Center (KNREC). New & Renewable Energy Statistics 2015; Korea Energy Agency: Yongin, Korea, 2016. [Google Scholar]
- Srinivasan, S. Subsidy policy and enlargement of choice. Renew. Sustain. Energy Rev. 2009, 13, 2728–2738. [Google Scholar] [CrossRef]
- Duong, M.Q.; Grimaccia, F.; Leva, S.; Mussetta, M.; Sava, G.; Costinas, S. Performance analysis of grid-connected wind turbines. UPB Sci. Bull. Ser. C Electr. Eng. 2014, 76, 169–180. [Google Scholar]
- Lei, Y.; Mullane, A.; Lightbody, G.; Yacamini, R. Modeling of the wind turbine with a doubly fed induction generator for grid integration studies. IEEE Trans. Energy Convers. 2006, 21, 257–264. [Google Scholar] [CrossRef]
- Chow, T.T. Performance analysis of photovoltaic-thermal collector by explicit dynamic model. Sol. Energy 2003, 75, 143–152. [Google Scholar] [CrossRef]
- Eltawil, M.A.; Zhao, Z. Grid-connected photovoltaic power systems: Technical and potential problems—A review. Renew. Sustain. Energy Rev. 2010, 14, 112–129. [Google Scholar] [CrossRef]
- Battocletti, E.C.; Glassley, W.E. Measuring the Costs and Benefits of Nationwide Geothermal Heat Pump Deployment. Available online: https://www.osti.gov/geothermal/biblio/1186828-measuring-costs-amp-benefits-nationwide-geothermal-heat-deployment (accessed on 7 December 2016).
- Sharma, A. Hydro power vs. thermal power: A comparative cost-benefit analysis. Int. J. Arts Sci. 2010, 3, 125–143. [Google Scholar]
- O’Mahoney, A.; Thorne, F.; Denny, E. A cost-benefit analysis of generating electricity from biomass. Energy Policy 2013, 57, 347–354. [Google Scholar] [CrossRef]
- Lantz, V.A.; Chang, W.Y.; Pharo, C. Benefit-cost analysis of hybrid willow crop production on agricultural land in eastern Canada: Assessing opportunities for on-farm and off-farm bioenergy use. Biomass Bioenergy 2014, 63, 257–267. [Google Scholar] [CrossRef]
- Pelsoci, T.M. Retrospective Benefit-Cost Evaluation of U.S. DOE Wind Energy R&D Program: Impact of Selected Energy Technology Investment. Available online: https://energy.gov/eere/analysis/downloads/retrospective-benefit-cost-evaluation-us-doe-wind-energy-rd-program-impact (accessed on 15 December 2016).
- Bergmann, A.; Hanley, N. The Costs and Benefits of Renewable Energy in Scotland. Available online: http://www.ems.expertgrupp.se/uploads/documents/7-jan-2013/ems_2012_5.pdf (accessed on 15 December 2016).
- O’Connor, A.C.; Loomis, R.J.; Braun, F.M. Retrospective Benefit-Cost Evaluation of DOE Investment in Photovoltaic Energy System. Available online: https://energy.gov/eere/sunshot/downloads/retrospective-benefit-cost-evaluation-doe-investment-photovoltaic-energy (accessed on 15 December 2016).
- Gallaher, M.; Rogozhin, A.; Petrusa, J. Retrospective Benefit-Cost Evaluation of U.S. DOE Geothermal Technologies R&D Program Investments: Impacts of a Cluster of Energy Technologies. Available online: https://energy.gov/eere/geothermal/downloads/retrospective-benefit-cost-evaluation-us-doe-geothermal-technologies-rd (accessed on 17 December 2016).
- Abu-Bakar, S.H.; Muhammad-Sukki, F.; Ramirez-Iniguez, R.; Mallick, T.K.; McLennan, C.; Munir, A.B.; Yasin, S.H.M.; Rahim, R.A. Is renewable heat incentive the future? Renew. Sustain. Energy Rev. 2013, 6, 365–378. [Google Scholar] [CrossRef]
- Dusonchet, L.; Telaretti, E. Economic analysis of different supporting policies for the production of electrical energy by solar photovoltaics in western European Union countries. Energy Policy 2010, 38, 3297–3308. [Google Scholar] [CrossRef]
- Dusonchet, L.; Telaretti, E. Economic analysis of different supporting policies for the production of electrical energy by solar photovoltaics in eastern European Union countries. Energy Policy 2010, 38, 4011–4020. [Google Scholar] [CrossRef]
- Dusonchet, L.; Telaretti, E. Comparative economic analysis of support policies for solar PV in the most representative EU countries. Renew. Sustain. Energy Rev. 2015, 42, 986–998. [Google Scholar] [CrossRef]
- Lin, W.M.; Chang, K.C.; Chung, K.M. Payback period for residential solar water heaters in Taiwan. Renew. Sustain. Energy Rev. 2015, 41, 901–906. [Google Scholar] [CrossRef]
- Kaldellis, J.K.; El-Samani, K.; Koronakis, P. Feasibility analysis of domestic solar water heating systems in Greece. Renew. Energy 2005, 30, 659–682. [Google Scholar] [CrossRef]
- Campocia, A.; Dusonchet, L.; Telaretti, E.; Zizzo, G. Comparative analysis of different supporting measures for the production of electrical energy by solar PV and Wind systems: Four representative European cases. Sol. Energy 2009, 83, 287–297. [Google Scholar] [CrossRef]
- Papadopoulos, A.M.; Karteris, M.M. An assessment of the Greek incentives scheme for photovoltaics. Energy Policy 2009, 37, 1945–1952. [Google Scholar] [CrossRef]
- Office of Gas and Electricity Markets (OFGEM). Introduction to Domestic Renewable Heat Incentive. Available online: https://www.ofgem.gov.uk/publications-and-updates/factsheet-introduction-domestic-rhi (accessed on 15 December 2016).
- Korea Energy Agency. 2014 New & Renewable Energy White Paper; Ministry of Trade, Industry and Energy: Sejong, Korea, 2005; pp. 522–528. [Google Scholar]
- Korea New and Renewable Energy Center (KNREC). Quarterly Business Statistics, December 2015 ed.; Korea Energy Agency: Yongin, Korea, 2016; pp. 11–16. [Google Scholar]
- Korea Development Institute. A Study on General Guidelines for Pre-Feasibility Studies for Public Enterprises and Semi-Governmental Organizations; KDI: Seoul, Korea, 2013; pp. 130–131. [Google Scholar]
- Thuesen, G.J.; Fabrycky, W.J. Engineering Economy, 9th ed.; Prentice Hall: Upper Saddle River, NJ, USA, 2001; p. 356. [Google Scholar]
- Komor, P.; Bazilian, M. Renewable energy policy goals, programs, and technologies. Energy Policy 2005, 33, 1873–1881. [Google Scholar] [CrossRef]
- Cho, J.; Yoon, T.; Kim, Y.K. An Induced Impact Analysis of a LNG Power Plant in Korea. Korean Energy Econ. Rev. 2018, 17, 265–286. [Google Scholar]
- Jeong, J.; Kim, C.S.; Lee, J. Household electricity and gas consumption for heating homes. Energy Policy 2011, 39, 2679–2687. [Google Scholar] [CrossRef]
- Nemet, G.F.; Holloway, T.; Meier, P. Implications of incorporating air-quality co-benefits into climate change policymaking. Environ. Res. Lett. 2010, 5, 14–17. [Google Scholar] [CrossRef]
- Korea Energy Economics Institute (KEEI). Energy and Economical Efficiency of Residential Fuel Cell; KEEI: Uiwang, Korea, 2011; pp. 61–68. [Google Scholar]
- Ministry of Economy, Trade and Industry (METI). Available online: www.meti.go.jp (accessed on 22 September 2016).
- Korea Institute of Energy Research. Analysis of Economic Feasibility of New & Renewable Energies; Korea Institute of Energy Research: Daejeon, Korea, 2007; pp. 155–177. [Google Scholar]
- Intergovernmental Panel on Climate Change (IPCC). IPCC Special Report on Renewable Energy Sources and Climate Change Mitigation; Cambridge University Press: Cambridge, UK; New York, NY, USA, 2011; pp. 1002–1022. [Google Scholar]
- Korea Power Exchange. Available online: www.kpx.or.kr (accessed on 12 December 2016).
- Ministry of Trade, Industry and Energy (MOTIE). Available online: www.motie.go.kr (accessed on 12 December 2016).
- Korea Electric Power Corporation. Available online: www.kepco.co.kr (accessed on 1 December 2016).
- Korea Energy Economics Institute. Available online: www.keei.re.kr (accessed on 15 September 2016).
- Korea Energy Agency. Available online: www.kemco.or.kr (accessed on 22 September 2016).
- Bank of Korea. Available online: www.bok.or.kr (accessed on 16 May 2016).
- International Energy Agency (IEA). World Energy Outlook 2015. Available online: https://www.oecd-ilibrary.org/energy/world-energy-outlook-2015_weo-2015-en (accessed on 7 December 2016).
Figure 1.
A research framework of this study.

Figure 2.
B-C ratio for housing support program: (a) photovoltaic; (b) fuel cell; (c) solar thermal; and (d) geothermal.
Figure 2.
B-C ratio for housing support program: (a) photovoltaic; (b) fuel cell; (c) solar thermal; and (d) geothermal.
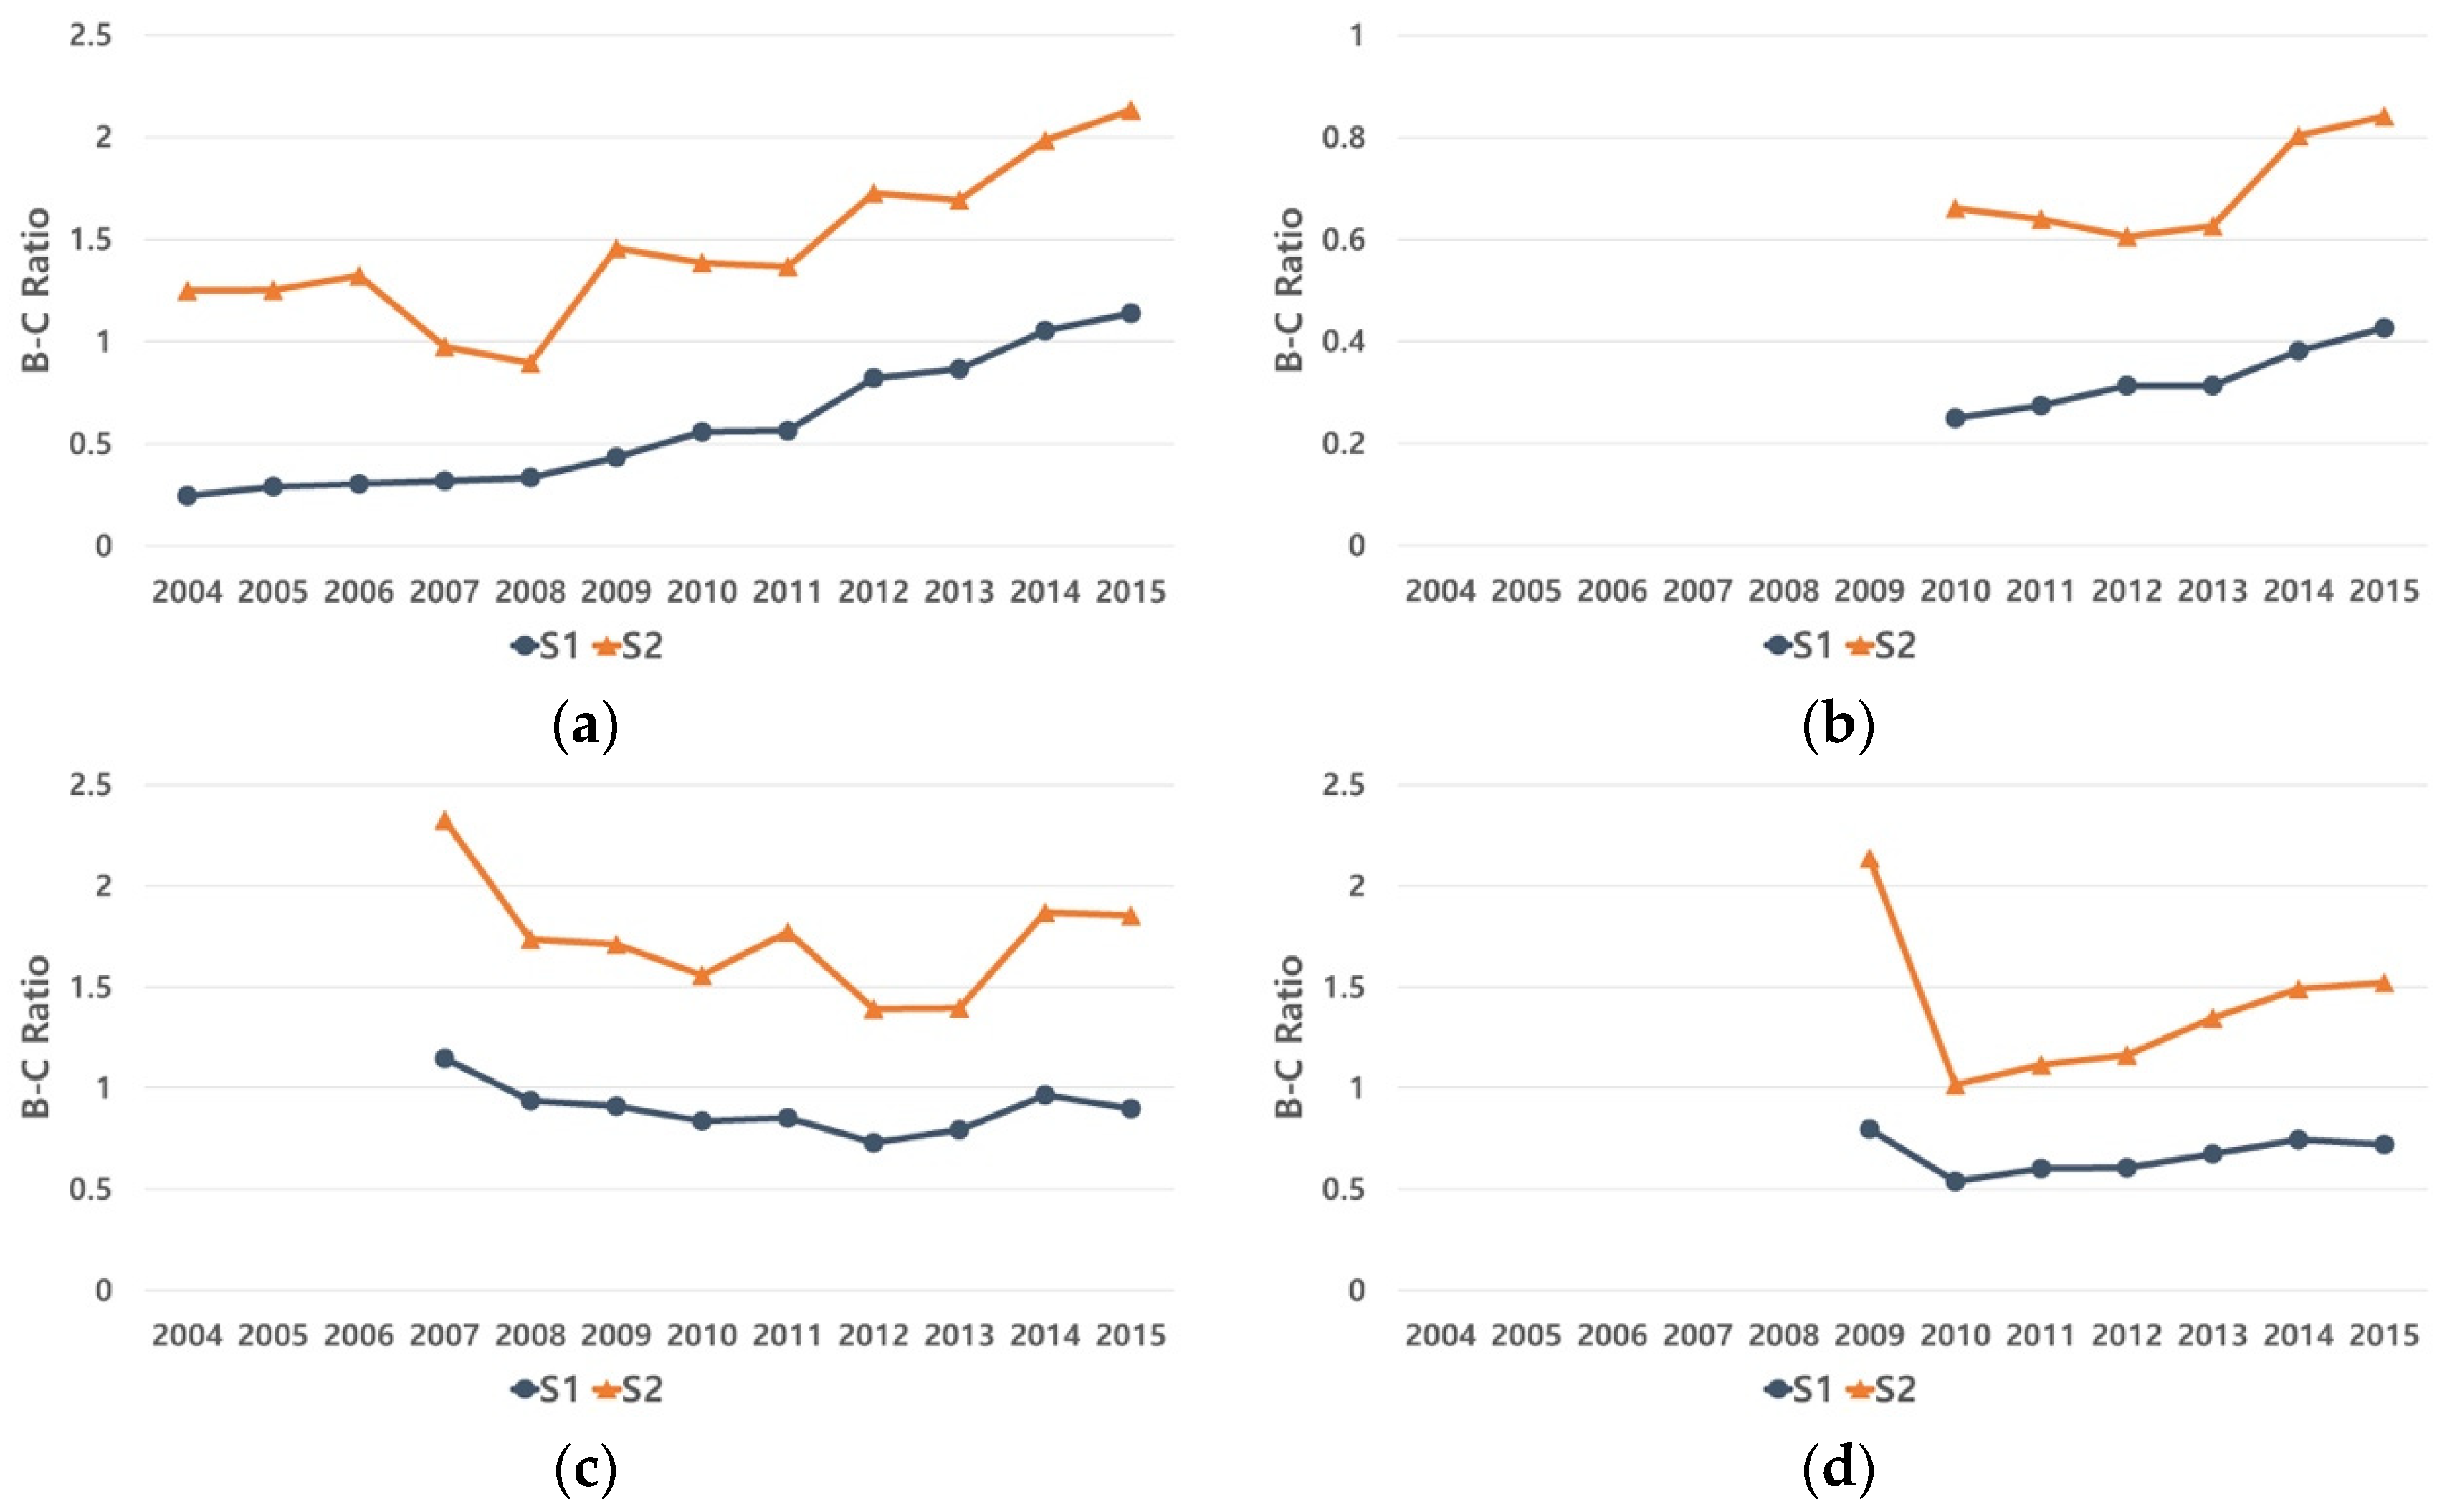
Figure 3.
NPV for housing support program: (a) photovoltaic; (b) fuel cell; (c) solar thermal; and (d) geothermal.
Figure 3.
NPV for housing support program: (a) photovoltaic; (b) fuel cell; (c) solar thermal; and (d) geothermal.


Figure 4.
IRR for housing support program: (a) photovoltaic; (b) fuel cell; (c) solar thermal; and (d) geothermal.
Figure 4.
IRR for housing support program: (a) photovoltaic; (b) fuel cell; (c) solar thermal; and (d) geothermal.

Figure 5.
Installation cost-supply ratio (million KRW): (a) photovoltaic; (b) fuel cell; (c) solar thermal; and (d) geothermal.
Figure 5.
Installation cost-supply ratio (million KRW): (a) photovoltaic; (b) fuel cell; (c) solar thermal; and (d) geothermal.


Table 1.
Cumulative performance 1 of housing support program and subsidy support ratio.
| Solar PV | Solar Thermal | Geothermal Heat | Fuel Cells | |
|---|---|---|---|---|
| No. of houses (household) | 186,580 | 24,296 | 9634 | 2249 |
| Supply (TOE) | 56,653 | 14,586 | 27,636 | 2803 |
| Subsidy (million KRW) | 457,767 | 110,003 | 106,808 | 53,183 |
| Subsidy support ratio (max %) | 40 | 50 | 50 | 75 |
1 Cumulative performance as of 31 December 2015.
Table 2.
Benefit–cost items of the housing support program.
| Scenario | Cost | Benefit |
|---|---|---|
| S1: government | Government subsidy, consumer share | Energy production, greenhouse gas reduction, air pollution reduction |
| S2: consumer | Consumer share | Energy saving |
Table 3.
Data and sources.
| Data | Source | Note |
|---|---|---|
| Capacity factor | Korea New and Renewable Energy Center [29] | solar PV: 14.93% fuel cells: 74.56% |
| Energy conversion factor | Korea New and Renewable Energy Center [29] | solar thermal: 0.0679 toe/m2 geothermal heat: 0.207 toe/RT (heating), 0.122 toe/RT (cooling) |
| Economic life | METI of Japan [37] Korea Institute of Energy Research [38] IPCC [39] | solar PV: 20 years [37] fuel cells: 20 years [37] solar thermal: 20 years [39] geothermal heat: 20 years [39] |
| LNG combined cycle generation efficiency | Korea Power Exchange [41] | Annual LNG combined cycle generation efficiency data Assumed efficiency is consistent at 48.24% since 2015 |
| City gas boiler efficiency | MOTIE of Korea [41] | 80% |
| Auxiliary power ratio | Korea Power Exchange [40] | Annual LNG combined cycle generation and internal consumption rate data Assumed internal consumption rate is consistent at 3.03% since 2015 For city gas boilers, internal consumption rate is assumed to be 0% |
| Electric power price | Korea Electric Power Corporation [42] | Power rates for housing (low pressure) |
| City gas price | Korea Energy Economics Institute [43] | Annual average price for city gas Assumed that it rises equally to the rise of LNG fuel costs, from 947 KRW/m3 in 2014 |
| Emission factor | Korea Energy Agency [44] | power: 0.45 tCO2/MWh For gas boilers, it is directly calculated (2.43 tCO2/1000 m3) using the LNG carbon coefficient (0.637 tC/TOE) |
| Carbon price | Korea Power Exchange [40] | 10,506 won/tCO2 |
| Co-benefit | Nemet et al. [35] | Average of developed countries is US $44/tCO2 (dollar exchange rate as of 2008) |
| Price index | Bank of Korea [45] | Annual average consumer price index data |
| Fuel unit cost | Korea Power Exchange [40] | Annual LNG fuel cost data Assumed that it is increases along with the rate of increase in fuel cost since 2015 |
| Fuel cells cost | Korea Energy Agency [28] | City gas price data Efficiency of fuel cells: 60% (MCFC) |
| Rate of increase for fuel unit cost | IEA [46] | 1.88% |
Table 4.
B-C ratio for housing support program.
| Housing | Solar PV | Fuel Cells | Solar Thermal | Geothermal Heat | ||||
|---|---|---|---|---|---|---|---|---|
| S1 | S2 | S1 | S2 | S1 | S2 | S1 | S2 | |
| 2004 | 0.243 | 1.248 | - | - | - | - | - | - |
| 2005 | 0.288 | 1.251 | - | - | - | - | - | - |
| 2006 | 0.302 | 1.321 | - | - | - | - | - | - |
| 2007 | 0.317 | 0.974 | - | - | 1.145 | 2.325 | - | - |
| 2008 | 0.333 | 0.893 | - | - | 0.937 | 1.735 | - | - |
| 2009 | 0.432 | 1.456 | - | - | 0.910 | 1.710 | 0.796 | 2.136 |
| 2010 | 0.557 | 1.384 | 0.249 | 0.661 | 0.836 | 1.557 | 0.537 | 1.016 |
| 2011 | 0.563 | 1.365 | 0.274 | 0.639 | 0.852 | 1.771 | 0.601 | 1.114 |
| 2012 | 0.820 | 1.725 | 0.313 | 0.605 | 0.729 | 1.391 | 0.605 | 1.162 |
| 2013 | 0.864 | 1.691 | 0.313 | 0.626 | 0.792 | 1.395 | 0.673 | 1.346 |
| 2014 | 1.052 | 1.983 | 0.381 | 0.803 | 0.964 | 1.868 | 0.744 | 1.490 |
| 2015 | 1.137 | 2.132 | 0.426 | 0.841 | 0.898 | 1.852 | 0.720 | 1.520 |
Table 5.
NPV for housing support program (million KRW).
| Housing | Solar PV | Fuel Cells | Solar Thermal | Geothermal Heat | ||||
|---|---|---|---|---|---|---|---|---|
| S1 | S2 | S1 | S2 | S1 | S2 | S1 | S2 | |
| 2004 | −6705 | 635 | - | - | - | - | - | - |
| 2005 | −16,780 | 1955 | - | - | - | - | - | - |
| 2006 | −50,185 | 7384 | - | - | - | - | - | - |
| 2007 | −60,283 | −1030 | - | - | 378 | 1518 | - | - |
| 2008 | −65,101 | −5230 | - | - | −1430 | 8220 | - | - |
| 2009 | −55,331 | 17,501 | - | - | −5407 | 21,184 | −1280 | 2741 |
| 2010 | −56,195 | 25,758 | −9882 | −1944 | −4513 | 7900 | −11,709 | 217 |
| 2011 | −47,158 | 21,123 | −12,282 | −2990 | −4037 | 9915 | −10,798 | 1740 |
| 2012 | −25,570 | 63,002 | −8596 | −2891 | −9830 | 7423 | −15,195 | 3426 |
| 2013 | −10,425 | 34,868 | −8141 | −1579 | −4100 | 4525 | −16,196 | 9249 |
| 2014 | 3520 | 45,833 | −5355 | −916 | −614 | 7995 | −11,948 | 12,570 |
| 2015 | 8066 | 46,127 | −6721 | −1075 | −1245 | 5442 | −12,569 | 12,363 |
Table 6.
IRR for housing support program (%).
| Housing | Solar PV | Fuel Cells | Solar Thermal | Geothermal Heat | ||||
|---|---|---|---|---|---|---|---|---|
| S1 | S2 | S1 | S2 | S1 | S2 | S1 | S2 | |
| 2004 | −7.9 | 8.8 | - | - | - | - | - | - |
| 2005 | −6.7 | 8.8 | - | - | - | - | - | - |
| 2006 | −6.5 | 9.7 | - | - | - | - | - | - |
| 2007 | −6.1 | 5.1 | - | - | 7.4 | 18.7 | - | - |
| 2008 | −5.8 | 4.0 | - | - | 4.6 | 13.4 | - | - |
| 2009 | −3.6 | 11.4 | - | - | 4.2 | 13.3 | 2.6 | 18.3 |
| 2010 | −1.2 | 10.5 | −8.0 | −4.9 | 3.2 | 11.8 | −1.6 | 5.7 |
| 2011 | −1.1 | 10.2 | −7.2 | −5.7 | 3.4 | 14.1 | −0.5 | 6.9 |
| 2012 | 3.0 | 14.7 | −6.2 | −6.8 | 1.6 | 10.1 | −0.4 | 7.5 |
| 2013 | 3.7 | 14.3 | −6.1 | −0.1 | 2.6 | 10.2 | 0.8 | 9.7 |
| 2014 | 6.2 | 17.8 | −4.4 | −2.1 | 5.0 | 15.4 | 2.0 | 11.4 |
| 2015 | 7.2 | 19.7 | −3.3 | −1.2 | 4.2 | 15.2 | 1.7 | 11.8 |
Table 7.
PP for housing support program (year).
| Housing | Solar PV | Fuel Cells | Solar Thermal | Geothermal Heat | ||||
|---|---|---|---|---|---|---|---|---|
| S1 | S2 | S1 | S2 | S1 | S2 | S1 | S2 | |
| 2004 | N | 14 | - | - | - | - | - | - |
| 2005 | N | 14 | - | - | - | - | - | - |
| 2006 | N | 13 | - | - | - | - | - | - |
| 2007 | N | N | - | - | 17 | 8 | - | - |
| 2008 | N | N | - | - | N | 11 | - | - |
| 2009 | N | 12 | - | - | N | 11 | N | 8 |
| 2010 | N | 13 | N | N | N | 12 | N | 20 |
| 2011 | N | 13 | N | N | N | 10 | N | 18 |
| 2012 | N | 9 | N | N | N | 13 | N | 17 |
| 2013 | N | 10 | N | N | N | 13 | N | 14 |
| 2014 | 19 | 8 | N | N | N | 9 | N | 12 |
| 2015 | 17 | 7 | N | N | N | 10 | N | 12 |
Note: N means that it cannot recover a project’s invested cost during the economic life of facilities.
© 2018 by the authors. Licensee MDPI, Basel, Switzerland. This article is an open access article distributed under the terms and conditions of the Creative Commons Attribution (CC BY) license (http://creativecommons.org/licenses/by/4.0/).
Share and Cite
MDPI and ACS Style
Choi, G.; Heo, E.; Lee, C.-Y. Dynamic Economic Analysis of Subsidies for New and Renewable Energy in South Korea. Sustainability 2018, 10, 1832. https://doi.org/10.3390/su10061832
AMA Style
Choi G, Heo E, Lee C-Y. Dynamic Economic Analysis of Subsidies for New and Renewable Energy in South Korea. Sustainability. 2018; 10(6):1832. https://doi.org/10.3390/su10061832
Chicago/Turabian StyleChoi, Gobong, Eunnyeong Heo, and Chul-Yong Lee. 2018. "Dynamic Economic Analysis of Subsidies for New and Renewable Energy in South Korea" Sustainability 10, no. 6: 1832. https://doi.org/10.3390/su10061832
Note that from the first issue of 2016, this journal uses article numbers instead of page numbers. See further details here.