A Quantitative Method for Prediction of Environmental Aspects in Construction Sites of Residential Buildings


1
Postgraduate Program in Industrial Engineering (PEI), Federal University of Bahia (UFBA), Aristides Novis, 02, Federação, Salvador 40210-630, Brazil
2
Federal Institute of Bahia (IFBA), BR 324-km 102.11, S/N-Aviário, Feira de Santana 44135-000, Brazil
3
Post-Graduate Program in Civil Engineering (PPEC), Federal University of Bahia (UFBA), Aristides Novis, 02, Federação, Salvador 40210-630, Brazil
*
Author to whom correspondence should be addressed.
Sustainability 2018, 10(6), 1870; https://doi.org/10.3390/su10061870
Submission received: 28 April 2018
/
Revised: 27 May 2018
/
Accepted: 28 May 2018
/
Published: 4 June 2018
(This article belongs to the Special Issue Sustainable Construction, Development and Management in the Built Environment)
Abstract
:Despite the sectoral initiatives, the construction industry faces difficulties in incorporating effective environmental impact control systems in construction sites. Most of the instruments have been adopting a qualitative approach to environmental issues, with few cases of a quantitative approach. This article introduces a quantitative method for predicting environmental aspects and impacts during the construction of residential buildings, through the integration between environmental indicators and construction cost bases. The methodology was based on the analysis of the relationships among activities, aspects and environmental impacts considered in EU Eco-Management and Audit Scheme (EMAS) for the development of the method and its mathematical representation. A case study was carried out to evaluate the method using the bill of quantities (BOQ) from two residential construction sites to measure their environmental aspects. The results suggest the usefulness of the method in the decision-making process on the allocation of control systems and, in some cases, recommending the execution of off-site services to reduce the impacts on the site’s neighborhood. Additionally, the method proved to be easy to apply to evaluate construction sites, as well as flexible to incorporate other activities, adapting to the demand of builders and municipalities to reduce the environmental impacts of construction sites.
1. Introduction
The rapid growth of cities, especially in poorer regions and developing countries in Asia, Africa, and Latin America, is a major challenge for the quality of life and sustainable development [1,2,3]. In 2010, 80% of the population of Latin America was already living in cities [3] and this ratio could reach 84% by 2025, when the region would become the second most urbanized in the world, behind only North America with 86% [4]. This increase in the rate of urbanization has been pressing the construction market to expand their stock of buildings and services [5]. By 2025, according to a study by the Mckinsey Global Institute (MGI), it will be necessary to increase the number of real estate units by up to 85% based on the existing stock of 2011 [4].
Despite the economic benefits resulting from the gains in scale and the reduction of the costs of services such as housing and sanitation, this rapid urban growth has been increasing environmental and social problems in the cities [1,3]. In fact, the construction sector can be associated with a significant worsening of several indicators of the urban life quality such as natural resources consumption [6], energy consumption and air pollution [7,8], generation and irregular disposal of waste [9,10,11,12], traffic problems and land use conflicts [13,14], and emission of noise and dust [15,16].
To reduce those negative effects, the construction sector has been developing specifics tools, such as the certification and labeling of the building [17], environmental performance evaluation methodologies [18,19], and good construction practices guides [20,21].
1.1. Systems of Certification of Buildings and the Local Context
Environmental certification and labeling systems emerged in the 1990s, with British Building Research Establishment Environmental Assessment Method (BREEAM) in 1990 and Leadership in Energy and Environmental Design (LEED) in 1998 [17]. Initially, the evaluation focused on energy consumption and pollutant emissions in domestic settings, such as BREEAM (United Kingdom), LEED (United States), Comprehensive Assessment System for Built Environment Efficiency—CASBEE (Japan), and Haute Qualité Environnementale—HQE (France) [6,22,23].
In the last decades, the use of certification systems has been expanding both in their countries of origin and in other markets. This expansion is the consequence of several factors, such as the search for international standards of evaluation and demand of the new emerging markets [17,24]. In addition, several countries have developed local tools from their own or international models [25]. Among the tools adapted to the local context are Building Environmental Assessment Method (BEAM) Plus in Hong Kong and Evaluation Standard for Green Building (ESGB) in China, respectively, based on BREEAM and LEED [17], and Alta Qualidade Ambiental (AQUA) in Brazil based on Démarche HQE [26].
Many studies have compared international environmental assessment systems, including local tools. In most cases, the comparison aims to categorize such tools according to their scopes and metrics, as well as identify the main difficulties to propose strategies to improve them [17,22,27,28]. However, the variety of the data (e.g., methodologies, scope, scope, construction stage, and users) does not allow a consensus in the categorization of that tools [27].
Although the triple-bottom-line concept is present in the design of main tools, the allocation of weights is generally unbalanced, with a greater emphasis on the environmental dimension rather than the social dimension [29]. Balancing the evaluation criteria and adapting them to the local context can make the tools more practical, transparent and flexible, allowing their application in different buildings and technological availability [17,25].
1.2. Environmental Performance Assessment Methodologies
Recently, a growth of concerns beyond environmental problems, incorporating social and institutional issues, as well as the analysis not only in the building but also in its surroundings, have been motivating the revision of the current tools and the emergence of new methodologies of performance evaluation during construction [29].
Performance measurement systems are ordinary in the construction industry, however, until recently these were restricted to measuring cost, time and quality as part of Quality Management Systems (QMS) [19]. Concerns about environmental impacts have required enlarging the traditional scope towards the Environmental Management Systems (EMS) [18,30].
International standards for the deployment of EMS include the ISO 14,000 series (e.g., 14,040, 14,044) [31], CEN TC 350 [32] and the EMAS [30] which demand the development of new methodologies for measuring and controlling environmental performance [33]. Among the methodologies related to CEN TC 350 can be cited the MARS-H [34] and SBTool-H [35].
A survey in the EI Compendex and Scopus database was carried out to identify proposals to integrate sustainable practices into the construction process. In general, the studies converge about the most relevant sources of environmental impacts, such as resource consumption, waste disposal, atmospheric emissions, effects on biodiversity, accidents risks, and local nuisances [18,19,33,36,37]. However, the variety of enterprises and the complexity of the factors involved do not point to a consensus about issues such as approach, measurement criteria, and indicators.
Some methodologies were developed to evaluate a specific sector, such as residential buildings [19,38] or urban infrastructure projects [10,39]. Other tools evaluate a specific impact, such as quantification of construction and demolition waste [11,38,40], noise emission during construction [16,41], or concerns of the stakeholders [42]. Measurement and evaluation techniques can also be differentiated according to the approach (quantitative/qualitative), selection and quantification of indicators (inputs/outputs), analysis technique (weighting, aggregation, normalization, regression, and cross-comparison) of data available, and factors which influence the robustness and sensitivity of the results [23]. Qualitative approaches still predominate in these assessment systems [18,19]. Shing et al. (2009) [23] also observed a degree of subjectivity in the weighting of indicators in several sustainability indexes analyzed. This excess of subjectivity in the measurement of indicators and the neglect of the local context can compromise the precision of the methods for evaluating the environmental impacts of construction [19].
According to Chen et al. (2000) [18], the qualitative approach, essential in the identification and analysis of the pollution and risks, demands quantitative instruments with measurement indicators to control of impacts along the construction stages. However, according to Gangolells et al. (2013) [30], there are few studies on the control of environmental performance over the construction phase and about the integration of environmental management systems with quantitative model-based construction management systems.
The Group of Construction Research and Innovation (GRIC) of the University Polytechnic of Catalunya and the Department of Civil Engineering of the University of Minho are some research groups and institutions who have been studying these issues. Such research groups highlight issues such as the need to reduce uncertainties in the assessment process during construction [19], the participation of the housing sector in the generation of impacts and the need for local tools [25].
The monitoring and reporting of environmental performance during the execution of the construction allow the parties involved to identify problems in the process and make corrections. To this end, instruments such as the Construction Pollution Index (CPI) [18] and the Environmental Performance Score (EPS) can be cited [37]. While the EPS is based on an own computational model to measure the environmental performance of the enterprise [37], the CPI presents a predictive model of the pollution [18] and resources consumption [43] which can be analyzed by commercial computational tools.
1.3. Problem and Purpose of the Article
In summary, according to presented context, the necessity for new strategies to assist the construction sector towards incorporating into their management practices the environmental impacts control instruments in the construction sites can be verified.
One of the current issues is how the inclusion of environmental management indicators in construction management practices can help to control and reduce the local impacts of construction sites, joining both a qualitative approach in the impact identification and a quantitative approach in the performance monitoring.
Generally, improvements in the control of environmental impacts due to construction activities are based on the diagnosis of the situation and implementation of new environmental management tools. However, this process requires significant learning time and changes in organizational culture, which can generate conflicts and decrease adherence among the agents involved.
A hypothesis is that the improvement of impacts control also can be obtained through of increments in the construction management practices, extending the scope of its traditional tools with the incorporation of environmental indicators. In addition, the use this prior knowledge would reduce the time of implantation and the learning curve as well as increase the adherence by the agents involved already habituated with the base tool.
This paper presents a quantitative method for predicting environmental aspects in construction sites through the incorporation of environmental indicators into the construction cost bases. The scope of the method was limited to the segment of residential buildings due to the need to reduce variables and uncertainties. This restricted considered the relevance of the residential segment in the local and international context, mainly in the issues related to the generation of social and environmental impacts in the urban space.
The development of the method involved some specific steps:
- Survey of the international scientific literature and Brazilian to identify the main environmental aspects of construction sites and its main regulatory marks.
- Analysis of the ordinary cost bases in construction and selecting quantitative indicators towards to reduce the subjectivity in the environmental aspects evaluation
- Evaluating the predictive method through a case study
- Definition of the mathematical representation of the environmental aspect predictive method.
The evaluation of the method was restricted to the prediction of environmental aspects during the implantation of construction sites in Brazilian cities. In the case study, two construction sites in the city center of Feira de Santana, a medium-sized city in the state of Bahia, 108 km from the capital Salvador were analyzed.
2. An Overview of the Environmental Impacts of Construction Sites in Brazil
Local Impacts of Construction Sites and Their Main Regulatory Standards
In Brazil, despite its peculiarities, the problem of city growth is repeated with the pressure on urban systems, increasing demand for housing, construction, and renovation of buildings, and the impacts generated by construction sites on the surrounding neighborhood and in the city. According to data from the historical series, the rate of urbanization in Brazil of 80% in 2002 reached 84.36% in 2010 [44], with an increase in concentration in the state capitals and some medium-sized cities, boosting the construction industry segment.
Despite the contraction of the last years, the construction industry remains one of the main economic activities in Brazil [45]. In 2014, the sector generated 10% of the Gross Domestic Product (GDP), with R$ 382 billion (US$10 billion), employing 29 million people [46].
On the other hand, there are also growing concerns about the environmental and social impacts caused by construction activities. The construction process involves a series of activities of transformation and intensive use of machines, which generate significant environmental aspects such as consumption of natural resources, generation of waste, emissions of gases and particulate matter, accidents at work and other issues such as land use and occupation and noise.
(a) Consumption of natural resources and generation of construction and demolition waste.
The productive chain of construction accounts for a large part of the national natural resource consumption, with fractions of 20–50% of total [45,47]. According to data from the latest Brazilian Mineral Yearbook published in 2010, the construction sector is the main consumer of raw mineral products such as sand (68.96%), crushed rocks (40.71%) and ornamental rocks (68.93%) [48].
In addition, construction is a major generator of CDW impacting the urban landscape and overloading the collection service [10]. In 2016, Brazil collected 45 million tons of CDW, equal to 63% of the total of urban waste [49]. In European Union, the CDW generated represents about 30% of the total urban wastes [5]. The low municipal control over the use of materials, waste generation and disposal contribute to the uncertainty about the amount of CDW [50].
In Brazil, the main normative instruments applicable to CDW are the National Solid Waste Plan (PNRS) of 2012 [51], Resolution No. 307/2002 of the National Environment Council (CONAMA) [52] and the Normative Instruction No. 13/2012 (IN IBAMA No. 13) of the Brazilian Institute of Environment and Renewable Natural Resources (IBAMA). CONAMA Resolution 307/2002 [52] deals strictly with construction and demolition waste, setting guidelines, criteria, and procedures for their management, as well as the responsibilities of the municipal governments and the generators (builders) [53]. IN IBAMA No. 13 has a large scope covering the different types of solid residues foreseen in the National Solid Waste Policy (Law 12.305/2010) and its instruments, setting the Brazilian list of solid wastes to discipline the register and control of the operators of solid waste and the potentially polluting activities.
IN IBAMA No. 13 was based on the European List of Solid Waste, maintaining the same structure (chapter, subchapter, and type of waste) for the classification of the wastes and including those listed in ABNT 10.004. Chapter 17 brings together the CDW (including excavated soil) into eight subchapters.
On the other hand, the Resolution 307 CONAMA lists four waste groups: reusable or recyclable wastes (Class A); recyclable wastes for other destinations (Class B); wastes which do not yet have economically viable technologies for recycling or recovery (Class C); and hazardous waste such as paints and solvents, and those contaminated or harmful to health due to demolition, renovation or repair of radiological clinics or containing asbestos (Class D) [10]. Table 1 shows a comparison between the classifications from IN IBAMA No. 13 and Resolution 307 CONAMA.
(b) Emissions of gases and particulate matter
Construction sites in Brazil also contribute significantly to urban environmental pollution due to the dust and particulate matter released during the construction and demolition process, besides the volatile organic compounds (VOC) associated with the use of paints and solvents [15,54]. These emissions can be easily dispersed depending on factors such as meteorological conditions, the layout of the site, and distances between the storage areas and places of the activities [55]. Among the sources of pollution are the various construction activities and their machinery, and vehicles [56].
Resolution 3 by CONAMA sets the air quality standards and the air pollutants for monitoring and control. However, according to Araújo et al. [15], the resolution does not establish standards for emission levels, taking into account the pollution sources and the different construction phases to guide actions in order to reduce their impacts.
(c) Noise and vibrations
According to Zannin and Sant’ana [57], the accelerated growth of Brazilian cities has increased noise pollution due to urban activities (e.g., vehicle traffic, civil construction, and nightclubs). The intensity and time of exposure to noise and vibrations can generate health damages and the quality of urban life. At the construction sites, the main noise and vibration generating activities involve demolition, earthworks, deep foundations and heavy use of machines and vehicles [41,58]. However, the complexity of the construction industry and the wide number of activities make it difficult to identify the participation of each constructive activities in the generation of nuisances [41].
CONAMA Resolution No. 1 of 1990 defined the acceptable limits of NBR 10,151 as national standards for measurement and control of noise emissions from urban activities. The most recent version of NBR 101,151 [59] presents the method of measuring and evaluating noise, establishing noise levels according to the different types of areas and occupation (rural, urban, mixed, hospitals, schools and industrial) and hours of operation (day and night). Some Brazilian cities, such as São Paulo and Curitiba, have implemented actions to map, evaluate and control urban noise to reduce its impacts, including noise-free campaigns, noise measurement and mapping, and zoning laws [60,61].
(d) Safety and Accident Exposure at construction sites and in their surroundings
Data from the International Labor Organization point to the construction industry as one of the most dangerous sectors for the worker, with approximately 60 thousand deaths a year, equivalent to 17% of the annual deaths due to accidents at work in the world [62]. According to Silva et al. [63], besides the risks to the health and integrity of workers, these accidents also imply significant economic and social costs. In Brazil, the Ministry of Social Security recorded a further 502,000 occupational accidents in 2015, of which 8.2% were in the construction sector (construction of buildings, infrastructure works, and specialized services). In only the construction of buildings, there were 16,570 accidents and 132 deaths, equal to 40% of the total in the construction sector in 2015 [64].
The main regulatory standard for safety management at Brazilian construction sites is Regulatory Norm No. 18 (NR18) through its Work Conditions and Environment Program (PCMAT) [65]. Existing legislation and supervision structure still appear insufficient to reduce the number of work-related accidents in the industry. The low efficiency of the safety system may be related to a greater emphasis on legal aspects than to proper monitoring and risk assessment [66].
(e) Land use
In Brazil, the regulatory system for urban land use and management is shared by the federal and municipal spheres, whose municipalities are in charge of implementing urban policy [14]. Main instruments for implementing urban policy are the Urban Development Master Plan, the Land Use and Occupancy Law, the Building Code and the Construction License. Recently, new legal instruments of national scope have reinforced the role of municipal management, for instance, Law 10.257/2001 (City Statute), Neighborhood Impact Study; Law 12,305/2010 (National Policy on Solid Waste-PNRS); and CONAMA Resolutions No. 307/2002 and No. 348/2004. However, urban management still faces problems in implementing the control of the impacts of construction sites, such as the lack of legal landmarks, control instruments, capacitating of staff and information system [14].
3. Materials and Methods
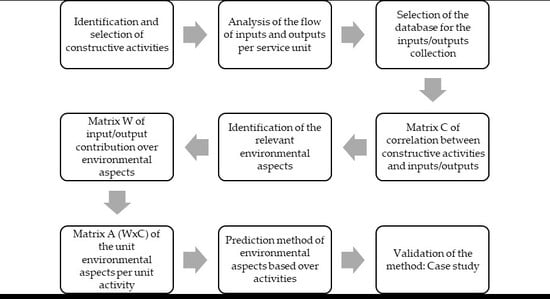
The develop the Environmental Aspects Prediction Method (EAPM), used a conceptual framework (Figure 1) adapted from the analysis of the relationships among activities, environmental aspects and environmental impacts of the Eco-Management and Audit Scheme (EMAS). The EMAS defines environmental aspect as an element of the activities, products or services of an organization that has or may have an impact on the environment; environmental impact, as any adverse or beneficial environmental change resulting from the activities, products or services of the one organization, and environmental performance as the measurable result of management of its environmental aspects [67]. These concepts of environmental aspects and impacts are also in agreement with the definitions proposed by the series ISO 14,000 and with its Brazilian version [68].
The analysis of the relationships among the constructive activities and their environmental aspects and impacts sought to consider the practices of the local construction industry, as well as the aspects of project and execution of the services.
An exploratory survey was undertaken to provide an overview of the distribution of high residential buildings and the construction sites in operation to choose the case study for method validation. The primary data were obtained from the enterprise technical staff through questionnaires, interviews, on-site observation and photographic record.
4. Development of the Environmental Aspects Prediction Method (EAPM)
4.1. Context and Delimitation of the Object under Analysis
In Brazil, economic activities follow the National Classification of Economic Activities (CNAE) of the Brazilian Institute of Geography and Statistics [46]. This classification is equivalent to other international classifications, such as the International Standard Industrial Classification of All Economic Activities (ISIC) by UN, the United Kingdom Standard Industrial Classification of Economic Activities (SIC), and statistical Classification of Economic Activities in the European Community (NACE). The construction industry corresponds to section F in the CNAE, which has three divisions: building construction (F-41), infrastructure works (F-42) and specialized construction services (F-43) [46]. The study restricted the analysis to the building construction division (F-41), which includes the construction sites of multifamily residential buildings. However, the EAPM can be adjusted to other activities and buildings types.
4.2. Construction Activities Selection
Initially, a survey in the EI Compendex and Scopus databases identified a group of articles related to the environmental evaluation of construction sites and analyzed their lists of activities. Table 2 shows the activity lists summary according to authors and study context. The lists of construction activities adopted by the articles present differences about the comprehensiveness and detail degree. In general, the methodologies picked the most frequent activities (e.g., earthwork, foundations, structures, masonry, roofing, window frames, building systems, and finishes) [19,25,50,69,70,71]. In other cases, the study expanded the list incorporating the support and logistics activities (e.g., construction site structure, waste treatment, and transportation work) [18,37].
The activities in Table 2 can be grouped into 11 main constructive stages (preliminary services, earthmoving, foundations, superstructure, walls, roofing, waterproofing, finishes, frames, building systems and cleaning). Among these stages, the first four were selected (preliminary services, earth moving, foundations, and superstructure) by the direct relation with the implantation of the construction site and added the stage of the superstructure by having similar subsystems with the foundation step.
The list of constructive activities of the EAPM was organized hierarchically in subsystems and steps to allow the identification and comparison [76] according to the format of the Work Breakdown Structure (WBS), usual in project management to detail project steps, budget and planning, as well as assist in monitoring the execution of concurrent services [77]. The activities were categorized into two hierarchical levels (Table 3), with 14 constructive activities (level 2) grouped in five phases (level 1).
4.3. Analysis of Inputs and Outputs of Constructive Activities
4.3.1. Selection of Input and Output Variables and Their Units of Measure
The inputs and outputs of the construction activities were identified through the Material Flow Analysis (MFA) [78,79] considering the different resources involved (inputs, labor, facilities) and their externalities (waste and emissions). The quantification of inputs and outputs was based on the methodology of evaluation of the Sustainability Material Inputs Per unit of Service (MPIS) developed by the Wuppertal Institute in the mid-1990s to promote the factor 10 concept [23,80]. The choice of MIPS, as one of the auxiliary methods in the paper, was made by its affinity with the cost basis methodology. Both MIPS and cost databases use material consumption per unit of service in determining their unitary compositions. While the MIPS considers the impacts of these inputs on environmental mitigation, the cost databases consider the impacts of this unit coefficient in the prices and time. MIPS considers the flows and intensity of materials associated with products and services, named the ecological backpack, to identify impacts sources and establish their control indicators [23,80].
MFA of the constructive activities resulted in a group of 26 inputs/outputs based on the activities of construction site preparation, earthwork, foundation, and superstructure. These 26 entries and exits were grouped into seven categories (Table 4) comprising natural resources, manufactured resources, facilities, waste, utilities, and transportation services.
4.3.2. Database Selection for the Collection of the Inputs and Outputs per Service Unit
Indicators of inputs and outputs per service unit can be obtained from a variety of sources and at different phases of the life cycle of the enterprise. This choice is influenced by the intended use and the degree of difficulty of obtaining them, and such choice impacts the reliability and quality of the analysis. In the pre-construction phase (planning and design) it is usual to use sectoral statistical data and reference works for prediction of impacts and planning of control and mitigation actions [10,71]. During the construction phase, the average of resources effectively used can be chosen as a parameter for the control and the adjustment during the process [20,55]. At the termination of the construction, one can use global values or registered consumption averages to determine performance and serve as a parameter for new construction sites.
Among the important sources of sectoral data about the construction activities are named cost bases, which brings together unitary compositions of services grouped in construction systems (e.g., foundations, structures, installations, and finishes) and their subdivisions, with their respective coefficients of use of resources and productivity (e.g., resource consumption, labor demand, and equipment time). These cost bases can have different coverage (regional and national) and accessibility (free or paid) depending on the organization in charge for their statistical data (government institutions, sector entities, and developers of management tools).
To this study, some Brazilian and international cost bases were analyzed to serve as a basis for the predictive method. The selection criteria have sought those that could be more easily incorporated into the practices of the small and medium Brazilian constructors, i.e., those in Portuguese or of Latin origin, recognized in the construction sector, free access, and available in web base.
Some tools of regional coverage maintained by government institutions and free access can be observed in countries such as Spain, such as the Base de Datos de la Construcción (BDC) by Consejería de Obras Públicas, Urbanismo y Transportes de la Comunidad de Madrid [81] and the Base de Costes de la Construcción de Andalucía (BCCA) by Consejería de Fomento y Vivienda de la Junta de Andalucía [52]. In the construction market, there are also databases of sector organizations such as the Civil Construction and Public Works Industry Association of Portugal and those for private sectors such as CYPE Prices Generator maintained [82] which bring together data from 27 countries with languages of Latin origin. Beyond being used in the budget, CYPE Prices generator has also been adopted as an auxiliary tool to estimate the use of resources in different studies on environmental issues such as life cycle analysis and rehabilitation [35,83,84].
In Brazil, examples of the national cost databases include the National System of Costs Survey and Indices of Civil Construction (SINAPI) and the Table of Compositions of Prices for Budgets (TCPO) [50,71,85]. SINAPI is a national database maintained by Caixa Econômica Federal (CEF), the main Brazilian public bank for the promotion of construction, and the Brazilian Institute of Geography and Statistics (IBGE) and since 2013 has become a mandatory reference for the elaboration of budget of works and engineering services with federal resources in Brazil. TCPO brings together more 8000 compositions with averages of resource consumption per service unit of the construction industry in Brazil [50]. Initially, TCPO adopted as reference the MasterFormat standard and since then has been adjusting to the practice of the local market through studies about consumption and productivity of materials and labor [85]. Although designed for decision-making on prices, time and productivity, data on resource consumption, labor, equipment demand and waste rate estimation per unit of service, can also be used for estimating environmental aspects.
The mentioned cost bases (BDC, BCCA, SINAPI, TCPO, and CYPE) has a similar structure with compositions per service and their consumption coefficients grouped by construction systems. However, such cost bases present some differences regarding the form of access, inputs measurement and use of indicators of loss. The access to the TCPO requires the purchase of the book version or a license online, while the others are free accessed via the web. BDC, in addition to the printed version, also provides an online platform to access to the compositions trough search by activity or keyword. The CYPE also provides a web platform as well as a computer package for offline access. The method for estimating the water consumption is differentiated between Spanish and Brazilian bases. While in the BDC and BCCA the water consumption is a direct indicator which is estimated for each service, in the SINAPI and TCPO the water consumption is appropriated in a global way into the costs of construction site administration. Among the four databases, only CYPE Generator of Prices explicitly presents estimates of the loss rate [82].
CYPE cost base was select as it has the following characteristics: (a) a cost data of the Brazilian context; (b) coefficients of resources consumption per unit of constructive activity; (c) waste generation rate and its classification by Brazilian list of solid wastes [86]; and (d) free access through the web or computational package.
4.3.3. Data Collection of Inputs and Outputs per Service Unit (Matrix C)
Matrix C with data collected from the inputs/output coefficients per unit of constructive activities was defined as:
where Cik represents the coefficients for each type of resource, waste or service by unitary constructive activity. The lines (i = 1 to 14) represent the constructive activities (Table 3) and the columns (k = 1 to 26) represent the types of inputs and outputs (resources consumed, generated waste and services demanded).
Appendix A (Figure A1) shows the values obtained from the Matrix C, as defined in Equation (1), standardized in units of mass (t), energy (kWh) and time (h) to allow comparison and aggregation. Considering that in the cost bases resources and wastes have different units of measurement (e.g., aggregates and CDW are usually measured in apparent volume, while cement and steel are measured in mass), conversion rates [87] were applied to homogenize these quantities in units of mass (ton).
Table 5 describes the criteria adopted for the acquisition of the quantities of Matrix C according to the type of resource/waste/service, the indicator and the data acquisition source used. The quantities of resources and generation and residues were extracted directly from the CYPE Generator of Prices [82], while the quantities of the other categories were obtained from the combination of direct data from the cost base and indirect data of productivity indicators and service specifications.
4.4. Estimating of Environmental Aspects by Service Unit
4.4.1. Identification and Selection of Significant Environmental Aspects
Initially, selection of the environmental aspects has demanded a review the sustainability assessment methodologies [19,43] and guidelines for good construction practices [20,90]. In the review, interactions between inputs and outputs of the activities and with the environmental were analyzed to identify significant environmental aspects, i.e., those may have an impact on the environment as described in EMAS [67].
Gangolells et al. (2008) [19], in their methodology for predicting the severity of impacts of the residential construction process in Spain, also adopted EMAS to select a group of nine categories of environmental aspects (atmospheric emissions; water emissions; waste generation; soil alteration; resource consumption; local issues; transport issues; effects on biodiversity; and incidents, accidents and potential emergency situations).
To adapt the EAPM to the local context, the initial list of environmental aspects based on EMAS [67] was reconciled with the guidelines the “Housing Construction Program” (HABITARE) in Brazil brought together in its report “2.6 Survey of the state of the art: Construction site” [73].
The guide was developed to sustainability assessment of construction sites in Brazil and directed to construction agents, as a result of adapting to local context recommendations of international guides such as Field Guide for Sustainable Construction (Pentagon Renovation and Construction Program, USA), Aspects environnementaux dans le BTP impacts en phase chantier (Enterprise Générales de France B.T.P. Groupe Qualité, France), NetRegs: building small businesses through environmental regulations (Environment Agency, UK). The guide also adopts a correlation matrix between constructive activities and environmental aspects. However, the approach is qualitative, whose aspects are evaluated according to a scale of occurrence (nonexistent, existing or more relevant).
The analysis resulted in the selection of 18 environmental aspects grouped into seven categories (resource consumption, waste generation, emissions, public services, transport services, land use and occupation, and worker health and safety). The contributory inputs and outputs on each environmental aspect are described in Table 6.
4.4.2. Contribution of Inputs and Outputs to Environmental Aspects (Matrix W)
In the EAPM, the contribution ratio of inputs/outputs on the change of each local environmental aspect was defined according to a scale of weights (ranging from 0 to 1). Weight equal to 1 was attributed when the component directly changes the environmental aspect and weight 0 when there is no change or it is insignificant. For instance, in the environmental aspect, for the use of noise/vibration emission equipment, only the components of the facilities category were considered (w = 1). Otherwise, in the case of inputs/outputs of composite materials, precast concrete and ready-mix concrete were given different weights for the fractions of their raw materials. Thus, the cement fraction impacts in the consumption of manufactured resources while the sand and gravel fractions impact in the consumption of mineral resources.
The matrix W with the weights (contribution rates) of inputs and outputs on each environmental aspect was defined as:
where Wkj is the contribution rate of each type of input/output (in lines k, ranging from 1 to 26) on the environmental aspects (in columns j, ranging from 1 to 18).
The values of Matrix W are described in Appendix B (Figure A2).
4.4.3. Environmental Aspects per Unit of Services (Matrix A)
Considering the resource consumption and the residues generated by the constructive activities (Matrix C) and how they change the local environmental aspects (Matrix W), Matrix A was defined.
Matrix A can be represented as the result matrix of the product of Matrices C and W:
Thus, in the EAPM, the quantity of a specific environmental aspect aij can be calculated by the following expression:
where aij represents the value of unit environmental aspect by construction activity; cik is the coefficient of consumption/use of the inputs/outputs by construction activity; and wkj is the contribution rate (weight) of each type of input/output by environmental aspect.
The values of Matrix A are described in Appendix C (Figure A3)
4.5. Estimating of the Global Environmental Aspects of the Construction Sites
The estimation of the alterations of the local environmental aspects to be generated by each construction site was calculated applying the quantitative of the services on the matrix of unit environmental aspects.
4.5.1. Quantitative Services of the Construction Site
The quantities can be obtained from the project documentation, specifically the bill of quantities (BOQ), which relates the use of resources (materials, required equipment labor) of each activity [91]. Indeed, several studies about performance use the BOQ as a data source to collect indicators of environmental aspects and impacts of constructive activities [19,30,39]. Data extracted from the BOQ are also used to study specific topics, such as in the models for estimation of CDW [52,91].
4.5.2. Global Environmental Aspects (Matrix G)
Matrix G represents the value of the environmental aspects considering the quantity of each constructive activity, which can be defined as the result matrix of the product of the Matrices Q (quantities of services) and A (unit environmental aspects):
Thus, the global value of a given global aspect gii can be determined by the expression:
where gij represents the magnitude of a certain environmental aspect, qii represents the quantity of the service, and aij represents the environmental aspects per unit service.
The global value of a given global aspect Gj can be obtained by the following expression:
4.5.3. Comparing the Environmental Performance of Construction Sites
To allow the comparison of environmental aspects among two or more construction sites, these values were evaluated according to the intensity of the generation of the environmental aspect per constructed area and area of land. Then, the values of the intensities were normalized on a scale of 0 to 1, considering 1 the maximum value and the others according to Equations (9) and (10).
where Ij and I′j represent the intensity of the analyzed environmental aspect (Gj) by constructed area (A1) and land area (A2), respectively. The indexes, ij and i′j represent the normalized values from Ij and Ij2 considering the max values from these intensities (Ij,max, and I′j,max).
5. Case Study
A case study was carried out from September 2016 to March 2017 with the objective of analyzing the applicability of the EAPM in construction sites of a medium-sized Brazilian city. The chosen city was Feira de Santana in the interior of State of Bahia, 109 km from Salvador and the second largest population and the third largest Gross Domestic Product (GDP) in the State of Bahia.
In the last national demographic study realized in 2010, the city population was 556 thousand inhabitants with 92% in the urban area [92]. According to IBGE projections, in 2017 the estimated population of Feira de Santana would have reached 627 thousand inhabitants, which represents a growth of 12.7% for the period from 2010 to 2017, above the 10.4% estimated for Salvador.
An exploratory study identified five construction sites of residential buildings in the urban center of the city, all located in the neighborhood called Santa Monica. Data were collected from market agents (real estate and construction companies) and verified on field visits. Among the five sites initially identified, two companies expressed an interest in participating in the survey providing access to the construction site and the project documentation.
Data Collected from Selected Buildings
Both buildings were designed for multi-floor residential use, with only two high standard dwellings per floor and an estimated value of R $1.2 million (US $352 thousand) per unit. The apartment has three bedrooms (with individual bathroom), office, living/dining rooms, social bathroom, gourmet balcony, kitchen and service area with dependencies (employee room). Table 7 summarizes the physics characteristics of the buildings for the two construction sites (CS1 and CS2).
Another feature was many private parking spaces, at least three for each dwelling (Table 7) representing an average of 0.75 vehicles per inhabitant, which is above the local and national averages. In 2016, according to portal @Cidades IBGE, Feira de Santana had a fleet of 113 thousand cars (0.18 cars per inhabitant) [93]. Consequently, the private parking area has a significant participation in the built area ranging from 24% (CS1) to 28% (CS2) of the total constructed area.
Table 8 shows the bill of quantities of the construction activities each construction obtained from the technical team and the analysis of the project documents.
6. Results and Discussion
The quantitative method developed, EAPM, was applied in both samples to evaluate of changes in local environmental aspects during the initial construction activities of the construction sites (implantation, foundations, and superstructure).
This process was performed according to the following steps: (1) The quantities of each construction activity (independent variables) were extracted from Table 8 and inserted into the diagonal Matrix Q (5). (2) The Matrix G of global environmental aspects, as defined in Equation (6), was obtained as the matrix product between the matrix quantities (Matrix Q) and the transition matrix of unit environmental aspects (Matrix A). (3) The values of change of each global aspect (dependent variables) were obtained by applying the Equation (7).
The alterations in the environmental aspects due to construction sites activities (CS1 and CS2) are presented in Appendix C (Figure A4 and Figure A5). These results were analyzed for each of the environmental aspects (consumption resources, waste generation, pollution emission, public services and transport), highlighting the construction activities major potential for generation of alterations.
Aiming to compare the aspects by buildings, rates of environmental aspect per constructed area or land area were calculated. Thus, in the inventory-based aspects, such as resource consumption and waste generated, the buildings were compared considering the constructed area. Otherwise, in those environmental aspects related to local issues, such as public services, transportation, and nuisances, analyzed the environmental stress caused by the land use activity (area of land).
6.1. Resources Consumption
Consumption of resources according to the EAPM for the case study are described in Table 9, which were extracted from the matrix of environmental aspects and whose values were aggregated by the resource category and constructive activity. As mentioned previously, these data are restricted to the initial phases of the construction process (implantation, foundation, and superstructure).
Considering the all resources (mineral, renewable and manufactured), the estimated consumption was 12,087 tons for CS1 and 7477 tons for CS2, equal to 0.78 ton.·m−2 (CS1) and 0.57 ton.·m−2 (CS2) of resource consumption per the constructed area. Regarding the origin (natural, renewable or manufactured), the smallest fraction was the consumption of renewable resources ranging from 2% (CS1) to 3% (CS2), composed of pieces of wood for forms and closure of the land, therefore, temporary elements not incorporated into buildings. Almost all the resource consumption (97% in CS1 and 98% in CS2) was of mineral material fractions (aggregates and binders), which are ordinary in construction, in both natural form (sand, and gravel) and manufactured (cement, and ready-mix concrete). The fractions of sand and gravel were about 84% (CS1) and 85% (CS1) over the totals calculated for the case study. Among the constructive activities, those related to elements of concrete (Foundation and Superstructure) demanded the highest consumption rates, especially the superstructure with estimated consumption between 86% (CS1) and 79% (CS2) of the total resources.
6.2. Waste Generation
Table 10 shows the calculated residues for the selected activities from the matrix of the EAPM and the global values by each class of waste generated (e.g., concrete and masonry, wood, and metals) and constructive activity.
Regarding Table 10, the total waste quantities were 5501 ton (CS1) and 4697 ton (CS2), meaning a rate of 0.356 ton (CS1) and 0.364 ton (CS2) in tons of waste generated per constructed area. A large part of the mass of estimated waste is related to removal of topsoil and excavated material to parking pavements. That fraction of soil represents 78% of the total wastes and involving also other environmental aspects, such as alteration of soil stability and circulation of machines. On the other hand, the fractions of demolition waste were insignificant, about 1%, as the place did not have pre-existing construction to be demolished, only the wall in the land boundary.
The results show that the wastes from these initial stages are predominantly inert, therefore can be recycled and reincorporated into the production chain. Over 90% of these residues have mineral origin (soil, concrete, and masonry), varying from 94% (CS1) to 96% (CS2). The complementary fraction corresponds to wood and steel residues, also recyclable, with 6% (CS1) and 4% (CS2).
6.3. Pollution Emission
Table 11 shows the contribution of constructive activities in the changing the local environmental aspects due to pollution emission (atmospheric and sound) according to EAPM.
According to Table 11, the manipulated mass of inputs involved in dust and particulate matter (PM) was about 6099 tons for CS1 and 5227 tons for CS2, which equivalent to the rates of 3.31 ton.·m−2 (CS1) and 2.36 ton.·m−2 (CS2) of materials handled per area of land. The largest fraction was related to earthmoving (i.e., mechanical excavation and surface cleaning), followed by precast concrete piles services. The fraction calculated for mechanical excavation was 70% of all mass.
The second aspect within the environmental pollution category was the use of fuel-powered mechanical equipment, which recorded 1023 h for CS1 and 797 h for CS2 (Table 11) with rates of 0.52 h·m−2 (CS1) and 0.36 h·m−2 (CS2) in hours of machine use per area of land.
The time of use of noise or vibration emission equipment according to EAPM were estimated 4.104 h (CS1) and 2.247 h (CS2) (Table 11) with rates of 2.22 h·m−2 (CS1) and 0.36 h·m−2 (CS2) in use time per the area of land. The largest fractions were due to mechanized excavation (12% in CS1 and 17% in CS2), superstructure for concrete (32% in CS1 and 30% in CS2) and manufacture of forms to concrete (46% in CS1 and 37% in CS2).
The results suggest that some design decisions such as reduction of garage floors and management decisions as the production of off-site forms have a direct impact on local aspects. It should be noted that the method in the aggregation of time considered only the duration (time of productive use of the equipment) still not incorporating criteria to consider the different intensities of these noises and their overlap.
6.4. Public Services and Transport
Table 12 presents the results of the EAPM for those environmental aspects that directly impact on urban infrastructure (i.e., utilities and transportation services).
According to Table 12, the water consumption rate per the land area, equal to 0.52 L·m−2 in CS1, is greater than twice the CS2 which has a rate of 0.24 L·m−2. However, the variation was lower when considering the consumption of water per area constructed with rates of 0.06 L·m−2 (CS1) and 0.04 L·m−2 (CS2). Four activities generated more than 80% of the expected water demand, in the following order: placing of forms for superstructure (35% in CS1 and 29% in CS2), launching of concrete for superstructure (23% in CS1 and 24% in CS2), manufacture of wood forms (19% in CS1 and 17% in CS2), and steel cutting and bending (11% in CS1 and CS2). Similarly, the results of the electric power consumption varied significantly (235,342 kWh in CS1 and 127,955 kWh in CS2), and were influenced once again by the built area and their services quantities. In fact, the range in consumption per built area was lower, between 0.15 kWh.m−2 (CS1) and 0.10 kWh.m−2 (CS2).
In the analysis of the aspects that impact the services of traffic and mobility two influence areas were considered. While the direct influence area covered the worksite and the immediate neighborhood, the indirect influence area included the other neighborhoods and the urban perimeter.
The circulation of machines and equipment into the area of direct influence was estimated about 1319 h (CS1) and 1026 h (CS2), equivalent to 0.75 h·m−2 (CS1) and 0.46 h·m−2 (CS2). The results indicate a larger flow of vehicles in CS1, as expected considering their higher volume of services and smaller area of land. Over 90% of the local circulation time was generated by only three activities: launching of superstructure concrete, mechanical excavation and precast casting. Impacts of these aspects may vary depending on the characteristics of the site (e.g., number of access gates) and the surroundings (e.g., the width of street and sidewalk, the pattern of dwellings, and the existence of sensitive uses such as hospitals and schools).
The circulation of machines and equipment into the area of indirect influence was estimated as about 2790 h (CS1) and 1931 h (CS2). In the calculation, the average distance considered was 10 km from the site to the main suppliers and waste landfills. About 80% of this circulation times was generated by the activities of mechanical excavation and launching of concrete in the superstructure.
6.5. Land Use
Table 13 shows the EAPM results for the land-related environmental aspects that directly impact the quality of life around the construction site.
In general, the selected buildings presented similar results for the removal and movement of total soil (4842 tons for CS1 and 4333 tons for CS2) and according to the constructed area (0.31 ton.·m−2 in CS1 and 0.34 ton.·m−2 in CS2). However, when considering the soil withdrawn per land area, a greater intensity from CS1 (2.63 ton.·m−2) than CS2 (1.96 ton.·m−2) was observed. This indicator (soil movement by area of land) is important to evaluate possible impacts on soil stability by orienting control and mitigation measures to reduce the risk of accidents labor and damage to neighboring builds. This assessment still needs to be complemented with other information, such as geology, excavation location, and types of neighboring constructions.
The quantity of the unpackaged materials stored also considered CDW (except soil) due to its provisionally maintained at the site until collection. According to Table 13, the three activities were the ones that most demanded the storage of unpacked materials, in order: superstructure wood forms (30% in CS1 and 22% in CS2), precast concrete piles (28% in CS1 and 38% in CS2) and superstructure rebar frames (24% in CS1 and 18% in CS2). Finally, regarding the storage of packaged materials, the total quantity was not significant due to the use of pre-mixed concrete instead of the one produced at the site, therefore, low consumption of cement packed. This consumption corresponds the cement to produce the concrete floors of the temporary facilities.
Analyzing the findings, it is observed that, in the initial stages of the project, the inputs at the site are mainly unpackaged materials, while the packaged materials represented only 0.25% in CS1 and 0.50% in CS2. Considering the entire flow (materials and wastes), the total stored at the estimated site would reach between 6925 tons (CS1) and 5565 tons (CS2). This total would consist of 69.93% soil removed, 30.00% unpackaged materials and 0.07% materials packed in CS1. In CS2, the composition would be 76.62% soil removed, 23.27% unpackaged materials and 0.12% packaged materials.
This high concentration of flow and storage of unpackaged (soil and materials) indicate the need for special care for planning the storage spaces at the site and load handling, as well as the use of cover to reduce the emission of dust.
6.6. Health and Safety
Table 14 presents the results of the demand for labor by the risk involved according to the EAPM. The estimated labor time for CS1 was 183% higher than that obtained for CS2. However, the division of this work time in relative terms varied less between the samples. The samples show a similar participation for each labor risk as fall of height (58% in CS1 and 54% in CS2), risk of falling objects (39% in CS1 and 43% in CS2) and those exposed to heavy machinery (2% in CS1 and 4% in CS2).
The work in height was restricted to the services of execution of the concrete superstructure, including the installation of forms (50% in CS1 and 45% in CS2), placement of reinforcement (10% in CS1 and CS2) and concrete launching (40% in CS1 and 45% in CS2).
In the case of services at the uncovered areas, the main fractions are related to the services of preparation of wood forms (56% in CS1 and 45% in CS2) and steel cutting and bending (33% in CS1 and 30% in CS2). These results suggest that the execution of these services in off-site would reduce the demand for on-site work and the risk of accidents at the construction sites, and other aspects such as the impact on the urban landscape (less construction time) and noise generation. In addition, the estimated values can assist in the definition of teams, allocation of safety resources and adequacy of the workers training by the type of risk involved. This information is relevant not only to internal workers’ safety builders and teams but also to licensing and supervisory public agents.
6.7. Comparing the Estimated Generation Rate of Environmental Aspects from the Construction Sites
The designs of both building sites have basically the same standard of size of apartments, layout, and number of rooms and toilets. However, the projects present differences in the number of dwellings and in the total area of construction, whose differences would make it difficult to compare the two construction sites directly, considering only the absolute values calculated for their environmental aspects. Thus, the values were standardized according to the rate of environmental aspect per unit of constructed area for better comparison. In addition, the rates of environmental aspects per area of land were also considered. Figure 2 shows the normalized values for the estimated generation rate of environmental aspects per total constructed area (Figure 2a) and per total land area (Figure 2b), whose values were extracted from Figure A6 and Figure A7 in Appendix F. As described in the Materials and Methods Section 3, the higher values mean greater potential to generate environmental impacts.
Analyzing the graphs (Figure 2), Construction Site 1 concentrated most of the higher indexes for the generation rates of environmental aspects considered. CS1 exceeded CS2 in 15 of the 18 aspects related the rate of generation of environmental aspects per constructed area. This predominance was even greater to the rates related to environmental aspects per land area when CS1 exceed CS2 in 17.
These findings suggest CS1 has a greater potential to generate negative environmental impacts per built area due to their greater intensity about the use of resources, generation of waste, circulation of machines, and exposure of workers to risk. Considering the land area criterion, the predominance of the CS1 indicators is even more significant than CS2 in consequence of activities concentration in a smaller land area. Among the potential environmental risks associated with the concentration of activities can be cited: (a) impairment of soil stability due to excavation intensity; (b) noise pollution due to increased machine circulation; and (c) air pollution due to increased handling of materials containing dust and matter particulate.
7. Conclusions
This paper presents a prediction method of environmental aspects that can generate significant environmental impacts during the construction of residential buildings. The developed method, named EAPM, integrated a set of recognized environmental indicators into a cost database of traditional use in construction management. The study addressed a gap in the construction industry, the lack of quantitative tools for assessing the environmental aspects generated by construction sites, and the difficulty for builders and public agents to incorporate sustainable practices.
The findings of EAPM from two case studies point to its usefulness and applicability in predictions of environmental aspects. According to the findings, the initial constructive activities interact in different ways with the environment contributing to a greater or lesser degree in the generation of environmental aspects. Among the activities, foundations and superstructures presented a high consumption of natural resources (over 80% of total) and demand for labor (over 90% of total). On the other hand, the preliminary services such as surface clearing and mechanized excavation impacted significantly on waste generation, dust and noise emission, and transport.
The EAPM was designed for a preliminary assessment of the construction sites. However, it can be used in other phases of the construction cycle as benchmarking to measure performance and assisting the decision-making process. In planning, for example, the absolute value of water consumption can recommend from the installation of saving devices to the adoption of rainwater reuse systems. On the other hand, the rates of the aspects by area of land allow evaluating the intensity of the impacts on the public services (water and energy), and nuisance in the neighborhood, guiding the supervision system on which mitigating actions should be implemented.
The findings suggest that some of the local nuisances can be reduced through prefabricated systems and off-site services. For example, the adoption of prefabricated concrete forms and the pre-bent steel would reduce the demand for machinery and labor in the place, consequently generating less noise, circulation of workers, and consumption of water and energy.
The representing in matrix shape facilitated the identification between activities and environmental aspects. In addition, the matrix can support the assignment of responsibilities (e.g., the allocation the safety services to activities related to exposure to the accidents). The proposed structure redirects the focus to the control of generating activities and their interfaces with the environment (environmental aspects) instead of the traditional control type end-of-pipe. EAPM also has the flexibility to incorporate new activities and aspects and be implemented in a computational model own or integrated into a computational budget package.
The study proposes a review of the method of quantifying some indicators such as labor, water consumption, and energy. In the case of labor time, it suggests the associated risk (location and degree of exposure) in addition to the traditional classification by type of worker (e.g., masons and carpenters). About the consumption of water and energy, the recommendation is the direct quantification by construction activities instead of the indirect quantification into the activities of site administration.
In summary, the EAPM incorporating environmental indicators into the cost databases expands its scope and at the same time seeks to harness its user network to disseminate the theme of control and reduction of environmental impacts. Such cost databases are widely used in construction practice, by builders and agents of supervision of the construction process, as well as in the training of engineers and architects composing part of their curriculum.
The EAPM show some limitations which should be addressed in future studies. One of these limitations is related to the method of quantification of dust emission and particulate, for which the method adopted an indirect indicator, i.e., the total mass of materials and residues containing small fractions, however without differentiating these fractions. One option to reduce this limitation would be to consider weights differentiated according to a standardized granulometry of each material. Another difficulty was how to consider different intensities and exposure times into the aggregation method of noise generation. Finally, the analysis of storage considered as an indicator the mass of materials and residues, however other factors such as production cycles and the flow of waste collection directly impact the storage time.
Author Contributions
L.C.A.B., S.F.C. and A.K. conceived the study and designed the predictive method. L.C.A.B. performed the data collection and analysis. S.F.C., R.D.A.C. and A.K. reviewed the analysis and the predictive method. L.C.A.B. wrote the paper.
Acknowledgments
The authors acknowledgments the important collaboration of Clean Technology Network (TECLIM) of the Department of Environmental Engineering at Federal University of Bahia (UFBA).
Conflicts of Interest
The authors declare no conflict of interest.
Abbreviations
| EU | European Union |
| CDW | construction and demolition waste |
| EMAS | Eco-Management and Audit Scheme |
| BOQ | bill of quantities |
| MGI | Mckinsey Global Institute |
| BREEAM | British Building Research Establishment Environmental Assessment Method |
| LEED | Leadership in Energy and Environmental Design |
| CASBEE | Comprehensive Assessment System for Built Environment |
| HQE | Haute Qualité Environnementale |
| AQUA | Alta Qualidade Ambiental |
| EMS | Environmental Management Systems |
| CPI | Construction Pollution Index |
| BDC | Base de Datos de la Construcción de la Comunidad de Madrid |
| BCCA | Base de Costes de la Construcción de Andalucía |
| SINAPI | National System of Costs Survey and Indices of Civil Construction |
| TCPO | Table of Compositions of Prices for Budgets |
Appendix A. Inputs and Outputs per Service Unit (Related to Matrix C)
Figure A1.
Matrix with the quantitative inputs and outputs per unit of constructive activity (Matrix C).
Figure A1.
Matrix with the quantitative inputs and outputs per unit of constructive activity (Matrix C).

Appendix B. Contribution of Inputs and Outputs to Environmental Aspects (Related to Matrix W)
Figure A2.
Matrix with the contribution rate of inputs and outputs over the environmental aspects of the method (Matrix W).
Figure A2.
Matrix with the contribution rate of inputs and outputs over the environmental aspects of the method (Matrix W).

Appendix C. Environmental Aspects per Unit of Services (Findings from Matrix A)
Figure A3.
Matrix with the aspects environmental aspects per unit of constructive activity (Matrix A).
Figure A3.
Matrix with the aspects environmental aspects per unit of constructive activity (Matrix A).

Appendix D. Global Environmental Aspects from Construction Site 1
Figure A4.
Estimated overall environmental aspects of construction activities of Building 1 (CS1) according to the developed method (Matrix G).
Figure A4.
Estimated overall environmental aspects of construction activities of Building 1 (CS1) according to the developed method (Matrix G).

Appendix E. Global Environmental Aspects from Construction Site 2
Figure A5.
Estimated overall environmental aspects of construction activities of Building 2 (CS2) according to the developed method (Matrix G).
Figure A5.
Estimated overall environmental aspects of construction activities of Building 2 (CS2) according to the developed method (Matrix G).

Appendix F. The Generation Rate of Environmental Aspects from the Construction Sites
Figure A6.
Normalizing the ratio environmental aspects (EA) per constructed area (CA).

Figure A7.
Normalizing the ratio environmental aspects (EA) per land area (LA).

References
- Kourtit, K.; Nijkamp, P.; Reid, N. The new urban world: Challenges and policy. Appl. Geogr. 2014, 49, 1–3. [Google Scholar] [CrossRef]
- United Nations (ONU). World Urbanization Prospects: The 2014 Revision; ONU: New York, NY, USA, 2014; ISBN 9789211515176. [Google Scholar]
- Cadena, A.; Remes, J.; Manyika, J.; Dobbs, R.; Roxburgh, C.; Elstrodt, H.-P.; Chaia, A.; Restrepo, A. Building Globally Competitive Cities: The Key to Latin American Growth _ Summary; McKinsey Global Institute: Seoul, Korea, 2011. [Google Scholar]
- Dobbs, R.; Smit, S.; Remes, J.; Manyika, J.; Roxburgh, C.; Restrepo, A. Urban World: Mapping the Economic Power of Cities; McKinsey Global Institute: Seoul, Korea, 2011; ISBN 0983179662. [Google Scholar]
- Banias, G.; Achillas, C.; Vlachokostas, C.; Moussiopoulos, N.; Tarsenis, S. Assessing multiple criteria for the optimal location of a construction and demolition waste management facility. Build. Environ. 2010, 45, 2317–2326. [Google Scholar] [CrossRef]
- Ameen, R.F.M.; Mourshed, M.; Li, H. A critical review of environmental assessment tools for sustainable urban design. Environ. Impact Assess. Rev. 2015, 55, 110–125. [Google Scholar] [CrossRef]
- Energy and Air Pollution (IEA). World Energy Outlook—Special Report; IEA: Paris, France, 2016. [Google Scholar]
- Pérez-Lombard, L.; Ortiz, J.; Pout, C. A review on buildings energy consumption information. Energy Build. 2008, 40, 394–398. [Google Scholar] [CrossRef]
- Alwan, Z.; Jones, P.; Holgate, P. Strategic sustainable development in the UK construction industry, through the framework for strategic sustainable development, using Building Information Modelling. J. Clean. Prod. 2015. [Google Scholar] [CrossRef]
- de Magalhães, R.F.; Danilevicz, Â.M.F.; Saurin, T.A. Reducing construction waste: A study of urban infrastructure projects. Waste Manag. 2017. [Google Scholar] [CrossRef] [PubMed]
- Calvo, N.; Varela-Candamio, L.; Novo-Corti, I. A dynamic model for construction and demolition (C&D) waste management in Spain: Driving policies based on economic incentives and tax penalties. Sustainability 2014, 6, 416. [Google Scholar] [CrossRef]
- de Azevedo, G.O.D.; Kiperstok, A.; Moraes, L.R.S. Construction waste in Salvador: Ways to a sustainable management. Eng. Sanitária e Ambient. 2006, 11, 65–72. [Google Scholar] [CrossRef]
- Zhang, X.; Wu, Y.; Shen, L. An evaluation framework for the sustainability of urban land use: A study of capital cities and municipalities in China. Habitat Int. 2011, 35, 141–149. [Google Scholar] [CrossRef]
- Lollo, J.; Röhm, S. Land parceling and neighborhood impacts in Brazil. J. Urban Environ. Eng. 2009, 3, 23–31. [Google Scholar] [CrossRef] [Green Version]
- Araújo, I.P.S.; Costa, D.B.; Moraes, R.J.B. de Identification and Characterization of Particulate Matter Concentrations at Construction Jobsites. Sustainability 2014, 6, 7666–7688. [Google Scholar] [CrossRef]
- Ballesteros, M.J.; Fernández, M.D.; Quintana, S.; Ballesteros, J.A.; Gonzá lez, I. Noise emission evolution on construction sites. Measurement for controlling and assessing its impact on the people and on the environment. Build. Environ. 2010, 45, 711–717. [Google Scholar] [CrossRef]
- Lee, W.L. A comprehensive review of metrics of building environmental assessment schemes. Energy Build. 2013, 62, 403–413. [Google Scholar] [CrossRef]
- Chen, Z.; Li, H.; Wong, C.T.C. Environmental Management of Urban Construction Projects in China. J. Constr. Eng. Manag. 2000, 126, 320–324. [Google Scholar] [CrossRef]
- Gangolells, M.; Casals, M.; Gassó, S.; Forcada, N.; Roca, X.; Fuertes, A. A methodology for predicting the severity of environmental impacts related to the construction process of residential buildings. Build. Environ. 2009, 44, 558–571. [Google Scholar] [CrossRef] [Green Version]
- HK Construction Association. Best Practice Guide for Environmental Protection on Construction Sites; Hong Kong Construction Association: Hong Kong, China, 2013. [Google Scholar]
- Pulaski, M.H.; Horman, M.J.; Riley, D.R.; Dahl, P.; Hickey, A.; Lapinski, A.R.; Magent, C.; Shaltes, N. Field Guide for Sustainable Construction. Pulaski, M.H., Ed.; Pentagon Renovation and Construction Program Office: Arlington, VA, USA, 2004. [Google Scholar]
- Sharifi, A.; Murayama, A. A critical review of seven selected neighborhood sustainability assessment tools. Environ. Impact Assess. Rev. 2013, 38, 73–87. [Google Scholar] [CrossRef]
- Singh, R.K.; Murty, H.R.; Gupta, S.K.; Dikshit, A.K. An overview of sustainability assessment methodologies. Ecol. Indic. 2009, 9, 189–212. [Google Scholar] [CrossRef]
- Cole, R.J.; Jose Valdebenito, M. The importation of building environmental certification systems: International usages of BREEAM and LEED. Build. Res. Inf. 2013, 41, 662–676. [Google Scholar] [CrossRef]
- Mateus, R.; Bragança, L. Sustainability assessment and rating of buildings: Developing the methodology SBToolPT–H. Build. Environ. 2011, 46, 1962–1971. [Google Scholar] [CrossRef]
- Grünberg, P.R.M.; de Medeiros, M.H.F.; Tavares, S.F. Certificação ambiental de habitações: Comparação entre LEED for Homes, Processo Aqua e Selo Casa Azul. Ambient. Soc. 2014, 17, 195–214. [Google Scholar] [CrossRef]
- Haapio, A.; Viitaniemi, P. A critical review of building environmental assessment tools. Environ. Impact Assess. Rev. 2008, 28, 469–482. [Google Scholar] [CrossRef] [Green Version]
- Li, Y.; Chen, X.; Wang, X.; Xu, Y.; Chen, P.-H. A review of studies on green building assessment methods by comparative analysis. Energy Build. 2017, 146, 152–159. [Google Scholar] [CrossRef]
- Doan, D.T.; Ghaffarianhoseini, A.; Naismith, N.; Zhang, T.; Tookey, J. A critical comparison of green building rating systems. Build. Environ. 2017, 123, 243–260. [Google Scholar] [CrossRef]
- Gangolells, M.; Casals, M.; Forcada, N.; Fuertes, A.; Roca, X. Model for Enhancing Integrated Identification, Assessment, and Operational Control of On-Site Environmental Impacts and Health and Safety Risks in Construction Firms. J. Constr. Eng. Manag. 2013, 138–147. [Google Scholar] [CrossRef]
- ISO 14040. The International Standards Organisation Environmental Management—Life cYcle Assessment—Principles and framework; ISO: Geneva, Switzerland, 2006. [Google Scholar]
- CEN CEN/TC 350—European Committee for Standardization—Technical Commitee 350. Available online: http://portailgroupe.afnor.fr/public_espacenormalisation/CENTC350/index.html (accessed on 1 December 2017).
- Fuertes, A.; Casals, M.; Gangolells, M.; Forcada, N.; Macarulla, M.; Roca, X. An Environmental Impact Causal Model for improving the environmental performance of construction processes. J. Clean. Prod. 2013, 52, 425–437. [Google Scholar] [CrossRef]
- Mateus, R. Avaliação da Sustentabilidade da Construção: Propostas para o Desenvolvimento de Edifícios mais Sustentáveis. Available online: http://repositorium.sdum.uminho.pt/bitstream/1822/9886/1/Tese%20Doutoramento_Ricardo%20Mateus_2009.pdf (accessed on 26 October 2015).
- Costa, R.J.G.; Bragança, L.; Mateus, R.; Bezerra, J.C. Reabilitação sustentável de edifícios antigos—Contribuição para os edifícios de balanço energético nulo (nZEB) e otimização do nível de sustentabilidade. Rev. Eng. Civ. 2014, 49, 65–80. [Google Scholar]
- Tam, V.W.Y.; Tam, C.M.; Zeng, S.X.; Chan, K.K. Environmental performance measurement indicators in construction. Build. Environ. 2006, 41, 164–173. [Google Scholar] [CrossRef]
- Shen, L.-Y.; Lu, W.-S.; Yao, H.; Wu, D.-H. A computer-based scoring method for measuring the environmental performance of construction activities. Autom. Constr. 2005, 297–309. [Google Scholar] [CrossRef]
- Sáez, P.V.; Porras-Amores, C.; Del Río Merino, M. New quantification proposal for construction waste generation in new residential constructions. J. Clean. Prod. 2015, 102. [Google Scholar] [CrossRef]
- Gangolells, M.; Casals, M.; Forcada, N.; Macarulla, M. Predicting on-site environmental impacts of municipal engineering works. Environ. Impact Assess. Rev. 2014, 44, 43–57. [Google Scholar] [CrossRef] [Green Version]
- Song, Y.; Wang, Y.; Liu, F.; Zhang, Y. Development of a hybrid model to predict construction and demolition waste: China as a case study. Waste Manag. 2017, 59, 350–361. [Google Scholar] [CrossRef] [PubMed]
- Kantová, R. Construction Machines as a Source of Construction noise. Procedia Eng. 2017, 190, 92–99. [Google Scholar] [CrossRef]
- Gangolells, M.; Casals, M.; Gassó, S.; Forcada, N.; Roca, X.; Fuertes, A. Assessing concerns of interested parties when predicting the significance of environmental impacts related to the construction process of residential buildings. Build. Environ. 2011, 46, 1023–1037. [Google Scholar] [CrossRef] [Green Version]
- Li, H.; Chen, Z.; Wong, C.T.C.; Love, P.E.D. A quantitative approach to construction pollution control based on resource levelling. Constr. Innov. 2002, 2, 71–81. [Google Scholar] [CrossRef]
- De Geografia E Estatística (IBGE). Atlas do Censo Demográfico 2010; IBGE: Rio de Janeiro, Brazil, 2013. [Google Scholar]
- Paz, D.H.; Lafayette, K.P. Forecasting of construction and demolition waste in Brazil. Waste Manag. Res. 2016, 34, 708–716. [Google Scholar] [CrossRef] [PubMed]
- Instituto Brasileiro de Geografia e Estatística (IBGE). Pesquisa Anual da Indústria da Construção 2014; IBGE: Rio de Janeiro, Brazil, 2014; Volume 42, ISBN 9788524042225. [Google Scholar]
- de Oliveira Holanda, M.J.; da Paz, D.H.F.; Figueredo, C.M.; Lafayette, K.P.V.; Sobral, M.D.C.M. Diagnosis of Irregular Disposal of Construction and Demolition Waste (CDW) in the City of Olinda/PE. Electron. J. Geotech. Eng. 2016, 21, 5115–5128. [Google Scholar]
- Departamento Nacional de Produção Mineral (DNPM). Anuário Mineral Brasileiro 2010; DNPM: Brasília, Brazil, 2010. [Google Scholar]
- Abrelpe. Panorama dos Resíduos Sólidos no Brasil 2016; Associação Brasileira de Empresas de Limpeza Pública e Resíduos Especiais: São Paulo, Brazil, 2017. [Google Scholar]
- Condeixa, K.; Haddad, A.; Boer, D. Material Flow Analysis of the Residential Building Stock at the city of Rio de Janeiro. J. Clean. Prod. 2017, 149, 1249–1267. [Google Scholar] [CrossRef]
- Política Nacional de Resíduos Sólidos, 3nd ed.; Câmara dos Deputados: Brasília, Brazil, 2010; ISBN 978-85-402-0496.
- Solís-Guzmán, J.; Marrero, M.; Montes-Delgado, M.V.; Ramírez-de-Arellano, A. A Spanish model for quantification and management of construction waste. Waste Manag. 2009, 29, 2542–2548. [Google Scholar] [CrossRef] [PubMed]
- Resolução CONAMA no 307/2002. In DOU; 2002. Available online: www.mma.gov.br/port/conama/legiabre.cfm?codlegi=307 (assessed on 30 May 2018).
- Wong, I.L.; Kruger, E. Comparing energy efficiency labelling systems in the EU and Brazil: Implications, challenges, barriers and opportunities. Energy Policy 2017, 109, 310–323. [Google Scholar] [CrossRef]
- de Moraes, R.J.B.; Costa, D.B.; Araújo, I.P.S. Particulate Matter Concentration from Construction Sites: Concrete and Masonry Works. J. Environ. Eng. 2016, 142, 05016004. [Google Scholar] [CrossRef]
- Vazquez, E.; Rola, S.; Martins, D.; Alves, L.; Freitas, M.; Pinguelli Rosa, L. Sustainability in civil construction: Application of an environmental certification process (LEED) during the construction phase of a hospital enterprise—Rio de Janeiro/Brazil. Int. J. Sustain. Dev. Plan. 2013, 8, 1–19. [Google Scholar] [CrossRef]
- Zannin, P.H.T.; de Sant’Ana, D.Q. Noise mapping at different stages of a freeway redevelopment project—A case study in Brazil. Appl. Acoust. 2011, 72, 479–486. [Google Scholar] [CrossRef]
- de Olveira, T.L.C.; Kiperstok, A.; César, S.F. Nuisance in the Neighborhood during Building Construction and Impact of Noise; Federal Univesity of Bahia: Salvador, Brazil, 2016. [Google Scholar]
- ABNT NBR 10151:Acústica-Avaliação do Ruído em Áreas Habitadas 2000; Associação Brasiliera de Normas Técnicas: Rio de Janeiro, Brasil, 2000.
- Cardoso, L. The Politics of Noise Control in São Paulo. J. Lat. Am. Stud. 2016, 1–29. [Google Scholar] [CrossRef]
- de Andrade, F.C.; Sopchaki, L.; Antonio, R.; Padilha, B.; Pereira Silveira, T.; Catai, R.E.; Nagalli, A. Acoustic Mapping of the Central Region of Curitiba -Brazil. Electron. J. Geotech. Eng. 2014, 19, 4301–4319. [Google Scholar]
- López-valcárcel, A.; Lima Júnior, J.M.; Dias, L.A. Segurança e Saúde no Trabalho da Construção: Experiência Brasileira e Panorama Internacional; OIT—Secretaria Internacional do Trabalho: Brasília, Brazil, 2005; ISBN 9228178388. [Google Scholar]
- Silva, C.; Melo De Souza, P.; Antônio, J.; Souza, S. Security Management Benefits at Work in Monitoring Individual Protection Equipment (IPE) and Collective Security Systems (CSS), Procedures and Methods in Industry Construction. Bus. Manag. Dyn. 2017, 6, 19–26. [Google Scholar]
- Brasil Government. Anuário Estatístico de Acidentes do Trabalho—AET 2015; Ministério da Fazenda: Brasília, Brazil, 2015.
- Penaloza, G.A.; Saurin, T.A.; Formoso, C.T. Identification and assessment of requirements of temporary edge protection systems for buildings. Int. J. Ind. Ergon. 2017, 58, 90–108. [Google Scholar] [CrossRef]
- Engler, M.; Carlos, B.; Formoso, T.; Pellicer, E.; Fabro, F.; Encarnacion, M.; Castello, V.; Soares, M.E.; Resumo, E. Identificação de práticas de gestão da segurança e saúde no trabalho em obras de construção civil Identification of health and safety managerial practices in construction sites. Ambient. Construído 2013, 13, 43–58. [Google Scholar]
- European Commission Regulation (EC). No 1221/2009 of the European Parliament and of the Council of 25 November 2009 on the Voluntary Participation by Organisations in a Community Eco-Management and Audit Scheme (EMAS); EC: Brussels, Belgium, 2009. [Google Scholar]
- ABNT ISO 14001:2015. Environmental Management Systems—Requirements with Guidance for Use; ISO: Geneva, Switzerland, 2015. [Google Scholar]
- Llatas, C. A model for quantifying construction waste in projects according to the European waste list. Waste Manag. 2011, 31, 1261–1276. [Google Scholar] [CrossRef] [PubMed]
- Stoy, C.; Schalcher, H.-R. Residential Building Projects: Building Cost Indicators and Drivers. J. Constr. Eng. Manag. 2007, 133, 139–145. [Google Scholar] [CrossRef]
- de Lassio, J.; França, J.; Espirito Santo, K.; Haddad, A. Case Study: LCA Methodology Applied to Materials Management in a Brazilian Residential Construction Site. J. Eng. 2016, 2016, 8513293. [Google Scholar] [CrossRef]
- Costa, D.; Formoso, C.; Lima, H.; Barth, K. Sistema de Indicadores Para Benchmarking na Construção Civil; UFRGS/PPGEC/NORIE, Ed.; Núcleo Orientado Para a Inovação da Edificação—UFRG: Porto Alegre, Brazil, 2005; ISBN 9780874216561. [Google Scholar]
- Cardoso, F.F.C.; Araujo, V.M. Levantamento do Estado da Arte: Canteiro de Obras; Escola Politécnica da Universidade de São Paulo—USP: São Paulo, Brazil, 2007. [Google Scholar]
- Barreiros, M.A.F.; Abiko, A.K. Avaliação de impactos de vizinhança utilizando matrizes numéricas. Ambient. Construído 2016, 16, 23–38. [Google Scholar] [CrossRef]
- Haddad, A.N.; de Lassio, J.G.G. Life cycle assessment of building construction materials: Case study for a housing complex. Rev. Constr. 2016, 15, 69–77. [Google Scholar] [CrossRef]
- Sáez, P.V.; del Río Merino, M.; Porras-Amores, C. Estimation of construction and demolition waste volume generation in new residential buildings in Spain. Waste Manag. Res. 2012, 30, 137–146. [Google Scholar] [CrossRef] [PubMed]
- Chua, D.K.; Godinot, M. Use of a WBS Matrix to Improve Interface Management in Projects. J. Constr. Eng. Manag. 2006, 132, 67–79. [Google Scholar] [CrossRef]
- Huang, T.; Shi, F.; Tanikawa, H.; Fei, J.; Han, J. Materials demand and environmental impact of buildings construction and demolition in China based on dynamic material flow analysis. Resour. Conserv. Recycl. 2013, 72, 91–101. [Google Scholar] [CrossRef]
- Moldan, B.; Janoušková, S.; Hák, T. How to understand and measure environmental sustainability: Indicators and targets. Ecol. Indic. 2012, 17, 4–13. [Google Scholar] [CrossRef]
- Ness, B.; Urbel-Piirsalu, E.; Anderberg, S.; Olsson, L. Categorising tools for sustainability assessment. Ecol. Econ. 2007, 60, 498–508. [Google Scholar] [CrossRef]
- Dirección General de Arquitectura y Vivienda de la Comunidad de Madrid. Base de Precios de la Construcción de la Comunidad de Madrid—BCC. 2007. Available online: http://www.madrid.org/bdccm/principal.htm (accessed on 29 November 2017).
- Cype Ingenieros Generator prices for construction version Brasil. Available online: http://www.brasil.geradordeprecos.info/ (accessed on 1 December 2017). (In Portuguese).
- Rodríguez Serrano, A.; Porras Álvarez, S. Life Cycle Assessment in Building: A Case Study on the Energy and Emissions Impact Related to the Choice of Housing Typologies and Construction Process in Spain. Sustainability 2016, 8, 287. [Google Scholar] [CrossRef]
- Tadeu, S.; Rodrigues, C.; Tadeu, A.; Freire, F.; Simões, N. Energy retrofit of historic buildings: Environmental assessment of cost-optimal solutions. J. Build. Eng. 2015, 4, 167–176. [Google Scholar] [CrossRef]
- PINI. Tables for Compositions of Prices for Budgets (TCPO); PINI: Rio de Janeiro, Brazil, 2013. (In Portuguese) [Google Scholar]
- Federal government of Brazil. Instrução Normativa no13 de 18 de dezembro de 2012—Lista Brasileira de Resíduos Sólidos. In Diário Oficial da União; Federal government of Brazil: Brasil, 2012; pp. 48–52. [Google Scholar]
- Li, Y.; Zhang, X. Web-based construction waste estimation system for building construction projects. Autom. Constr. 2013, 35, 142–156. [Google Scholar] [CrossRef]
- CBIC. Manual Básico de Indicadores de Produtividade na Construção Civil; Câmara Brasileira da Indústria da Construção: Brasília, Brasil, 2017; Volume 1. [Google Scholar]
- Andalusian Government. BCCA Base de Costes de la Construcción de Andalucia 2017; Consejería de Fomento y Vivienda de la Junta de Andalucía: Andalúcia, Spain, 2017.
- JCR. Best environmental management practice for the building and construction Sector. In Sectoral Reference Documents (SRDs) on Best Environmental Management Practice—EMAS; EcoManagement and Audit Scheme (EMAS): Brussels, Belgium, 2012; p. 611. [Google Scholar]
- Li, Y.; Zhang, X.; Ding, G.; Feng, Z. Developing a quantitative construction waste estimation model for building construction projects. Resour. Conserv. Recycl. 2016, 106, 9–20. [Google Scholar] [CrossRef]
- IBGE. Censo Demográfico 2010—Características da População e dos Domicílios—Resultados do Universo; IBGE: Rio de Janeiro, Brazil, 2011. [Google Scholar]
- Instituto Brasileiro de Geografia e Estatística (IBGE). Cidades@. Available online: https://cidades.ibge.gov.br/ (accessed on 22 February 2018).
Figure 1.
Conceptual framework of the study describing the activities flow for development of the Environmental Aspects Prediction Method (EAPM) for the construction sites.
Figure 1.
Conceptual framework of the study describing the activities flow for development of the Environmental Aspects Prediction Method (EAPM) for the construction sites.

Figure 2.
Comparison between the construction sites according to EAPM: (a) normalized values of the environmental aspects by built area; and (b) normalized values of environmental aspects by land area. Environmental aspects: mineral resources consumption (RC1), renewable resources consumption (RC2), manufactured resources consumption (RC3), generation of wastes of soil/concrete/masonry (WG1), generation of wastes of wood/metals, (WG2), handling involving dust/ particulate matter (PE1), fuel-powered mechanical equipment (PE2), noise and vibration emission equipment (PE3), water consumption (PS1), electricity consumption (PS2), circulation of machines and vehicles on the local (TS1), circulation of machines and vehicles in the city (TS2), withdrawal and movement of soil (LU1), unpacked materials storage (LU2), packed materials storage (LU3), labor exposed to machinery (HS1), labor exposed to fall of height (HS2), and labor exposed to falling objects (HS3).


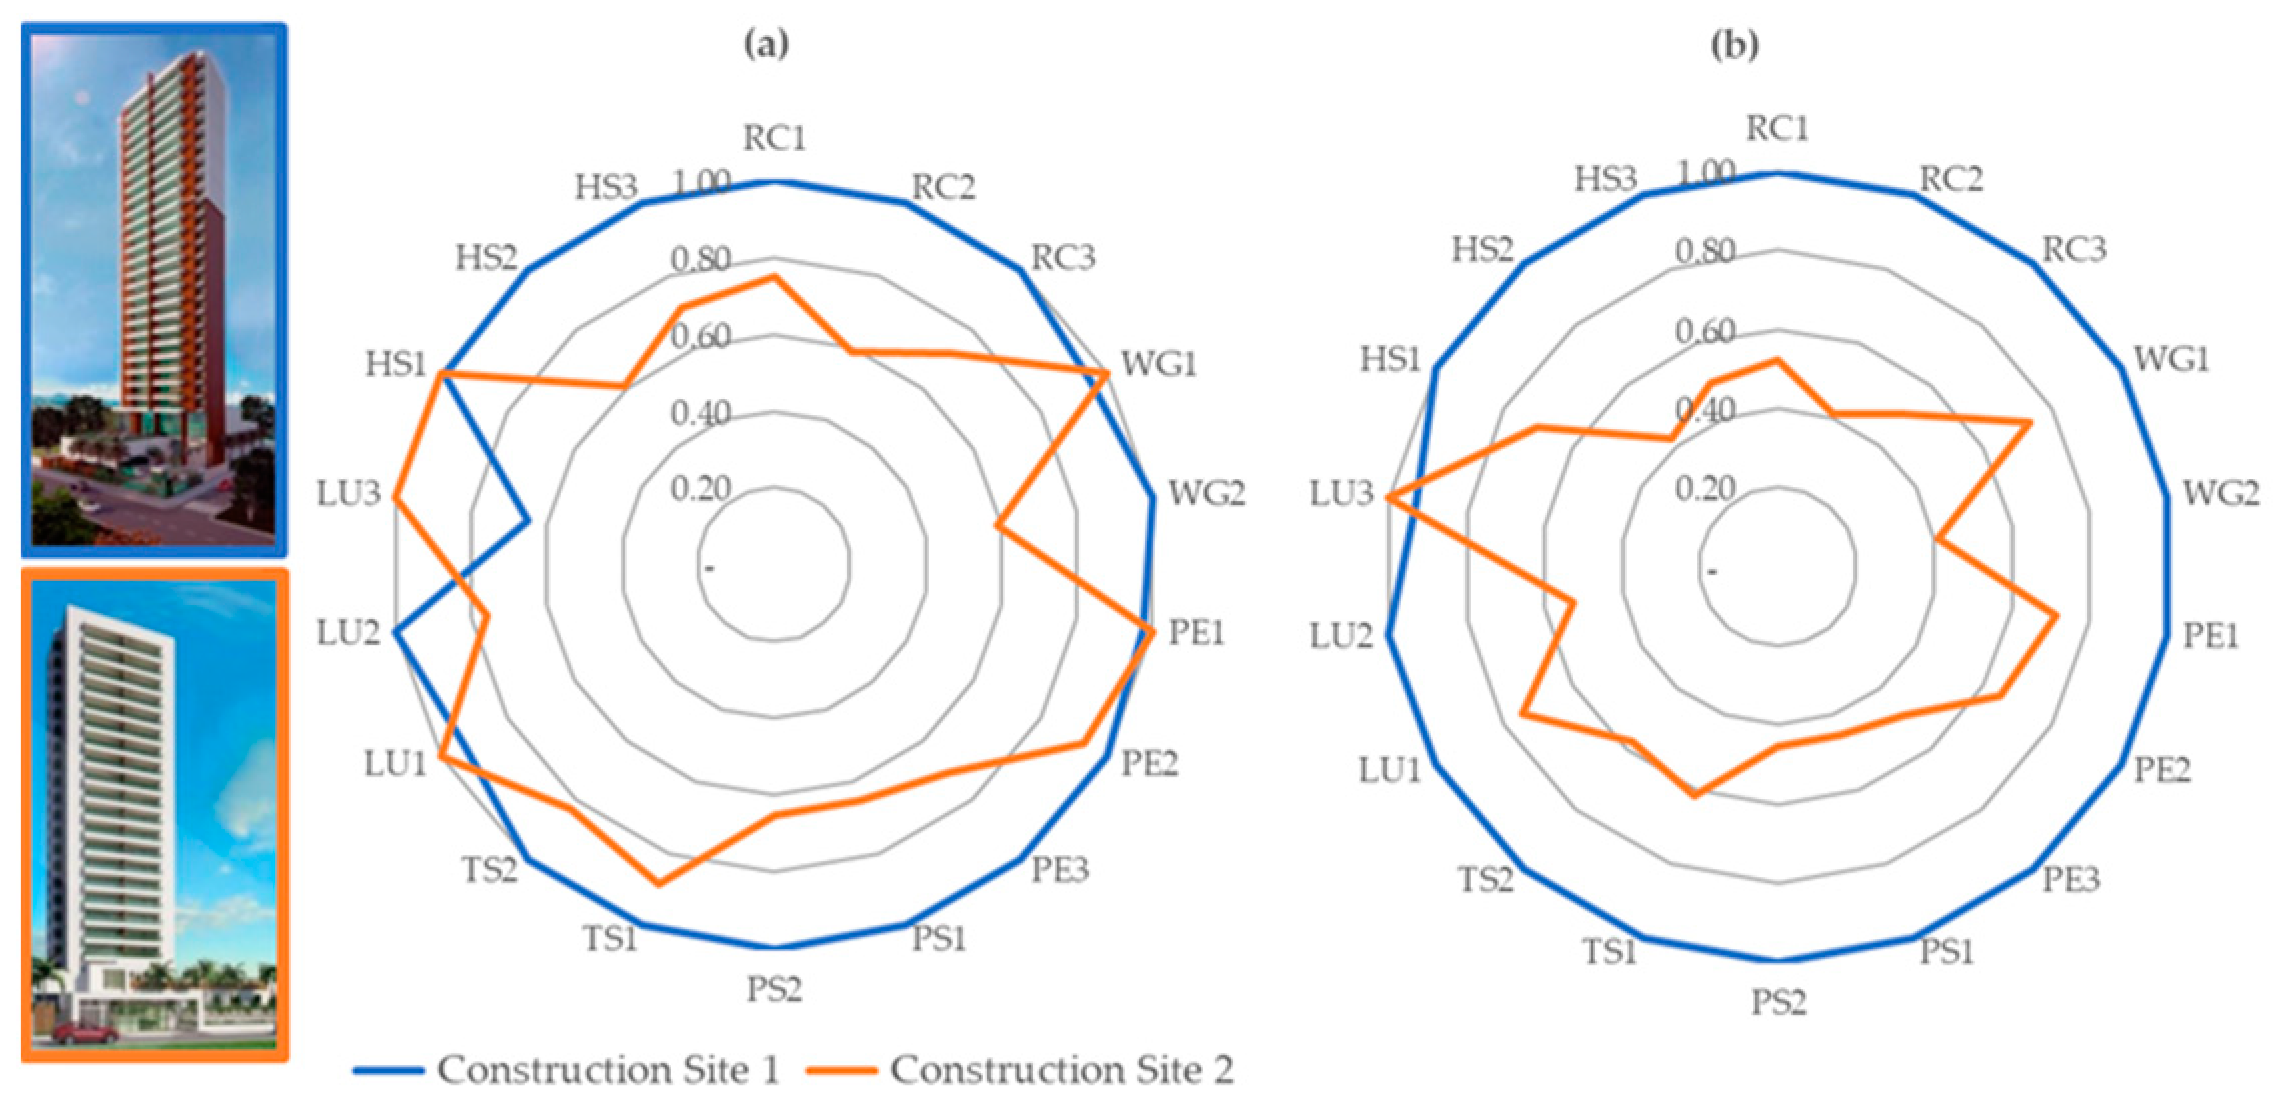
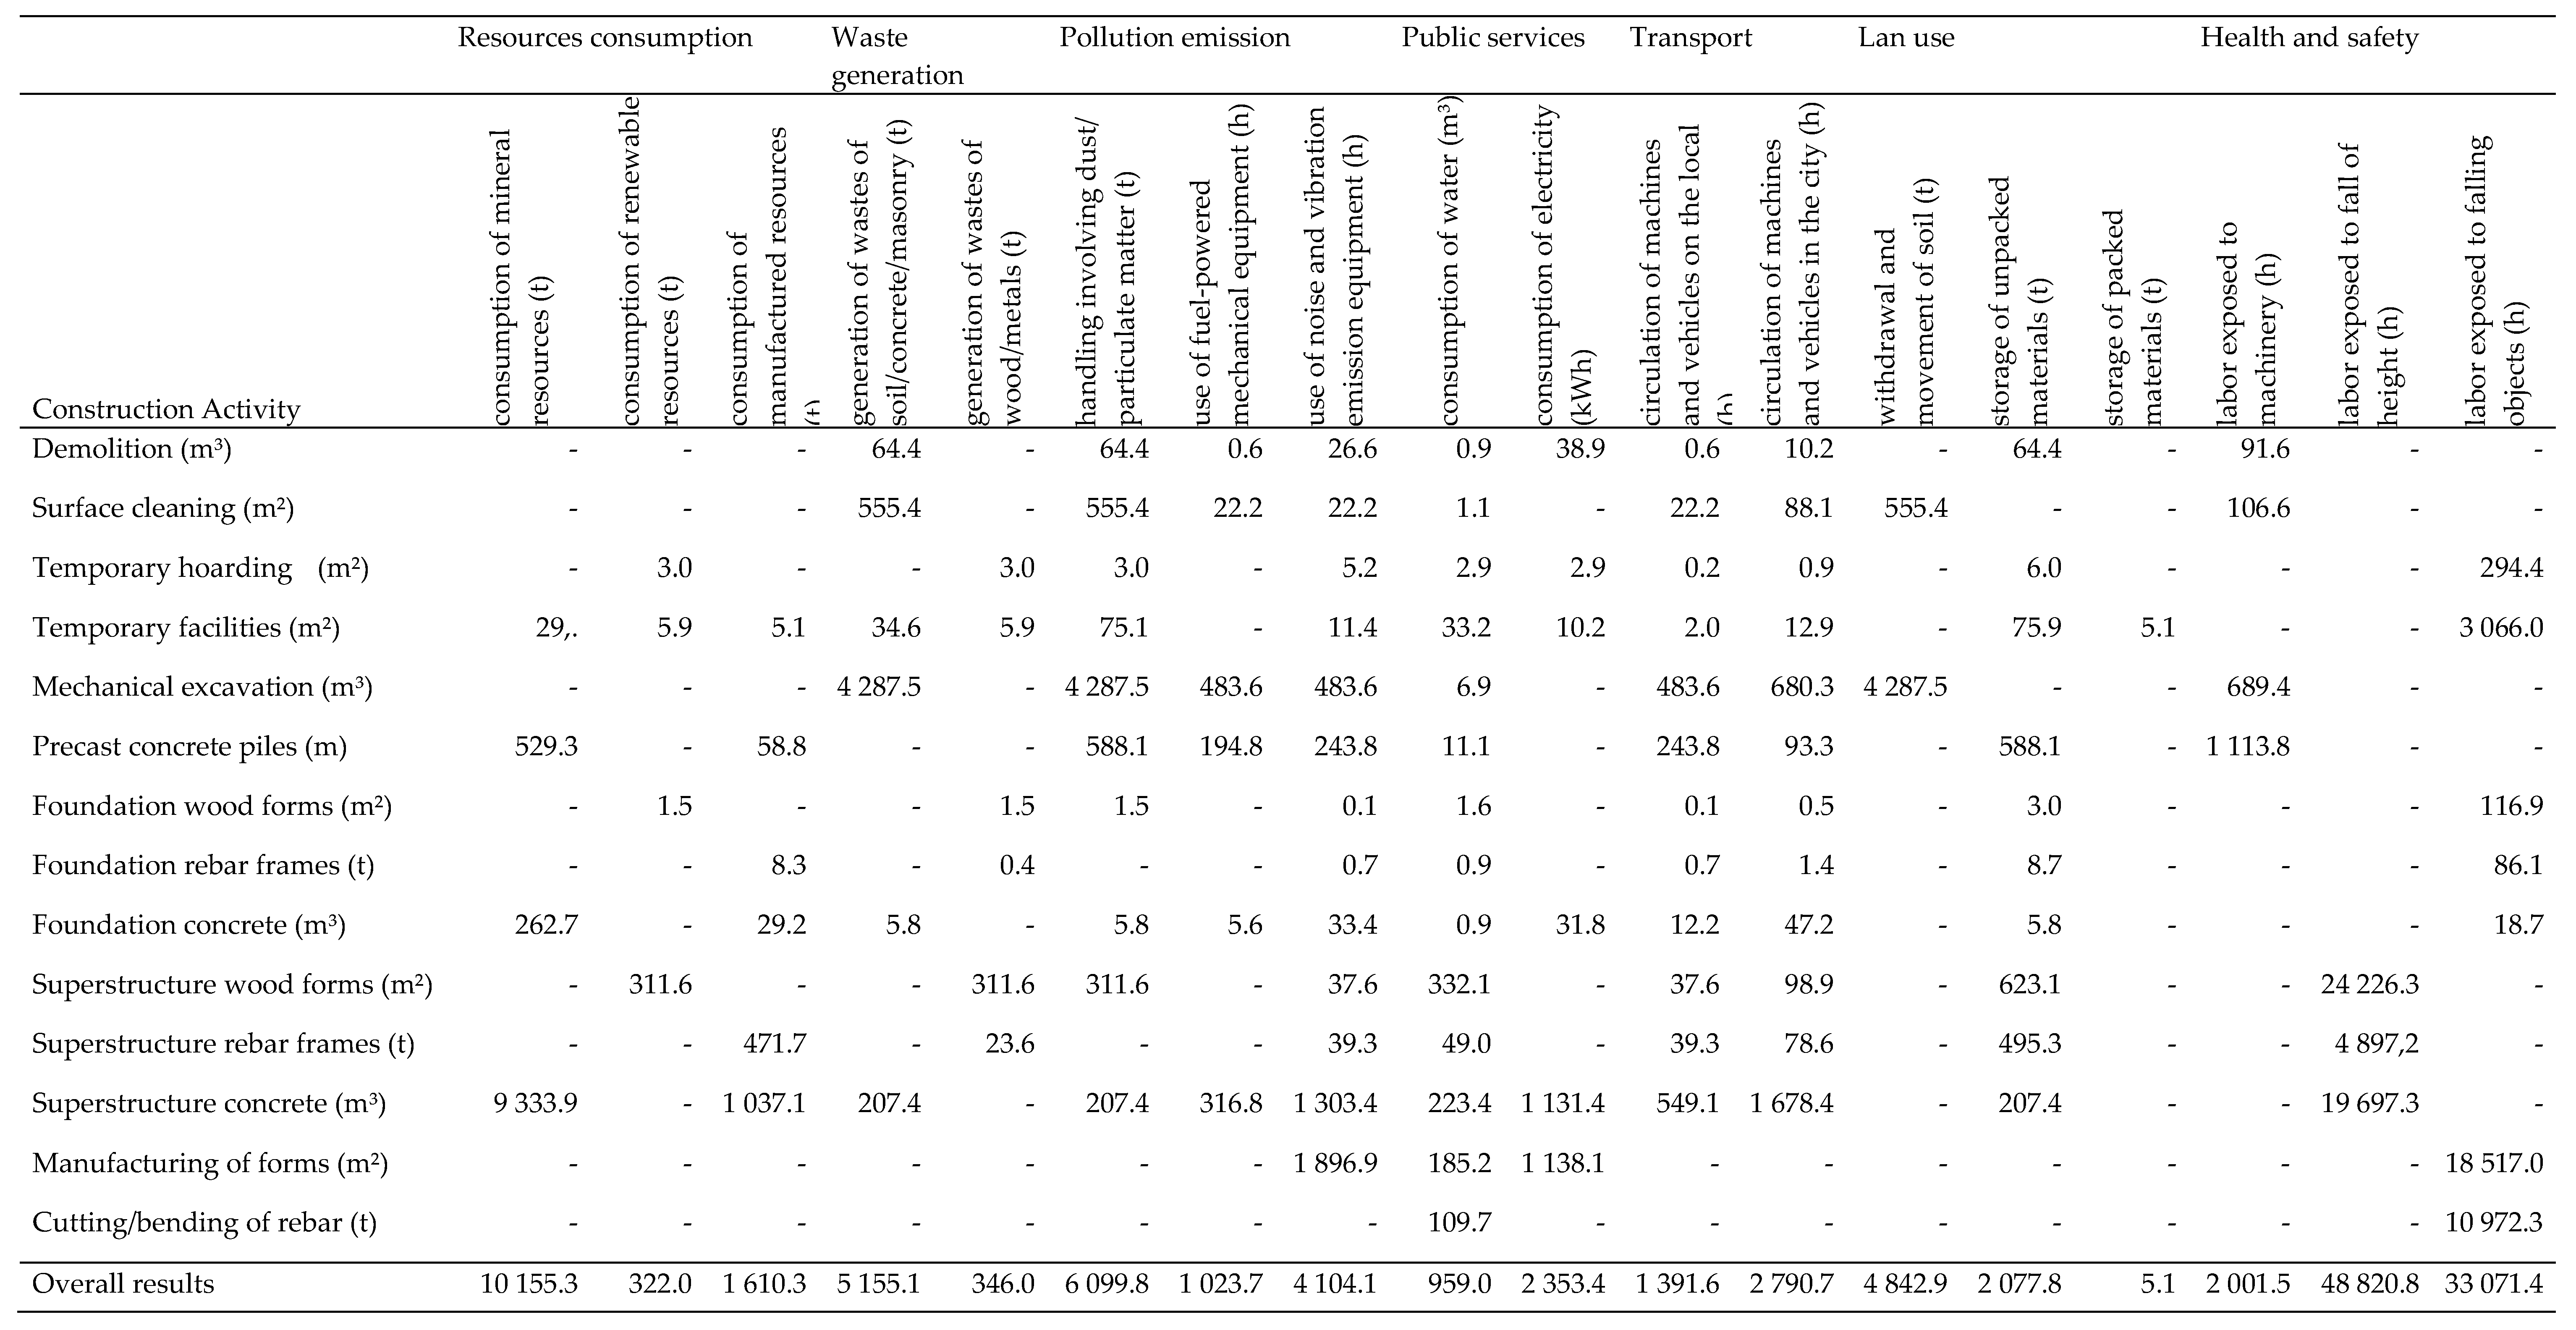
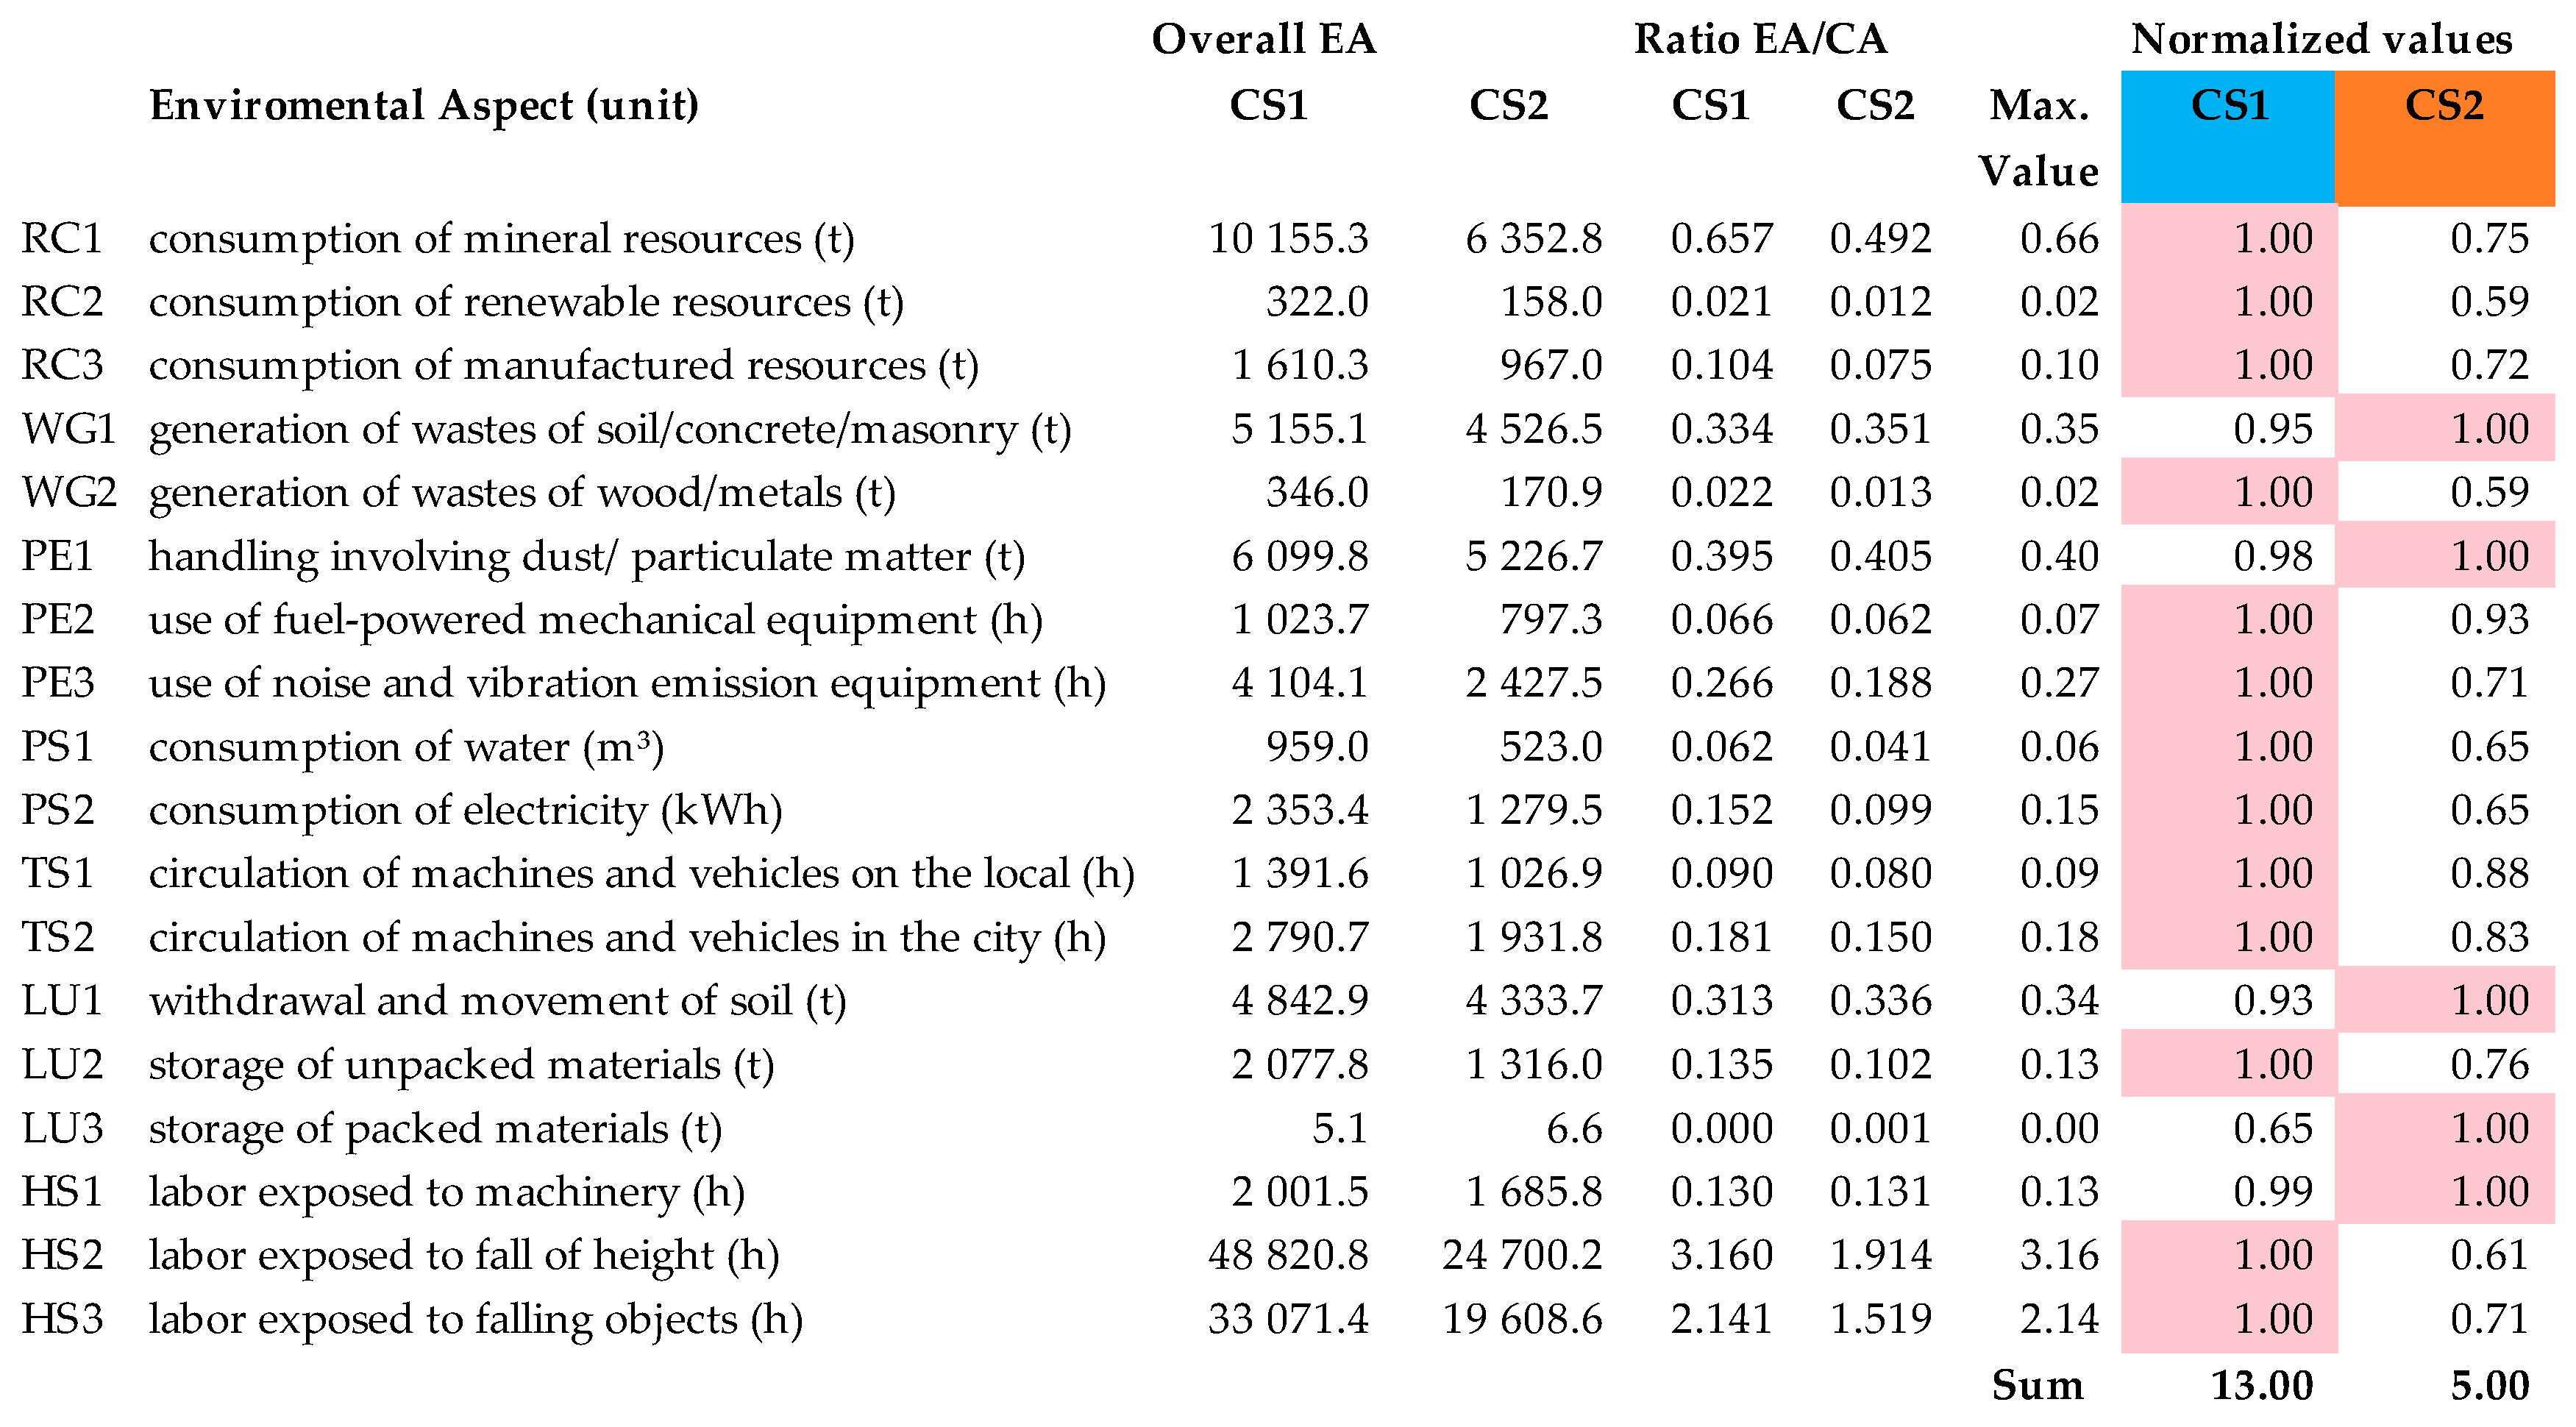
Table 1.
CDW classification in Brazil by IN IBAMA No. 13/2012 and Resolution CONAMA No. 307/2002.
| IN No. 13/2012 | Res. 307/2002 | Construction and Demolition Wastes (1) |
|---|---|---|
| 17 01 | Class A | Cement, tiles, tiles and ceramic materials. |
| 17 02 | Class B | Wood, glass, and plastic. |
| 17 03 | Class D | Bituminous mixtures, asphalt and tar products. |
| 17 04 | Class B | Metal scrap (including alloys). |
| 17 05 | Class A | Soils (including soils excavated from contaminated sites), rocks and muds. |
| 17 06 | Class D | Insulation materials and building materials containing asbestos. |
| 17 08 | Class B | Gypsum-based building materials. |
| 17 09 | Class C/D | Other construction and demolition waste |
Note: (1) Construction and demolition wastes classified as hazardous due to their origin or characteristics (e.g., flammability, corrosivity, reactivity, and toxicity) are grouped differently in IN 13 and Res. 307/2002. In IN 13, contaminated CDW are grouped under the same subchapters of a waste of similar origin. However, in Resolution 307/2002, the contaminated CDW are grouped into a single division, Class D.
Table 2.
Summary of the constructive activities by the articles identified in the review.
| Context | Reference | Construction Activities |
|---|---|---|
| China | [18] | foundation; prefabricated concrete piles; steel sheet piles; earthwork; support system building; support system demolition; foundation construction; Reinforced Concrete (RC) work-rebar; RC work-form; RC work-concrete; masonry work; structural steelwork; finish work; wall; celling; floor; transportation work. |
| [37] | earthwork and excavation; formwork; reinforcement concrete; wall; roofing, and isolation; component installation; plumbing and drainage; ornament and painting; surrounding and landscaping; waste treatment. | |
| Europe Union | [69] | site clearing; site earth-work; foundation; structure; masonry; roofing; and painting. |
| Spain | [19] | earthworks, foundations; structures; roofs; partitions and closures; impermeable membranes; insulations; coatings; pavements and door and window closures. |
| Portugal | [25] | by elements: foundation; floor; walls; roofs; windows; doors |
| German | [70] | foundations; structure; external walls; internal walls; floors and ceilings; roofs; other activities |
| Brazil | [72] | preliminary services; foundations; structure; vertical fences (masonry and coatings); horizontal fences (floors, linings, coverings and impermeability); window frames; paintings and systems. |
| [73] | demolition, surface cleaning, foundations, drainage, excavations, structure, masonry, partitions, window frames, roofing, impermeability, vertical coating, painting, flooring, building systems, underground and aerial networks, earthworks, paving and drainage. | |
| [71] | foundations (RC structure); structure (RC structure), masonry; wall covering; flooring; mortar applied; doors and windows; and roofing. | |
| [74] | surface cleaning; earthwork; foundations; structures; fences; equipment; finalizations. | |
| [75] | foundation (RC structure); structure (RC structure); masonry; wall covering; frames (doors and windows); roofing; | |
| [50] | foundation; structure; roof; wall; ceiling; doors and windows; electrical/hydraulic systems. |
Table 3.
Selected construction activities by phase and their measurement units.
| Code | Phase | Code | Activities (Measurement Unit) 1 |
|---|---|---|---|
| P01 | Site preparation | P0101 | Demolition (m3) |
| P0102 | Surface cleaning (m2) | ||
| P0103 | Temporary hoarding (m2) | ||
| P0104 | Temporary facilities (m2) | ||
| P02 | Earthwork | P0201 | Mechanical excavation (m3) |
| P03 | Foundation | P0301 | Precast concrete piles (m) |
| P0302 | Foundation wood forms (m2) | ||
| P0303 | Foundation rebar frames (t) | ||
| P0304 | Foundation concrete (m3) | ||
| P04 | Superstructure | P0401 | Superstructure wood forms (m2) |
| P0402 | Superstructure rebar frames (t) | ||
| P0403 | Superstructure concrete (m3) | ||
| P05 | Specialized services | P0501 | Manufacturing of wood forms (m2) |
| P0502 | Cutting/bending of rebar (t) |
Note: 1 The measurement units of the constructive activities followed the standard adopted by the main cost bases of the construction industry in Brazil.
Table 4.
Inputs and outputs of construction activities by category.
| Category | Resource (Measurement Unit 1) |
|---|---|
| Natural resources | sand (t), gravel (t), timber (t) |
| Manufactured resources | cement (t), ready-mix concrete (t), precast concrete (t), rebar (t) |
| Labor | work at height (mh), work at outside (mh), work at area covered (mh). |
| Facilities | pile driver (pmh), bulldozer/excavator/loader (pmh), ready-mix concrete truck (pmh), pneumatic breaker (pmh), concrete electric mixer (pmh), concrete vibrator (pmh), electric saw (pmh). |
| Waste | excavated soil (t), waste of concrete/masonry (t), waste of wood; waste of rebar (t) |
| Public services | water consumption by the process (m3) water consumption by the worker (m3), electric energy consumption (kWh) |
| Transport services | Loading and unloading time (h), materials trucking (h), waste trucking (h) |
Note: 1 productive machine-hour (pmh), man-hour (mh), kilowatt hour (kWh), cubic meter (m3), and tons (t).
Table 5.
Indicators and data sources considered for acquisition the inputs/outputs for the EAPM.
| Category | Code | Resource (Unit) | Indicator | Data Source |
|---|---|---|---|---|
| Natural resources | c1 | Sand (t) | Consumption of resources homogenized by conversion rate (if necessary) by each activity. | CYPE [82] and CBIC [88] |
| c2 | Gravel (t) | |||
| c3 | Timber (t) | |||
| Manufactured resources | c4 | Cement (t) | Consumption of resources homogenized by conversion rate (if necessary) by each activity. | CYPE [82] and CBIC [88] |
| c5 | Rebar (t) | |||
| c6 | Precast concrete (t) | |||
| c7 | Ready-mix concrete (t) | |||
| Labor 1 | c8 | Labor at height (mh) | Labor time in man-hours by activity according to productivity indicators of the Brazilian construction industry. | CYPE [82] and CBIC [88] |
| c9 | Labor with machines/vehicles (mh) | |||
| c10 | Labor with manual tools (mh) | |||
| Facilities | c11 | Pile driver (pmh) | Time estimated of productive machine hour (pmh) by activity according to productivity indicators of the Brazilian construction industry. | CYPE [82] |
| c12 | Bulldozer/excavator (pmh) | |||
| c13 | Ready-mix concrete truck (pmh) | |||
| c14 | Pneumatic breaker (pmh) | |||
| c15 | Concrete electric mixer (pmh) | |||
| c16 | Concrete vibrator (pmh) | |||
| c17 | Electric saw (pmh) | |||
| Wastes | c18 | Excavated soil (t) | Volume of excavated. | CYPE [82] |
| c19 | Waste of concrete/masonry (t) | Estimated waste rate (t.) | CYPE [82] and estimated indirect data. | |
| c20 | Waste of wood (t) | |||
| c21 | Waste of rebar (t) | |||
| Public services | c22 | Water for workers (m3) | Water consumption (m3) per man-hour (mh) per activity considering daily water consumption per worker about 80 L/day. | |
| c23 | Water to process (m3) | Estimated water consumption by activity (m3) according to water/cement ratio or water/service ratio. | water/cement ratio in CYPE [82] and consumption in BCCA [89] | |
| c24 | Electric energy (kWh) | Estimated electricity consumption according to the productive machine hour (PMH) | CYPE [82] and estimated indirect data. | |
| Transport services | c25 | Loading/unloading of materials (h) | Time of loading or unloading obtained on the auxiliary compositions. | CYPE [82] |
| c26 | Trucking of materials /waste(h) |
Note: 1 Labor classified according to the main risk of exposure (height, machinery or tools).
Table 6.
Environmental aspects by category and their contributory inputs/outputs.
| Category | Environmental Aspect | Unit 1 | Contributory Inputs/Outputs 2 (Table 5) |
|---|---|---|---|
| Resources consumption | consumption of mineral resources | t | c1, c2, c6, c7 |
| consumption of renewable resources | t | c3 | |
| consumption of manufactured resources | t | c4, c5, c6, c7 | |
| Waste generation | generation of wastes soil/concrete/masonry | t | c18, c19 |
| generation of wastes of wood or metals | t | c20, c21 | |
| Pollution emission | handling involving dust or particulate matter | t | c1, c2, c4, c6, c18, c19, c20 |
| use of fuel-powered mechanical equipment | h | c11, c12, c13 | |
| use of noise/vibration emission equipment | h | c11, c12, c13, c14, c15, c16, c17, c25 | |
| Public services | consumption of water | m3 | c22, c23 |
| consumption of electricity | kwh | c24 | |
| Transport services | circulation of machines/vehicles on the local | h | c11, c12, c13, c25 |
| circulation of machines/vehicles in the city | h | c26 | |
| Land Use | withdrawal and movement of soil | t | c18 |
| storage of unpacked materials | t | c1, c2, c3, c5, c6 | |
| storage of packed materials | t | c4 | |
| Health and safety | labor exposed to machinery | h | c9 |
| labor exposed to fall of height | h | c8 | |
| labor exposed to falling objects | h | c10 |
Note: 1 The measurement units were homogenized to allow the aggregation of the contributions of the different environmental loads (inputs and outputs) to the constructive activities considered. 2 Adapted from Shen et al. [37].
Table 7.
Description of the building according to each select construction site (CS1 and CS2).
| Characteristic | CS1 | CS2 |
|---|---|---|
| 1. Segment | residential building | residential building |
| 2. Floor numbers | 29 | 23 |
| Number of parking floors | 3 | 2 |
| Number of collective area floors | 1 | 1 |
| Number of dwelling floors | 25 | 20 |
| 3. Land area (m2) | 1844.62 | 2210.74 |
| 4. Construction area (m2) | 15,448.11 | 12,906.05 |
| Area of the parking floors (m2) | 3667.88 | 3565.02 |
| Area of the collective floors (m2) | 1774.98 | 1792.43 |
| Area of the dwelling floors (m2) | 10,005.25 | 7548.60 |
| 5. Dwelling area (m2) | 148.31 | 141.18 |
| Number of dwelling per floor | 2 | 2 |
| Number of dwellings | 50 | 40 |
| 6. Number of parking space | 153 | 140 |
| private parking space | 150 | 133 |
| parking space for visitors | 3 | 7 |
| 7. Current stage (in collecting) | Superstructure work | Coating work |
Source: Analysis of the building projects from the construction sites.
Table 8.
Description and amounts of the initial construction activities of the buildings.
| Construction Activity | Construction Site 1 (CS1) | Construction Site 2 (CS2) |
|---|---|---|
| Demolition (m3) | 42.94 | 12.00 |
| Surface cleaning (m2) | 1481.00 | 1777.93 |
| Temporary hoarding (m2) | 245.36 | 70.40 |
| Temporary facilities (m2) | 210.00 | 270.00 |
| Mechanical excavation (m3) | 3430.00 | 2933.58 |
| Precast concrete piles (m) | 4235.00 | 3584.00 |
| Foundation wood forms (m2) | 216.81 | 765.00 |
| Foundation rebar frames (t) | 7.90 | 34.24 |
| Foundation concrete (m3) | 106.13 | 230.92 |
| Superstructure wood forms (m2) | 44,946.67 | 20,803.06 |
| Superstructure rebar frames (t) | 449.28 | 212.14 |
| Superstructure concrete (m3) | 3771.27 | 2139.59 |
| Manufacturing of forms (m2) | 45,163.48 | 21,568.06 |
| Cutting/bending of rebar (t) | 457.18 | 246.38 |
Source: Analysis of the building projects from the construction sites.
Table 9.
Consumption of resources in the case study according to the EAPM.
| Resources Consumption | ||||||||
|---|---|---|---|---|---|---|---|---|
| Construction Site 1 | Construction Site 2 | |||||||
| Construction Activity | Consumption of Mineral Resources (t) | Consumption of Renewable Resources (t) | Consumption of Manufactured Resources (t) | Overall Consumption of Resources by Activity | Consumption of Mineral Resources (t) | Consumption of Renewable Resources (t) | Consumption of Manufactured Resources (t) | Overall Consumption of Resources by Activity |
| Demolition (m3) | - | - | - | - | - | - | - | - |
| Surface cleaning (m2) | - | - | - | - | - | - | - | - |
| Temporary hoarding (m2) | - | 2.98 | - | 2.98 | - | 0.86 | - | 0.86 |
| Temporary facilities (m2) | 29.43 | 5.95 | 5.15 | 40.52 | 37.84 | 7.65 | 6.62 | 52.10 |
| Mechanical excavation (m3) | - | - | - | - | - | - | - | - |
| Precast concrete piles (m) | 529.27 | - | 58.81 | 588.08 | 447.91 | - | 49.77 | 497.68 |
| Foundation wood forms (m2) | - | 1.50 | - | 1.50 | - | 5.30 | - | 5.30 |
| Foundation rebar frames (t) | - | - | 8.29 | 8.29 | - | - | 35.95 | 35.95 |
| Foundation concrete (m3) | 262.67 | - | 29.19 | 291.86 | 571.53 | - | 63.50 | 635.03 |
| Superstructure wood forms (m2) | - | 311.56 | - | 311.56 | - | 144.20 | - | 144.20 |
| Superstructure rebar frames (t) | - | - | 471.74 | 471.74 | - | - | 222.75 | 222.75 |
| Superstructure concrete (m3) | 9333.89 | - | 1037.10 | 10,370.99 | 5295.49 | - | 588.39 | 5883.87 |
| Manufacturing of forms (m2) | - | - | - | - | - | - | - | - |
| Cutting/bending of rebar (t) | - | - | - | - | - | - | - | - |
| Overall quantities (absolute) | 10,155.27 | 322.00 | 1610.28 | 12,087.54 | 6352.76 | 158.01 | 966.97 | 7477.74 |
| Overall quantities (relative) | 84% | 3% | 13% | 100% | 85% | 2% | 13% | 100% |
Table 10.
Waste generation in the case study according to the predictive EAPM.
| Waste Generation | ||||||
|---|---|---|---|---|---|---|
| Construction Site 1 | Construction Site 2 | |||||
| Construction Activity | Generation of Wastes of Soil/Concrete (t) | Generation of Wastes of Wood/Metals (t) | Overall Generation of Waste by Activity (t) | Generation of Wastes of Soil/Concrete (t) | Generation of Wastes of Wood/Metals (t) | Overall Generation of Waste by Activity (t) |
| Demolition (m3) | 64.41 | - | 64.41 | 18.00 | - | 18.00 |
| Surface cleaning (m2) | 555.38 | - | 555.38 | 666.72 | - | 666.72 |
| Temporary hoarding (m2) | - | 2.98 | 2.98 | - | 0.86 | 0.86 |
| Temporary facilities (m2) | 34.57 | 5.95 | 40.52 | 44.45 | 7.65 | 52.10 |
| Mechanical excavation (m3) | 4287.50 | - | 4287.50 | 3666.98 | - | 3666.98 |
| Precast concrete piles (m) | - | - | - | - | - | - |
| Foundation wood forms (m2) | - | 1.50 | 1.50 | - | 5.30 | 5.30 |
| Foundation rebar frames (t) | - | 0.41 | 0.41 | - | 1.80 | 1.80 |
| Foundation concrete (m3) | 5.84 | - | 5.84 | 12.70 | - | 12.70 |
| Superstructure wood forms (m2) | - | 311.56 | 311.56 | - | 144.20 | 144.20 |
| Superstructure rebar frames (t) | - | 23.59 | 23.59 | - | 11.14 | 11.14 |
| Superstructure concrete (m3) | 207.42 | - | 207.42 | 117.68 | - | 117.68 |
| Manufacturing of forms (m2) | - | - | - | - | - | - |
| Cutting/bending of rebar (t) | - | - | - | - | - | - |
| Overall quantities (absolute) | 5155.11 | 346.00 | 5501.11 | 4526.54 | 170.94 | 4697.48 |
| Overall quantities (relative) | 94% | 6% | 100% | 96% | 4% | 100% |
Table 11.
Pollution emission in the case study according to the EAPM.
| Pollution Emission | ||||||
|---|---|---|---|---|---|---|
| Construction Site 1 | Construction Site 2 | |||||
| Construction Activity | Generation of Wastes of Soil/Concrete (t) | Generation of Wastes of Wood/Metals (t) | Generation of Waste by Activity (t) | Generation of Wastes of Soil/Concrete (t) | Generation of Wastes of Wood/Metals (t) | Generation of Waste by Activity (t) |
| Demolition (m3) | 64.41 | 0.64 | 26.58 | 18.00 | 0.18 | 7.43 |
| Surface cleaning (m2) | 555.38 | 22.22 | 22.22 | 666.72 | 26.67 | 26.67 |
| Temporary hoarding (m2) | 2.98 | - | 5.16 | 0.86 | - | 1.48 |
| Temporary facilities (m2) | 75.09 | - | 11.37 | 96.55 | - | 14.62 |
| Mechanical excavation (m3) | 4287.50 | 483.63 | 483.63 | 3666.98 | 413.64 | 413.64 |
| Precast concrete piles (m) | 588.08 | 194.81 | 243.82 | 497.68 | 164.86 | 206.34 |
| Foundation wood forms (m2) | 1.50 | - | 0.13 | 5.30 | - | 0.44 |
| Foundation rebar frames (t) | - | - | 0.69 | - | - | 3.00 |
| Foundation concrete (m3) | 5.84 | 5.62 | 33.39 | 12.70 | 12.24 | 72.65 |
| Superstructure wood forms (m2) | 311.56 | - | 37.60 | 144.20 | - | 17.40 |
| Superstructure rebar frames (t) | - | - | 39.31 | - | - | 18.56 |
| Superstructure concrete (m3) | 207.42 | 316.79 | 1303.35 | 117.68 | 179.73 | 739.44 |
| Manufacturing of forms (m2) | - | - | 1896.87 | - | - | 905.86 |
| Cutting/bending of rebar (t) | - | - | - | - | - | - |
| Overall quantities (absolute) | 6099.77 | 1023.71 | 4104.09 | 5226.68 | 797.31 | 2427.51 |
Table 12.
Public Services and Transport in the case study according to the EAPM.
| Public Services | Transport Services | |||||||
|---|---|---|---|---|---|---|---|---|
| CS1 | CS2 | CS1 | CS2 | |||||
| Construction Activity | Consumption of Water (m3) | Consumption of Electricity (kWh) | Consumption of Water (m3) | Consumption of Electricity (kWh) | Circulation of Machines and Vehicles on the Local (h) | Circulation of Machines and Vehicles in the City (h) | Circulation of Machines and Vehicles on the Local (h) | Circulation of Machines and Vehicles in the City (h) |
| Demolition (m3) | 0.92 | 38.90 | 0.26 | 10.87 | 0.64 | 10.22 | 0.18 | 2.86 |
| Surface cleaning (m2) | 1.07 | - | 1.28 | - | 22.22 | 88.12 | 26.67 | 105.79 |
| Temporary hoarding (m2) | 2.94 | 2.94 | 0.84 | 0.84 | 0.25 | 0.95 | 0.07 | 0.27 |
| Temporary facilities (m2) | 33.23 | 10.24 | 42.73 | 13.16 | 2.02 | 12.86 | 2.60 | 16.53 |
| Mechanical excavation (m3) | 6.89 | - | 5.90 | - | 483.63 | 680.28 | 413.64 | 581.83 |
| Precast concrete piles (m) | 11.14 | - | 9.43 | - | 243.82 | 93.31 | 206.34 | 78.97 |
| Foundation wood forms (m2) | 1.60 | - | 5.65 | - | 0.13 | 0.48 | 0.44 | 1.68 |
| Foundation rebar frames (t) | 0.86 | - | 3.73 | - | 0.69 | 1.38 | 3.00 | 5.99 |
| Foundation concrete (m3) | 0.93 | 31.84 | 2.02 | 69.28 | 12.16 | 47.23 | 26.46 | 102.77 |
| Superstructure wood (m2) | 332.16 | - | 153.73 | - | 37.60 | 98.87 | 17.40 | 45.76 |
| Superstructure rebar (t) | 48.97 | - | 23.12 | - | 39.31 | 78.59 | 18.56 | 37.11 |
| Superstructure concrete (m3) | 223.37 | 1131.38 | 126.73 | 641.88 | 549.10 | 1678.44 | 311.52 | 952.25 |
| Manufacturing of forms (m2) | 185.17 | 1138.12 | 88.43 | 543.52 | - | - | - | - |
| Cutting/bending of rebar (t) | 109.72 | - | 59.13 | - | - | - | - | - |
| Overall quantities | 958.98 | 2353.42 | 522.98 | 1279.55 | 1391.56 | 2790.73 | 1026.88 | 1931.80 |
| Rate per construction area | 0.06 | 0.15 | 0.04 | 0.10 | 0.09 | 0.18 | 0.08 | 0.15 |
| Rate per land area | 0.52 | 1.28 | 0.24 | 0.58 | 0.75 | 1.51 | 0.46 | 0.87 |
Table 13.
Environmental aspects of the land use according to the EAPM.
| Land Use | ||||||
|---|---|---|---|---|---|---|
| Construction Site 1 | Construction Site 2 | |||||
| Construction Activity | Withdrawal and Movement of Soil (t) | Storage of Unpacked Materials (t) | Storage of Packed Materials (t) | Withdrawal and Movement of Soil (t) | Storage of Unpacked Materials (t) | Storage of Packed Materials (t) |
| Demolition (m3) | - | 64.41 | - | - | 18.00 | - |
| Surface cleaning (m2) | 555.38 | - | - | 666.72 | - | - |
| Temporary hoarding (m2) | - | 5.94 | - | - | 1.71 | - |
| Temporary facilities (m2) | - | 75.90 | 5.15 | - | 97.58 | 6.62 |
| Mechanical excavation (m3) | 4287.50 | - | - | 3666.98 | - | - |
| Precast concrete piles (m) | - | 588.08 | - | - | 497.68 | - |
| Foundation wood forms (m2) | - | 3.01 | - | - | 10.61 | - |
| Foundation rebar frames (t) | - | 8.71 | - | - | 37.75 | - |
| Foundation concrete (m3) | - | 5.84 | - | - | 12.70 | - |
| Superstructure wood forms (m2) | - | 623.13 | - | - | 288.41 | - |
| Superstructure rebar frames (t) | - | 495.33 | - | - | 233.88 | - |
| Superstructure concrete (m3) | - | 207.42 | - | - | −117.68 | - |
| Manufacturing of forms (m2) | - | - | - | - | - | - |
| Cutting/bending of rebar (t) | - | - | - | - | - | - |
| Overall quantities (absolute) | 4842.88 | 2077.79 | 5.15 | 4333.70 | 1316.00 | 6.62 |
| Rate per construction area | 0.31 | 0.13 | 0.00 | 0.34 | 0.10 | 0.00 |
| Rate per land area | 2.62 | 1.13 | 0.00 | 1.96 | 0.60 | 0.00 |
Table 14.
Environmental aspects of the health and safety according to the EAPM.
| Health and Safety | ||||||
|---|---|---|---|---|---|---|
| Construction Site 1 | Construction Site 2 | |||||
| Construction Activity | Labor Exposed to Machinery (h) | Labor Exposed to Fall of Height (h) | Labor Exposed to Falling Objects (h) | Labor Exposed to Machinery (h) | Labor Exposed to Fall of Height (h) | Labor Exposed to Falling Objects (h) |
| Demolition (m3) | 91.59 | - | - | 25.60 | - | - |
| Surface cleaning (m2) | 106.63 | - | - | 128.01 | - | - |
| Temporary hoarding (m2) | - | - | 294.43 | - | - | 84.48 |
| Temporary facilities (m2) | - | - | 3066.00 | - | - | 3942.00 |
| Mechanical excavation (m3) | 689.43 | - | - | 589.65 | - | - |
| Precast concrete piles (m) | 1113.81 | - | - | 942.59 | - | - |
| Foundation wood forms (m2) | - | - | 116.86 | - | - | 412.34 |
| Foundation rebar frames (t) | - | - | 86.10 | - | - | 373.19 |
| Foundation concrete (m3) | - | - | 18.68 | - | - | 40.64 |
| Superstructure wood forms (m2) | - | 24,226.26 | - | - | 11,212.85 | - |
| Superstructure rebar frames (t) | - | 4897.16 | - | - | 2312.32 | - |
| Superstructure concrete (m3) | - | 19,697.34 | - | - | 11,175.08 | - |
| Manufacturing of forms (m2) | - | - | 18,517.03 | - | - | 8842.91 |
| Cutting/bending of rebar (t) | - | - | 10,970.32 | - | - | 5913.03 |
| Overall quantities (absolute) | 2001.45 | 48,820.76 | 33,071.41 | 1685.85 | 24,700.24 | 19,608.58 |
| Overall quantities (relatives) | 2% | 58% | 39% | 4% | 54% | 43% |
© 2018 by the authors. Licensee MDPI, Basel, Switzerland. This article is an open access article distributed under the terms and conditions of the Creative Commons Attribution (CC BY) license (http://creativecommons.org/licenses/by/4.0/).
Share and Cite
MDPI and ACS Style
Borja, L.C.A.; César, S.F.; Cunha, R.D.A.; Kiperstok, A. A Quantitative Method for Prediction of Environmental Aspects in Construction Sites of Residential Buildings. Sustainability 2018, 10, 1870. https://doi.org/10.3390/su10061870
AMA Style
Borja LCA, César SF, Cunha RDA, Kiperstok A. A Quantitative Method for Prediction of Environmental Aspects in Construction Sites of Residential Buildings. Sustainability. 2018; 10(6):1870. https://doi.org/10.3390/su10061870
Chicago/Turabian StyleBorja, Luis Claudio A., Sandro Fábio César, Rita Dione A. Cunha, and Asher Kiperstok. 2018. "A Quantitative Method for Prediction of Environmental Aspects in Construction Sites of Residential Buildings" Sustainability 10, no. 6: 1870. https://doi.org/10.3390/su10061870
Note that from the first issue of 2016, this journal uses article numbers instead of page numbers. See further details here.