Participatory Climate Change Impact Assessment in Three Czech Cities: The Case of Heatwaves

 , ,
, ,
Abstract
:1. Introduction
2. Materials and Methods
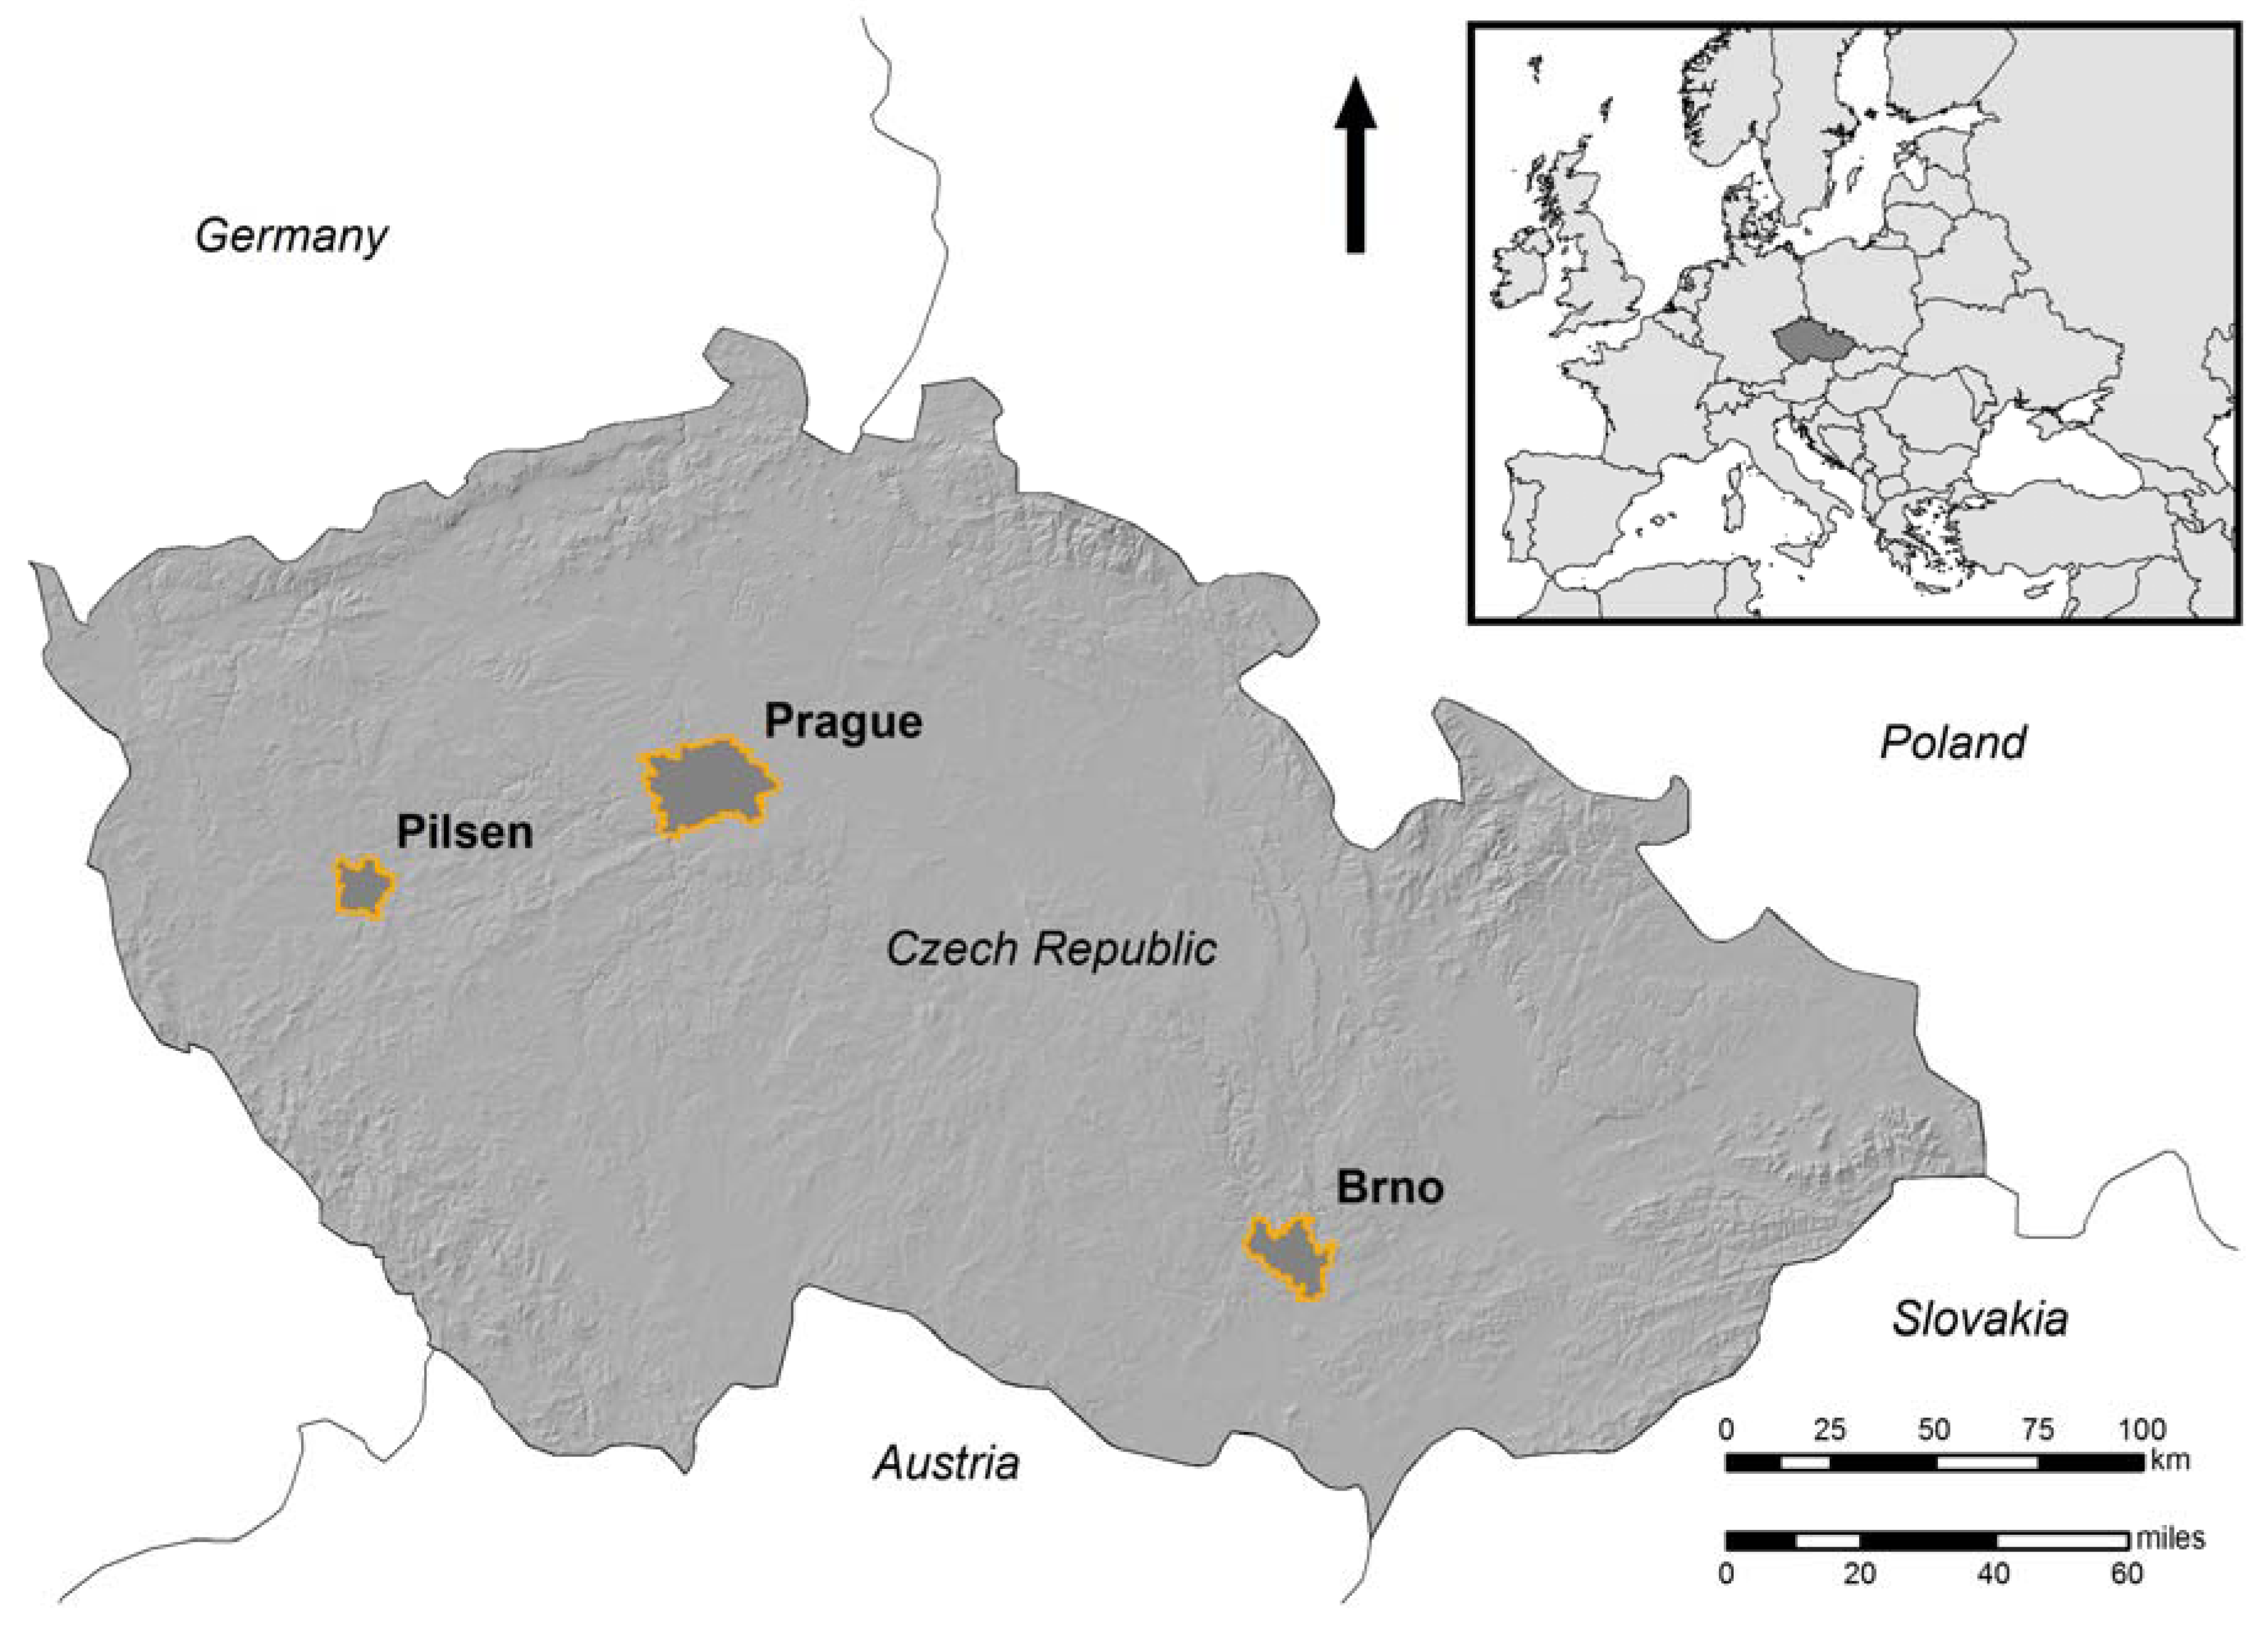
2.1. Case-Study Cities—Prague, Pilsen, and Brno
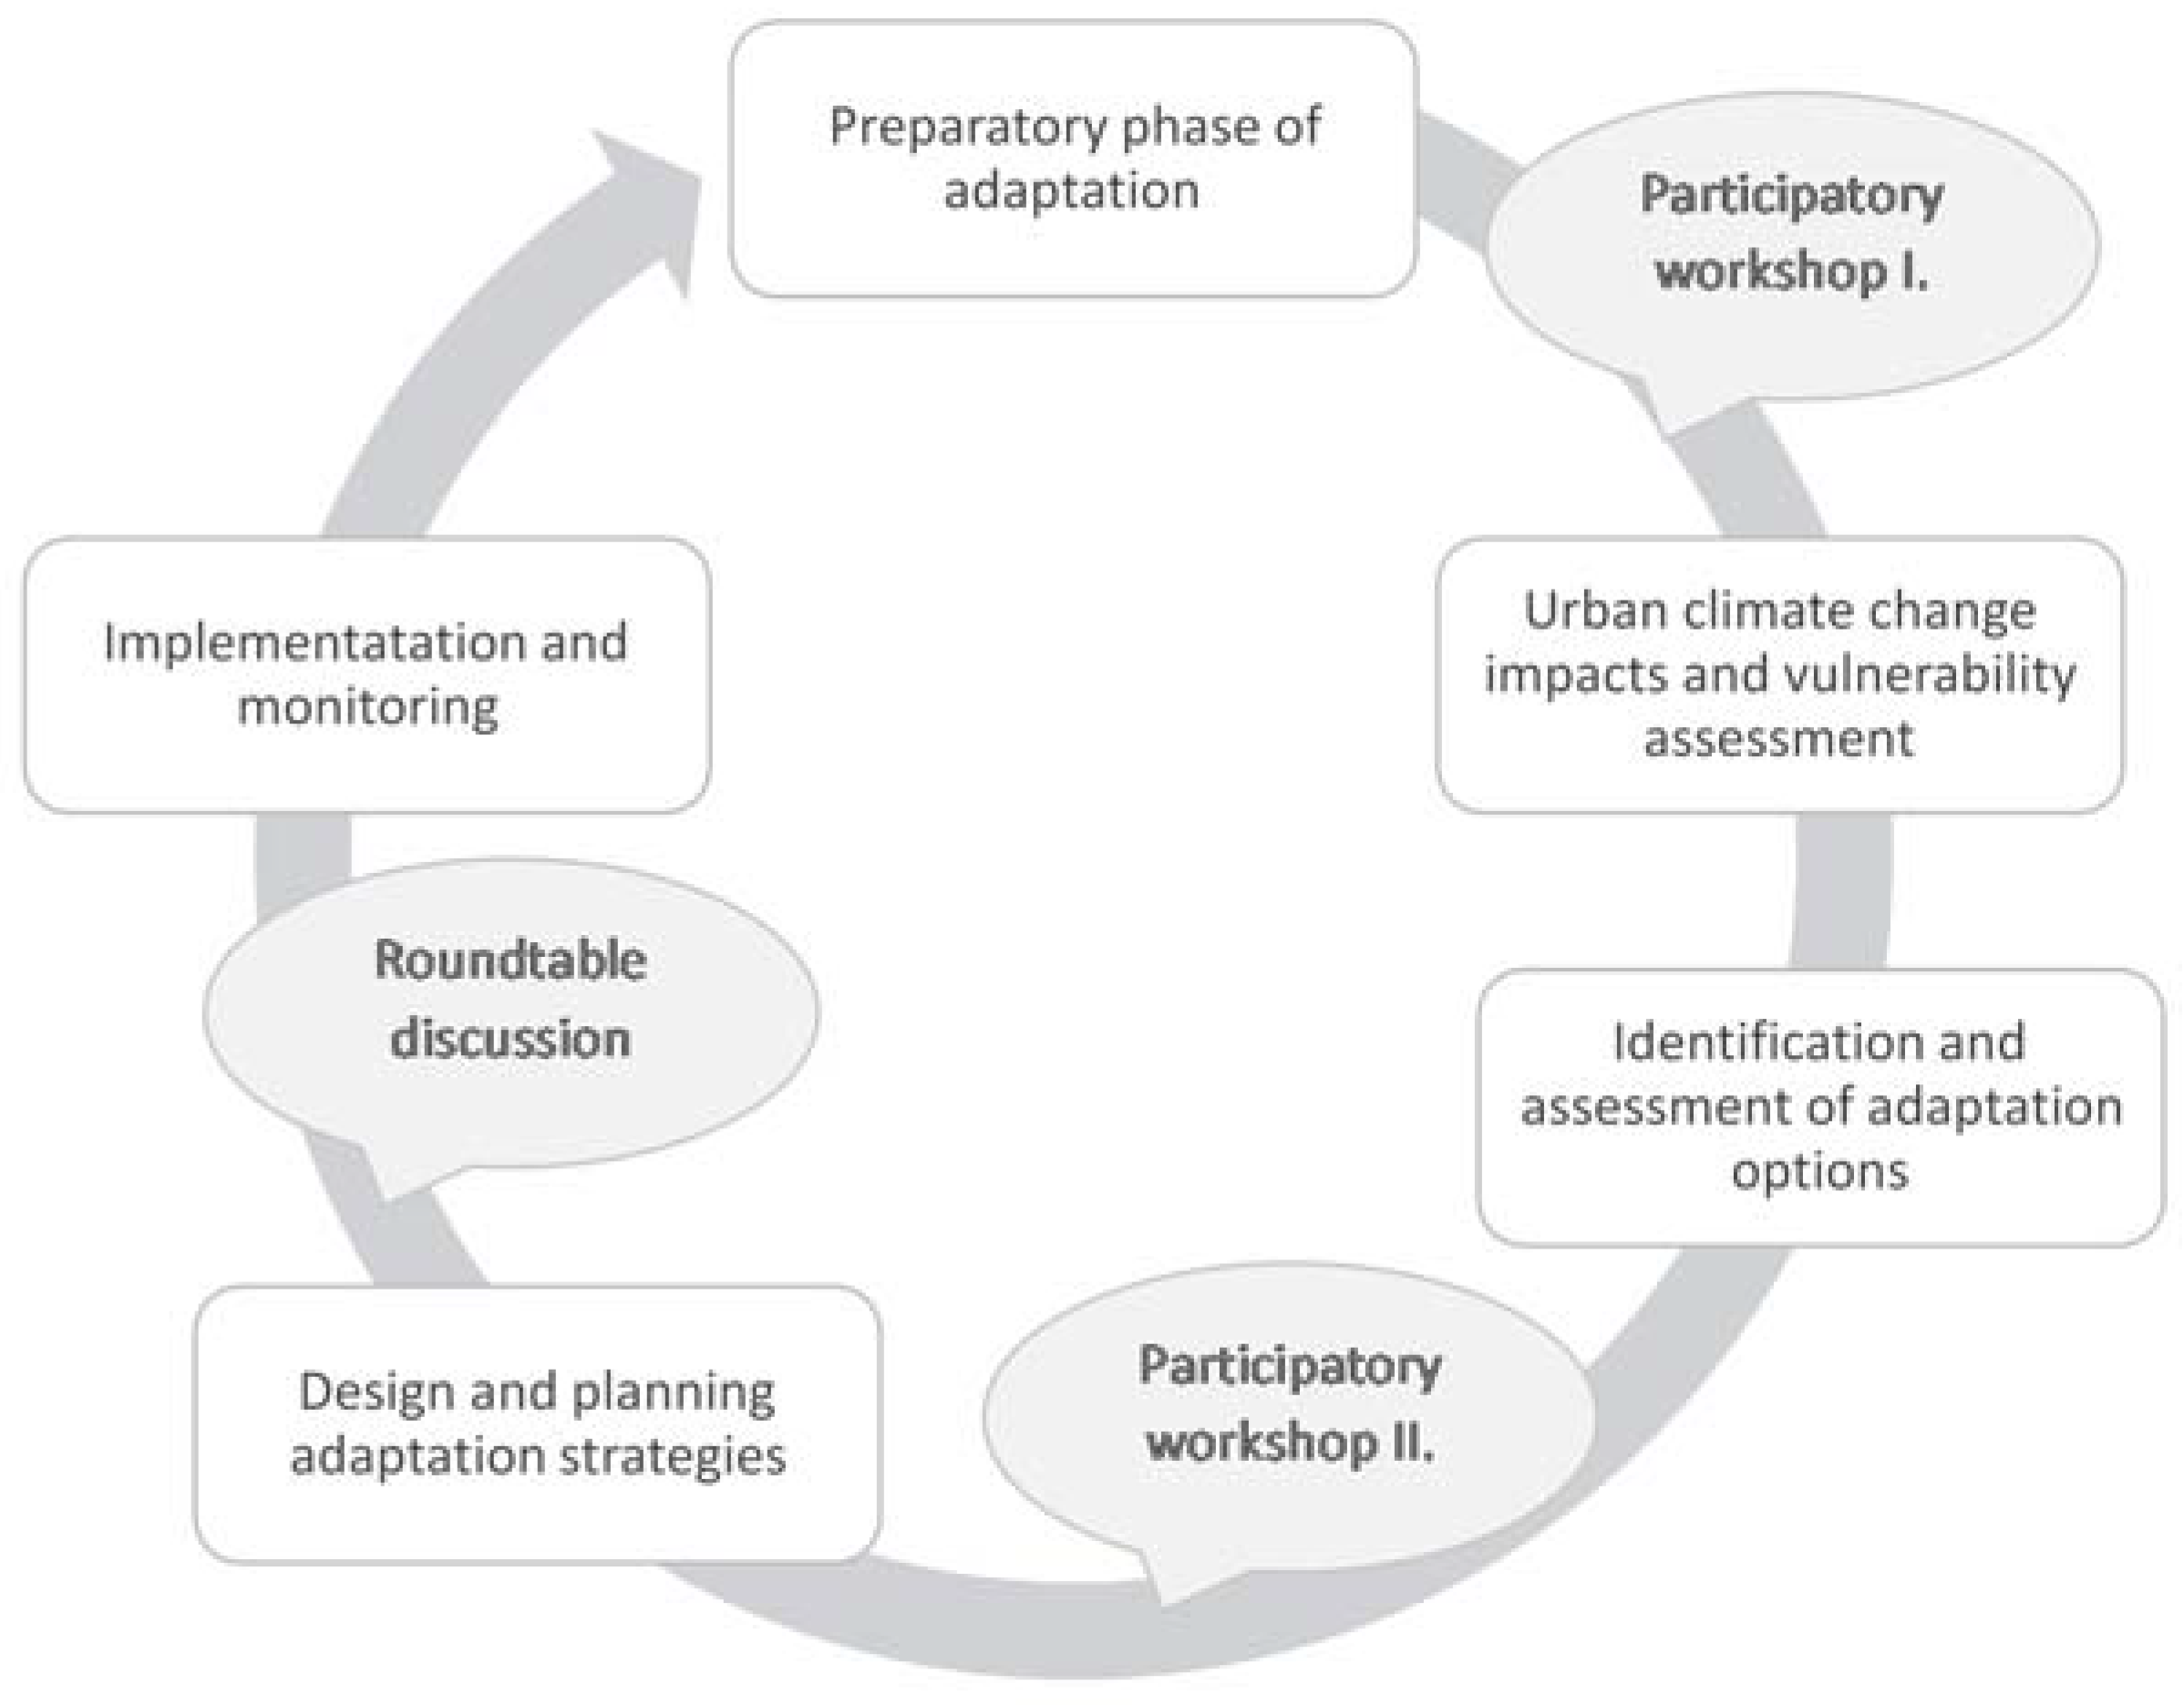
2.2. Stakeholder Participation in Vulnerability Assessment
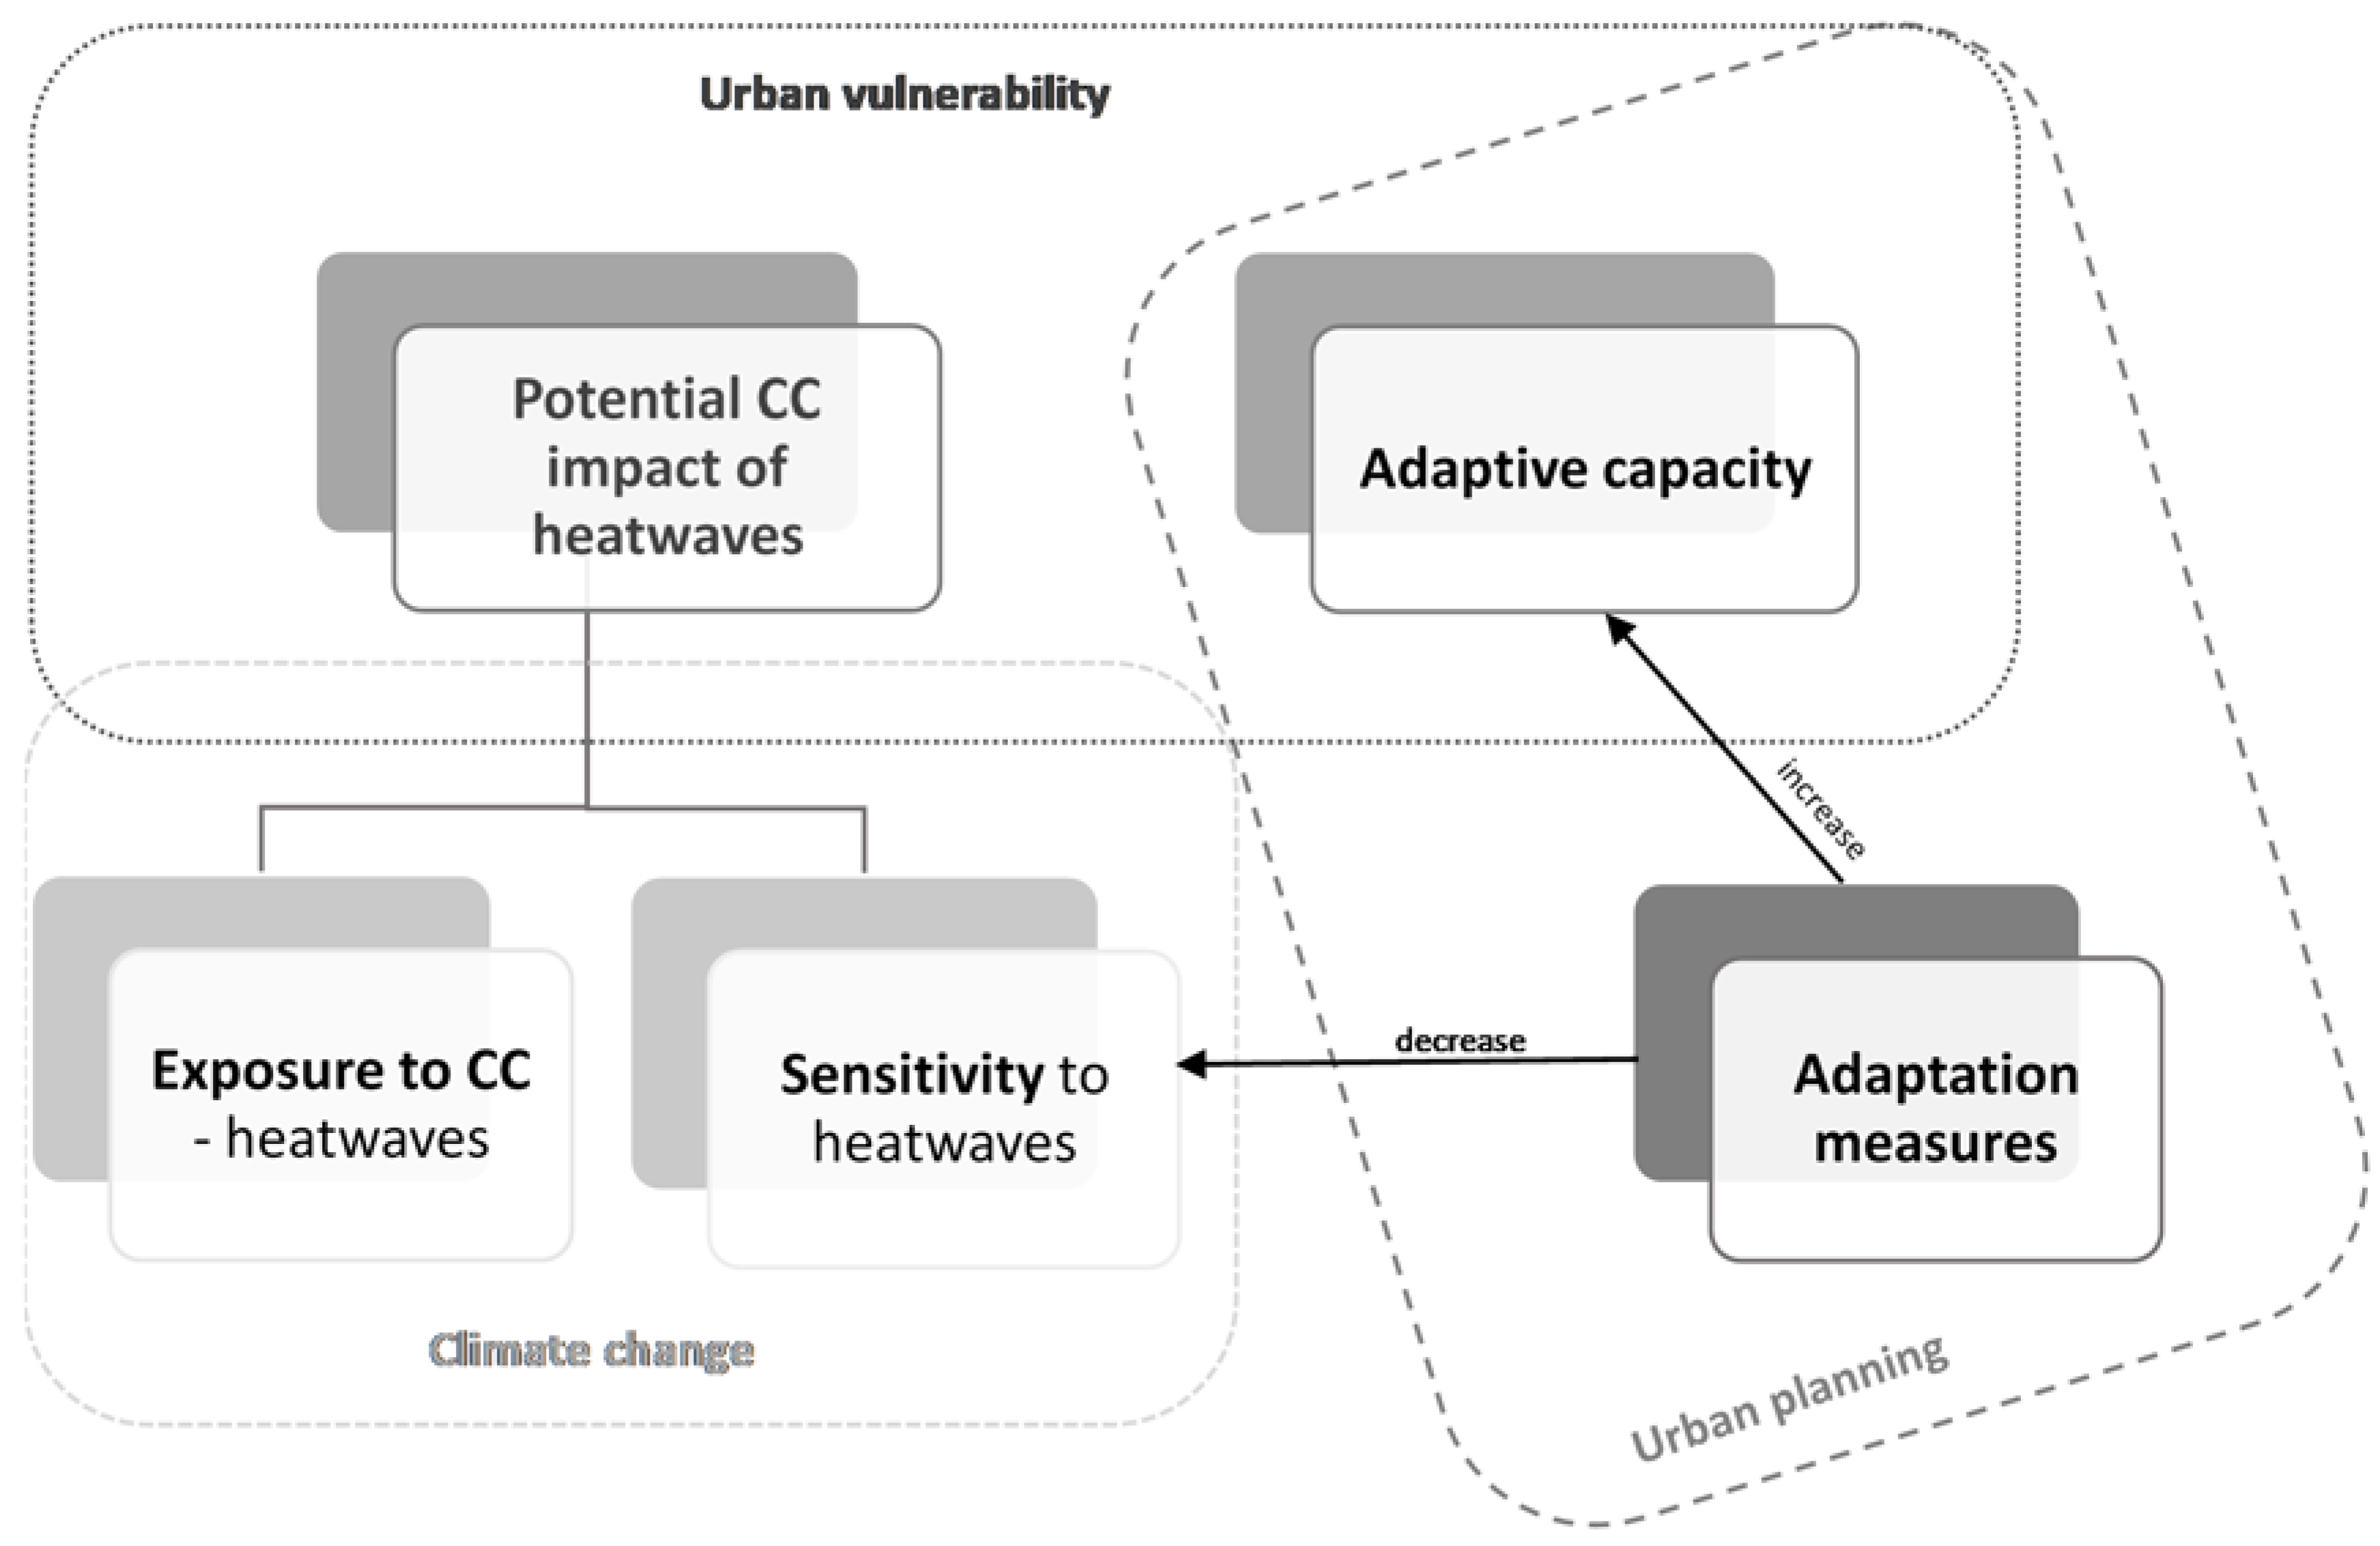
2.3. Vulnerability Assessment Framework
2.4. Input Data and Climate Modeling
2.5. A Spatially Explicit Method Assessing the Impact of Heatwaves in the Cities
3. Results
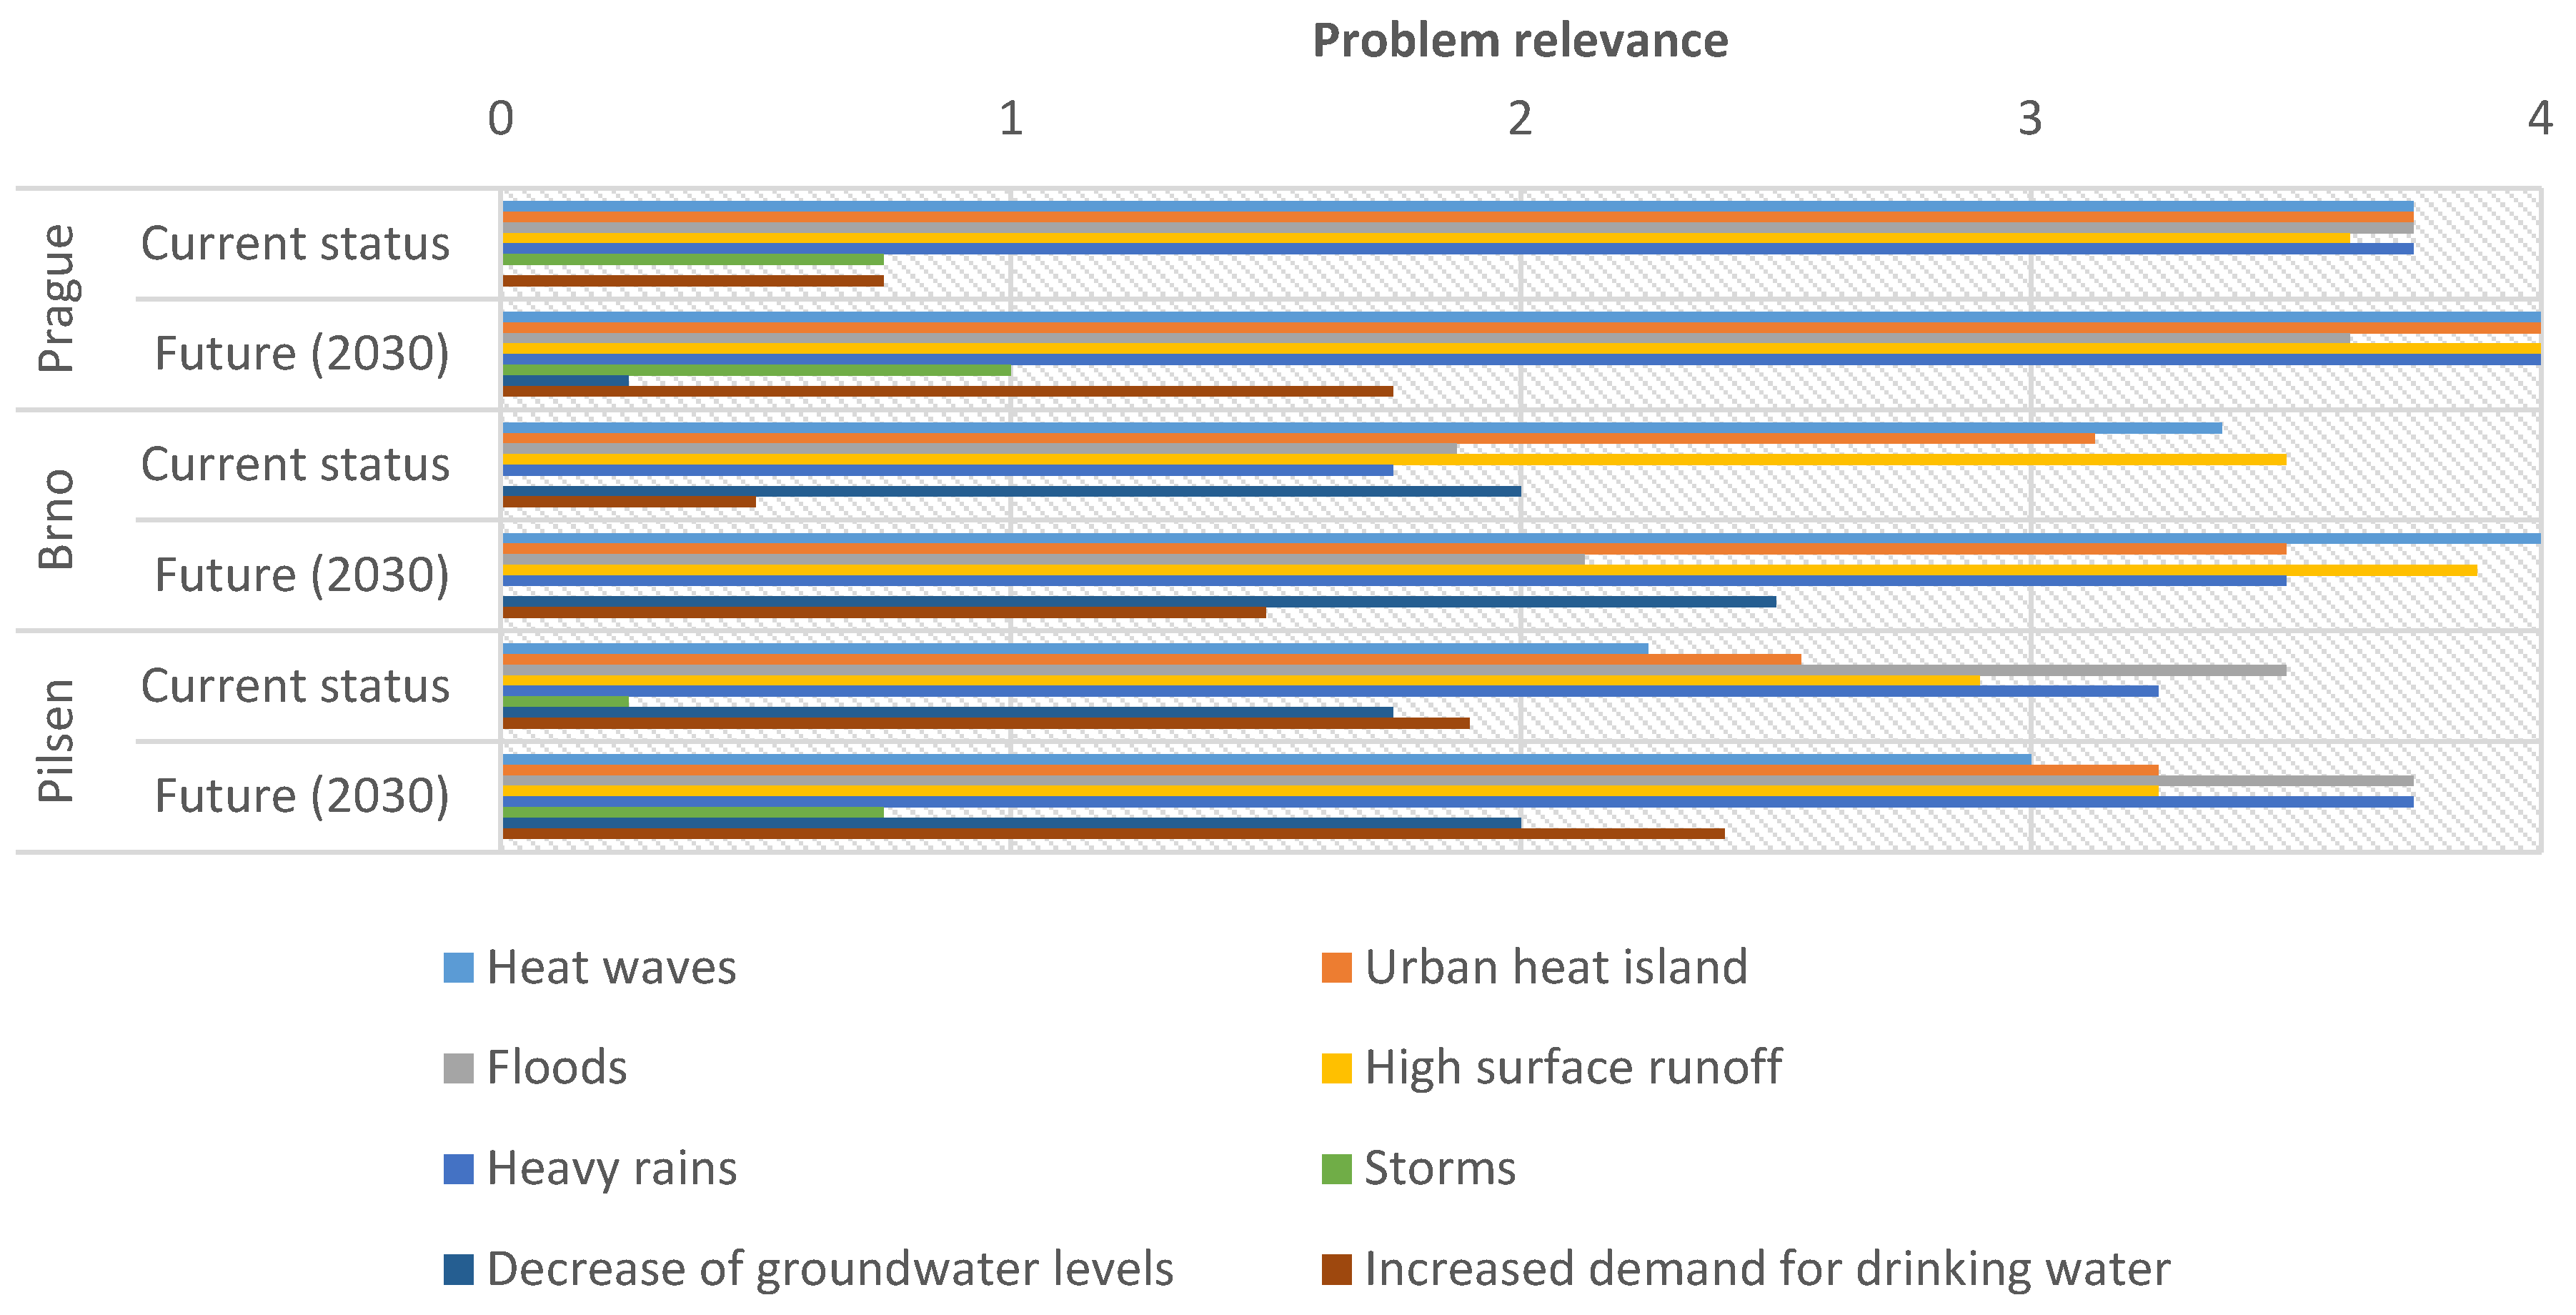
3.1. Stakeholders’ Assessment of Climate Change-Related Problems
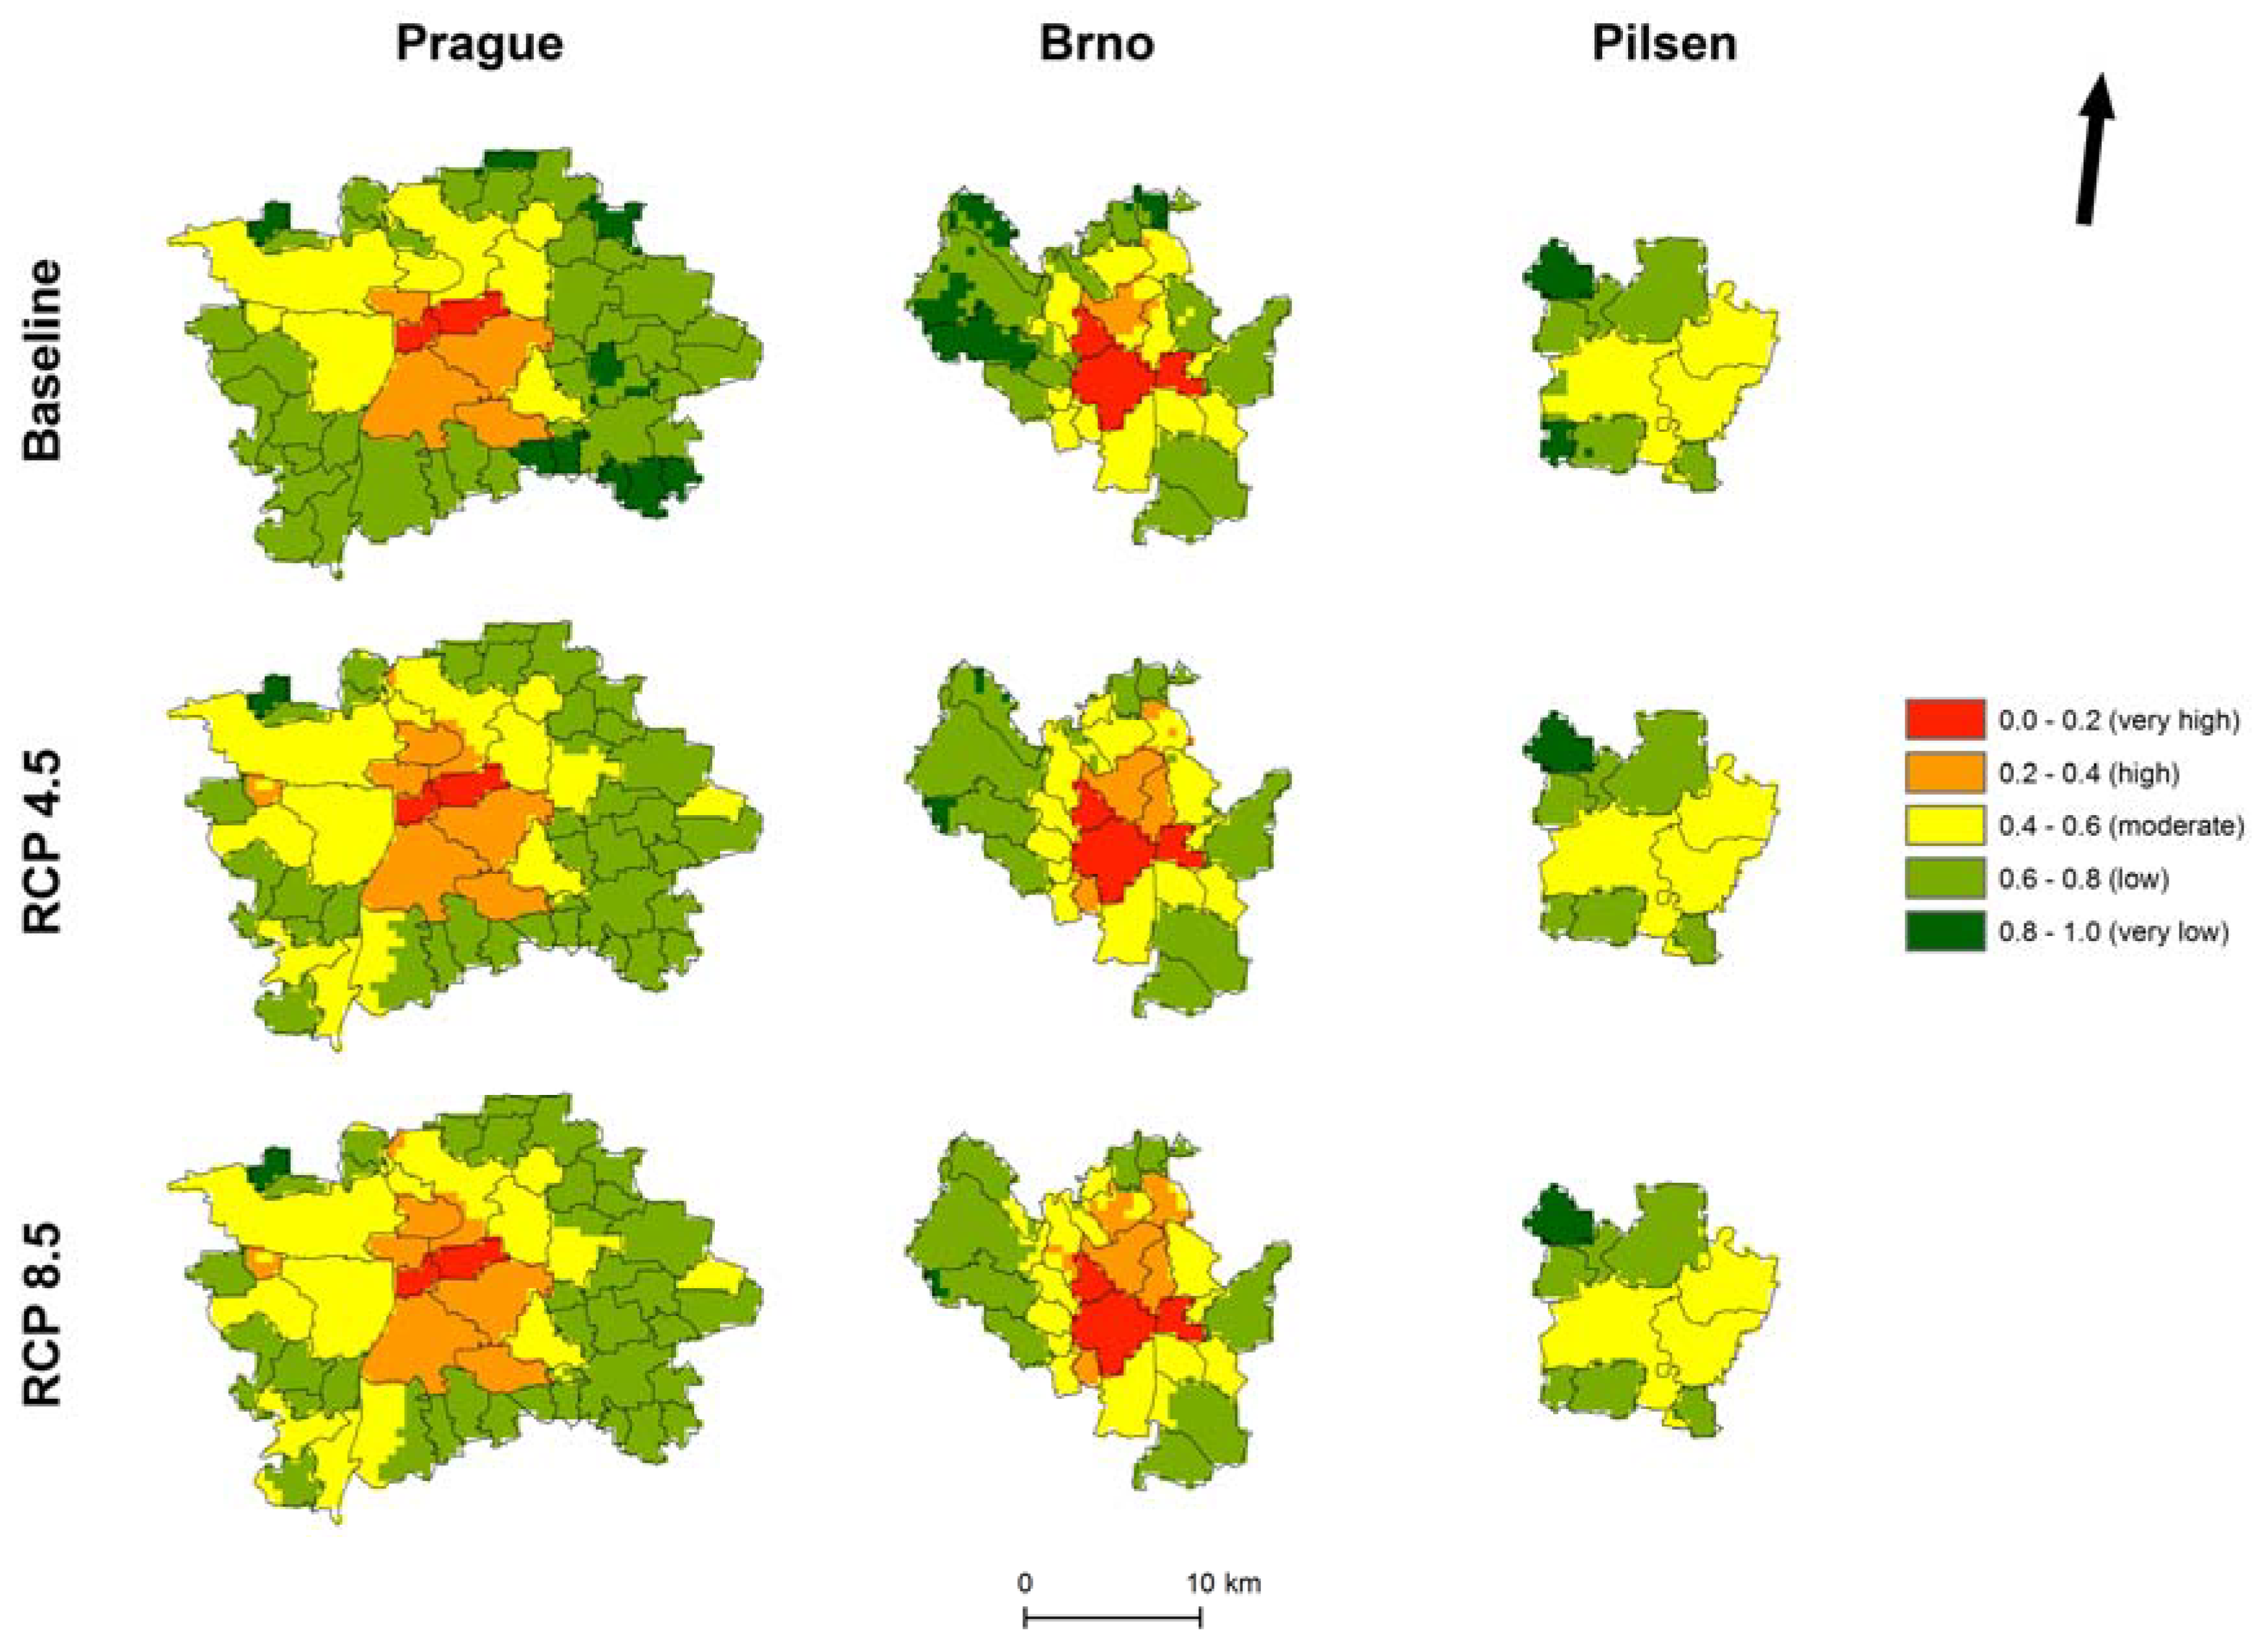
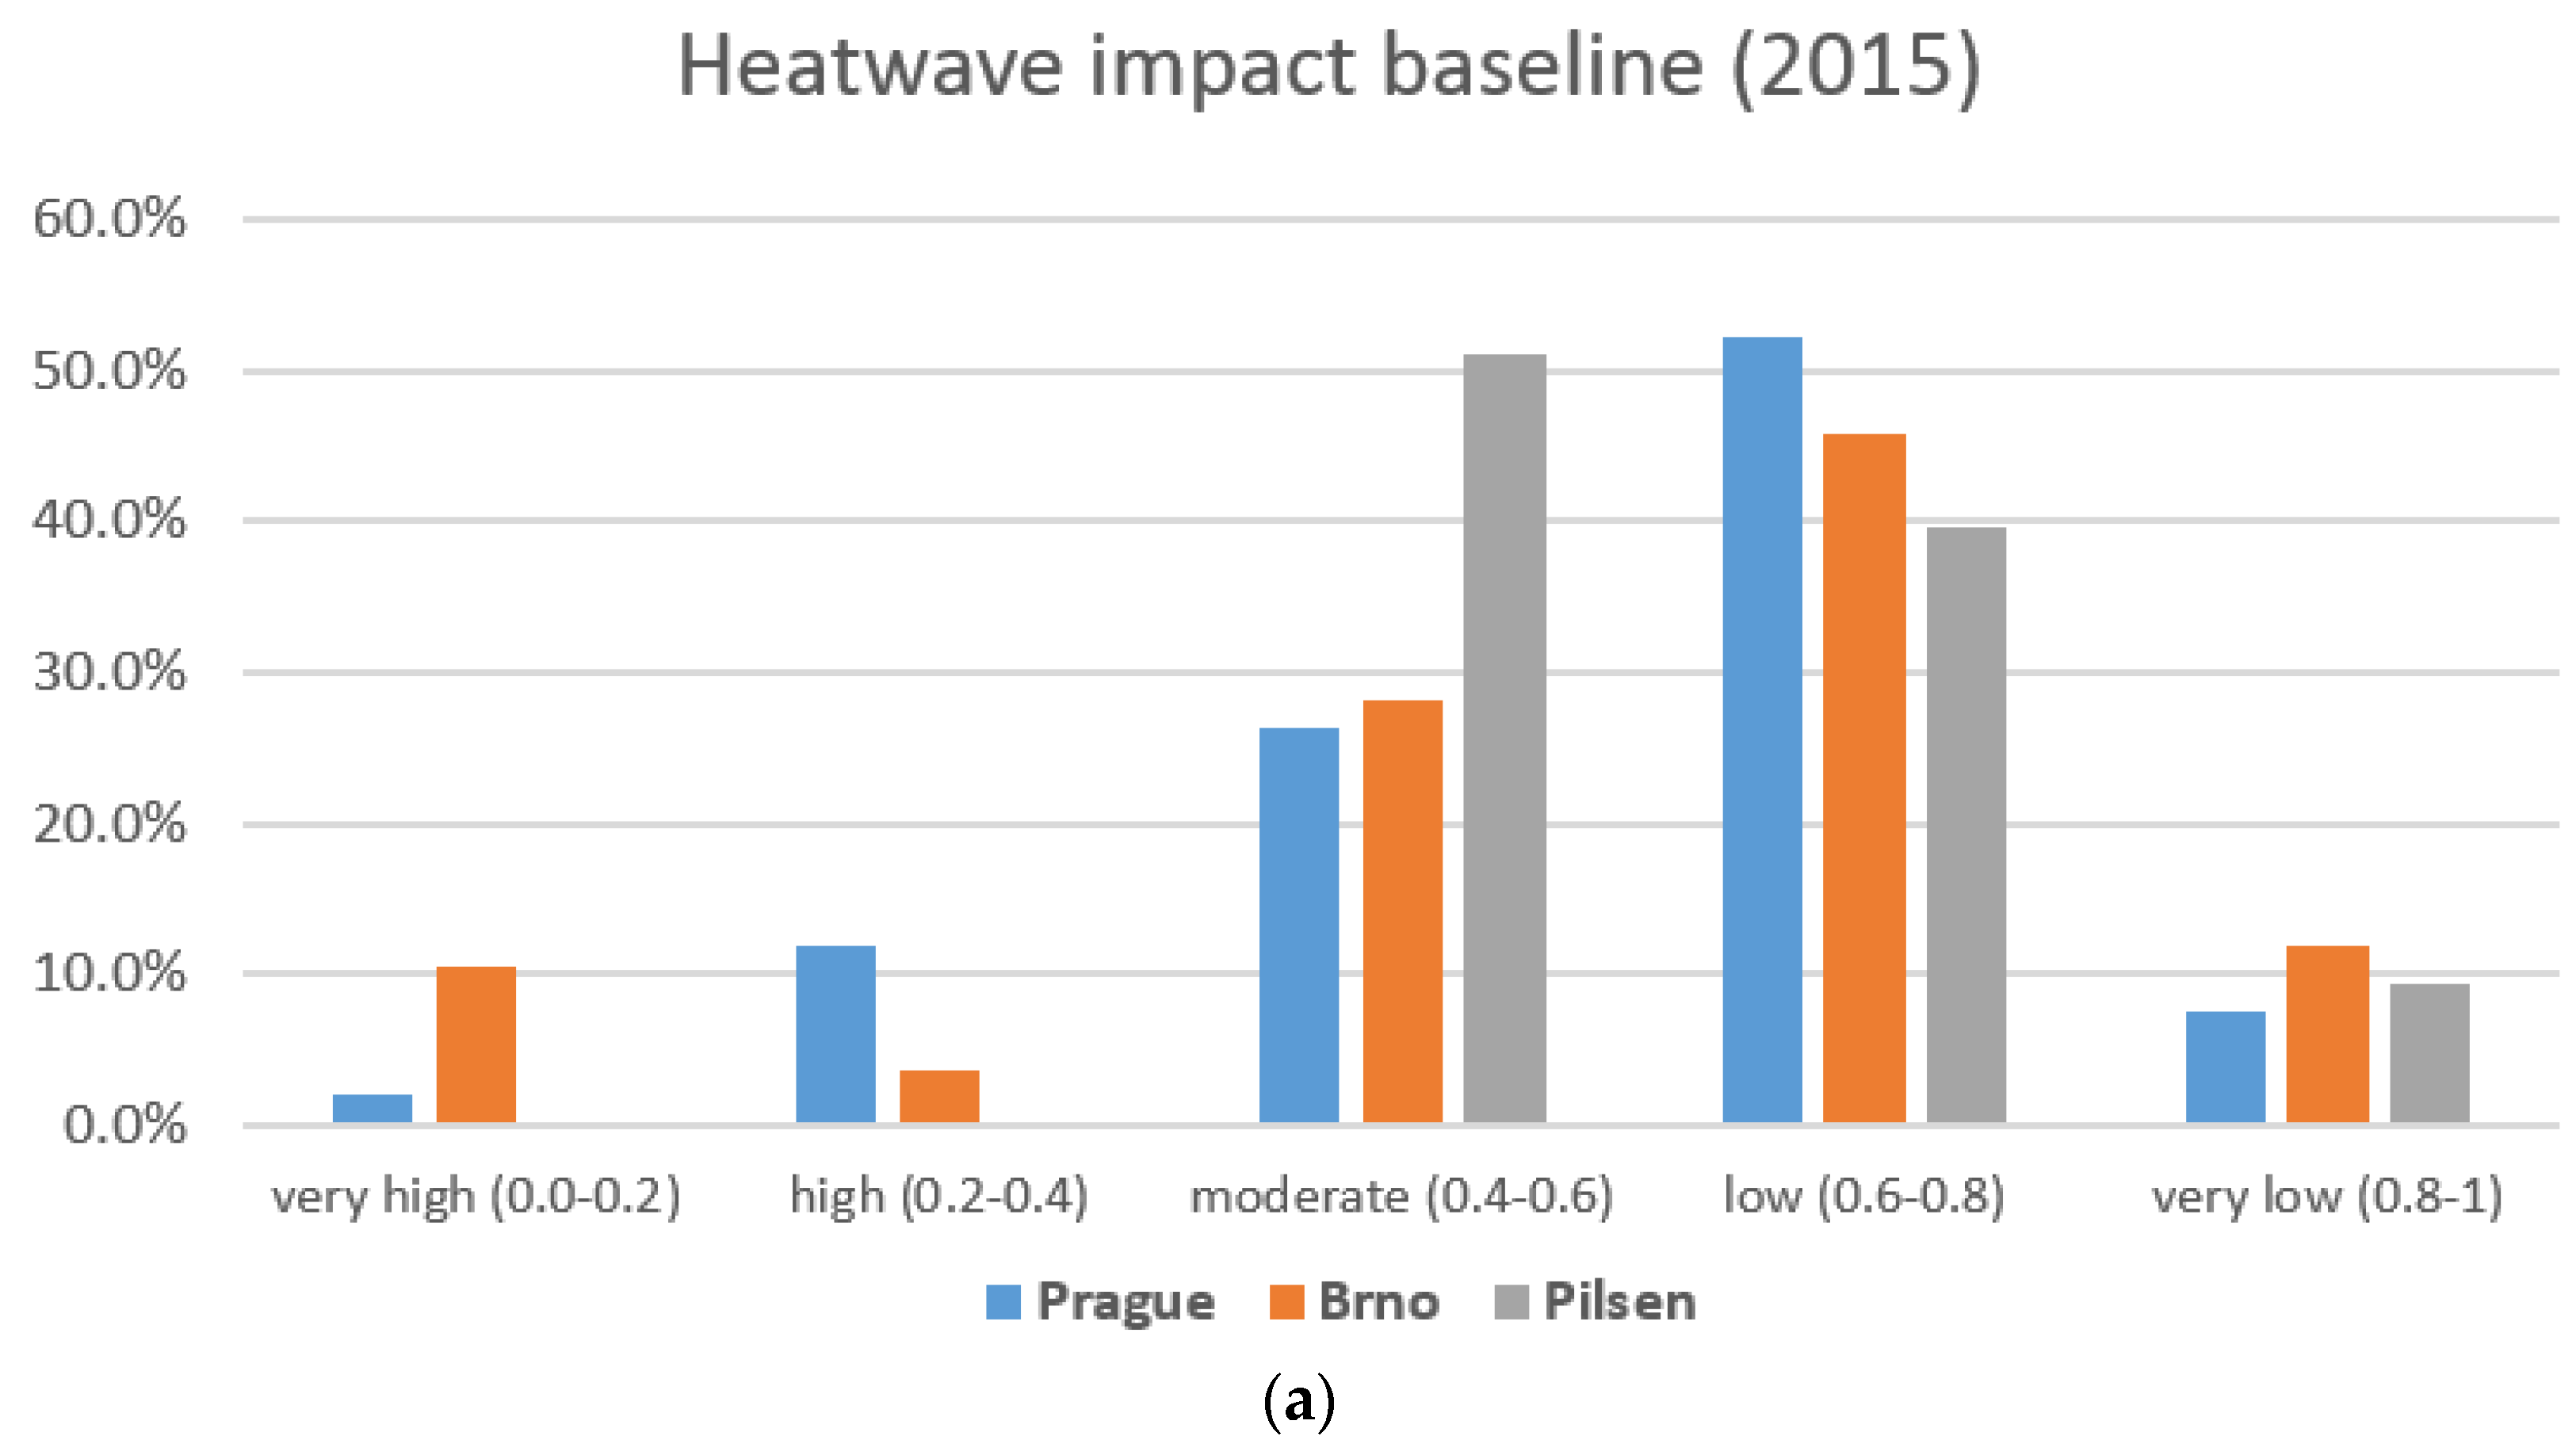
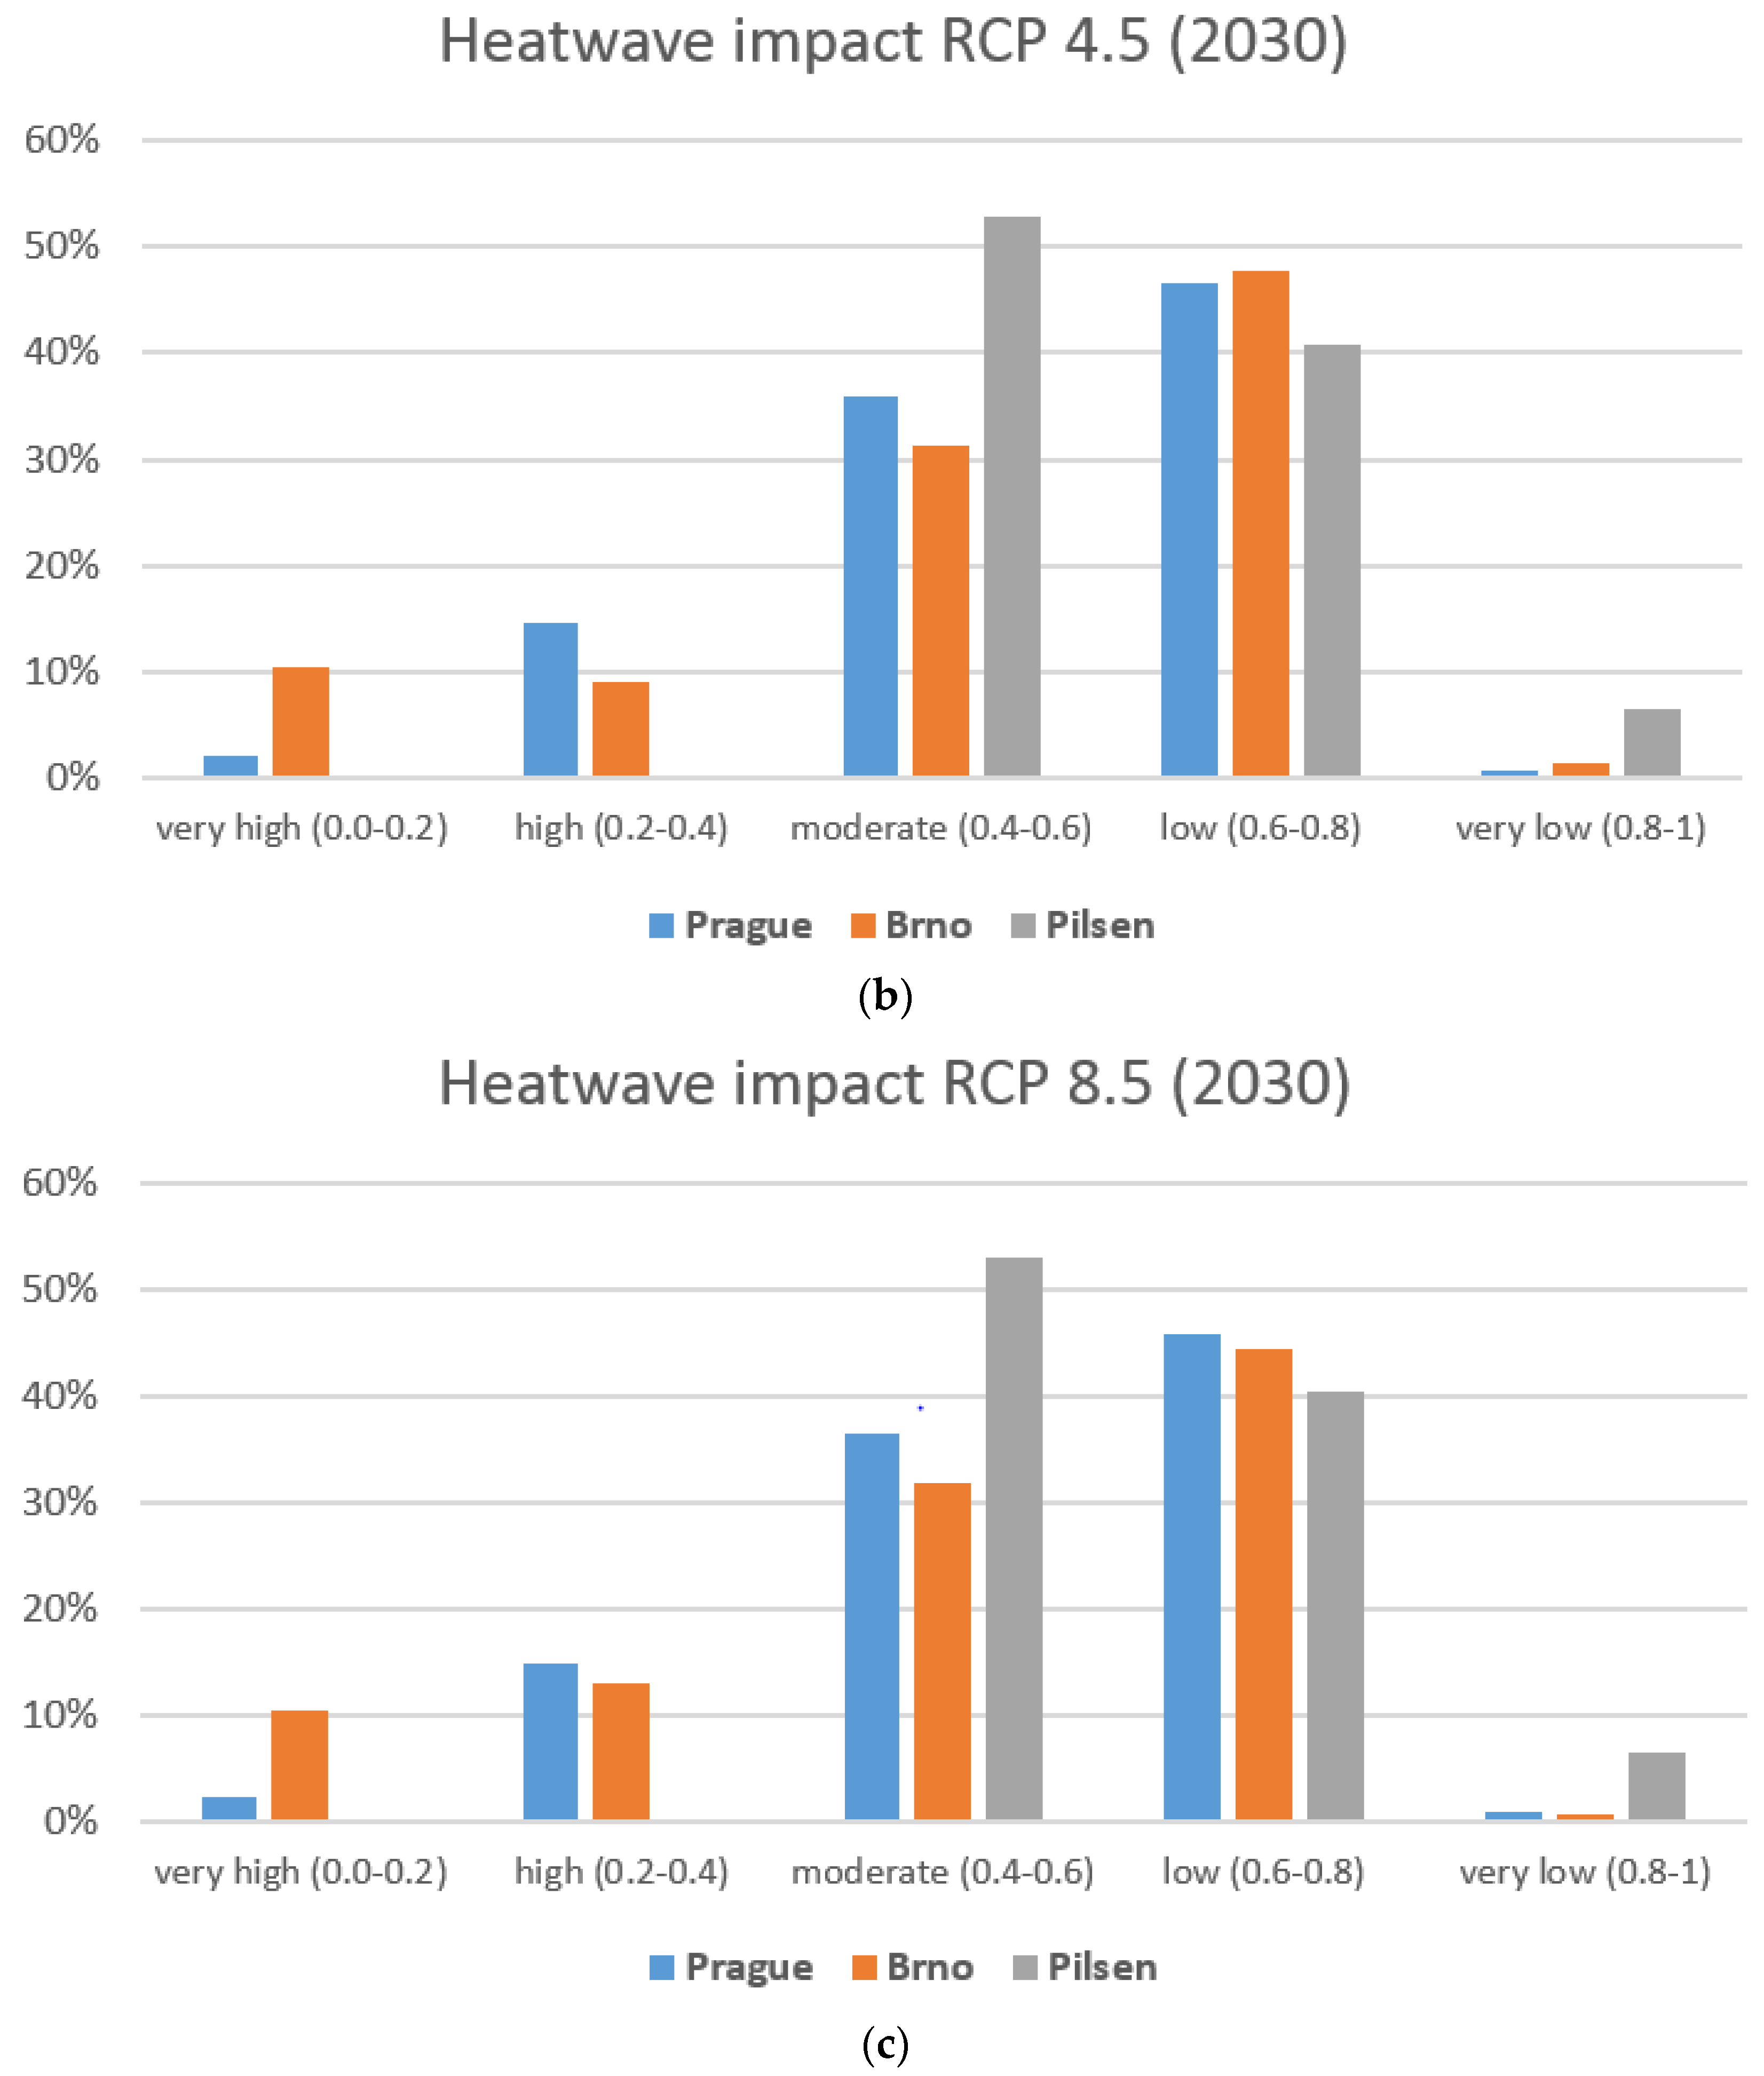
3.2. Mapping Potential Impacts of Heatwaves in the Pilot Cities
3.2.1. “Inter-City” Comparison: Potential Climate Change Impact of Heatwaves
3.2.2. “In-City” Comparison: Potential Climate Change Impact of Heatwaves
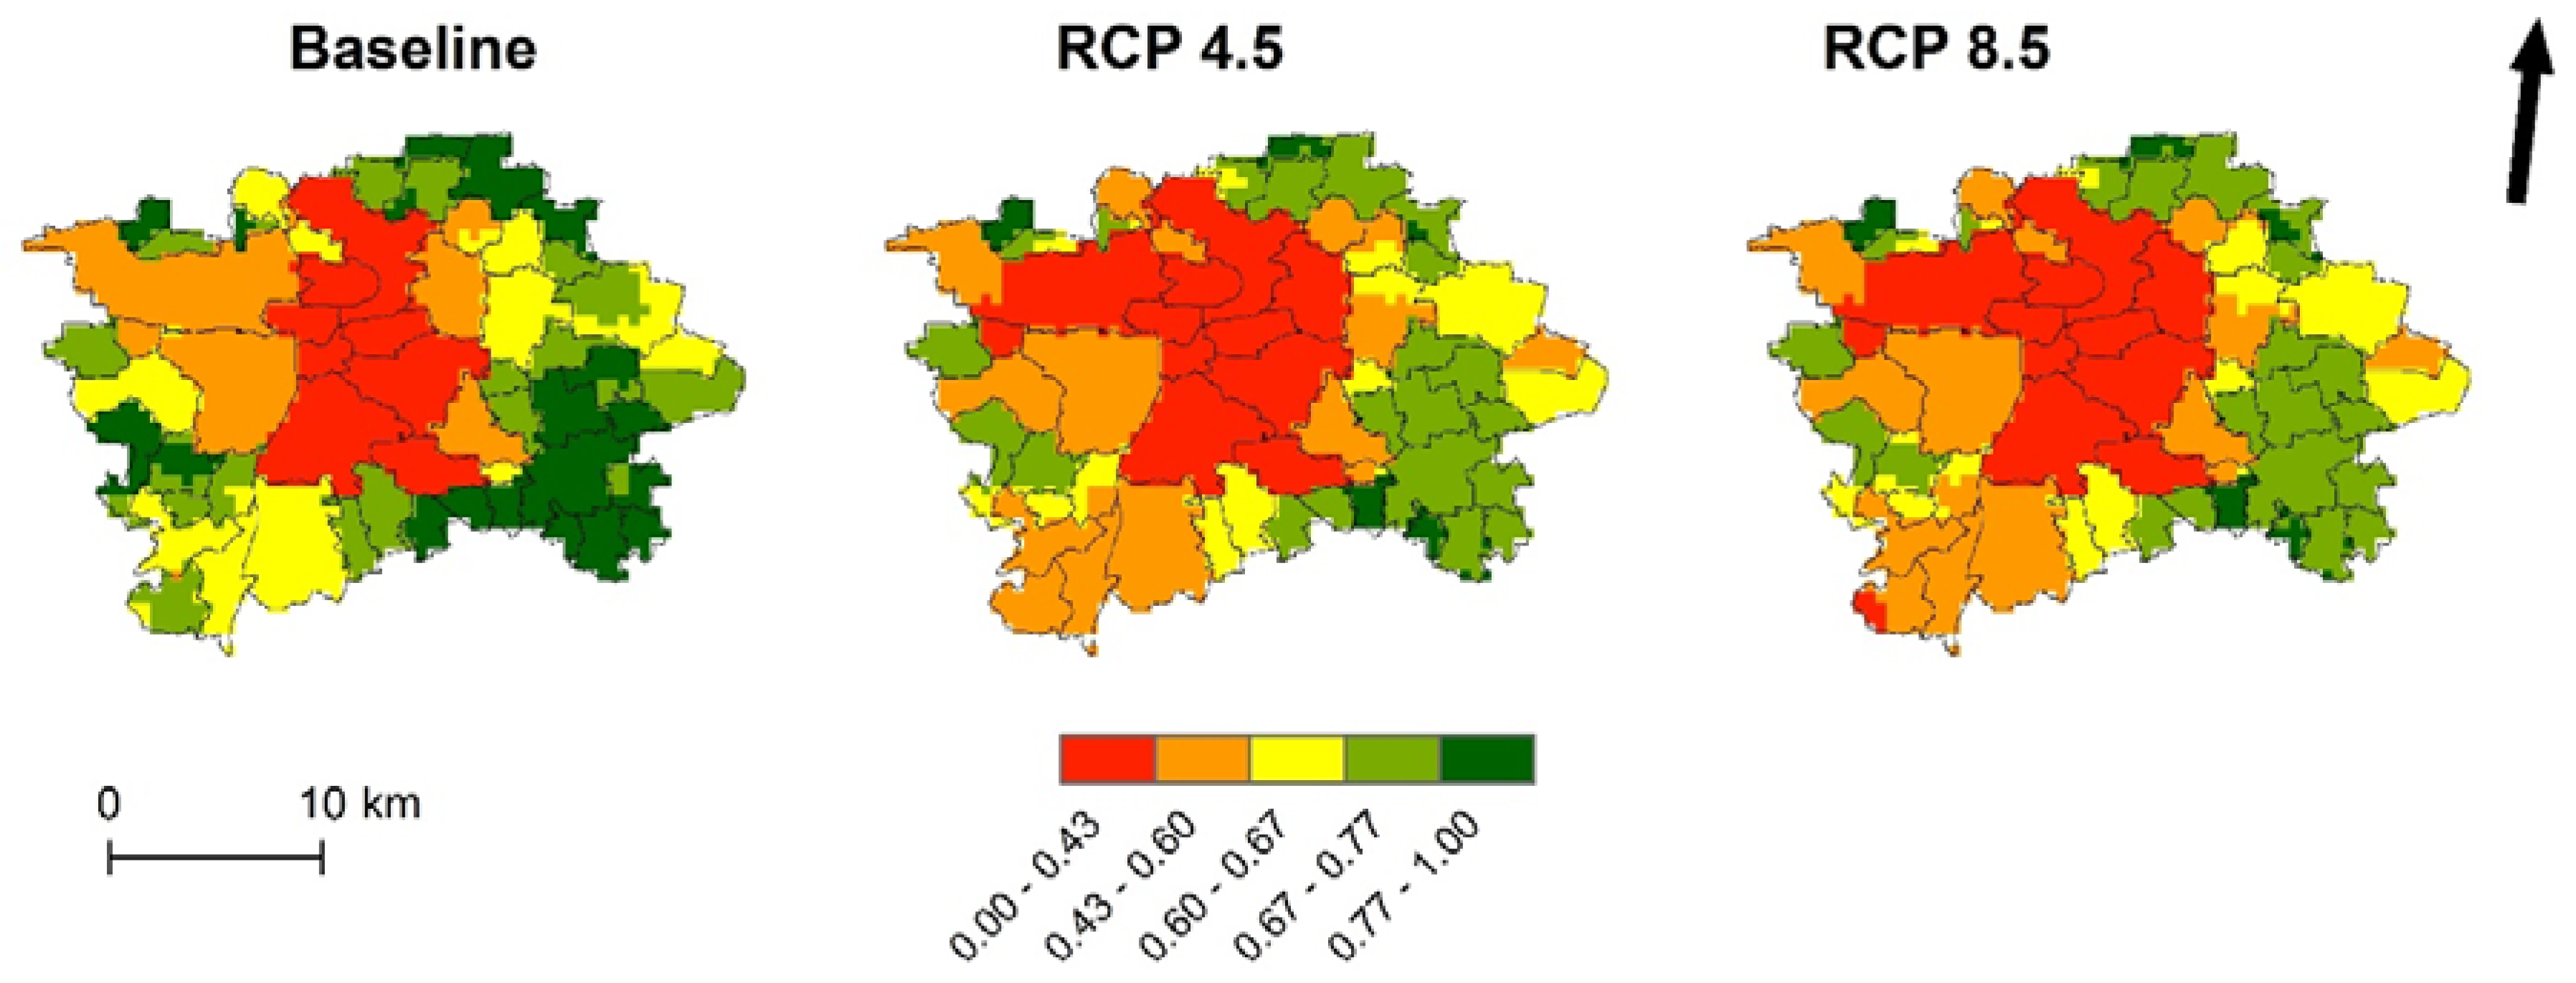
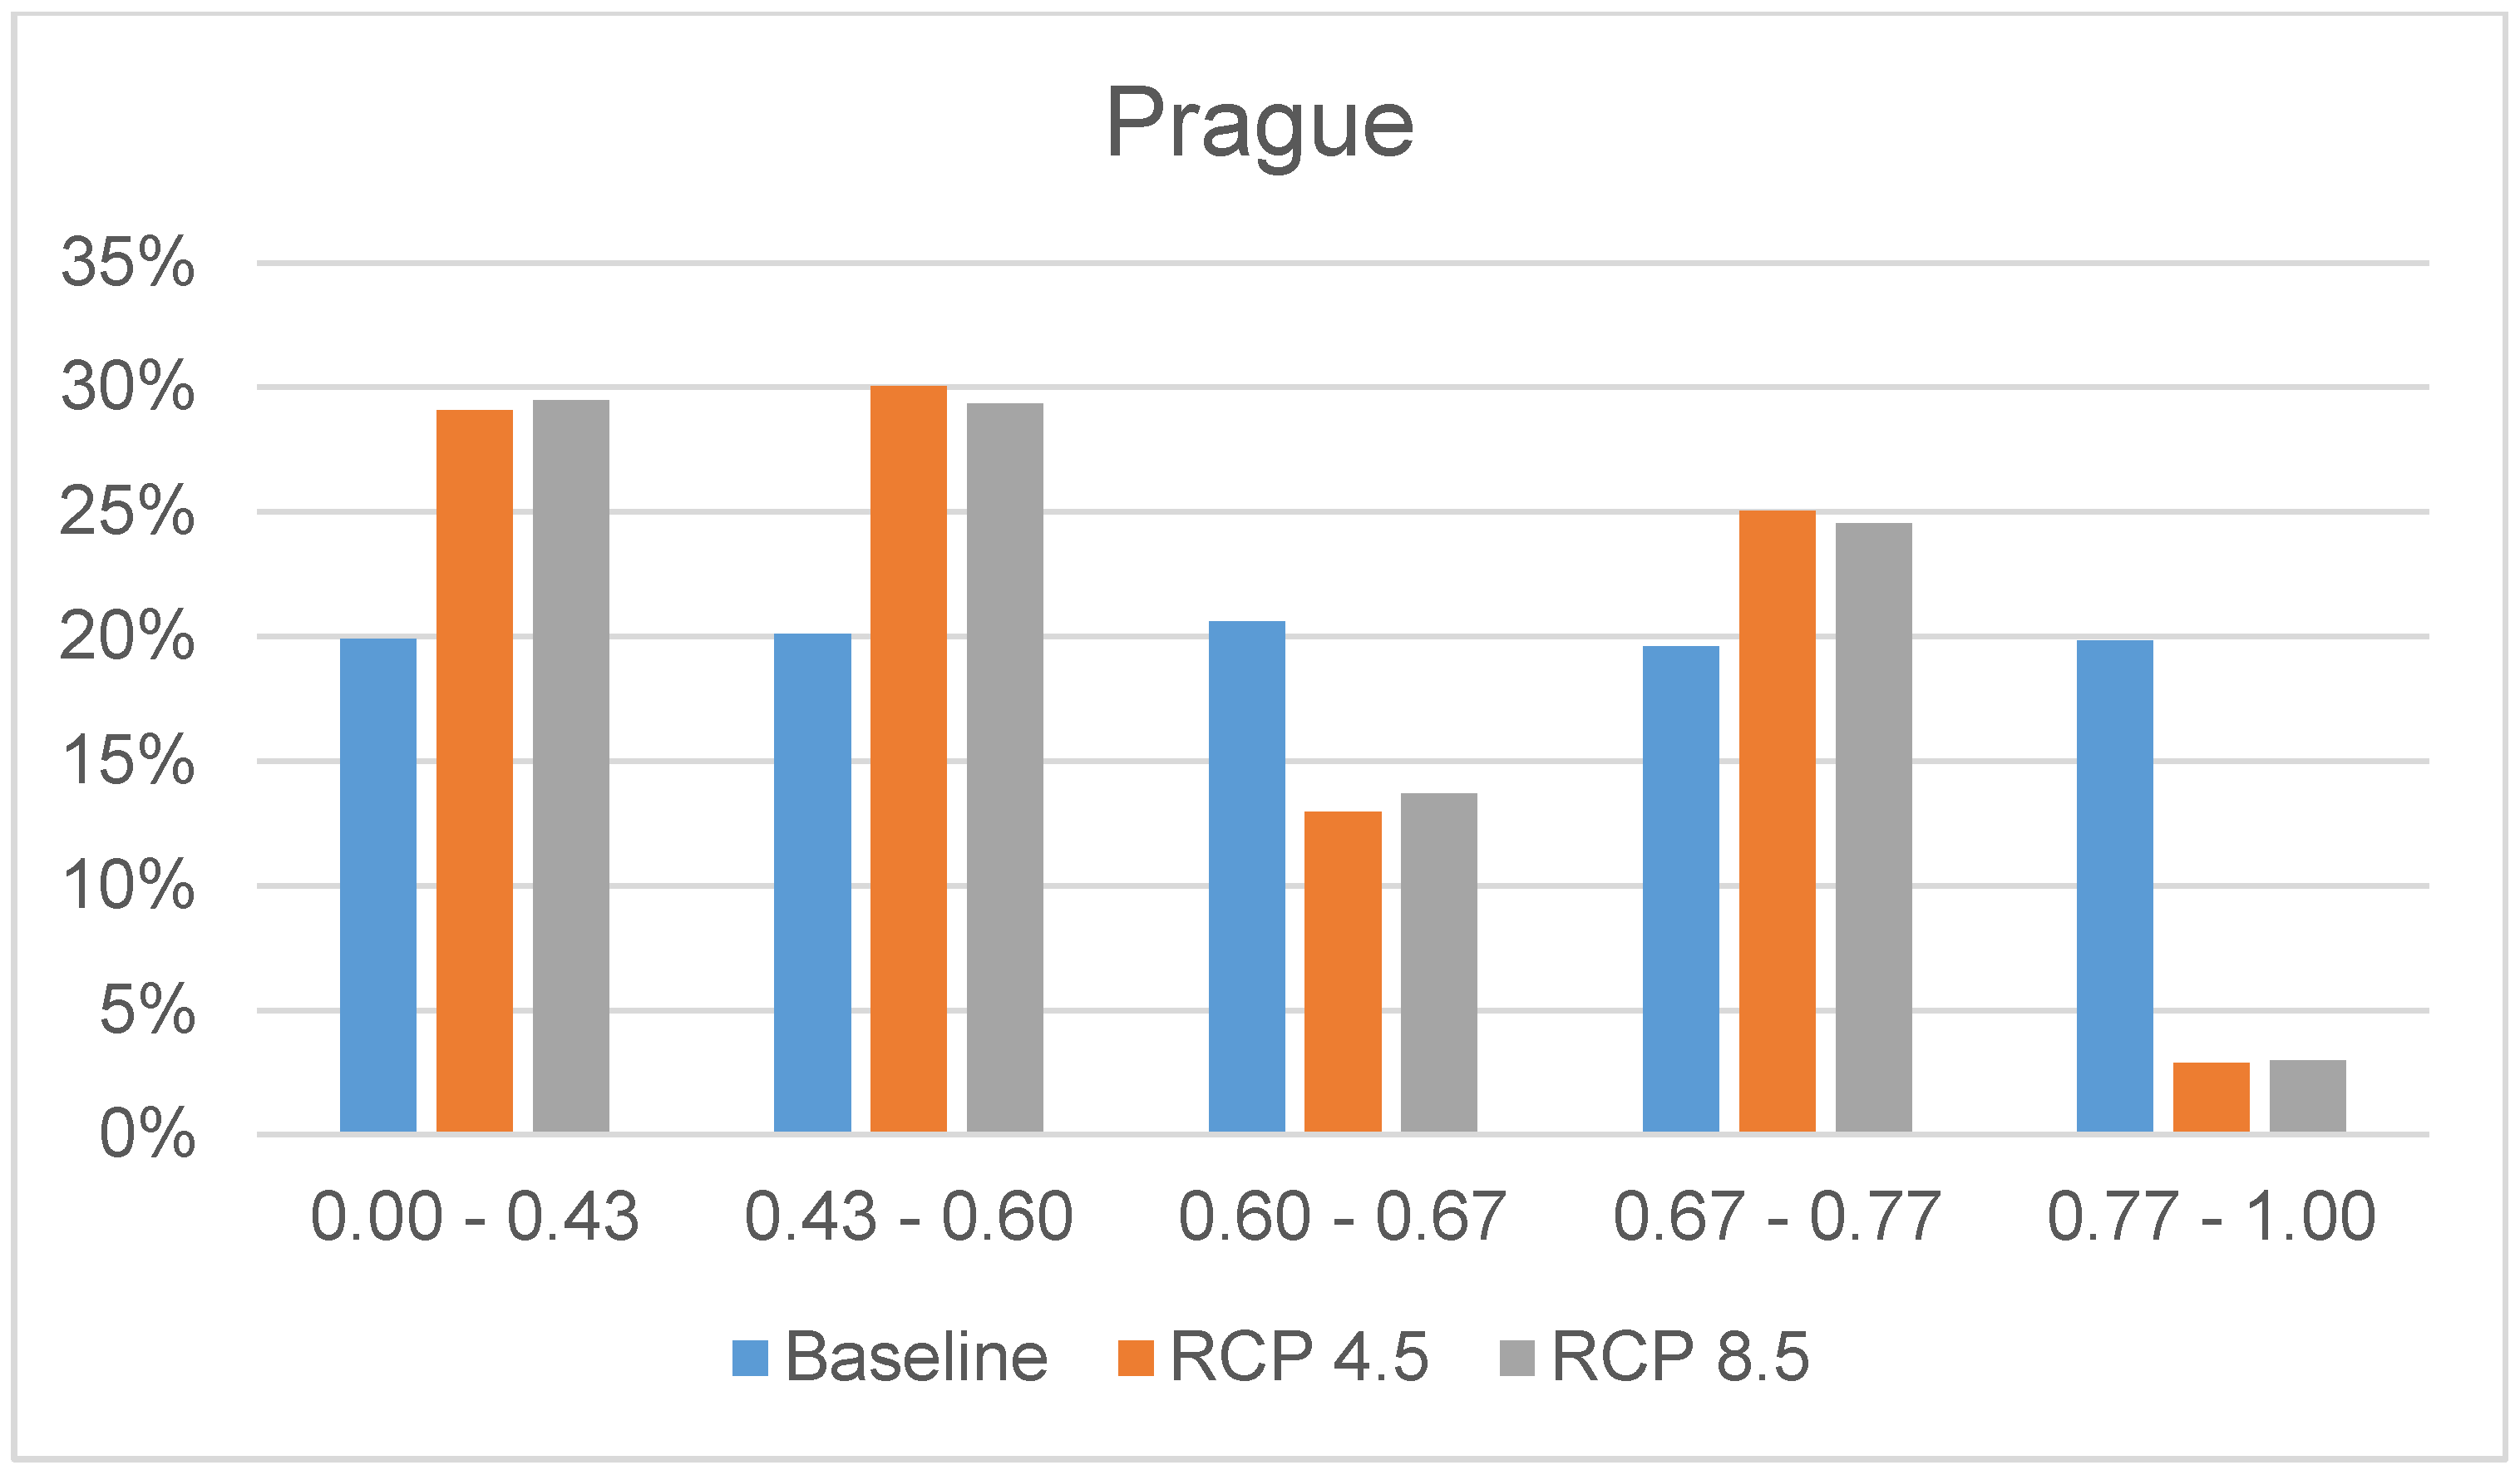
City of Prague
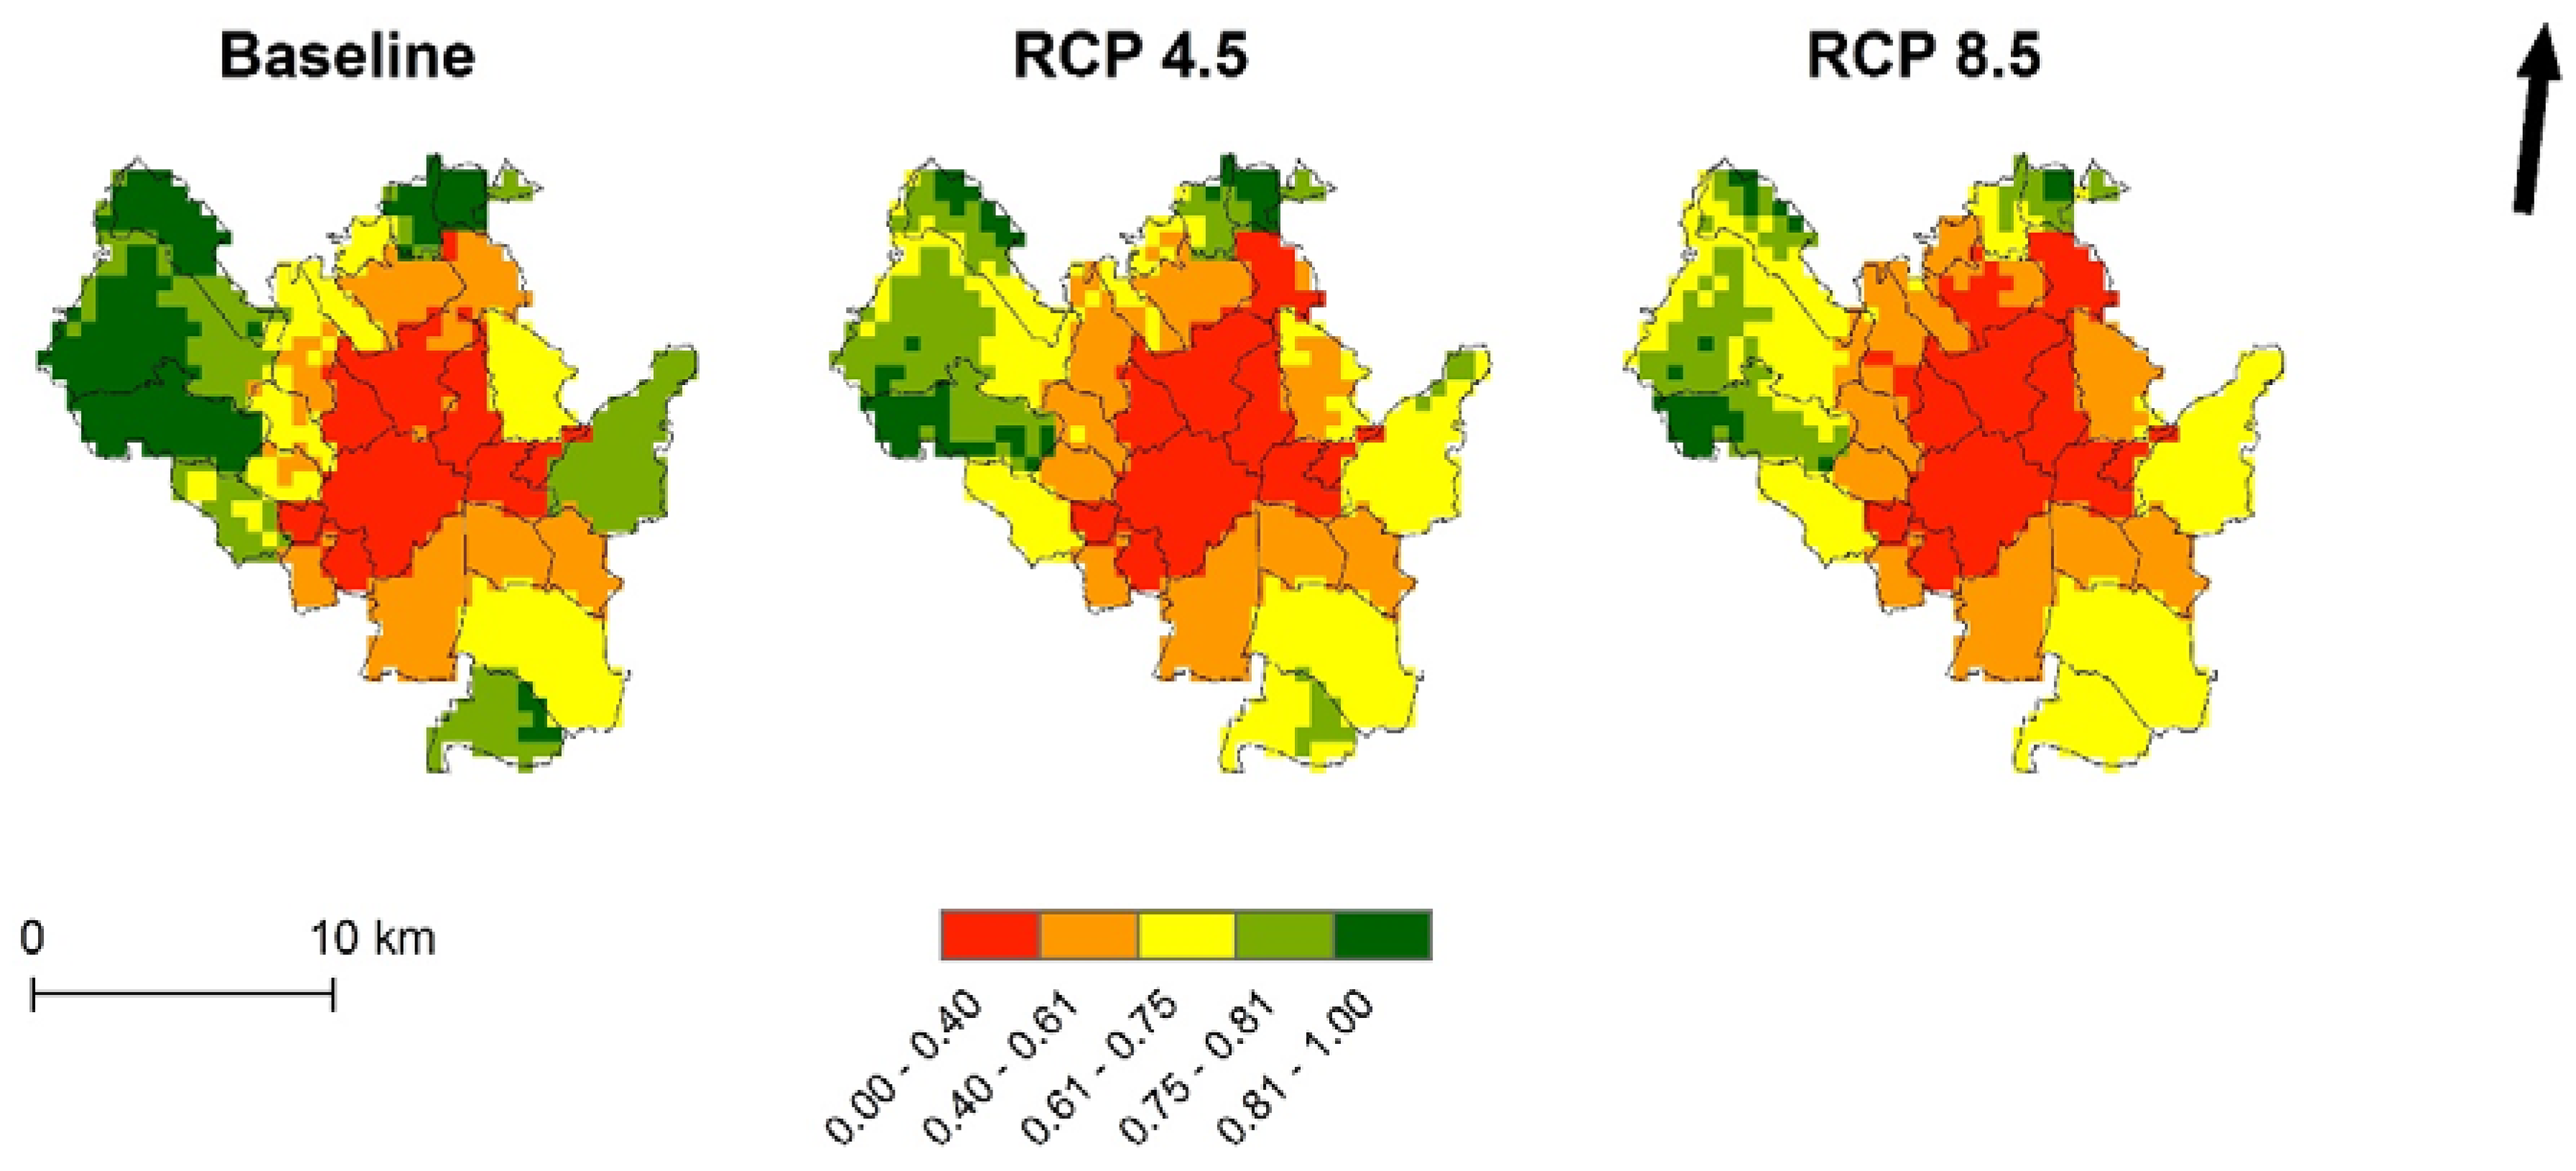
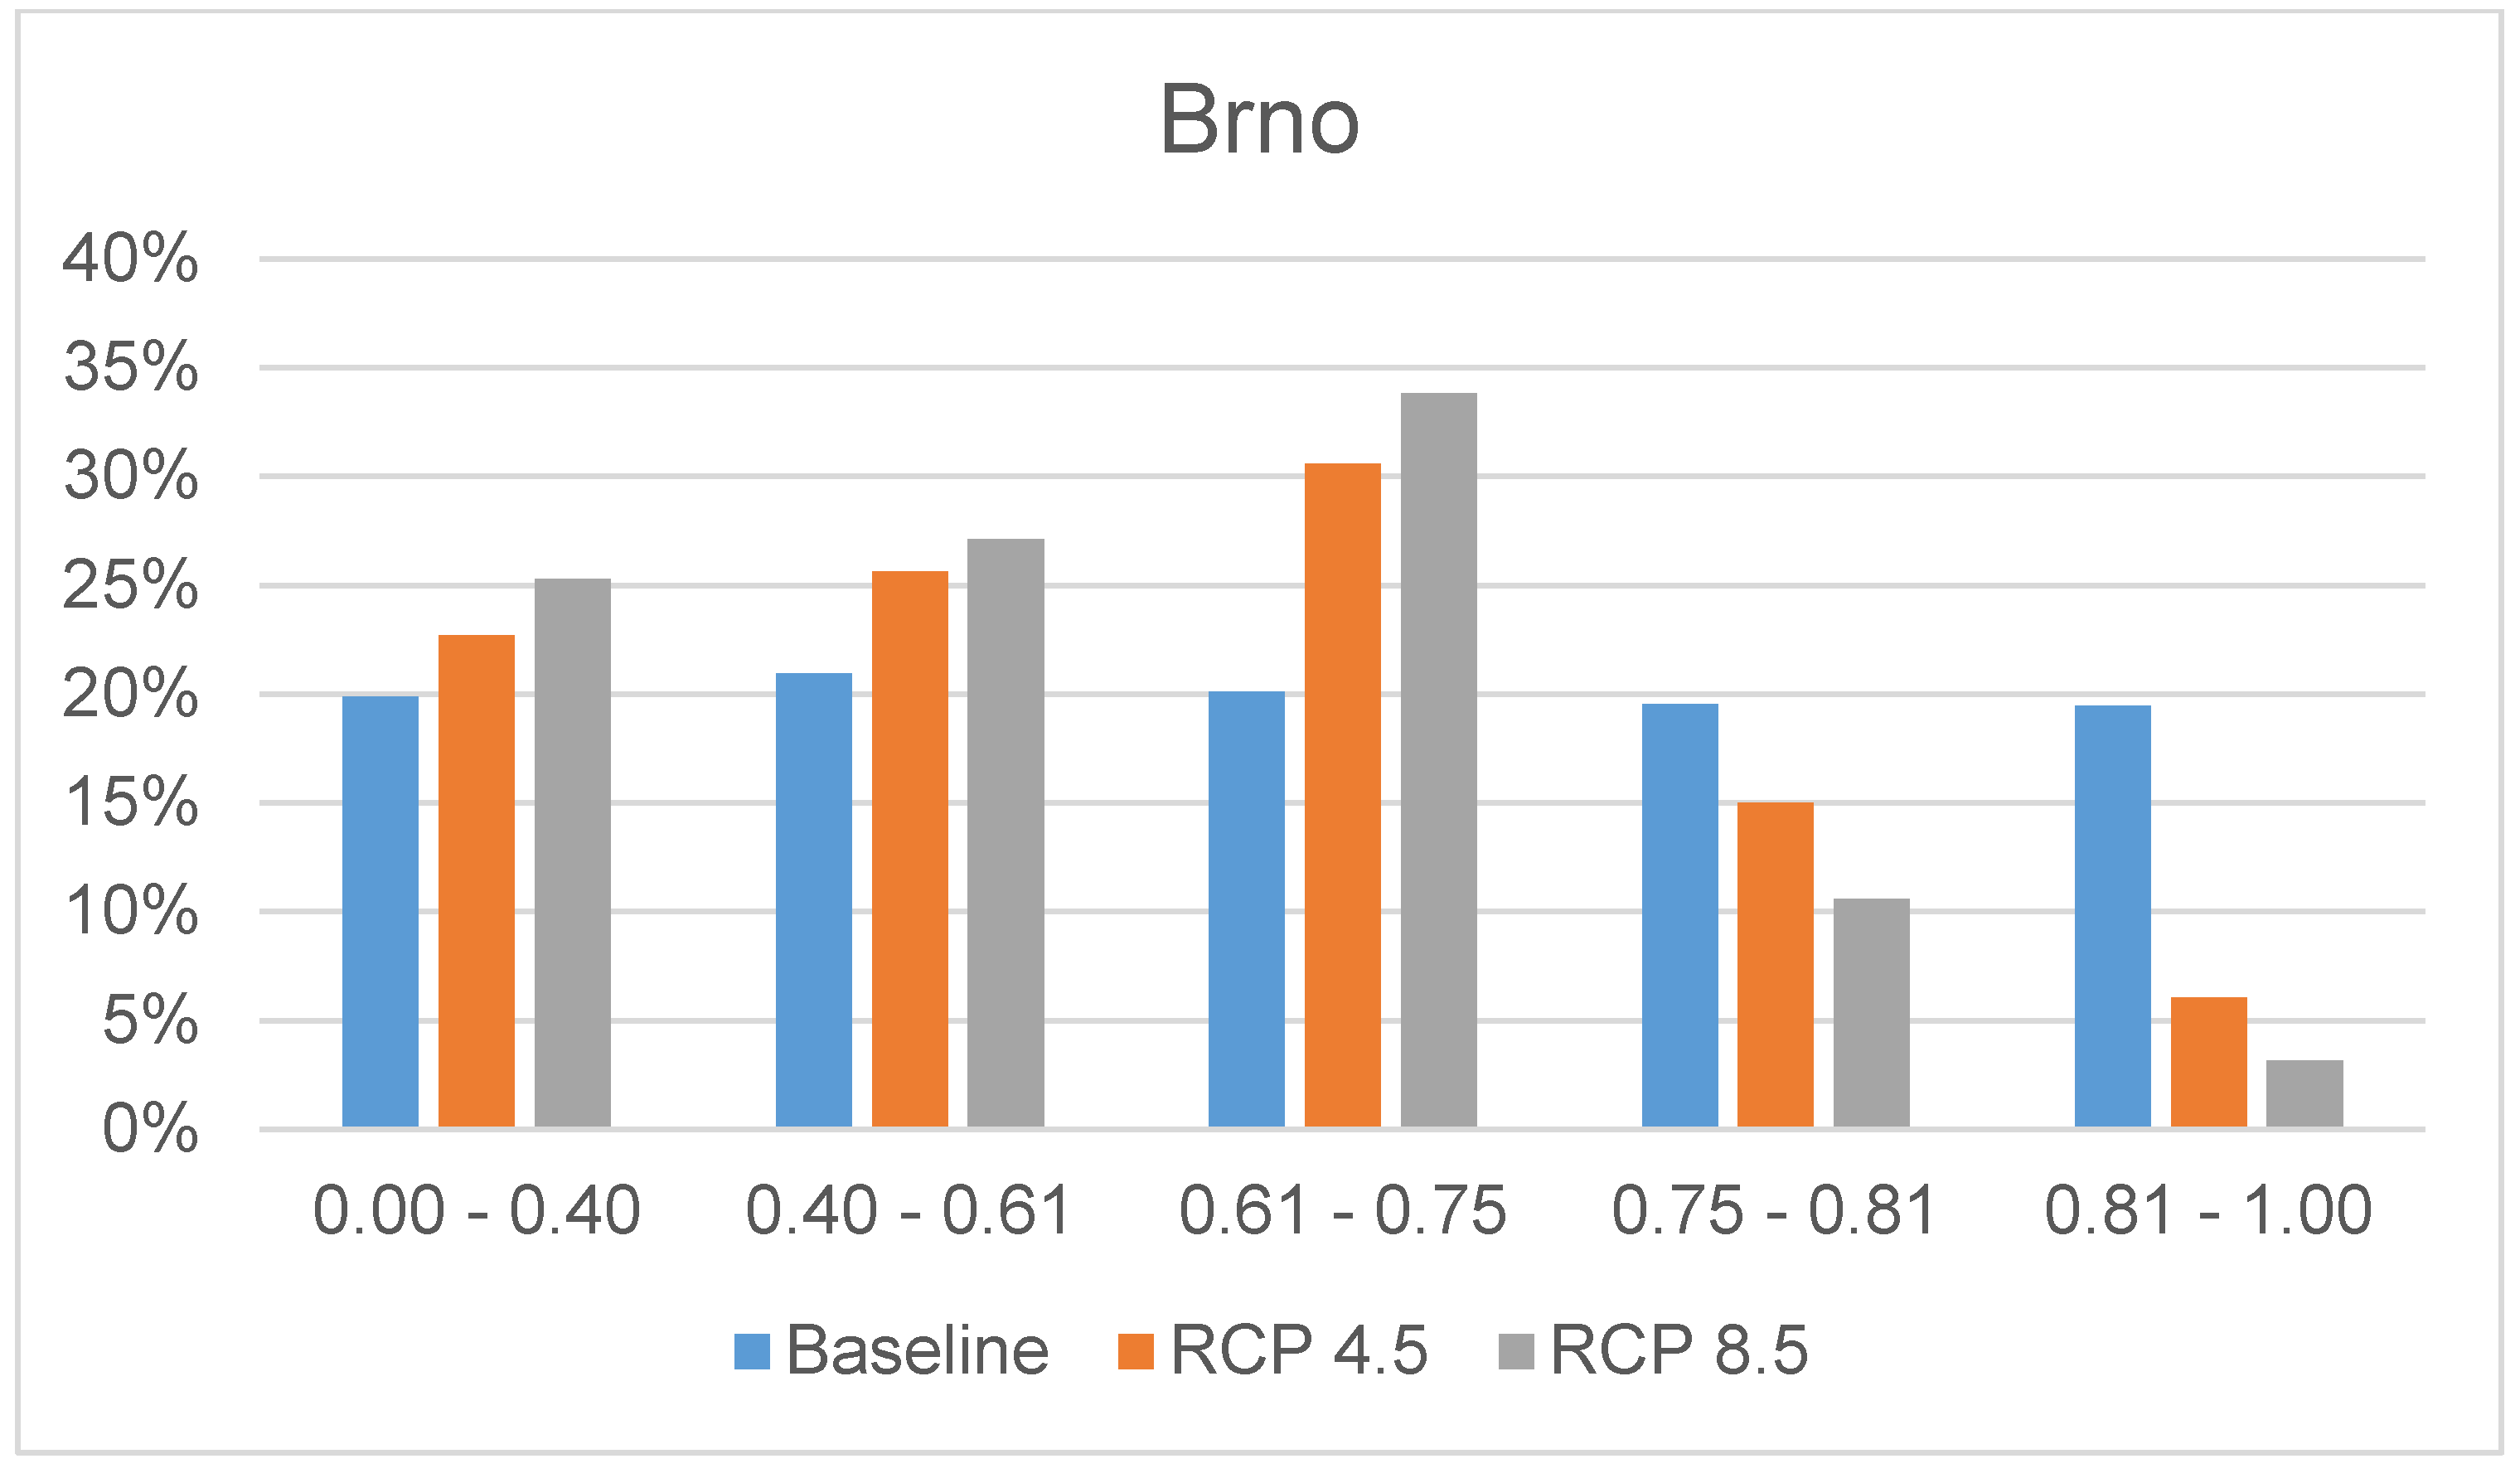
City of Brno
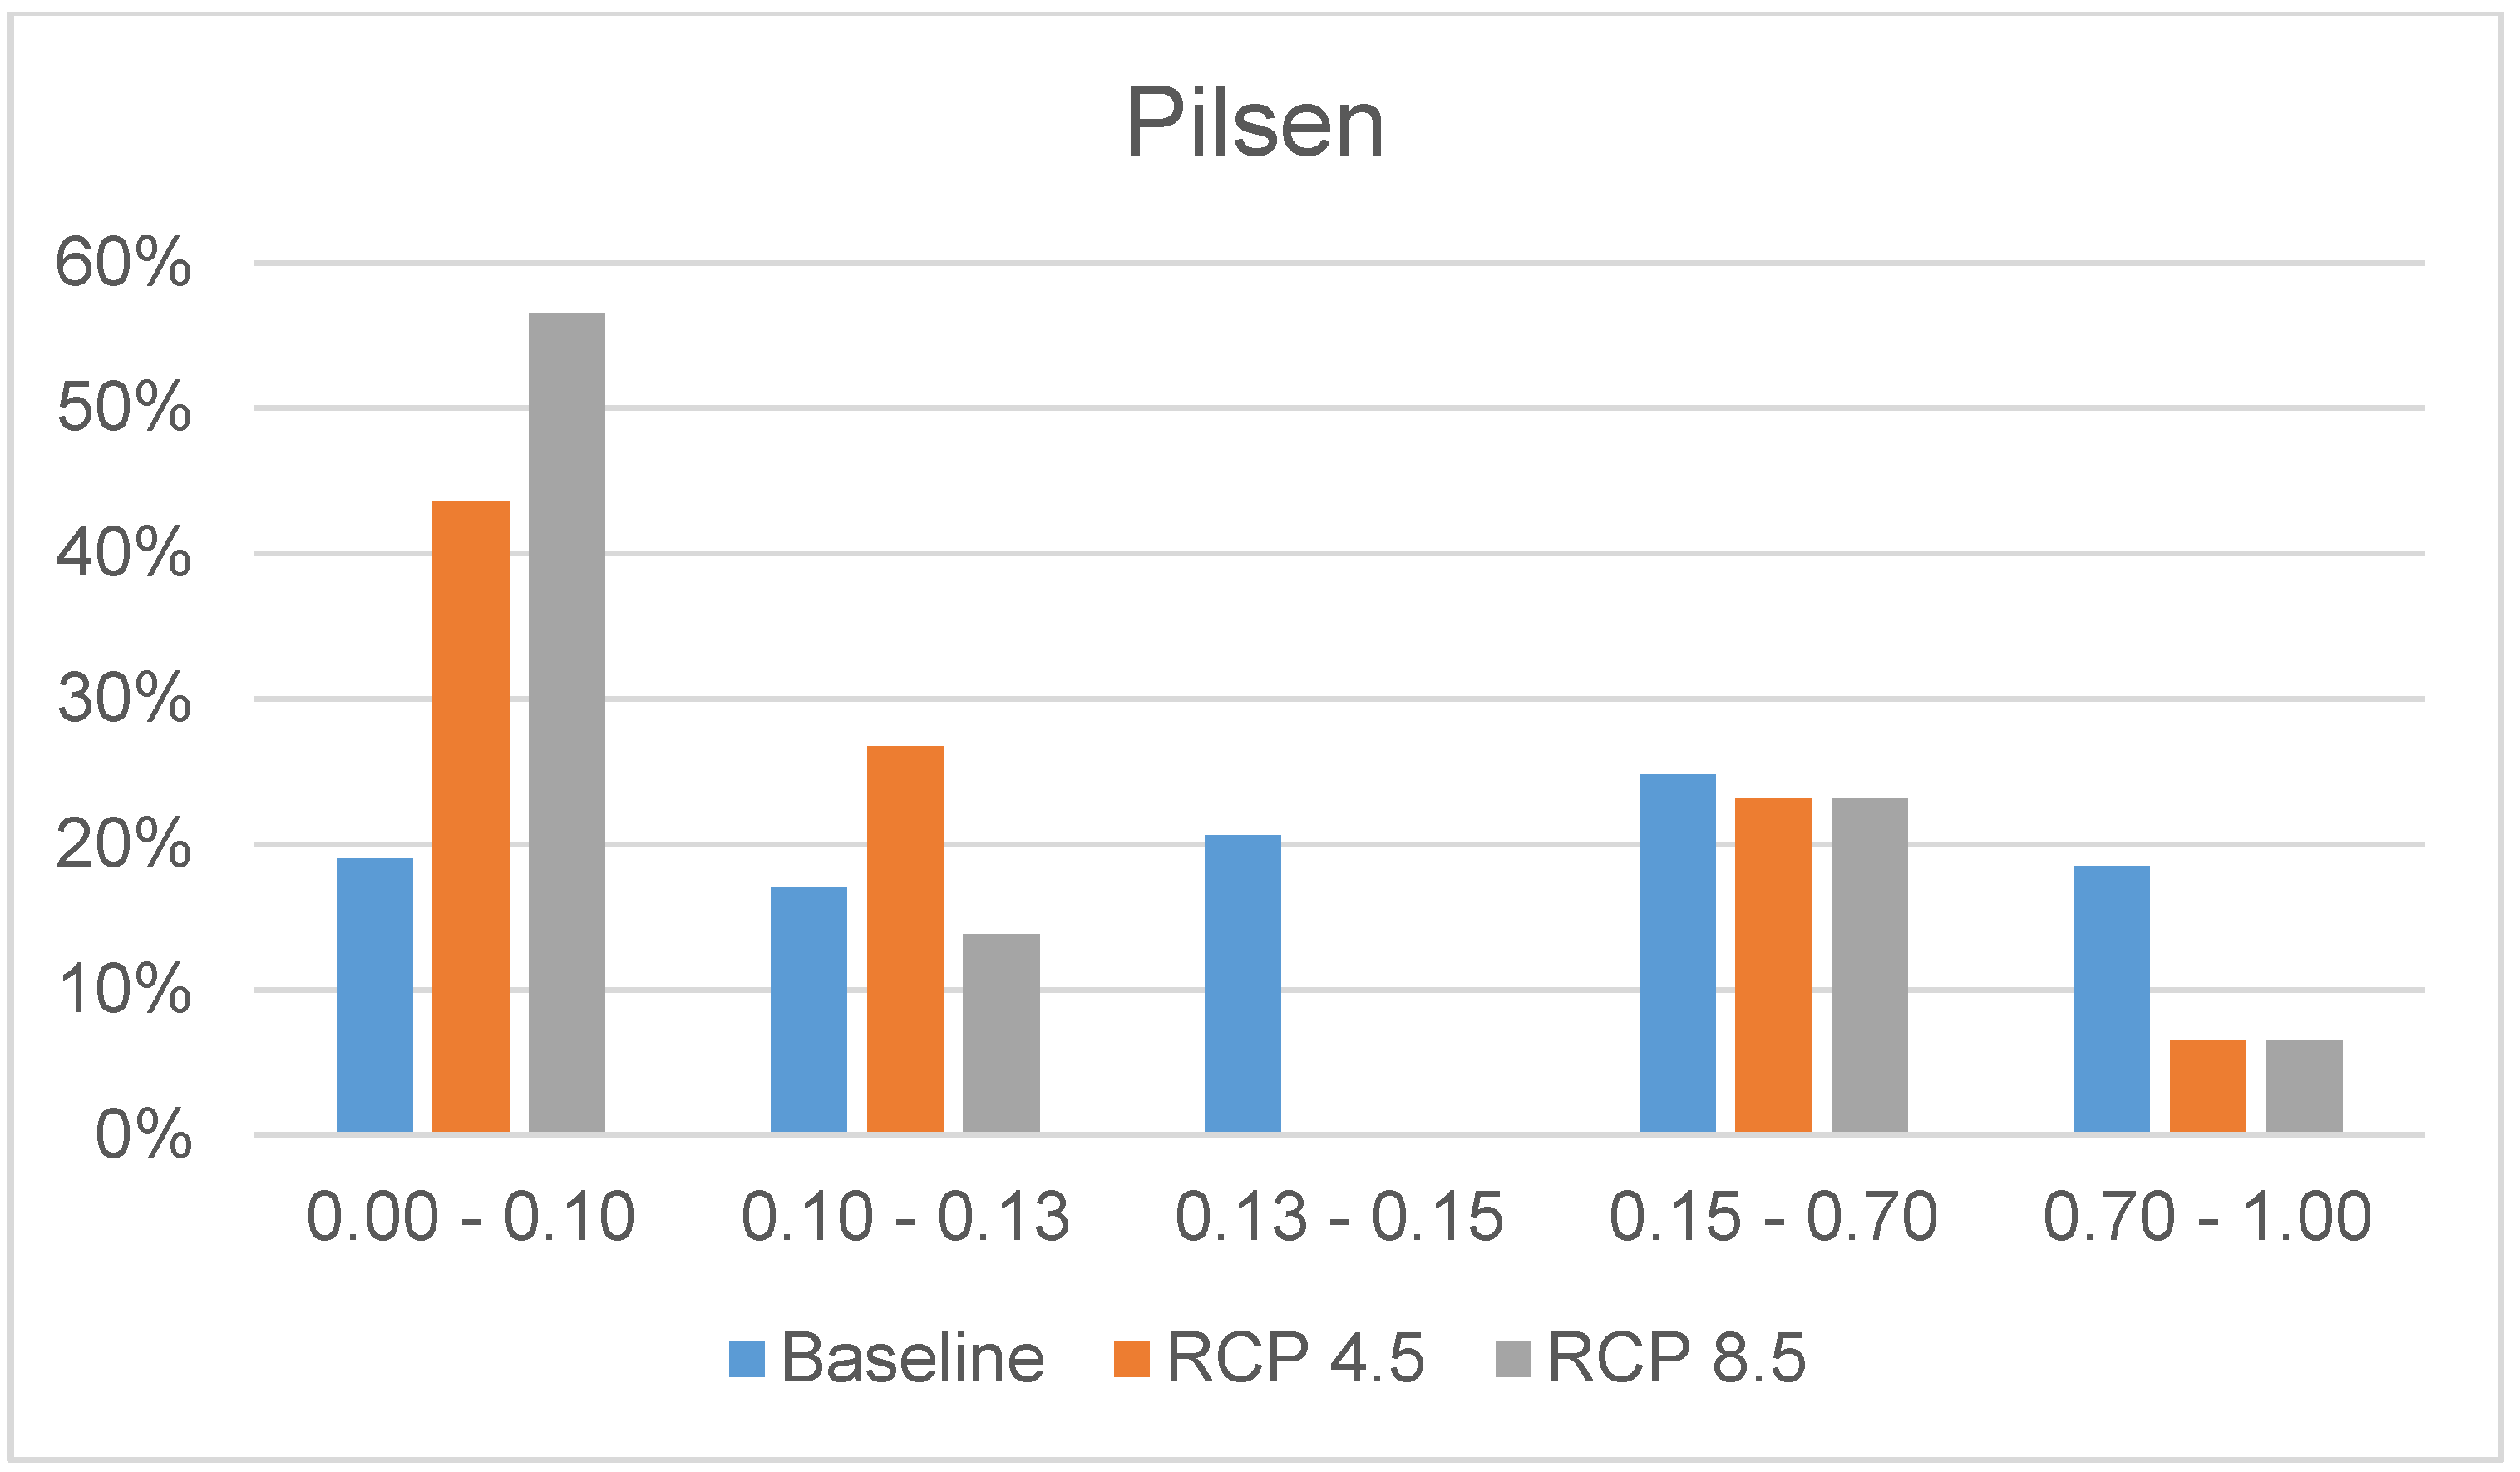
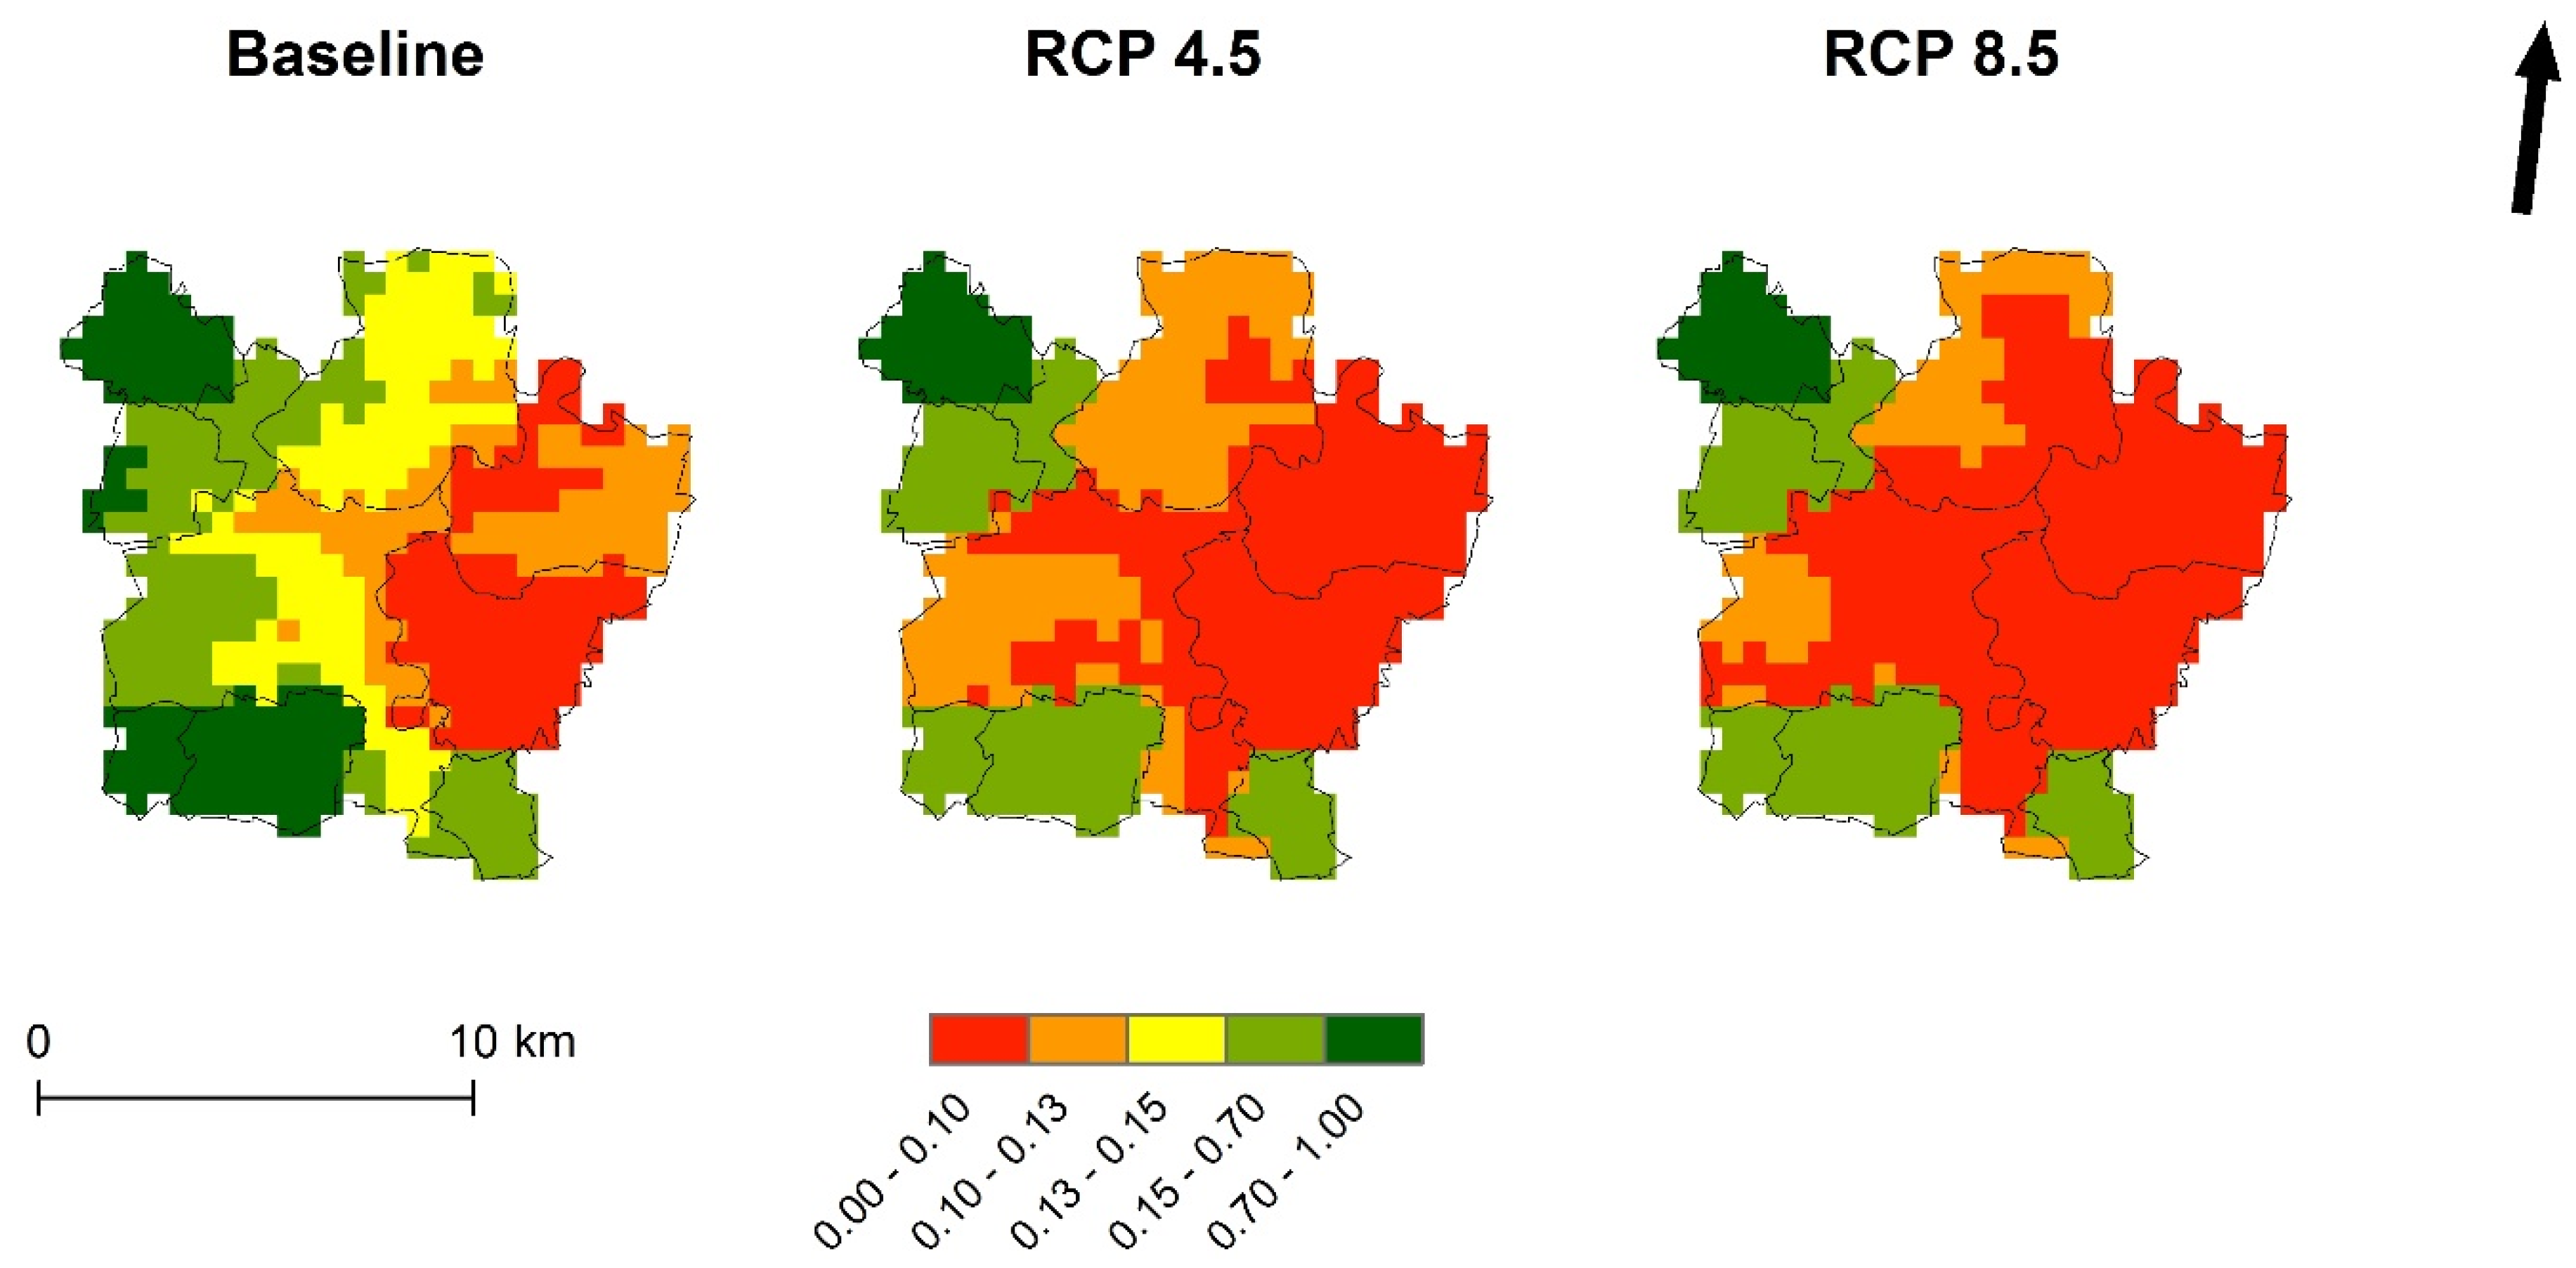
City of Pilsen
4. Discussion
4.1. Participatory Process
4.2. Spatial Assessment
4.3. Extreme Temperatures and Health
4.4. Link to Urban Planning Practice
4.5. Limitations of the Study
5. Conclusions
Author Contributions
Acknowledgments
Conflicts of Interest
Appendix A


References
- Andersson-Skold, Y.; Thorsson, S.; Rayner, D.; Lindberg, F.; Janhall, S.; Jonsson, A.; Moback, U.; Bergman, R.; Granberg, M. An integrated method for assessing climate-related risks and adaptation alternatives in urban areas. Clim. Risk Manag. 2015, 7, 31–50. [Google Scholar] [CrossRef]
- Andersson, E. Urban landscapes and sustainable cities. Ecol. Soc. 2006, 11, 34. [Google Scholar] [CrossRef]
- European Environment Agency (EEA). Urban Adaptation to Climate Change in Europe; European Environment Agency: København K, Denmark, 2012; ISBN 9789292133085. [Google Scholar]
- Geneletti, D.; Zardo, L. Ecosystem-based adaptation in cities: An analysis of European urban climate adaptation plans. Land Use Policy 2016, 50, 38–47. [Google Scholar] [CrossRef]
- Jenkins, K.; Hall, J.; Glenis, V.; Kilsby, C.; McCarthy, M.; Goodess, C.; Smith, D.; Malleson, N.; Birkin, M. Probabilistic spatial risk assessment of heat impacts and adaptations for London. Clim. Chang. 2014, 124, 105–117. [Google Scholar] [CrossRef]
- Brooks, N.; Adger, W.N.; Kelly, P.M. The determinants of vulnerability and adaptive capacity at the national level and the implications for adaptation. Glob. Environ. Chang. 2005, 15, 151–163. [Google Scholar] [CrossRef]
- Salas, J.; Yepes, V. Urban vulnerability assessment: Advances from the strategic planning outlook. J. Clean. Prod. 2018, 179, 544–558. [Google Scholar] [CrossRef]
- Absar, S.M.; Preston, B.L. Extending the Shared Socioeconomic Pathways for sub-national impacts, adaptation, and vulnerability studies. Glob. Environ. Chang. 2015, 33, 83–96. [Google Scholar] [CrossRef] [Green Version]
- Shi, L.; Chu, E.; Anguelovski, I.; Aylett, A.; Debats, J.; Goh, K.; Schenk, T.; Seto, K.C.; Dodman, D.; Roberts, D.; et al. Roadmap towards justice in urban climate adaptation research. Nat. Clim. Chang. 2016, 6, 131–137. [Google Scholar] [CrossRef]
- Hallegatte, S.; Corfee-Morlot, J. Understanding climate change impacts, vulnerability and adaptation at city scale: An introduction. Clim. Chang. 2011, 104, 1–12. [Google Scholar] [CrossRef]
- Jiang, L.; O’Neill, B.C. Global urbanization projections for the Shared Socioeconomic Pathways. Glob. Environ. Chang. 2017, 42, 193–199. [Google Scholar] [CrossRef] [Green Version]
- CZSO (Czech Statistical Office). Demographic Yearbook of the Czech Republic—2014; CZSO: Prague, Czech Republic, 2015. [Google Scholar]
- Kc, S.; Lutz, W. Demographic scenarios by age, sex and education corresponding to the SSP narratives. Popul. Environ. 2014, 35, 243–260. [Google Scholar] [CrossRef]
- Runhaar, H.; Mees, H.; Wardekker, A.; van der Sluijs, J.; Driessen, P.P.J. Adaptation to climate change-related risks in Dutch urban areas: Stimuli and barriers. Reg. Environ. Chang. 2012, 12, 777–790. [Google Scholar] [CrossRef]
- Guerreiro, S.B.; Dawson, R.J.; Kilsby, C.; Lewis, E.; Ford, A. Future heat-waves, droughts and floods in 571 European cities. Environ. Res. Lett. 2018, 13. [Google Scholar] [CrossRef]
- Revi, A.; Satterthwaite, D.E.; Aragón-Durand, F.; Field, C.B. Urban Areas. In Climate Change 2014: Impacts, Adaptation, and Vulnerability. Part A: Global and Sectoral Aspects; Contribution of Working Group II to the Fifth Assessment Report of the Intergovernmental Panel on Climate Change; Cambridge University Press: Cambridge, UK, 2014. [Google Scholar]
- European Environment Agency (EEA). Climate Change, Impacts and Vulnerability in Europe 2016: An Indicator-Based Report; European Environment Agency: København K, Denmark, 2017; Volume 1/2017, ISBN 978-92-9213-835-6. Available online: https://www.eea.europa.eu/publications/climate-change-impacts-and-vulnerability-2016 (accessed on 5 June 2018).
- World Health Organization (WHO). Improving Environment and Health in Europe: How Far Have We Gotten? WHO Regional Office for Europe: Copenhagen, Denmark, 2015; ISBN 9789289050876. [Google Scholar]
- CZSO (Czech Statistical Office). Population and Housing CENSUS—2011; CZSO: Prague, Czech Republic, 2011. [Google Scholar]
- Rannow, S.; Loibl, W.; Greiving, S.; Gruehn, D.; Meyer, B.C. Potential impacts of climate change in Germany-Identifying regional priorities for adaptation activities in spatial planning. Landsc. Urban Plan. 2010, 98, 160–171. [Google Scholar] [CrossRef]
- Leal Filho, W.; Echevarria Icaza, L.; Neht, A.; Klavins, M.; Morgan, E.A. Coping with the impacts of urban heat islands. A literature based study on understanding urban heat vulnerability and the need for resilience in cities in a global climate change context. J. Clean. Prod. 2018, 171, 1140–1149. [Google Scholar] [CrossRef]
- Yohe, G.; Leichenko, R. Adopting a risk-based approach. Ann. N. Y. Acad. Sci. 2010, 1196, 29–40. [Google Scholar] [CrossRef] [PubMed]
- Kostas, P.; Bithas, M.C. Environmentally sustainable cities. Critical review and operational conditions. Sustain. Dev. 2006, 14, 177–189. [Google Scholar] [CrossRef] [Green Version]
- Leach, J.M.; Lee, S.E.; Hunt, D.V.L.; Rogers, C.D.F. Improving city-scale measures of livable sustainability: A study of urban measurement and assessment through application to the city of Birmingham, UK. Cities 2017, 71, 80–87. [Google Scholar] [CrossRef]
- Lombardi, M.; Laiola, E.; Tricase, C.; Rana, R. Toward urban environmental sustainability: The carbon footprint of Foggia’s municipality. J. Clean. Prod. 2018, 186, 534–543. [Google Scholar] [CrossRef]
- Reckien, D.; Salvia, M.; Heidrich, O.; Church, J.M.; Pietrapertosa, F.; De Gregorio-Hurtado, S.; D’Alonzo, V.; Foley, A.; Simoes, S.G.; Lorencová, E.K.; et al. How are cities planning to respond to climate change? Assessment of local climate plans from 885 cities in the EU-28. J. Clean. Prod. 2018. [Google Scholar] [CrossRef]
- Romero Lankao, P.; Qin, H. Conceptualizing urban vulnerability to global climate and environmental change. Curr. Opin. Environ. Sustain. 2011, 3, 142–149. [Google Scholar] [CrossRef]
- Ross, H.; Shaw, S.; Rissik, D.; Cliffe, N.; Chapman, S.; Hounsell, V.; Udy, J.; Trinh, N.T.; Schoeman, J. A participatory systems approach to understanding climate adaptation needs. Clim. Chang. 2015, 129, 27–42. [Google Scholar] [CrossRef] [Green Version]
- Rossignol, N.; Delvenne, P.; Turcanu, C. Rethinking Vulnerability Analysis and Governance with Emphasis on a Participatory Approach. Risk Anal. 2015, 35, 129–141. [Google Scholar] [CrossRef] [PubMed]
- Birkmann, J.; Cardona, O.D.; Carreño, M.L.; Barbat, A.H.; Pelling, M.; Schneiderbauer, S.; Kienberger, S.; Keiler, M.; Alexander, D.; Zeil, P.; et al. Framing vulnerability, risk and societal responses: The MOVE framework. Nat. Hazards 2013, 67, 193–211. [Google Scholar] [CrossRef]
- Kumar, P.; Geneletti, D.; Nagendra, H. Spatial assessment of climate change vulnerability at city scale: A study in Bangalore, India. Land Use Policy 2016, 58, 514–532. [Google Scholar] [CrossRef]
- Toth, F.L.; Hizsnyik, E. Managing the inconceivable: Participatory assessments of impacts and responses to extreme climate change. Clim. Chang. 2008, 91, 81–101. [Google Scholar] [CrossRef]
- Swart, R.J.; Fons, J.; Geertsema, W. Urban Vulnerability Indicators: A Joint Report of ETC-CCA and ETC-SIA; ETC CCA: Copenhagen, Denmark, 2012. [Google Scholar]
- Füssel, H.M.; Klein, R.J.T. Climate change vulnerability assessments: An evolution of conceptual thinking. Clim. Chang. 2006, 75, 301–329. [Google Scholar] [CrossRef]
- Luckenkotter, J.; Lindner, C.; Greiving, S. Methodology for an integrated climate change vulnerability assessment. In European Climate Vulnerabilities and Adaptation: A Spatial Planning Perspective; Wiley-Blackwell: Chichester, UK, 2013. [Google Scholar]
- Nelson, R.; Kokic, P.; Crimp, S.; Meinke, H.; Howden, S.M. The vulnerability of Australian rural communities to climate variability and change: Part I—Conceptualising and measuring vulnerability. Environ. Sci. Policy 2010, 13, 8–17. [Google Scholar] [CrossRef]
- Van Vuuren, D.P.; Den Elzen, M.G.J.; Lucas, P.L.; Eickhout, B.; Strengers, B.J.; Van Ruijven, B.; Wonink, S.; Van Houdt, R. Stabilizing greenhouse gas concentrations at low levels: An assessment of reduction strategies and costs. Clim. Chang. 2007, 81, 119–159. [Google Scholar] [CrossRef]
- Riahi, K.; Grübler, A.; Nakicenovic, N. Scenarios of long-term socio-economic and environmental development under climate stabilization. Technol. Forecast. Soc. Chang. 2007, 74, 887–935. [Google Scholar] [CrossRef]
- Štěpánek, P.; Zahradníček, P.; Huth, R. Interpolation techniques used for data quality control and calculation of technical series: An example of a Central European daily time series. Idojaras 2011, 115, 87–98. [Google Scholar]
- Štěpánek, P.; Zahradníček, P.; Farda, A. Experiences with data quality control and homogenization of daily records of various meteorological elements in the Czech Republic in the period 1961–2010. Idojaras 2013, 117, 123–141. [Google Scholar]
- Déqué, M. Frequency of precipitation and temperature extremes over France in an anthropogenic scenario: Model results and statistical correction according to observed values. Glob. Planet. Chang. 2007, 57, 16–26. [Google Scholar] [CrossRef]
- Štěpánek, P.; Zahradníček, P.; Farda, A.; Skalák, P.; Trnka, M.; Meitner, J.; Rajdl, K. Projection of drought-inducing climate conditions in the Czech Republic according to Euro-CORDEX models. Clim. Res. 2016, 70, 179–193. [Google Scholar] [CrossRef] [Green Version]
- Royé, D. The effects of hot nights on mortality in Barcelona, Spain. Int. J. Biometeorol. 2017, 61, 2127–2140. [Google Scholar] [CrossRef] [PubMed]
- Liu, X.P.; Zhang, J.Q.; Tong, Z.J.; Bao, Y. GIS-based multi-dimensional risk assessment of the grassland fire in northern China. Nat. Hazards 2012, 64, 381–395. [Google Scholar] [CrossRef]
- Araya-Muñoz, D.; Metzger, M.J.; Stuart, N.; Wilson, A.M.W.; Alvarez, L. Assessing urban adaptive capacity to climate change. J. Environ. Manag. 2016, 183, 314–324. [Google Scholar] [CrossRef] [PubMed] [Green Version]
- Kok, K.; Biggs, R.; Zurek, M. Methods for developing multiscale participatory scenarios: Insights from Southern Africa and Europe. Ecol. Soc. 2007, 12, 8. [Google Scholar] [CrossRef]
- Walz, A.; Lardelli, C.; Behrendt, H.; Grêt-Regamey, A.; Lundström, C.; Kytzia, S.; Bebi, P. Participatory scenario analysis for integrated regional modelling. Landsc. Urban Plan. 2007, 81, 114–131. [Google Scholar] [CrossRef]
- Reed, S.O.; Friend, R.; Toan, V.C.; Thinphanga, P.; Sutarto, R.; Singh, D. “Shared learning” for building urban climate resilience—Experiences from Asian cities. Environ. Urban. 2013, 25, 393–412. [Google Scholar] [CrossRef]
- Measham, T.G.; Preston, B.L.; Smith, T.F.; Brooke, C.; Gorddard, R.; Withycombe, G.; Morrison, C. Adapting to climate change through local municipal planning: Barriers and challenges. Mitig. Adapt. Strateg. Glob. Chang. 2011, 16, 889–909. [Google Scholar] [CrossRef]
- Chu, E.; Anguelovski, I.; Carmin, J. Inclusive approaches to urban climate adaptation planning and implementation in the Global South. Clim. Policy 2014, 14, 417–441. [Google Scholar] [CrossRef]
- Hardoy, J.; Romero Lankao, P. Latin American cities and climate change: Challenges and options to mitigation and adaptation responses. Curr. Opin. Environ. Sustain. 2011, 3, 158–163. [Google Scholar] [CrossRef]
- Reed, M.S. Stakeholder participation for environmental management: A literature review. Biol. Conserv. 2008, 141, 2417–2431. [Google Scholar] [CrossRef]
- Hardoy, J.; Ruete, R. Incorporating climate change adaptation into planning for a liveable city in Rosario, Argentina. Environ. Urban. 2013, 25, 339–360. [Google Scholar] [CrossRef] [Green Version]
- Araya-Muñoz, D.; Metzger, M.J.; Stuart, N.; Wilson, A.M.W.; Carvajal, D. A spatial fuzzy logic approach to urban multi-hazard impact assessment in Concepción, Chile. Sci. Total Environ. 2017, 576, 508–519. [Google Scholar] [CrossRef] [PubMed] [Green Version]
- Buchin, O.; Hoelscher, M.T.; Meier, F.; Nehls, T.; Ziegler, F. Evaluation of the health-risk reduction potential of countermeasures to urban heat islands. Energy Build. 2016, 114, 27–37. [Google Scholar] [CrossRef]
- Urban, A.; Burkart, K.; Kyselý, J.; Schuster, C.; Plavcová, E.; Hanzlíková, H.; Štěpànek, P.; Lakes, T. Spatial patterns of heat-related cardiovascular mortality in the Czech Republic. Int. J. Environ. Res. Public Health 2016, 13, 284. [Google Scholar] [CrossRef] [PubMed]
- Kyselý, J.; Plavcová, E. Declining impacts of hot spells on mortality in the Czech Republic, 1986–2009: Adaptation to climate change? Clim. Chang. 2012, 113, 437–453. [Google Scholar] [CrossRef]
- Yiannakou, A.; Salata, K.-D. Adaptation to Climate Change through Spatial Planning in Compact Urban Areas: A Case Study in the City of Thessaloniki. Sustainability 2017, 9, 271. [Google Scholar] [CrossRef]
- Icaza, L.E.; Van Den Dobbelsteen, A.; Van Der Hoeven, F. Integrating urban heat assessment in urban plans. Sustainability 2016, 8, 320. [Google Scholar] [CrossRef]
- Nelson, R.; Kokic, P.; Crimp, S.; Martin, P.; Meinke, H.; Howden, S.M.; de Voil, P.; Nidumolu, U. The vulnerability of Australian rural communities to climate variability and change: Part II—Integrating impacts with adaptive capacity. Environ. Sci. Policy 2010, 13, 18–27. [Google Scholar] [CrossRef]


| Prague | Pilsen | Brno | |
|---|---|---|---|
| Population (city/metropolitan area) a | 1,280,508/1,999,732 (1st in CZE/1st in CZE) | 189,131/309,395 (4th in CZE/7th in CZE) | 377,973/609,114 (2nd in CZE/3rd in CZE) |
| Area (city/metropolitan area) | 496 km2/4983 km2 | 138 km2/1,364 km2 | 230 km2/1755 km2 |
| Climate regions b | warm | warm | (very) warm with low precipitation |
| Average annual air temperature c | 8.1–11.0 °C | 8.1–10.0 °C | 8.1–11.0 °C |
| Average annual amount of precipitation c | 400–550 mm | 501–600 mm | 400–600 mm |
| Number of tropical days (1981–2010) | 11.5 | 12.3 | 12.3 |
| Number of tropical nights (1981–2010) | 0.6 | 0.2 | 0.6 |
| Number of heatwaves (1981–2010) | 5.2 | 6.4 | 7.1 |
| Prague | Pilsen | Brno | |
|---|---|---|---|
| Date of 1st workshop | 20 April 2015 | 21 April 2015 | 24 April 2015 |
| Number of participants | 36 | 36 | 41 |
| Stakeholder groups | |||
| City Hall and Municipal Districts | 8 | 12 | 15 |
| Regional Authority | NA | 2 | 3 |
| Public service providers | 6 | 5 | 3 |
| NGOs | 7 | 4 | 7 |
| Entrepreneurs | 2 | 4 | 5 |
| Academia | 13 | 9 | 8 |
| Date of 2nd workshop | 25 November 2015 | 24 November 2015 | 3 December 2015 |
| Number of participants | 55 | 39 | 40 |
| Indicator | Input Data | Data Source | Data Specification/Resolution |
|---|---|---|---|
| Exposure | Heatwave indicator | EURO CORDEX scenarios: baseline (1981–2010), future RCP 4.5 and RCP 8.5 (2021–2040) | 500 m resolution |
| Sensitivity | Population density | CZSO—Statistical Yearbook of Prague, 2014 | Municipal district level |
| Elderly population (% of people over the age of 65) | CZSO—Statistical Yearbook of Prague, 2014 | Municipal district level | |
| Share of urban green spaces | Master Plan of the City of Prague | Municipal district level | |
| % of built-up areas | Master Plan of the City of Prague | Municipal district level |
© 2018 by the authors. Licensee MDPI, Basel, Switzerland. This article is an open access article distributed under the terms and conditions of the Creative Commons Attribution (CC BY) license (http://creativecommons.org/licenses/by/4.0/).
Share and Cite
Krkoška Lorencová, E.; Whitham, C.E.L.; Bašta, P.; Harmáčková, Z.V.; Štěpánek, P.; Zahradníček, P.; Farda, A.; Vačkář, D. Participatory Climate Change Impact Assessment in Three Czech Cities: The Case of Heatwaves. Sustainability 2018, 10, 1906. https://doi.org/10.3390/su10061906
Krkoška Lorencová E, Whitham CEL, Bašta P, Harmáčková ZV, Štěpánek P, Zahradníček P, Farda A, Vačkář D. Participatory Climate Change Impact Assessment in Three Czech Cities: The Case of Heatwaves. Sustainability. 2018; 10(6):1906. https://doi.org/10.3390/su10061906
Chicago/Turabian StyleKrkoška Lorencová, Eliška, Charlotte E. L. Whitham, Petr Bašta, Zuzana Veronika Harmáčková, Petr Štěpánek, Pavel Zahradníček, Aleš Farda, and David Vačkář. 2018. "Participatory Climate Change Impact Assessment in Three Czech Cities: The Case of Heatwaves" Sustainability 10, no. 6: 1906. https://doi.org/10.3390/su10061906