Abstract
It is generally difficult to assess the performance of an infrastructure with a substantially longer life span than economic models can handle, and the life cycle concepts in urban water systems are normally limited to single-asset projects. In order to explore the long-term impact of urban water infrastructure rehabilitation strategies, a life cycle approach for survival functions is suggested. A life cycle factor based on survival functions is introduced, which is a measuring value of the total expected service life of all pipes within a group of pipes. Another factor, termed the sustainability factor, is based on the relationship between the life cycle factor and a rehabilitation reference method, which makes it possible to correct the long-term performance of rehabilitation methods based on their expected service life provision. A case study presents the implications for investments in infrastructure rehabilitation when applying the sustainability factor in long-term planning, and shows the importance of considering the service life of rehabilitation methods when planning renewal interventions that minimize costs over their life cycles.
1. Introduction
The Norwegian Government has declared Norway to be a pioneering nation with regards to the implementation of sustainable development [1]. Maintaining sustainable development in infrastructure projects across the country will be one of the main components to achieve this objective in the long-term. One of the key components of moving towards sustainable management of the urban water pipe system is the evaluation and selection of sustainable rehabilitation interventions. This paper presents a method to facilitate utilities in selecting the most sustainable rehabilitation strategy for urban water piped systems where long-term impacts over the next century and beyond is taken into consideration. The method is based on a normalization of the lifetime expectancy of rehabilitation methods according to a reference method, which means that all rehabilitation strategies can be compared on equal grounds with no short-term preferential treatment.
The method presented in this paper is based on rehabilitation of piped systems. Piped systems are normally related to so-called legacy systems, which refers to the use of existing technological solutions used in urban water systems. The principle of Sustainable Urban Water Management (SUWM) is, therefore, discussed, where the overall idea is the transition from centralized to decentralized systems in all parts of the urban water system [2], with the introduction of new technologies. Marlow et al. [2] promoted an approach going forward that combines the use of existing legacy technologies and new decentralized solutions into a ‘hybridization process’. The authors argue that piped systems will be part of both hybrid and SUWM systems into the future, and present our case for methodology on this premise.
1.1. The Definition of Life Cycles in the Urban Water Infrastructure
ISO 55000 describes an asset life as the period from its creation to the end of its life [3]. This is what is normally defined as the ‘lifetime’ of an asset, or ‘average lifetime’ of a group of assets [4]. ISO 14040 defines a life cycle as ‘consecutive and interlinked stages of a product system, from raw material acquisition or generation from natural resources to final disposal’ [5] (p. 2). In other words, it includes the time from the construction of an asset to its ‘death’, which comprise the whole period of which an asset can impact sustainability, both positive and negative. The term ‘from cradle to grave’ is often used. When dealing with an infrastructure, such as the urban water system, they are often considered as infinite with no definite end of life [6]. When an asset of the urban water infrastructure reaches the end of its life, it is replaced by a new asset. As this happens on a regular basis, the urban water infrastructure will be replaced small bits at a time, extending its lifetime infinitely. Alegre et al. [6] alleges that a traditional life cycle approach is not applicable on the urban water system due to the indefinite nature of the infrastructure. We do, however, argue that a life cycle approach can be applied to the urban water infrastructure when the focus is altered from single assets to groups of assets, referred to as cohorts. Cohorts are a collection of homogeneous pipes, which, more or less, follow the same deterioration pattern. The end of an asset life can be caused by a number of different reasons, e.g., physical deterioration, area-based rehabilitation, coordinated rehabilitation with another infrastructure, need for hydraulic capacity increase, or phasing out of old pipe materials. The actual life of a pipe can, therefore, vary greatly between pipes within the same cohort and should, therefore, be referred to as ‘service lives’ [4]. Many of these decisions for replacing assets are not optimized and will cause a premature end of asset life with regards to their physical condition. When a pipe is replaced for example due to coordination practice with road renewal, the physical condition of the pipe will often indicate that it still can be in operation for quite some time. However, often the benefits of the coordination work will outweigh the negative impact of the truncated service life of the pipe. Such benefits can be reduced costs, reduced environmental impact (less digging), and reduced community interference by reducing the number of interventions in the area. Water utilities are also often limited by budgets on the one side, and challenged by necessary renewal demands on the other, forcing them to make decisions that reduce costs and increase the efficiency of rehabilitation work. This paper will give utilities decision-making support as they scramble to make the right decisions with regards to these aspects. The variation of lifetimes within cohorts is best described by a ‘service life’ function which represents the variation of actual lifetimes. The ‘service life’ function represents the statistically distributed service lives of the assets within a cohort. These functions are normally referred to as ‘survival functions’ [4] (see Figure 1), which give the probability that a pipe within a cohort will survive beyond a given age. A survival function for urban water infrastructure was first defined by Herz [7], which is referred to as the ‘Herz function’.
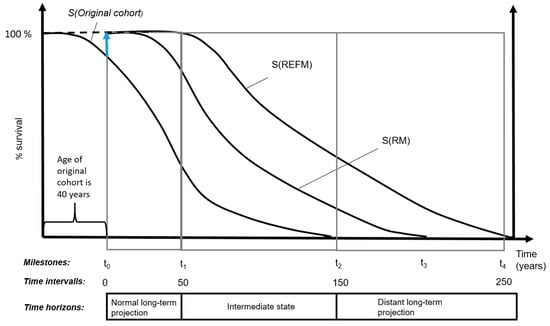
Figure 1.
Conceptual illustration of survival functions used to calculate LCF values.
1.2. Sustainability and the Life Cycle Approach in Urban Water Asset Management
There is a need for a more holistic approach to sustainability assessment of rehabilitation strategies. The holistic approach means that sustainable development are considered through all three levels of asset management; the operational, the tactical and the strategic level. The authors are critical of short- to medium term sustainability analyses, as they neglect the long-term impacts of rehabilitation projects. The consequence of this approach is that certain negative impacts on sustainability can be postponed to future generations. We, therefore, suggest viewing sustainability of pipe network renewal in a life cycle perspective, something that has normally only been applied to single projects in the past. Defining the life cycle concept for an infrastructure as comprehensive as the urban water system can be challenging, at least when the objective is to construct an approach that can be used in modelling purposes. Sahely et al. [8] writes about the challenge of transforming sustainability principles into something that can be used in operational models, and Marlow et al. [9] writes about the challenge of combining two decision-making concepts that are vital to the future health of the urban water services, effective asset management, and sustainable development. These two concepts can often be at conflict with each other, especially when there are conflicting objectives for resource use [10]. Most utilities have an integrated asset management system and may have a commitment to the principles of sustainability, but lack an implementation of these principles within the decision-making process. There is also a lack of clarity of what sustainable development means to water professionals and how it can be practically applied in real water utility problems [11]. Ashley et al. [12] states that sustainability has been an ‘elusive’ concept in the water industry, but say that water engineers now understand the need for decisions involving asset investments to include principles of sustainability. Marlow et al. [9] identifies the need for utilities to ensure that the principles of sustainability will be implemented into operational tools and processes. Integrating principles of sustainability into frameworks will help in this endeavour. Since the asset stock of the urban water systems comprises so much of the historic capital investment of a utility, asset management should be a key component for driving a utility towards sustainable development [10]. Asset management will be an important component in urban water management for obtaining sustainability [9] since sustainable development requires effective management of the urban water system [13,14]. A key objective of this paper is, therefore, to construct a tool and a process for the implementation of long-term sustainable strategic measures based on asset management principles.
Slagstad and Brattebo [15] states that, although the concept of LCA has been used in the water sector for some time, there is a lack of studies focusing on the urban water system as a whole. They list three central publications on system wide LCA, none of which look at system-wide rehabilitation. The LCA assessment published in Slagstad and Brattebo [15] focuses on the life cycle environmental impact of the operation of the urban water systems, and not the construction. Recent literature show that sustainability research in the water sector focuses mostly on the topics of operation and maintenance of the urban water systems [16,17,18], or it focuses purely on environmental impacts (instead of overall sustainability) [18,19,20,21,22,23,24,25,26,27,28]. Some studies look specifically at the life cycle performance of different pipe materials [29,30] or renovation methods [31] where the goal is to quantify the environmental impact of the products. Vahidi et al. [30] calculates unit values for sustainability impact of four different pipe materials across the phases of production, transportation, installation, and maintenance. In such cases the main focus is the material, so rehabilitation work and the lifetime distribution of the systems are neglected. The literature is quite comprehensive on these issues of LCA, but there are deviations from this form of analyses, although not being the norm. One such paper is the study on sustainability criteria for urban infrastructure systems by Shaley et al. [8], where indicators are suggested across the three sustainability dimensions. In Venkatesh et al. [32] the construction of the wastewater system is considered to an extent (renovation methods), although the focus is also here only on the environmental impact. Beheshti and Sægrov [28] analysed the sustainability of different strategic interventions in the wastewater system, looking specifically at indicators of emission, energy consumption, costs, treatment need, and total asset stock length. The paper assesses the overall sustainability of interventions, but does so on a system level scale (grand strategic directions for the wastewater system) where the purpose is not to review different rehabilitation strategies. The most relevant paper the authors have been able to find on the subject matter is one published by Herz and Lipkow [33], which use survival functions to calculate rehabilitation needs and looks at the mass and energy flow of water and sewer pipes through their production and construction, operation, and later renovation. The paper presents an overview of the relative impact of construction vs. operation, but does not consider the different lifetime expectancies of no-dig methods vs. replacement. No-dig, therefore, performs quite well in the emission calculations in the paper. The social aspect of sustainability is not considered in the study, and neither is the sustainability performance of different rehabilitation approaches and strategies.
No-dig methods are often considered to perform better than replacement, sustainability-wise. The problem with this conclusion occurs in cases where the service life of the no-dig method is considerably shorter than the service life of the replacement method. Such cases occur for example when a utility must decide between replacing a pipe or renovating it with a liner. In Norway, a liner is expected to have about 50% of the expected service life of the replacement technology [34] while, in Germany, some renovation methods are expected to have an even shorter service life [35]. In sustainability assessments, the expected service life of the assets is often considered an indicator of its performance. However, since the lifetime of an asset is directly affecting most of the other indicators, expected service life should instead be considered as a ‘governing factor’ for other sustainability indicators. This paper addresses that problem by presenting the ‘life cycle factor’ to define a ‘sustainability factor’ for each rehabilitation method. The sustainability factor is a normalized measure of the accumulated lifetime expectancy of all pipe within a cohort. The objective of the sustainability factor is to correct indicator values used in sustainability analyses, thus, adjusting their final values according to the service life that a method can deliver. This is done by weighing of the indicator values with the SF factor for the relevant strategy. A normal approach in LCA analyses is to use the expected lifetime of technologies as weighing in order to differentiate between the different lifetimes and their impacts on sustainability. The problem arises, however, when defining the expected lifetime. By using an average expected lifetime of a cohort, it would lead to a misrepresentation of reality, as asserted in Renaud et al. [4]. As stated in Section 1.1, and in Renaud et al. [4], pipes are renewed for a range of different reasons. Survival functions presents this range of lifetimes, and the method proposed in this paper, therefore, represents a statistically reasonable distribution of actual lifetimes.
The implementation of the sustainability factor makes it possible to compare rehabilitation methods and strategies irrelevant of their expected lifetimes and service life distributions, which leads to a more fair comparison of their long-term sustainability performance. Although the work by Stokes and Horvath [36] focuses solely on energy use and emissions, they conclude that such an analysis without the life cycle concept in mind can significantly underestimate the sustainability impacts. We try to base our procedure on the same reason of thought. That is why the overall objective of the paper is to link the strategic asset management approach with the sustainability concept of life cycles.
1.3. Integrated Rehabilitation Approaches
Whether the coordination of rehabilitation between different infrastructures is cost effective and sustainable or not has been a central topic of discussion in the water sector for quite some time. The approach of coordinating infrastructure rehabilitation is often called an integrated rehabilitation approach, where the objective is to optimize the rehabilitation. Rinaldi [37] looked into the idea, concept, and implications of interdependency between infrastructures. He described interdependencies, such as time and geographic scales, ripple effects, economy/business policy, and social aspects, and grouped interdependency models into six broad categories. Recent literature has expanded and improved interdependency modelling, and there are a variation of literature looking into different approaches to handle and model the integrated management of infrastructures. Tscheikner-Gratl et al. [38] propose using a street priority model where data on sewers, water pipes, roads, and surrounding areas were used to prioritize streets for rehabilitation. The approach uses the technical design life of the components in the prioritization process and are, thus, based on average lifetimes for pipes. As discussed by Renaud et al. [4], this might distort results. The same street priority approach was applied to a case study of a small utility in Tscheikner-Gratl et al. [34]. The case study suggests a street section rehabilitation plan based on the individual needs of sewer pipes, water pipes and roads. The paper states that dominant data availability for one infrastructure (sewer, in this case) can result in it being a main driver for rehabilitation. Osman [39] looks into the types of interdependencies of infrastructures and proposes a methods for single systems based on risk, level of service and life cycle costs. The model considers the benefits vs. trade-off between delaying or bringing forward rehabilitation of all parts of co-located infrastructure systems. Carey and Lueke [40] suggests using an evolutionary genetic algorithm to present five year capital investment plans. Their case study shows that savings and superior rehabilitation and maintenance can be achieved by coordinating rehabilitation instead of going the traditional route of producing and carrying out independent infrastructure rehabilitation plans. The common denominator of this literature is that integrated rehabilitation is approached from a bottom up tactical viewpoint. However, Tscheikner-Gratl [41] applies a top down approach by using a cohort survival model to model pipe deterioration on network level. Survival curves are referenced as ‘transition curves’, as they present a limit between acceptable and unacceptable conditions of sewer pipes. This model is then further coupled with a priority model in order to identify rehabilitation projects.
On a network scale we are proponents of the concept of survival functions and have, therefore, based our approach on the combination of several survival functions for rehabilitation of pipes and roads in order to model integrated rehabilitation. Our approach is, therefore, a top down approach meant to be used for identifying sustainable strategic decisions and not for identifying rehabilitation projects.
1.4. Definition of Concepts
In order to facilitate readability and understanding of the paper, we have summarized the definitions of the most relevant concepts and terminology in Table 1.

Table 1.
Definitions of the most relevant concepts and terminology used in the paper.
2. Method
According to Figure 1, the life cycle of a rehabilitation method starts at time t = t0, which is the time when the method is implemented in the network. This time also represents the inception of the survival function and the service provision of a specific rehabilitation method. The survival functions of the method ends at time t = t3 or t4, depending on the selected method. This is the conclusion of the service provision provided by the method, meaning when all of the pipes have been renewed again. At that point in time, the cycle for the rehabilitation method is complete. A survival function, therefore, represents a journey for the rehabilitation method from its cradle to its grave, which coincide with the life cycle concept. We, therefore, argue that the life cycle of a cohort can be defined by its survival function.
For some rehabilitation methods (e.g., non-structural no-dig), a second renewal phase (which represents the time when the rehabilitated pipes must be renewed again) occurs much earlier than for other methods (e.g., replacement). For the methods with shorter life cycles, a secondary investment in renewal will have to be implemented after 20–30 years. In Figure 1 we can see this rehabilitation need occurring halfway between t0 and t1. For the reference method, this secondary investment occurs much later, after t1. The choice of rehabilitation method will, therefore, specifically affects the renewal and investment needs that future generations will have to cope with. To include this aspect in the assessment of the sustainability of rehabilitation methods is essential. If the sustainability of strategies are compared over a period of 30 to 50 years (which is the norm in long-term planning), all or most of this second renewal phase is left out. In Figure 1 this normal long-term projection period is defined by the time between t0 and t1. This is the projection window that utility managers normally work within in long-term planning. As the main activity of rehabilitation work happens between t1 and t2, which is the period that is covering the largest area of the survival functions, the managers lose a great deal of information necessary to make decisions that are cost-effective and sustainable over the life cycles of the methods.
As different rehabilitation methods have varying impact on sustainability over their lifetime, an analysis should, therefore, allow for the impact of strategies over their entire life cycles, as defined by the survival functions of the methods. The factor of service lifetime to govern the size of other indicators is implemented through the life cycle factor (LCF). A LCF for each rehabilitation method is based on the integral of its Herz function (defined in Table 1), as defined by Equations (1) and (2). By calculating its integral, the area below the Herz function which represents the total expected service lifetime of the cohort as a function of all its pipes, is used to describe its LCF:
where LCF = Life cycle factor
REFM = Reference method
RM = Rehabilitation method
S (REFM) = survival function for the reference rehabilitation method, which is the method with the longest expected lifetime. This is normally replacement. See Figure 1 and Table 2.
S (RM) = survival function for the specific rehabilitation method that is analysed (see Figure 1).
t1, t3, and t4 are values that are related to Figure 1 as they represent different specific times in the future. t0 is the present time, representing the start of the implementation of a rehabilitation method, when existing pipes in the network is renewed with a chosen method. According to Figure 1, rehabilitation of an existing cohort in the network, represented by S(original cohort), starts at t0. T3 represents the time in the future when all pipes of a rehabilitation method have been renewed a second time. t4 represents the time in the future when all pipes of the reference method have been renewed a second time. t3 and t4 are, therefore, the end of the survival function of the rehabilitation and reference methods.
The survival function which is needed to calculate the LCF is given by the Herz function with data for the relevant rehabilitation method. The t3 and t4 values for the rehabilitation and reference methods are given by the point where the survival function moves towards infinity. The LCF for a rehabilitation method will, therefore, more specifically be as given by Equation (3):
The equation within the brackets is the definition of the Herz function when time t is greater than c. When time t moves towards infinity, the function moves towards 0. The a, b, and c values are defined as the follows:
a: the intensity of the ageing process after first rehabilitation.
b: the final failure rate of the oldest and most durable pipes.
c: the resistance factor, which is the time until the first rehabilitation.
The method then relies on a normalization of rehabilitation methods to each other, based on the expected lifetime of the method expressed through its LCF. The comparison of the calculated LCF of each rehabilitation method to the LCF of the reference method results in a sustainability factor (SF) for each method, which can be used in sustainability assessments of rehabilitation methods and strategies to adjust the sustainability according to expected service life provision of the given method. The SF is calculated as defined by Equation (4):
The SF normalizes rehabilitation methods according to the reference method and can take into consideration the impact of all indicators over the life cycle of a cohort. This will be illustrated with a case study later in the paper. Figure 1 illustrates the survival functions which are the basis to calculate the LCF and the SF values. The figure is, therefore, an example of how to understand the methodology and its benefits. The LCF is the area below the survival function curves, representing the time-area that a rehabilitation method covers, while the SF is the value that S(RM) will have to be multiplied with in order to cover the same area as S(REFM). Time t0 represents the present time and the implementation of a selected rehabilitation method. In this case, this implies the rehabilitation of S(original cohort) with either S(RM) or S(REFM). The implementation of a rehabilitation method is illustrated with the vertical blue arrow. From then on, the original cohort will be rehabilitated with the selected method all the way until it reaches time t2, which illustrates the milestone when all pipes in the original cohort have been replaced.
Which rehabilitation method to implement is the challenge of the utility manager. From the figure we can see that the S(REFM) has a substantially longer lifetime expectancy, and thus a larger LCF, than the S(RM). A research question should, therefore, revolve around the potential impact on sustainability or costs by choosing the best available method, the reference method, vs. the implementation of an inferior method, e.g., a non-structural no-dig method. The lower unit costs and the reduced environmental impact of the non-structural method can then be weighed against its substantially shorter lifetime expectancy. The case study of this paper answers this research question for costs for a given case study city.
Anything before t0 is the past, while anything afterwards is the future. The original cohort in this illustrative case is imagined to be 40 years old, and from the survival function S(original cohort) we can see that the first rehabilitation was done about 25 years ago. The first incline of the survival function illustrates this first rehabilitation. These values are given as examples for illustrative purposes and are not used in the analysis.
Time t1 is the normal projection period applied in long-term planning of water utilities, which is up to 50 years. Time t2 represents the end of the original survival function S(original cohort), the cohort which is being replaced, while t3 and t4 represent the same for the rehabilitation and reference methods. The meaning of the time horizons will be discussed more extensively in the Discussion section, where we look at the benefit of looking at the ‘distant long-term projection’ period vs. looking only at the time interval of the ‘Normal long-term projection’ period.
As an example on how to use the figure and the method, we describe a short example. Figure 1 is an example of two possible directions on how to rehabilitate a 40 year old cohort of pipes. The first pipes of this original cohort, named S(original cohort), was built around 40 years ago. The oldest pipes of the cohort is, therefore, 40 years, and the cohort are already in need of renewal. The first pipes in the cohort were rehabilitated about 25 years ago. In the figure there are two choices: either rehabilitate the existing cohort with a no-dig method with an expected service life given by the function S(RM), or rehabilitate it with replacement with an expected service life given by the function S(REFM). When assessing the two possibilities, a normal projection period is up to 50 years into the future, correlating to the area between t0 and t1. This period only deals with small portions of the impact of the two rehabilitation approaches. The main impact of the approaches can be found in the second time period, the ‘intermediate state’, and for the reference method the impact can be seen lasting long into the ‘distant’ period. In this example, we will not be able to fully calculate the cost of a rehabilitation method by only looking at the ‘normal’ projection period. Within the ‘normal’ time period both of the rehabilitation approaches are fairly new and have not resulted in any secondary costs (costs caused by the method itself in need of renewal). However, when we reach the ‘intermediate’ period, both of the approaches bring about massive secondary costs due to a secondary renewal need (which means that the renewal method itself is in need of renewal). This whole secondary cost aspect is more or less lost in the ‘normal’ projection approach. As we can see that the S(RM) is in need of a secondary renewal long before S(RM), the difference in impact on costs between these two methods is substantial. The idea of the SF factor is that it will take the varying degree of service life expectancy of the methods into consideration, giving the user a tool to assess life cycle values without having to calculate life cycle costs and without having to perform life cycle analyses for each approach and each method.
Summary of Method
As a summary of the method and how SF factors can be built and used, we have constructed a flow chart that explains the process step-by-step (see Figure 2). It gives the reader and overview of the proposed process. Steps 1–4 show the process described in the Method chapter, while Step 5 is the process shown in the case study in Section 4.
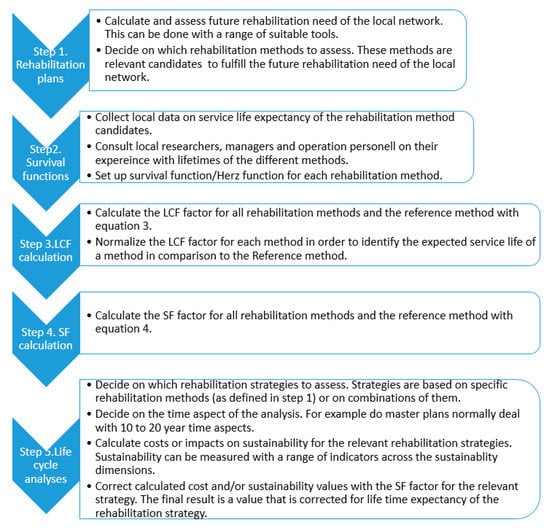
Figure 2.
A flow chart of the process to create and use SF-factors in long-term planning and management of urban water networks.
3. Results
The first step to calculate LCF and SF values for the rehabilitation methods was to define the most relevant rehabilitation methods and their respective survival functions. In order to build a Herz survival function, three percentiles of survival of each cohort was defined. These are lifetime predictions for 100%, 50%, and 10% survival of the cohorts. A study was performed in order to define the survival functions for different rehabilitation methods and approaches in the Norwegian water sector. The data used in this paper to create survival functions is, therefore, based on data specific for Norwegian conditions. A thorough description of this process and its data is found in Rygg [43]. After the survival function was defined for each specific rehabilitation method, a LCF and SF was calculated based on the procedure described in Section 3. The software CARE-W LTP [44] was used to define the Herz functions for the rehabilitation methods, based on the 100, 50, and 10 percentiles found from the Norwegian study. The 100, 50, and 10 percentiles were imported into the program in order to define the a, b, and c values of the Herz function. The Herz function (defined in Equation (3)), was then used to calculate the LCF value for the rehabilitation methods. Equation (3) was used for this purpose. Furthermore, Equation (4) was used to calculate the SF values of the rehabilitation methods. We decided to look specifically at four different rehabilitation methods (1–4) plus two rehabilitation approaches (5–6). They are the following:
- No-dig—non-structural
- No-dig—semi-structural
- No-dig—structural
- Replacement
- Coordinated replacement of sewer and water pipes
- Coordinated replacement of water and sewer pipes with roads
The reason for looking at these six situations is that they cover the most utilized rehabilitation approaches currently used in Norwegian water utilities. Rehabilitation method 4, replacement of pipes, was defined as the reference method since it has the highest defined survival function. The method includes digging and replacing old pipes with new pipes of materials like PE and ductile iron pipes for drinking water, and materials like PE and concrete pipes for sewer. Methods 1–3 are variations of no-dig methods applied in drinking water pipes. Method 1, the non-structural method, is based on the application of epoxy on the inside of pipes to avoid further corrosion. The semi-structural no-dig method is based on the insertion of a liner within an existing pipe in order to improve its structural strength and hydraulic capacity. The structural method represents the use of no-dig methods within existing pipes that have full structural integrity on its own. Insertion of a PE pipe within an existing pipe is an example of a structural no-dig method.
We consider methods 5 and 6 to be approaches to rehabilitation since they combine methods and also incorporate other infrastructure in order to reduce overall costs and the sustainability impact. For the simplicity of the paper, we refer to all six of them as rehabilitation approaches from now on. Rehabilitation approach 5 means that a water pipe is replaced every time a wastewater pipe is replaced, and vice versa. This means that ‘adjacent sewer and water pipes are systematically replaced together when any of the two pipes has reached an unacceptable deterioration level’ [45] (p. 3). The theory of combining the survival function of sewer pipes with the survival function of water pipes as a way of modelling coordinated rehabilitation is given in Pericault et al. [45]. In the coordinated rehabilitation we have assumed 50% dependent and 50% independent rehabilitation. Dependent rehabilitation is defined as a case where the deterioration of the water and wastewater pipe in the same trench is dependent and, therefore, more or less have the same deterioration level, while independent rehabilitation is the opposite. Being dependent means that the deterioration of the water pipe is caused by the same reasons as deterioration of the wastewater pipe [45]. An example of this is poor execution of trench work which mechanically affects both pipes, especially during winter time with frost heave. When the deterioration is not dependent, it means that deterioration of the water and sewer pipes are caused by two non-relatable reasons. An example of this is corrosion on a water pipe of ductile iron, which does not affect a wastewater pipe of PE. We use a split combination of the two approaches since we believe both of the situations to occur in a real network. Since we do not know the distribution of the split, we assume the split is evenly between the dependent and independent situation. As per Pericault et al. [45], the survival functions for dependent (Equation (5)) and independent (Equation (6)) situations are defined by the following equations:
where:
Ssw(t) = Combined survival function for water and sewer pipes.
Ss(t) = Survival function for sewer pipes.
Sw(t) = Survival function for water pipes.
In practical terms, Equation (5) states that the coordinated survival function when the condition of the pipes are dependent will always follows the path of the minimum of the two functions. It means that the water and sewer pipes condition will develop along the same line of survival. However, when the condition is not dependent, the coordinated survival function is a product of the two singular functions. Survival of the coordinated system at time t requires that both the sewer and the water pipe is in functional state at time t. According to Pericault et al. [45], the probability of the coordinated system survival can, therefore, be expressed as the product between Ss(t) and Sw(t). Rehabilitation approach 6, ‘replacement coordination with roads’, means that rehabilitation of the water and sewer pipes are done simultaneously with rehabilitation of roads. In this instance, rehabilitation of the pipes are always made in conjunction with roadwork preceding the coordinated survival function of the water and sewer pipes in order to maintain service levels, thus cutting short the useful life of the pipes. The survival function of roads are based on Nordic numbers [46]. An average survival function for roads in Trondheim was found by calculating an average value for a representative selection of roads in the city for the average annual daily traffic. The survival of roads is defined as the time to need for re-paving of the road. Theories for combining the survival function of coordinated replacement of pipes with the survival function of roads are found in Rygg [43] and Pericault et al. [45]. The theory of Pericault et al. [45] states that survival functions for roads can also be built on something referred to as dependent or independent theories, which states that the lifetime of a road is dependent on its preceding lifetime, or that it is independent on its preceding lifetime. In this paper, we assume that survival functions are based on the dependent theory, based on the fact that rehabilitation intervals for roads in Norway are based mainly on their average annual daily traffic number.
Results—LCF and SF Values
Based on a study of past Norwegian rehabilitation projects, literature study about pipe deterioration in Norway and the theory supporting the combination of survival functions (see discussion in the introduction of Section 3) for coordination projects, survival functions could be defined for each rehabilitation approach (numbers 1–6) based on Norwegian conditions [43]. These survival functions can be described by the, b and c values of the Herz function, see Section 3 and Table 2. Equations (1)–(4) were then used to calculate the individual LCF and SF values, which are presented in Table 2.
Table 2.
Area values (based on LCF calculations) and SF values for six rehabilitation approaches.
A rehabilitation approach with a survival function that covers a large amount of area has a high LCF factor and a low SF factor. From Table 2, it can, for example, be seen that the non-structural no-dig method will have to be multiplied with 2.39 in order to achieve the same level of LCF factor (and cover the same area) as given for the reference method.
4. Case Study
We decided to test the impact of applying the SF factor for different rehabilitation approaches in a Norwegian case study. The objective of the case study was to show the application of the SF factor and how it can affect long-term costs of different rehabilitation strategies. The city selected for the case study was Trondheim, which is a city in the middle of Norway with a population of about 190,000 people. We also decided to focus on the drinking water network with a total length of 791 km and an average age of 42 years. The idea was to assess the total cost of seven different rehabilitation strategies over an analysis period of 15 years. Norwegian water utilities make master plans that normally span a period of 10 to 15 years. They calculate rehabilitation and investment needs over the master plan period. This is why 15 years was selected as the analysis period in the case study.
We decided to assess the total cost of seven different rehabilitation strategies, based on different combinations of the six rehabilitation approaches presented in Section 3. These seven rehabilitation approaches are presented along with results in Section 4.3. We had two considerations to make:
- As a water utility, what will the strategy cost us the next 15 years?
- B. In a life cycle perspective, what will the impact of the strategy be on economic sustainability, measured against the cost over the 15 years?
There will always be need for a balance between available budget for rehabilitation and the impact on long-term sustainability. By implementing the SF factor into the cost calculations, it makes it possible for utility managers to see the long-term impact of their investment decisions, and not just the impact within the planning period. The SF factor adjusts the expected cost of a rehabilitation strategy based on the expected economic impact a strategy will have during its life cycle. It is, therefore, a tool to assess the balance between available budgets and long-term sustainability.
4.1. Assumptions and Simplifications
We had to make some assumptions about background data in the study, which will be described in this section. Below, we describe the necessary assumptions made generally, when calculating coordination of water and sewer pipe renewal, when calculating coordination of water pipe, sewer pipe and road renewal, and when calculating costs.
Generally
We made the following general assumptions as basis for our calculations:
- -
- When using no-dig, we assume a split between the use of structural and non-structural methods of 50/50, which means that the SF factor for no-dig will be a combination of the SF factor for the two methods.
- -
- The strategies of ‘coordination of water and sewer’ and ‘coordination of water, sewer, and roads’ are based on the assumption that water and sewer pipes in a common trench are of more or less the same age. This means that cases where one of the pipes has been replaced or renovated (or both at different times), is not applicable for the suggested coordination calculation without adapting the coordinated survival functions based on the expected deviation in age between water and sewer pipes. The reason for this is that the survival function for the coordinated renewal is based on the assumption that the water and sewer pipes are of the same age. The approach is robust enough to handle variations and difference in age to a certain degree. Pipes in the same trench are, therefore, assumed to be of more or less the same age. This assumption is to some extent supported by the data of Trondheim, as water pipes and old types of sewer pipes have almost identical average lifetimes. This supports the idea that on a network level the pipes are more or less of the same age, which also means that a lot of the water and sewer pipes in trenches share the same age. New sewer systems are built with other kind of pipes (split systems for sewer and storm water), and there have been very little renewal of these systems thus far. These pipes and the water pipes in the same trench are, therefore, most of the time of the same age. This further supports our assumption that water and sewer pipes are to a certain degree of the same age.
Coordination of water and sewer pipes
When calculating the strategy of coordinating renewal of water and sewer pipes we made the following assumptions:
- -
- In Norway, water and sewer pipes are placed in the same trench. This might give a higher benefit for coordination compared to other countries where this is not the case.
- -
- For the condition of water and sewer pipes, we assume a 50% dependent and a 50% independent distribution of pipes in the same trench. See Pericault et al. [45] for the distribution theory.
- -
- The cost is split in two, as they are shared by the water and the sewer pipe.
- -
- A rehabilitation is triggered by a water or a sewer pipe in need of renewal. The parallel water/sewer pipe is rehabilitated at the same time, independent of its condition.
Coordination of water, sewer, and roads
When calculating the strategy of coordinating renewal of water pipes, sewer pipes, and roads we made the following assumptions:
- -
- The rehabilitation of pipes is planned against a preceding road renewal which to a certain degree coincide with the water and sewer coordination curve. Optimal coordination between water, sewer and roads would imply that water and sewer pipes renewal are coordinated with the closest renewal curve for roads. Since optimal coordination between water, sewer, and roads are too optimistic in a real world case, we have assumed that the water and sewer pipes renewal can be coordinated against the second to last road renewal (instead of the last).
- -
- We assume that the lifetime of a road is dependent on its preceding lifetime. This is the norm in Norwegian road management when planning renewal intervals.
- -
- Cost associated with the laying of new road surface is neglected and set to 0. Costs related to the production and laying of new road surfaces are taken by the road management.
Costs
In the modelling, we made the following assumptions about cost calculations:
- -
- A 2.5% inflation rate is assumed for the cost calculations, based on an average inflation rate in Norway for the past 20 years of approximately 2.5%.
- -
- A 4% discount rate is assumed for the cost calculation based on a recommendation from the Norwegian Department of Finances concerning social economic analyses.
- -
- Coordinated work will lead to the need for a larger trench. This increase is assumed to be about 40%. The 40% increase in trench work for coordinated renewal (coordination of water + sewer, and coordination of water + sewer + roads) increases the cost for the trench work with 40%.
- -
- Coordinated work will lead to more tear up of old asphalt. This increase is assumed to be about 20%. The 20% increase in road work for coordinated renewal increases the costs for the road work with 20%. This is only relatable to the coordination of water and sewer pipes strategy.
The cost numbers are calculated based on data that we have received from the municipality of Trondheim. The cost data that we received was the following:
- -
- Unit costs for replacement and no-dig in city centres;
- -
- Unit costs for replacement and no-dig outside of city centres.
- ○
- We made an analysis on the amount of pipes within city centres vs. the amount of pipes outside of city centres. In order to do this we had to divide the city into two zones, depending on the density of industry, shops, and residents.
- -
- The split of rehabilitation costs between pipes, trench work, and road renewal.
- ○
- This information was used to calculate the different unit costs for the strategies of ‘replacement’, ‘coordination of water and sewer’, and ‘coordination of water, sewer, and roads’
- ○
- The cost for coordinated renewal of water and sewer pipes was found by doubling pipe costs, increasing trench costs by 40%, and increasing road costs by 20%. The total unit cost was then split in half due to the cost distribution between the water pipe and the sewer pipe.
- ○
- The cost for coordinated renewal of water, sewer and road was found by doubling pipe costs, increasing trench cost by 40%, and neglecting road cost since it is covered by the road management. The cost for the laying of a new road surface is shifted from the sewer/water infrastructure to the road infrastructure. Final unit cost was found by splitting the cost in two due to the cost distribution.
4.2. Data
In order to calculate the necessary annual rehabilitation need of the network of Trondheim for the next 15 years, we had to define a survival function for the existing network, as represented by the S(Original cohort) in Figure 1. Each of the rehabilitation strategies were then defined by their own survival function, as represented by the S(rehabilitation method) in Figure 1. This function would then be used to renew the pipes within the S(original cohort). For the network of Trondheim, the S(original cohort) would consist of seven different survival functions fitted to homogeneous groups of pipes. These seven groups of pipes and their parameters are presented in Table 3. In Table 4, we can find the 100%, 50%, and 10% survival of the same cohorts. The division of the cohorts and the values in Table 4 were determined based on discussions between the utility managers and scientific researchers, and data analysis of pipe failures and failure rates. These values were the input values for the calculation of future rehabilitation need with the program CARE-W LTP [45]. See Herz [47] for detailed information on the use of this program for long-term rehabilitation and investment planning.
Table 3.
The seven cohorts used to describe the drinking water network of Trondheim, their description and central parameters.
Table 4.
Input values for service life expectancy used in survival functions in CARE-W LTP.
The life time expectancy values in Table 4 were used together with the stock data of the drinking water network in Trondheim to calculate the annual future rehabilitation need for the next 15 years. The S(original cohort) was made up of the seven cohorts with different survival functions. In order to calculate the investment need for rehabilitating the existing network, we needed unit costs (per meter) for the different rehabilitation methods relevant for the municipality of Trondheim. Assumptions as given in Section 4.1 was used to calculate unit values. These values are given in Table 5. As already stated, we divided the network in the city into two zones based on density of shops, residents and industry. The zones and their sizes were based on a geographical analysis based on two steps:
Table 5.
Average unit costs for four rehabilitation approaches used in the calculation of city wide rehabilitation.
- Division of the city on a map based density of shops, residents and industry. The city was here divided into several smaller zones.
- An assessment of the size of each of the zones was done by implementing small squares in the map in order to quantify the area of each zone. The size of each zone was found by counting and accumulating the number of squares within the specific zone. Its relative size was then found by comparing this accumulated number to the total accumulated squares in the whole city.
We then calculated different unit costs related to rehabilitation in each zone since it is more costly to renew pipes in city centres and densely populated areas than elsewhere. An average unit cost for each rehabilitation approach was calculated by multiplying the relative size of each zone with its associated unit cost, and adding the numbers together for the two zones.
This unit costs would represent an average for the city. We calculated an average unit cost for four rehabilitation approaches. The rehabilitation approach of ‘no-dig’ was based on a 50% divide between non-structural and structural, as stated in Section 4.1.
4.3. Analysis Approach and Results
The following seven rehabilitation strategies were considered in the case study:
- 90% replacement + 10% no-dig: Replacement is the preferred approach. No-dig is only used when necessary, in difficult situations, and replacement is not applicable.
- 70% replacement + 30% no-dig: Replacement is the preferred approach, but no-dig is used more extensively as it reduces short-term costs and impacts.
- 50% replacement + 50% no-dig: A high degree of no-dig is applied due to its short-term benefits, also in places where pipes are easily replaced.
- 100% coordinated replacement of water and sewer pipes: replacement is the preferred approach, and since renewal is coordinated between water and wastewater pipes, no amount of no-dig is applied
- 100% coordinated replacement of water and sewer pipes with renewal of roads: replacement is the preferred approach, and coordination with roads is prioritized in order to reduce overall costs and impacts.
- 30% no-dig + 70% coordinated replacement of water and sewer pipes: Coordinated replacement is the preferred approach, but no-dig is used more extensively as it reduces short-term costs and impacts.
- 50% no-dig + 50% coordinated replacement of water and sewer pipes with renewal of roads: A high degree of no-dig is applied due to its short-term benefits and low costs, also in places where pipes are easily replaced. Total coordination is preferred during replacement in order to further cut costs.
The strategies are based on different rehabilitation approaches, or combinations of them. See Section 3 and Table 2 for closer description. The rehabilitation approach of ‘replacement’ used in the strategies is the ‘reference method’ in Table 2. As stated in the assumptions, the use of no-dig method in the case study was based on a 50% use of non-structural no-dig (ranked as number 5 in Table 2), and 50% use of structural no-dig (ranked as number 3 in Table 2). The SF value for this combined ‘no-dig’ method was calculated to be 1.795 ((2.39 + 1.2)/2 = 1.795, see Table 2) Variations of combinations of the rehabilitation approaches of ‘replacement’ and ‘no-dig’ were used in Strategies 1–3, while ‘no-dig’ was combined with coordination approaches in Strategies 6 and 7. Strategy 4 is based solely on rehabilitation approach number five. This method is ranked as number two in Table 2. Strategy number 5 is based solely on rehabilitation approach six, which is ranked as number four in Table 2.
When calculating the total investment cost for a given strategy over the 15 year analysis period, the following formula was used:
where:
TIC of a given strategy = Total Investment Cost based on strategy 1 to 7.
1.025 = annual inflation rate of 2.5%.
1.04 = annual discount rate of 4%.
Ri = the rehabilitation need calculated for year i (1) up until year n (15). These data are given in Table 6, column 2 (km/year).
Table 6.
Annual and total rehabilitation need and investment cost over the 15 year analysis period (2019–2033) for the relevant rehabilitation approaches in the case study.
% of X/Y = percent of the selected rehabilitation approach used in the strategy. This share is given in the list of rehabilitation strategies above.
CuX/CuY = cost to renew one meter of pipe with the given rehabilitation approach, as defined in Table 5, here named X and Y.
SFX/SFY = the SF factor value given for the selected rehabilitation approach, here named X and Y. Values are given in Table 2.
The calculation with Equation (7) is done from year 1 up until the final year in the analysis period, year n. For the case study the year n is year 15. The inclusion of the SF factor in Equation (7) ensures that the investment cost of the rehabilitation approach is governed by its expected service life provision and is, thus, related to economic impact through its life cycle. Total costs where SF is included show the cost for the planned rehabilitation plus the estimated inflicted costs on future generations due to the rehabilitation plan. This helps to avoid giving an advantage to methods with low initial cost, but with short service provision expectancy. Annual rehabilitation need was calculated in CARE-W LTP by using the stock pipe data of Trondheim and the survival functions defined in Table 4.
Using Equation (7) we then calculated the TIC of each of the seven strategies based on column 2 of Table 6 and the SF factors given in Table 2. These results are given in Table 7.
Table 7.
Total investment costs 2019–2033 for the seven strategies in the case study.
First in Table 7, the ‘Total cost’ for a strategy is given without the inclusion of the SF factor. This is done so we can view the difference between including it and not including it. In the ‘SF-corrected cost’ the rehabilitation approaches are corrected for the SF factor, as given by Equation (7). We can see that the difference between the ‘total cost’ and the ‘SF-corrected cost’ increases when the amount of no-dig is increased, and when coordination is preferred over no coordination.
Strategy 1, where replacement is the preferred approach, scores worst both with and without the inclusion of the SF factor and, thus, have the highest total investment cost over the analysis period, also when considering the impact this investment will have on the long-term cost sustainability. Using replacement without finding any means to reduce costs or impacts, for example through coordination works, is a strategy that should be avoided whenever possible due its high investment cost and high sustainability impact. The results of Strategy 4 and Strategy 5 show the benefits of combining the replacement of a water pipe with the replacement of a wastewater pipe, and when possible, replacing the pipes when roadwork is being done by the road authorities. The more rehabilitation work can be coordinated between infrastructure departments, the higher the economic benefit of a utility. This shows that although the service life of pipes is less optimized and less utilized when coordination work is initiated, as evidenced by the reduced survival functions in Pericault et al. [45], the reduced unit cost weighs up for this and more. A combination of coordination work and use of no-dig where necessary is generally recommended based on the results. Looking at total cost over the analysis period, Strategy 7 scores best with a 47.8% lower investment need over the 15 year period. However, taking the SF factor into consideration, the long-term weakness of the no-dig method comes into play and strategy 5 scores best. By implementing Strategy 5, the utility can save about 22.7% of the SF-corrected score during the 15 years, compared to Strategy 2, which is a normal approach in Norwegian cities. This relates to about 17.1 million € saved in the master plan period when also considering the impact a chosen strategy has on its life cycle cost. This is quite substantial, especially considering that the city is rather small in global terms. Finding the right kind of strategy in a life cycle perspective can, therefore, increase economic sustainability and reduce the negative impact of rehabilitation. At the same time it is possible to have a balance and a trade-off consideration between actual costs and future inflicted costs of a strategy, making utility engineers more capable of making good long-term decisions based on life cycle principles.
Looking only at current costs, Strategy 7 is best, but when considering the impact a strategy has over its expected life cycle, Strategy 5 scores best. In the beginning of Section 4 where we defined the case study, we specified two considerations we had for the best performing strategy. Consideration A specified the actual cost over the analysis period. Looking only at this consideration, we identify Strategy 7 as the best. However, it is desired to take economical sustainability into consideration by looking at life cycle impact, as specified in Consideration B. Hence, Strategy 5 is actually the best-performing strategy.
Increasing the percent of no-dig used in rehabilitation will reduce SF-corrected costs by about 5% (for 30% use of no-dig) or 10% (for 50% use of no-dig). This shows us that, generally speaking, one could reduce SF-corrected costs by about 5% per 20% increase in the use of no-dig. This could be a rule of thumb in the utility when looking exclusively at using replacement vs. no-dig, where no coordination is considered.
5. Discussion
The main findings of the paper is presented in Table 2, which presents the ranking of the rehabilitation approaches based on their SF value. We have called the area the survival functions cover as the time-area, since the curves represent the total expected lifetime of all pipes within a cohort. The higher this time-area is, the higher the accumulated expected lifetime of the pipes in the cohort. The time-area is calculated with the integral of the survival functions, in this case the Herz functions, and is represented by the factor we call LCF. The LCF is, therefore, a measure of the time-area of a rehabilitation approach, and comprises the cycle of the approach from its inception and implementation to its death by renewal. The time-area concept is illustrated in Figure 3a. The SF factor compares the LCF value of the approaches to the best performing approach, the so-called reference method. The SF states the value that a given rehabilitation approach will have to be multiplied with in order to achieve the same time-area as the reference method. This is illustrated in Figure 3b. In theory, it means that applying a non-structural no-dig method in rehabilitation, a single pipe would have to be rehabilitated 2.39 times on average before a pipe renewed with the reference method were in need of a renewal. A pipe which has already been renewed with no-dig will in most cases not be renewed with no-dig the next time, so the SF number is just used as a theoretical number to compare the life cycle performance of the rehabilitation approaches. We are of the opinion that the SF number ‘corrects’ the performance of a rehabilitation approach according to its expected lifetime, and paves the way for a fairer comparison of different strategies for renewal. The approach facilitates that methods that have a low investment cost, but also a short expected lifetime, will not be favoured for its low investment cost without also being punished for its short lifetime. Unexpectedly, the coordination of renewal of water and sewer pipes scores quite well in the SF measuring, being rated as the second best rehabilitation approach with an SF of 1.13. Structural no-dig and coordination of water, sewer, and roads also score well with SF numbers below 1.3. When looking at semi-structural and non-structural, the SF falls down to 2.53 and 2.39, showing that the life cycle of these approaches are significantly less than the others.
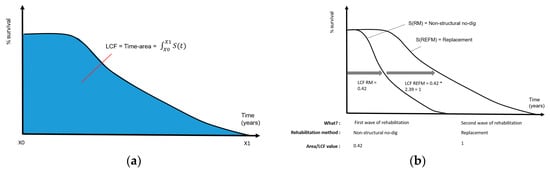
Figure 3.
(a) Illustration of the time-area idea which is the concept the LCF is built upon. (b) Illustration of the correlation between LCF and SF values for non-structural no-dig and the reference method (replacement).
To further make a case for the application of the suggested life cycle thinking in sustainability assessments, we focus on the implications of sustainability indicators when looking at a limited time horizon. Figure 1 illustrates how an existing cohort can be renewed by methods with different service lives as illustrated by the survival functions S(t). The figure gives an example on how a 40 year old existing cohort (S(Original cohort)) can be renewed by the best available replacement method (S(reference method) or another rehabilitation approach, e.g., renovation (S(rehabilitation method). Although the service life of the methods differ, the service provision of both extend into the time horizon defined as the ‘distant long-term projection’, which coincides with a time interval of 150 to 250 years (see also Table 8). Table 8, which is a closer description of the time horizons indicated in Figure 1, identifies what kind of central economic key performance indicators (KPI) which can be fully evaluated within the different time horizons (we only look at economic indicators to limit the discussion). The purpose is to show for how long the implementation of a certain rehabilitation approach will affect the KPI. By looking at a ‘normal long-term projection’ time horizon, as defined in Table 8, most of the impacts on the KPI will be ‘censored’, meaning that there will be impacts on the indicators well beyond that time period. What that basically means is that a chosen rehabilitation strategy will have some form of impact on cost, on social factors and on environmental factors also after 50 years. These impacts, in a normal projection period, will not be analysed and we will, therefore, not know the full extent of either the benefits or the negative impacts of a strategy. Since these long-term benefits and impacts will not be known, we say that they are ‘censored’. For example, in a normal long-term projection the total cost of a rehabilitation approach can be estimated within the time interval (30–50 years), but from Figure 1 we see that costs from rehabilitation for both the rehabilitation and reference methods will occur long past 50 years and into the ‘distant long-term projection’ period. In this case, there are costs and social and environmental impacts associated with the methods that occur after 50 years. By the normal standard of long-term analysis time horizons (30–50 years), the costs and impacts beyond the 50 year mark will not be analysed and, thus, not known. In reality it means that we do not know which strategy is the most sustainable, or even the most cost-effective, across the life cycle of the strategy. This shows the importance of performing sustainability analyses that include the distant long-term projection horizon, especially if it is desired to look at whole life cycle impacts, costs, benefits, and consequences for future generations. The major benefit of the approach is, therefore, that it takes into account the whole life cycle value of an investment, with the subsequent advantages that there is no ‘censoring’ of future benefits or disadvantages. By that, we mean that we can calculate long-term benefits and disadvantages over the life cycle of strategies and use them as basis for taking decisions, whereas in normal analyses, these parameters will be analysed only 30 to 50 years into the future. What happens beyond that 30 to 50 year period is, in this case, ‘censored’. A challenge of looking into the distant long-term projection is the increased uncertainty. The cohort sustainability factor (SF) solves these challenges by comparing strategies on the basis of current conditions and external state of things and, at the same time, being corrected for the expected service lifetime provision.
Table 8.
Description of time horizons in long-term planning and the necessary assessment horizon for some central economic KPI.
Marlow et al. [9] report that the existing deterioration of urban water systems common in many countries have been caused by a focus on short-term management and short-term benefits. The inclusion of the SF factor in the calculations forces a utility to incorporate life cycle thinking in investment planning, and reduces the focus on short-term benefits. A preferred method will have to perform well in combination with both the short-term costs (15 years investment) and the life cycle costs (the SF factor). In order to illustrate the effect of the main findings of the paper, as presented in Table 2, we initiated a case study with the intention of applying the SF factors in real life rehabilitation planning. The case study looked specifically at the investment cost of rehabilitation strategies over an analysis period, and correlated that cost to the life cycle performance of the strategy. The results of the case study, as depicted in Table 7, show the overall benefits of the no-dig method, which, aside from the low installation costs, has practical benefits, like easy to install properties, low short-term costs and impacts, and being better suited for use in busy and crowded areas. Strategies with no-dig performs well in spite of being corrected for the SF factor. However, if a much higher degree of non- or semi-structural no-dig methods were to be used, the no-dig method as a whole would yield a lower score due to the high SF factor of these methods. The inclusion of some form of coordination work in the replacement strategy contributes to a high degree of reduction in SF-corrected costs, especially when renewal is coordinated with road renewal. A whole 16.3% reduction in costs can be achieved with Strategy 5 compared to using replacement with 50% no-dig (Strategy 3), and when correcting the long-term performance with the SF factor this reduction increases to 17.5%. When comparing Strategy 5 to Strategy 1, which is the worst-performing strategy, the difference becomes even greater, at 27.3%.
In this paper, coordination practices were modelled by merging survival functions for different infrastructures through coordination theory. The literature study presented other approaches for modelling integrated rehabilitation between infrastructures. As concluded, most of these approaches are generated towards the tactical asset management level focusing on a bottom up approach and looking at short-term effects of coordinating infrastructure rehabilitation. This is in contrast to the method presented in this paper, which focuses on the strategic asset management level and the long-term effects that can be garnered over the life cycle of the rehabilitation approaches. The work by Tscheikner-Gratl [41] does, however, apply a top down approach by using a cohort survival model to model pipe deterioration on network level. The deterioration modelling results are used to identify annual rehabilitation needs. These results are, furthermore, specified on pipe levels with a priority model in order to identify rehabilitation projects. In the end it is, therefore, a model that assesses and selects the most suitable coordination projects in the short-term. It, therefore, does not view rehabilitation strategies in a life cycle perspective in order to assess the impact of coordination as a strategic decision for the network as a whole. On this basis, we do believe that the approach presented in this paper contribute to the current state of the art, by providing utility managers a tool to calculate the overall cost and sustainability for current and future generations, of implementing different strategic decisions on a network level.
In reality, it is not reasonable to assume that all urban water pipe replacements can be coordinated with roads. However, what this case study shows is that a high degree of such coordination is recommended. Even Strategy 4, which coordinates water and wastewater pipe replacement, scores better than Strategies 1–3 on all accounts when the numbers are SF-corrected. An implementation of such a strategy, with a high degree of coordination with roads, would seem to be a good option when considering sustainability impacts over the life cycle of the pipes, which includes that long-term aspect so often neglected in urban water management. There are, however, many instances where the use of no-dig is necessary and has significant benefits compared to replacement. Such instances are areas with a high density of industries and businesses, like city centres, or areas where pipes are under buildings or cross under roads or rivers. Additionally, in situations where either the water or the sewer pipe has been renewed independently of the other pipe, meaning their ages differ by more than a few years, it might be more reasonable to use no-dig on the pipe in need of renewal. In instances where intervention is necessary, but where the utility is restrained by a limited budget, the use of no-dig can be preferred due to its low short-term costs. The choice of rehabilitation approach must, therefore, be accommodated to the local situation. Based on the results of the case study, we have compiled a short list of recommendations for the planning of the rehabilitation strategy in the case study utility. This list is given in the conclusion as a final ‘take-home’ message.
Another issue of high importance comes into play: the so-called SUWM (sustainable urban water management) principle, which has been critically reviewed in Marlow et al. [2]. The paper addresses a range of concepts that have gained traction through the dawn of SUWM. A central concept is the idea of lock-in effects, which is the institutional and technological path dependency to certain technological solutions through widespread implementation [2]. The lock-in effect of past technologies have made the like for like renewal of pipes the normal approach, where solutions outside of replacing or renovating network pipes are disregarded due to scepticism to new and untested solutions, and due to fear of failure. The water managers are, in such instances, entrapped by historical and existing technologies [48], which often locks out innovative and perhaps more sustainable solutions [2]. The use of no-dig methods shortens the time of entrapment since they require less investment and have a shorter expected lifespan than replacement technologies. High investments increase the intensity of the entrapment as it locks the money into systems expected to operate long into the future. Although coordination practices of replacement score well in the SF-corrected cost calculations, these approaches do have an extended lock-in effect and can, thus, complicate and decelerate the transition into more sustainable solutions. The use of no-dig is, therefore, recommended in areas that are expected to be transformed into decentralized urban water systems within the next 50 years.
The normal approach in managing the urban water systems is, therefore, the use of legacy technologies, which can be understood as the further use of inherited and conservative systems and technologies, without much consideration of new, but sometimes radical, solutions. The challenge of implementing new approaches, like decentralized system solutions, is that they will seem too radical if implemented too fast without any extensive testing. That is also why Marlow et al. [2] have suggested a gradual implementation of SUWM principles together with the further use of legacy technologies into a gradual change referred to as system hybridization. In such a hybridization process there is a need for legacy systems renewal, and for new systems implementation. Even in new system implementations there will be need of the knowledge gained from legacy systems and their existing infrastructure, as the decentralized systems still need many of the same concepts as the legacy systems. In decentralized systems there is a need for scaled-down versions of legacy technologies, e.g., small treatment facilities and smaller pipe distribution systems. Re-use of existing infrastructure is also key in establishing sustainable decentralization systems. There is, therefore, a technology and knowledge transfer from the legacy systems in this process.
When a utility is planning strategic level measures, it is natural that they should start by assessing different solutions based on area specific needs. Every area of a city has their own challenges and their own needs and should be assessed individually with regards to their specific metrics. Based on the metrics, the challenges and the needs, a solution is suggested based on either (i) continuing maintaining legacy systems; (ii) partly implementing SUWM technologies through a hybridization process; or (iii) completely rebuilding the area system with SUWM principles and technologies. This process is illustrated with Figure 4, which illustrates the steps of the long-term decision-making process for implementing sustainable solutions. Discussions about the most sustainable solutions for a water utility should, therefore, be taken at level 1 in the figure, where discussions about long-term technological solutions, approaches, and principles are initiated. The most sustainable path should be decided locally based on geography, population, social state, economy, state of existing network, local challenges, etc. Discussions about the continued use of legacy systems or introduction of SUWM principles should be initiated and decided at this level.
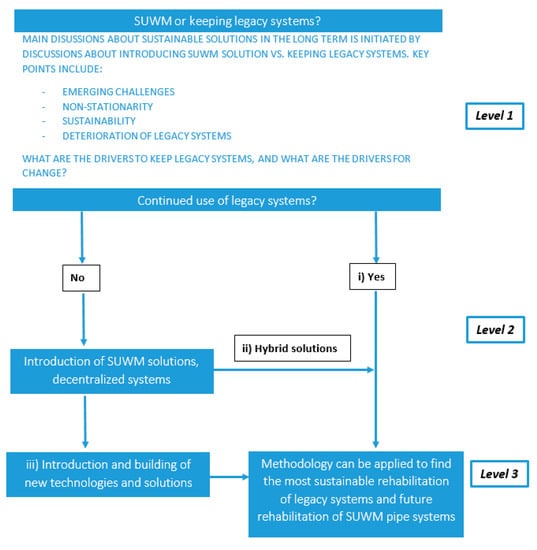
Figure 4.
Illustration of the long-term decision making process for implementing sustainable solutions.
At level 2 the discussion should revolve around the split between 100% implementation of SUWM principles, which involves extensive rebuilding of the system, the hybridization process, and the further use of legacy systems. In the case where solutions (i) or (ii) are chosen as the most suitable, the proposed process in this paper can be used to assess the most sustainable rehabilitation of the legacy systems. In case (i) the whole of the system will be preserved, and a plan for area-wide rehabilitation can be prepared. In case (ii) there is a need to decide the extent of the implementation of SUWM technologies before a rehabilitation plan for the remaining legacy systems can be proposed. In this rehabilitation plan the proposed method can be applied. In case (ii), and possibly even in case (iii), legacy systems should be re-used to ensure reduced costs and reduced environmental impacts. This means that some of the existing pipe systems in the ground, pumps etc. can be used to fulfil the purpose of a decentralized system. In the case where legacy systems are preserved and re-used for this purpose, the process described in this paper can also be used to determine the best available rehabilitation strategy.
At level 3, a rehabilitation plan can be proposed for the piped system. Observe that at this level, there is a re-emergence of rehabilitation need arising from the SUWM systems. This need is represented by pipes installed within SUWM systems that in the future will have to be rehabilitated. SUWM systems will in most cases be miniature versions of legacy systems combined with new technologies. Pipes will, therefore, in most cases, also be needed within the SUWM systems. The proposed methodology is, therefore, not focused on rehabilitation of legacy systems, but it is focused on rehabilitation of piped systems, be it pipes within legacy systems, within hybrid systems, or within future SUWM systems.
5.1. Further Work
The main weaknesses of the presented method in the case study is listed and discussed in Section 4.1. One aspect not mentioned in the case study is adaptation to a changing climate, population growth, new or changed regulations, new public demands, etc. These aspects are external factors which might impact the urban water systems. They are related to the uncertainty of the future and should be part of long-term planning when assessing future rehabilitation and investment needs. A changing climate can, for example, affect the expected service life of pipes, or can influence decisions regarding which solutions to implement, especially related to the question of whether to implement SUWM solutions, or to further maintain and operate legacy systems. Adaptation to a changing climate or any of the other mentioned factors can, therefore, be a driver for rehabilitation. Proponents of SUWM solutions often claim that these systems are more capable of handling the uncertainty related to climate change and population growth, and are, thus, thought to be more resilient and robust. Zischg et al. [49] presents a case study which shows that hybrid systems are more robust in terms of handling future uncertainty than traditional legacy systems. Building robust systems with regards to change caused by climate change, urbanization, or any other factor will facilitate future adaptation. Robust systems can be produced through consideration of uncertainties. Scenario planning has become relevant in reducing long-term uncertainty in urban water planning. In Bruaset et al. [50], relevant uncertainties are discussed and the multiple scenario planning approach is presented for an urban water system through a case study. The paper shows how uncertainty is not reduced, but embraced through the use of scenarios. Zischg et al. [49] criticizes the conventional use of a few scenarios due to them ‘being highly dependent on the quality of their assumption’, and produces a robustness analysis approach based on the info-gap decision theory, producing a multi-stage design scheme to further improve analysis under deep uncertainty. Manocha and Babovic [51] introduces the concepts of adaptation tipping points and adaptation pathways coupled with cost benefit analysis in order to increase the robustness of long-term adaptation planning. The process is based on seven steps, whereby interventions and scenarios are set up before adaptation tipping points are calculated and adaptation pathways are developed. The final stage is an evaluation and selection of the most robust pathway. Adaptation tipping points represent boundary conditions where specified intervention will no longer be able to perform as necessary and are, thus, a measure for rejection. Roach et al. [52] evaluate a robustness model approach (info gap) vs. a robustness algorithm approach (robust optimization) under deep uncertainty. The paper analyses a case study with the aim of optimizing the product of ‘maximization of robustness’ and ‘minimization of costs’. All of these approaches are examples of how robustness of the approach presented in this paper can be improved under future uncertainty. The methods can be used to assess the development of factors into the future, and review how they might impact the deterioration and robustness of urban water systems.
For the methodology underpinning the calculation of the SF factor, the main weakness is the calculation of the survival functions themselves. Before any calculation of LCF or SF, we first had to calculate the Herz functions, and then calculate the integral of these functions. The calculations of the Herz functions were based on the gathering of expert knowledge and the gathering of 10 years of experience of applying survival functions in Norway. Ranges of data for the different cohorts were then used in order to calculate an average survival function for each cohort based on specific data from the Norwegian water sector. The survival functions were, therefore, based mainly on expert knowledge, but also on some basic data analysis. This is in contrast to the process applied in Scholten et al. [53], where expert knowledge is combined with data analysis in a Bayesian process in order to calculate survival functions. This is a way of improving service life modelling under data scarcity. The method is a way of countering left truncation and right censoring of historical data, which involves a probable construction of data for survival functions outside of the historical observation window (period of time when decommissioning ages of pipes are recorded) of service lifetimes. Large et al. [54] explain the concepts of left truncation and right censoring, and propose a method to correct historical data for these concepts based on an extensive process to build an empirical Turnbull survival function. Bruaset et al. [42] propose a method to improve survival functions, as opposed to the other methods, which includes a way of adapting survival functions to historical and desired future service levels in the network. These three papers present different approaches to calibrate survival functions with historical data, and thereby reduce uncertainty in modelling survival functions. Neither of the presented processes were applied when calculating survival functions in this paper, as these survival functions were based on years of experience and expert knowledge, and some simple data analyses. Any follow-up work should include calibration of the survival functions, with any of the presented or similar methods, as a way of further improving the accuracy of the SF numbers.
5.2. Some Thoughts around Data Needs for Analysis
There are two aspects to look at when assessing data need and data quality: (A) data needed to build the SF factors, and (B) data needed to analyse different rehabilitation approaches. In the following we will first discuss part A, and follow up with a discussion on part B.
5.2.1. Data for Building SF Factors
The SF factors are based on the calculation of the integral of the Herz functions. The first step is, therefore, to build the Herz functions. There is actually no need for data in order to build the Herz functions as they can be based on assumptions about the expected service lives of pipes. These assumptions can be based on expert knowledge and on the experience of the local managers and engineers. Based on this knowledge, survival functions can be estimated for the rehabilitation methods presented in the beginning of Section 3. How to build up Herz functions and how to estimate the a, b, and c values of the function is described in detail in Bruaset et al. [42]. The calculation of SF factors can, therefore, be done without any available data. Even if no expert knowledge and little local experience exist on service life expectancy, estimation of survival function values used in other similar water utilities can be used.
In order to take the next step of SF calculation, a calibration of survival functions (as discussed in Section 5.1) can be used to improve accuracy of the Herz functions. In order to calibrate the Herz functions with the suggested method in Bruaset et al. [42], a water utility should have registered the age (installation year and decommissioning year gives us age) of decommissioned pipes at decommissioning for at least 10 years. In addition, the utility should have at least 3 to 5 years of data on failure rates and rehabilitation rates of water pipes (blockage rates can be used for wastewater pipes). The installation year of most of the pipes currently in operation is also necessary. If this data is available, the SF factors can be adapted to the locally-expected service lives of the rehabilitation methods. For most utilities, there might be little to no such data available for no-dig methods. We do, however, expect this data to be more available in the coming years and decades as no-dig methods now have been applied for quite some time.
In order to calculate coordination with roads it is necessary to know the survival curves for the renewal of roads. This means that it is also necessary to know about the service life expectancy of roads.
5.2.2. Data Needed to Analyse Different Rehabilitation Approaches
When you have calculated the SF factors with the data discussed in Section 5.2.1, it is possible to combine the rehabilitation methods in any desired way into more complex rehabilitation approaches. There is, therefore, no additional need of data for the SF factors. In order to run a CARE-W LTP to calculate future rehabilitation needs, there is need for the following data at the pipe level:
- -
- Construction year;
- -
- Material (and possibly diameter); and
- -
- Length.
Service life expectancy for existing cohorts of pipes in the network, as given in Table 4, is also necessary. They can be produced in the same way explained in Section 5.2.1. The next step is to calculate the investment needs based on the rehabilitation needs. To do so it is first necessary to know the unit costs of the evaluated rehabilitation methods, as given in Table 5. With this data it is then possible to calculate the TIC with Equation (7) (the results of which are shown in Table 7). The TIC is calculated with the annual rehabilitation needs, the unit cost of rehabilitation, and the SF factor for the given method. Values for inflation and discount rates should also be known.
It could be desired to look at the impact of a range of sustainability indicators besides costs. Such indicators could be CO2 emissions, energy use, resource use, implications for local society, time used for rehabilitation, etc. In order to calculate these indicators it would be necessary to know the unit value for each of them related to the rehabilitation of one meter of pipe with a given rehabilitation method. This would make it possible to calculate the value of these indicators within the analysis period with Equation (7), where the unit cost of rehabilitation (CuX) is replaced with the unit value for CO2 emission, energy use, resource use, etc. A long range of indicators could be calculated with this approach across the three sustainability dimensions, giving a water utility further basis to make decisions based on a comprehensive sustainability analysis.
6. Conclusions
In order to prepare the urban water systems for the vision of the cities of the future, and to prepare for external challenges like climate change and population growth, meticulous planning and management of the systems are needed on a broad scale. Identifying and implementing sustainable rehabilitation interventions, also in the long-term, is existential for the survival of a high service level urban water system. Different rehabilitation approaches have vastly different impacts on sustainability over their lifetime, which underscore the importance to consider the impact over their life cycles. In order to calculate the long-term sustainability impacts, a life cycle approach for rehabilitation approaches based on survival functions is presented. The approach makes it possible to compare methods with different service life expectancies by relating them to a reference value, given by the reference method. Thus, the long-term sustainability impacts and costs can be explored well beyond normal long-term projections. It is, therefore, the opinion of the authors that the SF factor will be of importance to understand the life cycle value and impact of rehabilitation approaches, projects, and strategies. Due to the varying degree of asset lives, also within homogeneous cohorts, it is difficult to analyse the life cycle of entire networks with a bottom up approach. A top-down approach (like survival functions) is an approach where the entirety of the varying degree of service lives of pipes are considered within the function and is, therefore, better suited to represent network and cohort level life cycle approaches.
The results chapter shows that the SF value for semi- and non-structural no-dig methods are high due to their shorter expected service life times. However, the case study shows that no-dig methods perform well in terms of costs despite being corrected for the SF factor. This can be contributed to their low installation costs, showing that there sometimes are benefits to using the shorter-lived approaches. The case study is meant to be viewed as an example on how the SF factor can be used for a single indicator, in this instance the indicator of ‘total investment cost’ over a master plan period. The SF factor can be used in the same way for any other sustainability indicator that a utility would like to assess, which includes environmental and social indicators. For example, by using the SF factor on an environmental indicator, such as CO2 emissions, the calculation will show the performance of rehabilitation strategies in relation to each other with regards to emissions, when their life cycles are taken into consideration. As a final conclusion to the main findings of the paper, some important implications of the work presented in this paper are:
- The SF factor corrects the life-expectancy performance of rehabilitation approaches so that they can be compared on equal grounds.
- The SF factor is a way of handling and including life cycle analyses on whole network level modelling.
- Inclusion of the SF factor in long-term planning eliminates long-term ‘censoring’ (meaning that we look at the whole life cycle, not just a part of it) of impacts and benefits of rehabilitation strategies and paves the way for a fairer comparison of rehabilitation approaches and strategies by moving performance assessment away from the normal short-term calculations.
- The SF factors presented in this paper will help strategic asset management engineers to implement the most sustainable solutions by giving them a tool to compare both short- and long-term impacts of interventions.
- The SF value corrects investment costs based on the lifetime expectancy of the rehabilitation approach. A low-cost solution may, therefore, not be the best investment in the long-term if its low lifetime expectancy is taken into consideration.
When the replacement of pipes is done in coordination with each other (water + sewer) and in coordination with roads, the SF-corrected costs is reduced significantly compared to the approaches in the case study where replacement is done with no coordination, despite the reduced expected lifetime of the water and sewer pipes when implementing coordination. This means that the reduced unit costs outweigh the reduced service life of the pipes. Furthermore, it means that coordination work has a positive effect on the economic sustainability of utilities that implement the traditional rehabilitation of legacy systems. Based on the results of the case study it is possible to make some general recommendations for the water utility in the case study in choosing the most economically sustainable rehabilitation strategy for their master plan period. The general recommendations to increase economic sustainability in the case study utility include:
- If conditions require or call for methods with low impact on surroundings, no-dig methods should be used. This can be the case in city centres or in areas where pipes are under buildings, roads, railroads, or rivers, or where digging is generally not desired.
- If the age difference between the water and the sewer pipe in the same trench vary by more than 10 years, no-dig should be used to rehabilitate the one pipe in need of renewal.
- Coordinating renewal of water and sewer pipes right before road renewal should be prioritized. This would deem it necessary to have some form of communication with the road authorities.
- Whenever the coordination in point 3 is not possible, no-dig methods should be applied.
- Whenever the solution in points 3 and 4 are not possible combinations, the coordinating renewal of water and sewer pipes should be prioritized, along with a high degree of no-dig projects.
- If coordinating rehabilitation is not possible, a high degree of no-dig should be implemented in the rehabilitation work. When looking at replacement vs. no-dig projects (Strategies 1–3), a 5% reduction in SF-corrected costs for each 20% increase in the share of used no-dig can be a general rule of thumb for calculating the benefit of no-dig.
Author Contributions
Conceptualization, S.B.; Methodology, S.B.; Software, S.B.; Validation, S.S. and S.B.; Formal Analysis, H.R. and S.B.; Investigation, H.R. and S.B.; Resources, S.B.; Data Curation, S.B. and H.R.; Writing-Original Draft Preparation, S.B.; Writing-Review & Editing, S.B.; Visualization, S.B.; Supervision, S.S.; Project Administration, S.S. and S.B.; Funding Acquisition, S.S. and S.B.
Funding
This research was funded by the Norwegian Research Council (grant number 243497), the Norwegian interest group for water ‘Norsk Vann’, and the 10 municipalities in Norway which constitute the ‘VASK’ cooperation.
Acknowledgments
The authors would like to thank the ’VASK’ municipalities in Norway and the Norwegian interest group for water ‘Norsk Vann’ for their help and contribution to this work. The Norwegian University of Science and Technology has financed the open access fee of the paper.
Conflicts of Interest
The authors declare no conflict of interest.
References
- Norwegian Department of Finances. Norges Strategi for Bærekraftig Utvikling—Statsbudsjettet 2008; Finansdepartment: Oslo, Norway, 2008. [Google Scholar]
- Marlow, D.; Moglia, M.; Cook, S.; Beale, D. Towards sustainable urban water management: A critical reassessment. Water Res. 2013, 47, 7150–7161. [Google Scholar] [CrossRef] [PubMed]
- International Organization for Standardization. Asset Management—Overview, Principles and Terminology; ISO 55000:2014; ISO: Geneva, Switzerland, 2014. [Google Scholar]
- Renaud, E.; Bremond, B.; Le Gat, Y. Water pipes: Why ‘lifetime’is not an adequate concept on which to base pipe renewal strategies. Water Pract. Technol. 2014, 9, 307–315. [Google Scholar] [CrossRef]
- International Organization for Standardization. Environmental Management—Life Cycle Assessment—Principles and Framework; ISO 14040:2006; ISO: Geneva, Switzerland, 2006. [Google Scholar]
- Alegre, H.; Vitorino, D.; Coelho, S. The use of Infrastructure Value Index to communicate and quantify the need for renovation of urban water systems. In Proceedings of the IWA Cities of the Future Conference—TRUST 2015, Mulheim, Germany, 28–30 April 2015. [Google Scholar]
- Herz, R.K. Ageing processes and rehabilitation needs of drinking water distribution networks. Aqua J. Water Supply Res. Technol. 1996, 45, 221–231. [Google Scholar]
- Sahely, H.R.; Kennedy, C.A.; Adams, B.J. Developing sustainability criteria for urban infrastructure systems. Can. J. Civ. Eng. 2005, 32, 72–85. [Google Scholar] [CrossRef]
- Marlow, D.; Beale, D.; Burn, S. A pathway to a more sustainable water sector: Sustainability-based asset management. Water Sci. Technol. 2010, 61, 1245–1255. [Google Scholar] [CrossRef] [PubMed]
- Marlow, D.; Beale, D.; Burn, S. Linking asset management with sustainability: Views from the Australian sector. J. Am. Water Works Assoc. 2010, 102, 56–67. [Google Scholar] [CrossRef]
- Marlow, D.; Humphries, R. Sustainability within the Australian water industry: An operational definition. Water Aust. Water Assoc. J. 2009, 36, 118–123. [Google Scholar]
- Ashley, R.; Blackwood, D.; Butler, D.; Jowitt, P.; Davies, J.; Smith, H.; Gilmour, D.; Oltean-Dumbrava, C. Making asset investment decisions for wastewater systems that include sustainability. J. Environ. Eng. 2008, 134, 200–209. [Google Scholar] [CrossRef]
- Allbee, S. America’s pathway to sustainable water and wastewater systems. Water Asset Manag. Int. 2005, 1, 9–14. [Google Scholar]
- Foley, A. Benchmarking asset management. Water Asset Manag. Int. 2005, 1, 22–25. [Google Scholar]
- Slagstad, H.; Brattebø, H. Life cycle assessment of the water and wastewater system in Trondheim, Norway–A case study: Case Study. Urban Water J. 2014, 11, 323–334. [Google Scholar] [CrossRef]
- Venkatesh, G.; Brattebø, H. Energy consumption, costs and environmental impacts for urban water cycle services: Case study of Oslo (Norway). Energy 2011, 36, 792–800. [Google Scholar] [CrossRef]
- Venkatesh, G.; Brattebø, H. Studying the demand-side vis-à-vis the supply-side of urban water systems–case study of Oslo, Norway. Environ. Technol. 2014, 35, 2322–2333. [Google Scholar] [CrossRef] [PubMed]
- Renzoni, R.; Germain, A. Life Cycle Assessment of Water: From the pumping station to the wastewater treatment plant (9 pp). Int. J. Life Cycle Assess. 2007, 12, 118–126. [Google Scholar] [CrossRef]
- Amores, M.J.; Meneses, M.; Pasqualino, J.; Antón, A.; Castells, F. Environmental assessment of urban water cycle on Mediterranean conditions by LCA approach. J. Clean. Prod. 2013, 43, 84–92. [Google Scholar] [CrossRef]
- Lemos, D.; Dias, A.C.; Gabarrell, X.; Arroja, L. Environmental assessment of an urban water system. J. Clean. Prod. 2013, 54, 157–165. [Google Scholar] [CrossRef]
- Mahgoub, M.E.-S.M.; van der Steen, N.P.; Abu-Zeid, K.; Vairavamoorthy, K. Towards sustainability in urban water: A life cycle analysis of the urban water system of Alexandria City, Egypt. J. Clean. Prod. 2010, 18, 1100–1106. [Google Scholar] [CrossRef]
- Loubet, P.; Roux, P.; Guérin-Schneider, L.; Bellon-Maurel, V. Life cycle assessment of forecasting scenarios for urban water management: A first implementation of the WaLA model on Paris suburban area. Water Res. 2016, 90, 128–140. [Google Scholar] [CrossRef] [PubMed]
- Loubet, P.; Roux, P.; Bellon-Maurel, V. WaLA, a versatile model for the life cycle assessment of urban water systems: Formalism and framework for a modular approach. Water Res. 2016, 88, 69–82. [Google Scholar] [CrossRef] [PubMed]
- Lane, J.; de Haas, D.; Lant, P. The diverse environmental burden of city-scale urban water systems. Water Res. 2015, 81, 398–415. [Google Scholar] [CrossRef] [PubMed]
- Jeppsson, U.; Hellström, D. Systems analysis for environmental assessment of urban water and wastewater systems. Water Sci. Technol. 2002, 46, 121–129. [Google Scholar] [CrossRef] [PubMed]
- Lundie, S.; Peters, G.M.; Beavis, P.C. Life cycle assessment for sustainable metropolitan water systems planning. Environ. Sci. Technol. 2004, 38, 3465–3473. [Google Scholar] [CrossRef] [PubMed]
- Lundin, M.; Morrison, G.M. A life cycle assessment based procedure for development of environmental sustainability indicators for urban water systems. Urban Water 2002, 4, 145–152. [Google Scholar] [CrossRef]
- Beheshti, M.; Sægrov, S. Sustainability assessment in strategic management of wastewater transport system: A case study in Trondheim, Norway. Urban Water J. 2017, 15, 1–8. [Google Scholar] [CrossRef]
- Vahidi, E.; Jin, E.; Das, M.; Singh, M.; Zhao, F. Environmental life cycle analysis of pipe materials for sewer systems. Sustain. Cities Soc. 2016, 27, 167–174. [Google Scholar] [CrossRef]
- Vahidi, E.; Jin, E.; Das, M.; Singh, M.; Zhao, F. Comparative life cycle analysis of materials in wastewater piping systems. Procedia Eng. 2015, 118, 1177–1188. [Google Scholar] [CrossRef]
- Sterling, R.; Alam, S.; Allouche, E.; Condit, W.; Matthews, J.; Downey, D. Studying the Life-cycle Performance of Gravity Sewer Rehabilitation Liners in North America. Procedia Eng. 2016, 165, 251–258. [Google Scholar] [CrossRef]
- Venkatesh, G.; Hammervold, J.; Brattebø, H. Combined MFA-LCA for analysis of wastewater pipeline networks. J. Ind. Ecol. 2009, 13, 532–550. [Google Scholar] [CrossRef]
- Herz, R.; Lipkow, A. Life cycle assessment of water mains and sewers. Water Sci. Technol. Water Supply 2002, 2, 51–72. [Google Scholar] [CrossRef]
- Tscheikner-Gratl, F.; Sitzenfrei, R.; Stibernitz, C.; Rauch, W.; Kleidorfer, M. Integrated rehabilitation management by prioritization of rehabilitation areas for small and medium sized municipalities. In Proceedings of the World Environmental and Water Resources Congress, Austin, TX, USA, 17–21 May 2015; pp. 2045–2057. [Google Scholar]
- Herz, R. Developing rehab strategies for drinking water networks. In Proceedings of the 9th International Conference on Durability of Building Materials and Components, Brisbane, Australia, 17–20 March 2002. [Google Scholar]
- Stokes, J.; Horvath, A. Life-Cycle Assessment of Urban Water Provision: Tool and Case Study in California. J. Infrastruct. Syst. 2011, 17, 15–24. [Google Scholar] [CrossRef]
- Rinaldi, S.M. Modeling and simulating critical infrastructures and their interdependencies. In Proceedings of the 37th annual Hawaii International Conference on System Sciences, Big Island, HI, USA, 5–8 January 2004; p. 8. [Google Scholar]
- Tscheikner-Gratl, F.; Sitzenfrei, R.; Rauch, W.; Kleidorfer, M. Integrated rehabilitation planning of urban infrastructure systems using a street section priority model. Urban Water J. 2016, 13, 28–40. [Google Scholar] [CrossRef]
- Osman, H. Coordination of urban infrastructure reconstruction projects. Struct. Infrastruct. Eng. 2016, 12, 108–121. [Google Scholar] [CrossRef]
- Carey, B.D.; Lueke, J.S. Optimized holistic municipal right-of-way capital improvement planning. Can. J. Civ. Eng. 2013, 40, 1244–1251. [Google Scholar] [CrossRef]
- Tscheikner-Gratl, F.; Hammerer, M.; Rauch, W.; Mikovits, C.; Kleidorfer, M. Integrated Rehabilitation management for different infrastructure sectors. Gwf Wasser Abwasser 2013, 154, 50–56. [Google Scholar]
- Bruaset, S.; Sægrov, S.; Ugarelli, R. Performance-based modelling of long-term deterioration to support rehabilitation and investment decisions in drinking water distribution systems. Urban Water J. 2018, 15, 46–52. [Google Scholar] [CrossRef]
- Rygg, H. Bærekraftige Strategier for Rehabilitering av Vann- og Avløpsnett. Master’s Thersis, Norwegian University of Science and Technology, Trondheim, Norway, 2017. [Google Scholar]
- Sægrov, S. (Ed.) CARE-W—Computer Aided Rehabilitation of Water Networks; IWA Publishing: London, UK, 2005. [Google Scholar]
- Pericault, Y.; Bruaset, S.; Ugarelli, R.; Saegrov, S.; Viklander, M.; Hedström, A. Coordinated long term planning of sewer and water mains rehabilitation. In Proceedings of the LESAM Conference 2017, Trondheim, Norway, 20–22 June 2017. [Google Scholar]
- Svenson, K. A Microdata Analysis Approach to Transport Infrastructure Maintenance. Ph.D. Thesis, Dalarna University, Falun, Sweden, 2017. [Google Scholar]
- Herz, R.K. Software for strategic network rehabilitation and investment planning. In Proceedings of the International CARE-W Conference on Computer Aided Rehabilitation of Water Networks, Dresden, Germany, 1 November 2002; pp. 65–84. [Google Scholar]
- Brown, R.; Ashley, R.; Farrelly, M. Political and professional agency entrapment: An agenda for urban water research. Water Resour. Manag. 2011, 25, 4037–4050. [Google Scholar] [CrossRef]
- Zischg, J.; Goncalves, M.L.; Bacchin, T.K.; Leonhardt, G.; Viklander, M.; van Timmeren, A.; Rauch, W.; Sitzenfrei, R. Info-Gap robustness pathway method for transitioning of urban drainage systems under deep uncertainties. Water Sci. Technol. 2017, 76, 1272–1281. [Google Scholar] [CrossRef] [PubMed]
- Bruaset, S.; Sægrov, S. Using the multiple scenario approach for envisioning plausible futures in long-term planning and management of the urban water pipe systems. Eur. J. Futures Res. 2018, 6, 7. [Google Scholar] [CrossRef]
- Manocha, N.; Babovic, V. Development and valuation of adaptation pathways for storm water management infrastructure. Environ. Sci. Policy 2017, 77, 86–97. [Google Scholar] [CrossRef]
- Roach, T.; Kapelan, Z.; Ledbetter, R.; Ledbetter, M. Comparison of robust optimization and info-gap methods for water resource management under deep uncertainty. J. Water Resour. Plan. Manag. 2016, 142, 04016028. [Google Scholar] [CrossRef]
- Scholten, L.; Scheidegger, A.; Reichert, P.; Maurer, M. Combining expert knowledge and local data for improved service life modeling of water supply networks. Environ. Model. Softw. 2013, 42, 1–16. [Google Scholar] [CrossRef]
- Large, A.; Le Gat, Y.; Elachachi, S.; Renaud, E.; Breysse, D.; Tomasian, M. Improved modelling of ‘long-term’future performance of drinking water pipes. J. Water Supply Res. Technol. Aqua 2015, 64, 404–414. [Google Scholar] [CrossRef]
© 2018 by the authors. Licensee MDPI, Basel, Switzerland. This article is an open access article distributed under the terms and conditions of the Creative Commons Attribution (CC BY) license (http://creativecommons.org/licenses/by/4.0/).