Roadmap to Rebound: How to Address Rebound Effects from Resource Efficiency Policy


1
UCL Institute for Sustainable Resources, University College London (UCL), London WC1H 0NN, UK
2
European Commission, Joint Research Centre, Directorate D: Sustainable Resources, Bioeconomy Unit, 21028 Ispra, Italy
*
Author to whom correspondence should be addressed.
Sustainability 2018, 10(6), 2009; https://doi.org/10.3390/su10062009
Submission received: 18 April 2018
/
Revised: 29 May 2018
/
Accepted: 12 June 2018
/
Published: 14 June 2018
(This article belongs to the Special Issue Enhancing Environmental and Sustainability Policy: Assessing the Past and charting a Course for the Future)
Abstract
:Increasing demand for resources has been met with a new wave of resource efficiency policies worldwide. Such policies are, however, vulnerable to rebound effects when increased resource efficiency leads to additional resource use via behavioural and systemic responses. Yet, the implications of policy-induced rebounds are mostly unknown since most studies have focused on costless and exogenous efficiency improvements that are not linked to any specific policy intervention. After reviewing the literature, we provide guidance for the analysis of policy-induced rebounds. With regards to scope and method design, we highlight the untapped potential of life cycle assessment (to capture trade-offs between life cycle stages and environmental pressures) and macro-economic modelling (to reveal economic consequences beyond supply chain effects). We also find striking asymmetries in research efforts, leaving knowledge gaps for key resource efficiency strategies targeting, among others, materials, water, land, biodiversity, and waste. Lastly, rebound effects generally focus on a single resource, usually energy, and much is ignored about their implications in the context of resource interlinkages. A better understanding of such cross-resource rebounds is key to design and to assess the effectiveness of emerging policy paradigms such as the resource nexus and the sustainable development goals.
1. Introduction
The increasing global demand for resources, such as energy, water, and materials, has been met with a new wave of resource efficiency policies worldwide [1]. In Europe, a reference document on resource efficiency policy is ‘The Roadmap to a Resource Efficient Europe’ (RREE) from the European Commission (EC) [2], as well the European Union (EU) action plan for the Circular Economy (CE) [3]. Both the RREE and CE identify potential measures for various resources and sectors. For example, the RREE specifically refers to increased energy and material efficiency in buildings and transport. The same roadmap, however, also highlights possible rebound effects that can lead to significant misestimates of the environmental effectiveness of policies [4]. For example, increased car travel in response to improved fuel efficiency [5] or increased water use following water efficiency measures in households and agriculture [6,7].
The rebound effect concept is based on the reinforcing relationship between resource efficiency and resource use [8,9,10], where efficiency changes are met with behavioural and systemic responses, such as consumer and market responses to price changes, which result in additional demand and resource use. Rebound effects are typically described as the % of resource savings that are offset once considering such additional resource use [11]. While the existence of rebound effects is widely accepted, there is disagreement about their magnitude. Estimates range from a moderate offsetting of environmental gains, to a complete elimination of such gains, depending on the boundaries, methods, scope, etc. adopted [11]. Here, we adopt a broad definition based on the environmental rebound effect (ERE) concept, which understands efficiency changes beyond input-output relationships and includes attention to multiple environmental pressures through a life cycle perspective [12]. The ERE can be defined as the additional demand and associated environmental burdens from behavioural and systemic responses to changes in environmental efficiency. Using the ERE, it is thus possible to study beyond ‘pure’ energy efficiency (e.g., more fuel-efficient engine) to broader resource efficiency measures (e.g., electric vehicles). Rebound effects are not only a matter of concern for academics, but also for governmental bodies and international organisations [13], and they have been even explicitly considered in policy design [14,15,16].
Despite the extensive and diverse literature dealing with the theoretical, methodological, and empirical aspects of the rebound effect [5,11,12,17,18], the study of rebound effects due to policy interventions is mostly unexplored. Barker and colleagues [19] state that rebound studies focusing on the effects of specific policies are scarce, and that such polices usually appear as components in wider cross-sectional studies. Gillingham and colleagues [20] further argue that the large majority of the literature has focused on what the authors call ‘Zero-Cost Breakthroughs’ (ZCB), while ‘Policy-Induced Improvements’ (PII) have received far less attention. ZCB are costless efficiency improvements that are not linked to any specific policy, such as an overall % increase in energy productivity that requires no capital investment, policy incentives, etc., whereas PII reflect the overall effect of a given policy. Moreover, the main body of literature has focused on the effects of efficiency improvements on direct energy use [11], disregarding other key resources, such as water, materials, and land, as well as the implications of adopting a life-cycle perspective [21]. In this vein, the EC has highlighted the importance of considering multiple environmental burdens across life cycle stages in order to holistically assess the impacts of policies, including trade-offs between resources and potential rebound effects [22]. Still, little is known about adverse rebound effects from resource efficiency policy in the broader sense.
This paper addresses two key questions: (1) what method guidance can be drawn from the literature to quantify policy-induced rebound effects; and (2) which specific resource efficiency policies are the most vulnerable to rebound effects? Addressing these questions will help to outline a complementary ‘roadmap’ regarding how to adequately quantify rebound effects and which specific policy areas and interventions deserve most attention. Ultimately, this information can help policymakers to achieve environmental targets more effectively through an adequate policy design and policy mix. This article is structured as follows: Section 2 presents a systematic review of studies that have addressed policy-induced rebound effects, focusing on valuable characteristics in terms of focus and scope. Section 3 reviews key resource efficiency policies in Europe in the context of potential rebound effects. Section 4 offers a discussion on how to address policy-induced rebound, and Section 5 concludes.
2. Rebound Effects from Policy: Lessons from Past Research
This section contains a critical review of the state-of-the-art research on policy-induced rebound effects. We carried out the review via online catalogues (Google Scholar and Web of Science) using the search criterion ‘(“rebound effect” OR “backfire” OR “rebound”) AND (“policy” OR “policies”)’. Moreover, we performed cross-citation analysis from the documents identified through the previous approach. We identified 11 studies, which quantified rebound effects from policy interventions. We present these studies in various subsections according to relevant characteristics: scope, product attributes, rebound mechanisms, and indicators. We further characterise each study in terms of the main drivers of the rebound effects analysed, with the aim of supporting a later discussion on potential vulnerabilities of resource efficiency policies. While we present reported rebound estimates in this and the following section to add context, comparison between estimates merits caution due to differences in method design, including focus, scope, and modelling frameworks: econometric, pseudo-experimental, input-output, etc. [11]. It is also worth clarifying that here, we do not focus on aspects related to the broader topic of policy impact assessment, such as time gaps, long-term effects, and cross-regional effects [23], which are nonetheless important and might also affect rebound estimations. For the review, we have excluded studies that did not address specific policies but rather overall economy-wide rebound effects, as well as those where efficiency changes were set exogenously, i.e., not linked to a specific policy or policy intervention. A summary of the review can be found in Table S1 in the supporting information.
2.1. Explicit and Consistent Scope: from Exogenous to Endogenous Technical Changes
Few studies have explicitly addressed policy-induced rebound effects [20]. Rather, the majority of rebound studies have focused on “exogenous” technical changes that occur regardless of policy intervention, and which are typically modelled as an arbitrary overall percentage improvement in energy efficiency. In contrast, some studies have explored “endogenous” technical changes that occur in response to policy, for instance the number of units sold of a new technology due to a policy intervention. When studying policy-induced rebound effects, the scope of analysis is generally consistent with that of the given policy, namely at the national or international level, and a set of associated endogenous technical changes are explicitly considered. A key benefit of such scope relates to the possibility to assess the effectiveness of a given policy when considering rebound effects, including whether specific policy targets are met.
Focusing on consumer goods and services, Wood and colleagues [24] analysed the efficacy of consumer-oriented policies in Europe via carbon footprints, with two case studies on specific diet and clothing interventions, such as shifts towards vegetarian diets and reduction of clothing demand. While such interventions did not take place, the authors built counterfactual scenarios based on expert opinions and in line with current EU policy. Such interventions were further linked to microeconomic (direct + indirect, see Table 1) rebound effects from monetary savings, with a magnitude in terms of carbon savings offset by rebound that ranged from 25% (shift to vegetarian diets) to 75% (reduction of clothing demand). In the latter case, the authors concluded that such large rebound was associated with the relatively low carbon intensity of the clothing sector with respect to the other expenditures that were increased. Freire Gonzalez [25] assessed past policy interventions by analysing the energy performance of energy efficiency policies aimed at households in Catalonia. The author calculated an economy-wide direct energy rebound effect of 35–49% from the introduction of more efficient appliances, mostly owing to notable economic savings.
With a focus on the transport sector, D’Haultfoeuille and colleagues [26] studied rebound effects from a feebate scheme introduced by the French government to promote the purchase of less polluting cars. The authors calculated an economy-wide rebound effect of ~35% in terms of CO2 emissions as a consequence of the introduction of this feebate, which arose from additional travel demand from the increased fuel efficiency. Moreover, the authors argued that the rebates were too generous, leading to notable additional expenditures by consumers and a high rebound effect. Other effects related to the increased fleet size and manufacturing scale, which were not labelled as rebound by the authors but could be considered as such, also thwarted the effectiveness of this policy. The calculated magnitude of these effects was ~120 and ~16%, respectively, and so the combined offsetting of the policy amounted to ~170%. This means that the policy would not have reduced CO2 emissions, in fact, net emissions would have risen by 70%, a case commonly known as ‘backfire effect’ [27]. With a similar focus, Hennessy and Tol [28] studied the rebound effect in terms of CO2 emissions from tax reform on new car purchases in Ireland. The results showed a direct rebound effect ranging from 37 to 61%, which stemmed from lower driving costs due to a notable shift from petrol to diesel engines.
2.2. Changes in Product Attributes: from Fixed Output to Comparable Functionality
More efficient products are often accompanied by additional features that influence their use, such as increased capacity and additional functions. According to Gillingham and colleagues [20], these features are critical to analysis of policy-induced rebound effects, as they constitute the context in which resource efficiency takes place. Additional features of resource-efficient products were assessed by Davis [29], who analysed the effects in water and energy consumption of a government-sponsored field trial in which high-efficiency domestic washing-machines were given free of charge to users. The new appliances were larger and gentler, and so more laundry could be washed in a single wash. Overall, the authors estimated that households increased volumes of laundry on average by ~6% after receiving a high-efficiency washer, including the direct effect from unitary cost reductions as well as from the possibility of washing larger loads. In a later study, Davis and colleagues [30] assessed a large-scale appliance replacement program in Mexico in which 1.5 million households received direct subsidies to replace their old refrigerators and air-conditioners with new energy-efficient models. The results were rather disappointing and were considered an ‘expensive way to reduce energy use’ (p. 26). New refrigerators caused a rebound effect of 72%, which nullified most of the predicted energy savings, whereas energy use in new air conditioners actually increased (backfire effect). The authors argued that the reasons behind such high rebound effects were the notable direct effect from economic savings as well new energy-intensive features of the new appliances. For instance, newer fridges included ice-makers, and newer air-conditioners featured lower cycle speeds for operating at night.
Aside from additional features, some authors have also suggested to include capital costs in order to account for changes in product expenditures and capital investments [31]. For example, while assessing the impact of Japanese energy saving policies, Mizobuchi [32] argued that improvements in energy efficiency should include capital costs. These capital costs would include capital investments by industries as well as energy saving products consumed by households, both in response to the restrictions of energy saving policies. Focusing on households, the authors calculated an economy-wide rebound effect in terms of CO2 emissions of 27% and 115% with and without capital costs, respectively. In other words, considering capital costs incurred by households was key in determining the magnitude of the rebound effect and its implications. Specifically, new more efficient products, such as air conditioners, water heaters, and cars, were generally more expensive than the old models, thus limiting effective income and associated emissions.
Other authors further argue that not only capital costs but the total cost of ownership, or life cycle cost (LCC), should be considered [33,34]. This would also include, for instance, end-of-life (EoL) costs such as waste treatment costs. The consideration of the LCC in rebound calculations has been included in the ERE [12], a framework in which the life cycle environmental burdens and costs can be consistently considered via life cycle assessment (LCA) and life cycle costing, respectively. Also in concordance with LCA, the ERE focuses on the ratio between environmental externalities (resources, emissions and waste) and a given functional unit or core function (e.g., travel) that is primarily demanded, rather than between physical inputs (e.g., energy use) and a fixed output (e.g., km driven), and this focus is consistent with including additional attributes. Lastly, a little researched aspect relates to ‘moral licensing’ effects associated with the perception of a product’s attributes [18,35], such as electric cars leading to additional travel and consumption due to the fact that users compensate ‘green’ with resource-intensive behaviour.
2.3. Rebound Mechanisms: from Direct to Macro-Economic Effects
Environmental policy generally brings about broad changes which can generate multiple types of rebound effects at multiple scales and at both consumption and production sides [17]. To illustrate the various mechanisms at play, Table 1 describes various potential effects in response to the introduction of a subsidy on electric vehicles by a given government with the aim of reducing the total cost of ownership (TCO) compared to conventional vehicles. The same mechanisms are applicable to other policies that ultimately introduce changes in consumption (e.g., time and socio-psychological costs) and/or production factors (e.g., capital and labour costs), for instance through energy productivity improvements and time-saving transport infrastructure. In light of such diversity of mechanisms and their potential consequences, rebound assessments that do not consider their full range may significantly misestimate the full size of the rebound effect. For instance, some studies show that the indirect effect can outperform the direct effect [34,36,37,38], while others show the importance of macro-economic effects in the overall magnitude [39,40].
The previously reviewed studies did not address macro-economic effects associated with market price, composition, and growth effects [17], which may have played a role considering the scale of the assessed policies. Macroeconomic price effects from bioenergy policies in the EU were analysed by Dandres and colleagues [41]. The authors found that, following a hypothetical introduction of biofuels, the reduction of domestic coal and lignite demand triggered a drop in prices and consequent increase in exports. This increase in exports caused a considerable rebound effect in terms of human health (45%), ecosystems (−69%), global warming (34%), and natural resources (20%). Dynamic macro-economic effects related to price changes, overall growth, investment, etc. were captured in two studies by Barker and colleagues [19,42]. The first study focused on rebound effects from energy efficiency policies and programmes in the UK, such as building regulations, appliance standards, and levies. After identifying specific technical changes in the household, business and public, and the transport sectors, the authors calculated an economy-wide macroeconomic energy rebound effect between 11% and 25%. According to the authors, key underlying reasons were the notable reductions in industrial costs and prices in energy-intensive industrial sectors as well as extra energy output being consumed by energy-intensive industries. The second study focused on voluntary climate change agreements from energy-intensive industrial sectors in the UK. Technical change was modelled through projected energy savings, including investments in energy-efficiency measures. The calculated economy-wide energy rebound effect ranged from 16 to 26% according to various scenarios. While these studies do not report fully disaggregated results by rebound mechanism (direct, indirect, and macro-economic), the results show that the combination of both indirect and macro-economic effects significantly outperformed direct effects. The authors identified the reduction in energy costs for producers as a key factor behind the overall rebound effect.
2.4. Indicators: from Direct Energy Use to Multiple Life Cycle Environmental Indicators
Rebound effects are typically expressed as an intensity variable, generally as the percentage of resource savings that are ‘taken back’ [11,43]. Moreover, they are represented in a single metric, commonly in terms of direct energy use or direct energy-related emissions. Consequently, not only is the absolute magnitude often ignored, but also the embodied impacts in the supply chains including the EoL as well as potential trade-offs between life cycle stages and environmental pressures. These aspects are key in the context of policy-induced rebound effects. The absolute magnitude allows contextualisation of the relevance of rebound effects, for instance, via cross-comparison or internal normalisation (e.g., between policies) or absolute normalisation (e.g., against a reference system such as global impacts, or against a desired state, e.g., comparing against planetary boundaries). Considering the embodied impacts of more efficient products is also key as it can shift the ‘break-even rebound threshold’ or the additional demand needed to offset environmental gains [44].
According to Font Vivanco et al. [34], the inclusion of embodied impacts can increase the rebound following two main mechanisms. Assuming that , the first mechanism is the decrease in the potential resource savings of the improved technology, for instance through additional resource use associated with its production (e.g., additional insulation for a house with increased energy performance). The second mechanism is the decrease in the actual savings, for instance, when accounting for the indirect resource associated with additional expenditure increases. Lastly, understanding trade-offs is key to assessing the overall effect of a given policy, including environmental pressures not initially targeted [45]. All these aspects are the bread-and-butter of life cycle assessment (LCA), which is a fundamental component of the ERE. LCA can thus play a key role when calculating policy-induced rebound effects, including possible trade-offs and indicating where to act to minimize the burdens. LCA has many benefits for the study of rebound effects, for instance the consideration of the whole life cycle of products, the high technology detail, and the use of multiple environmental indicators (see Section 4.1.1), yet it suffers from limitations such as cut-off issues [46].
Regarding life cycle impacts, and consistent with the inclusion of capital costs, Mizobuchi [32] considered the life cycle or embodied CO2 emissions generated by the production, distribution, and consumption of various products related to energy saving policies. By accounting for these embodied emissions, the author could not only better assess the actual emission savings from the energy-efficient products, but also the emissions associated with additional expenditures. On the topic of environmental trade-offs, Font Vivanco and colleagues [47] also applied LCA to calculate EU-level rebound effects from various eco-innovation policies, such as those promoting diesel cars, transport sharing schemes, and high speed rail (HSR). For HSR, the authors used life cycle estimates of global warming, land use change, and abiotic depletion as indicators and found rebound magnitudes of 215, 91, and 227%, respectively. The wide range of magnitudes derives from differences in environmental performance as well as in the environmental intensity of general consumption, namely, consumption of all goods and services other than the studied product. For example, if the general consumption has a higher carbon content than that of HSR, the indirect effect, even with moderate economic savings, could easily offset any carbon reductions. This mechanism can have different implications for different impacts. The importance of such trade-offs in rebound analysis has been explored in a number of other studies [48,49,50,51], including the implications of using mid- and end-point indicators [52]. Regarding the latter, mid-point indicators (e.g., global warming potential) tell less about the actual impacts on humans and ecosystems yet are easier to trace back to their source (e.g., CO2 emissions from an exhaust), whereas end-point indicators (e.g., climate change impacts on biodiversity or human health) provide the opposite trade-off [53].
3. Resource Efficiency Policies and Rebound Effects
This section focuses on potential rebound effects from resource efficiency policies. In the previous section, we reviewed those studies that quantified policy-induced rebounds in order to provide guidance on aspects relating to scope and methods. This section rather departs from broad policy areas in relation to resource efficiency, and reviews the literature to examine whether policy interventions in such areas may be linked to rebound effects. The aim is to identify which policy areas merit attention, for instance, by being under-researched and/or by having the most potential to mitigate rebound effects. In other words, Section 2 focuses on how to quantify policy-induced rebounds, whereas this section focuses on to which policy areas attention should be drawn. It bears noting that we not only consider studies on policy-induced rebound (those identified in Section 2), but also broader quantitative and qualitative estimates for the purpose of discussion. The various mechanisms through which rebound effects can manifest in response to policy interventions are broadly described in Table 1. In the context of this study, we define a policy intervention as the implementation of a decision, such as a directive or a standard, which will ultimately lead to any sort of technical change, such as a new technology mix, a new technology, etc. We largely focus on a shortlist of policy areas and associated interventions as described in the RREE (see Annex in the RREE for a summary). Specifically, the RREE describes thirty-six policy areas according to four sectors (energy, food, buildings, and mobility) and nine resources (fossil fuels, materials and mineral, water, air, land, soils, biodiversity, marine resources, and waste). This section is structured according to three sectors: energy services and mobility, buildings, and food.
3.1. Energy Services and Mobility
Improving resource efficiency in delivering energy services is a key priority in EU policies. Some examples are energy efficiency standards in buildings and vehicles, consumer rights to obtain smart meters, and economic incentives for the uptake of second-generation biofuels. Rebound effects from increased energy efficiency in energy services are well-studied, particularly in the area of space heating and personal mobility, and, to a less degree, in freight transport, space cooling, and water heating [5,11]. Following energy efficiency improvements, such as more energy-efficient appliances and fuel-efficient vehicles, consumer-side direct and indirect effects stemming mostly from increases in effective income have been reported [11]. The average magnitude of these effects is thought to be in the range of 10–30% for energy and related emissions [17], although some studies report higher magnitudes, including backfire, when considering the life cycle of products and multiple indicators [21]. An important reason behind high rebound magnitudes is the consideration of capital costs, such as vehicle and appliance purchases, which have been reported to lead to notable indirect rebound effects [32,34].
Less studied mechanisms include macro-economic effects through market price [54], composition [55], growth effects [56] (see Table 1), or a combination of these, for example, due to energy efficiency improvements in households [19] and biofuels incentives [41] leading to price decreases. The overall magnitude of macro-economic effects is thought to be modest (10–25%), but it can vary depending on the targeted sectors (e.g., due to product and sectorial price elasticities), development levels (as energy services in developing economies are less saturated), etc. Other understudied mechanisms are psychological rebound effects through “moral-licensing” effects, for instance in hybrid car users, although current evidence is inconclusive [18,57].
3.2. Buildings
Rebound effects from energy efficiency improvements in buildings have been extensively studied, for instance due to the introduction of thermal insulation [58] or efficient boilers and lighting [37]. The identified effects range from direct to re-spending and macro-economic effects [11,42], and the average magnitude could range from 10 to 30% [5,17]. For renewable energies, some authors point to potential price effects (when these are cheaper) as well as psychological effects or “moral licensing” effects [59,60].
Re-spending and psychological rebound effects are also thought to take place in response to improvements in water and land use efficiency [61,62]. For example, notable reductions in consumers’ water bills have been reported following greywater reuse interventions [63] and the promotion of high-efficiency cloth washers [29]. Regarding land-use efficiency, according to Næss [62], more strict spatial planning regulations to reduce urban sprawl can lead to (1) increased leisure travel from economic and time savings and (2) increased vacation home ownership and use as a compensation for living in a urban environment. Material rebound effects have also been theorised in response to interventions promoting the use of recycled materials in construction. In particular, Bahn-Walkoviak et al. [64] suggest that the use of economically-favourable recycled construction materials could allow building larger buildings. Similar claims have been made for the case of using recycled materials as proposed by various eco-design instruments [65].
3.3. Food
Resource efficiency interventions in the food sector focus largely on water and land use. Water efficiency interventions are promoted in various policy initiatives, for instance through water savings in irrigation [2]. Berbel et al. [6] carried out a literature review on rebound effects of water saving measures. According to this review, various rebound mechanisms have been identified, such as irrigated acreage use expansion in response to irrigation efficiency subsidies [66], a shift to more intensive and higher value crops [67], and increased number of irrigation events [68].
Land use efficiency interventions in the food sector are sometimes linked to optimal animal protein intake. Wood and colleagues [24] found important income rebound effects following shifts to vegetarian diets in Europe. Similar results were found by Tukker and colleagues [69], who identified both income and economy-wide rebound. The latter related to “structural changes in the primary agricultural sectors, as well as changes in import and export volumes” (p. 1781), and the results showed that these outweighed income effects. Specifically, economy-wide effects related mostly to higher exports of red meat to compensate for lower domestic consumption. Another study on environmental impacts of switching to vegetarianism in Sweden, however, calculated notable income rebound effects of 96% for energy and 49% for greenhouse gas (GHG) emissions [70]. These figures lead to the thought that rebound effects for land use could also be significant due to the correlation found between land use and GHG rebounds [47].
Increasing efforts are being dedicated to preventing food waste generation along production and consumption activities, such as increasing awareness and promoting food donation. While the social benefits of such actions are undisputed, warnings have been made regarding direct and indirect rebound effects from economic savings [71,72]. Specifically, rebound effects from food waste minimisation in households have been estimated in the range of 50–60% [73,74].
4. Discussion: How to Address Rebound Effects from Resource Efficiency Policy?
In Section 2 and Section 3, we focused, respectively, on two key questions related to rebound effects from resource efficiency policy: (1) what is important to consider in terms of scope and method design when assessing the real impact of policy; and (2) which are priority policy areas in terms of potential rebound effects? In this section, we distil the key answers to these questions to discuss the most pressing issues to address rebound effects from resource efficiency policy.
4.1. Scope and Method Design
In terms of scope and method design, we note that, while all the aspects we deemed important have been approached in the literature, no single study considers them all (see Table S1 in the supporting information). This can lead to gross misestimates of the magnitude of rebound effects and, therefore, the overall impact of any given policy intervention. Among all aspects, the most underutilised are the inclusion of multiple life-cycle based environmental indicators and macro-economic effects (see Table S1 in the supporting information). Following, we address in more detail how to further integrate these aspects in policy-induced rebound assessments.
4.1.1. The Role of LCA in Policy Impact Assessment
Despite its potential role in the impact assessment of policies [45,75], LCA has been manifestly underutilised when assessing policy-induced rebound effects. Notwithstanding policies having usually a specific focus, understanding the broader implications of their implementation and the possible trade-offs associated with them is essential. At the EU-level, the Better Regulation communication [76] has been explicitly introduced in the so-called Better Regulation Toolbox, which describes LCA as an approach for improving the impact assessment of policies. Indeed, when the goal of the impact assessment is to assess the consequences of a policy, then impacts caused by various policy choices may be investigated through LCA against a baseline (or potentially multiple alternative baselines, such as various usage options for biomass other than bioenergy). Such an assessment should ideally assess impacts along the entire supply chains, at a global geographic scale, on all market sectors of the economy, and avoid burden shifting among life cycle stages in the supply chain and among impact categories.
Regarding the possibility of better assessing rebound effects with LCA, there is an evolving discussion related to the use of consequential LCA instead of attributional LCA. The former would focus on the marginal consequences of the analysed decision, whereas the later would focus on attributing environmental burdens to that decision [77]. Some authors further argue that rebound effects have no place in attributional LCA, as additional demand would be attributed to the additional functions generated [78]. In contrast, other authors argue that real-life LCA studies show that such distinction is not clear-cut [79], and that it is possible to use attributional features to assess the consequences (rebound effects) of decisions [80]. In fact, some authors argue that direct rebound effects (e.g., caused by price differences of the products or services compared) should always be taken into account in consequential LCA [81].
The decision of relying on attributional or consequential LCA may stem from the decision context, and it should be clearly reported in the goal and scope of any study. Decisions related to policies usually fall under the “situation B” identified by the International Reference Life Cycle Data System (ILCD) Handbook [82]. Situation B refers to decisions taken at meso- and macro-scales, where it could be more appropriate to build a consequential life cycle inventory model, which describes the supply chain as it is theoretically expected in consequence of the analysed decision, embedded in a dynamic technosphere that reacts to a change in the demand for different products. Situation B is thus best suited to approach market effects leading to macro-economic rebound (see Table 1).
Systematically assessing rebound effects by adopting holistic approaches such as LCA would be the ideal case for any future policy. Previous research shows how omitting life cycle stages, environmental indicators, and technology detail, can systematically misestimate the rebound’s magnitude. For example, the same economic rebound effect can vary notably across environmental indicators [34] and even across human-environment interaction levels [52]. Incomplete background systems and life cycle stages similarly lead to high uncertainty in rebound estimates [32,83]. LCA models and data can be used in various ways in the study of rebound effects [21]. For example, studies using direct resource use and/or emission coefficients can readily incorporate life-cycle environmental burdens by using pre-calculated LCA-based coefficients. Also, studies based on input-output analysis (IOA) and equilibrium models can benefit from additional technology detail by means of hybrid models where LCA data is used to (1) separately account for additional life cycle stages (e.g., use and EoL), (2) disaggregate generic sectors, or (3) expand the supply-chain system [46]. Additionally, the availability of multiple environmental extensions in life cycle inventories and characterisation factors in life cycle impact assessment models can also be applied to refine environmental extensions in IOA and equilibrium models [84,85].
Despite obvious strengths of LCA, it is also clear that challenges and research needs remain [75], especially when the assessment is not retrospective but it is meant to be applied to test policy options under future scenarios [86]. Some key challenges include data availability, the integration of macro-economic models into LCA (e.g., macro-economic modelling, see Dandres et al. [41]), and the comprehensiveness of the assessment and robustness thereof when addressing the introduction of new technologies (e.g., in prospective LCA, see [87,88]).
4.1.2. Macro-Economic Effects
Both LCA and IOA have been popular approaches to assess the environmental consequences of supply-chain effects from policy. Resource efficiency policies, however, bring about wider changes, which make the use of these methods alone insufficient. These changes can be aggregated into three broad types—market price, composition, and growth effects (see Table 1). Previous research indicates that such effects play an important role in the economy-wide rebound effect [42,89], and so ignoring these may lead to notable misestimating of the rebound’s magnitude. These effects can be assessed with the help of macro-economic tools such as the popular computable general equilibrium (CGE) models [90], which, despite their rather simplistic assumptions on optimal and rational economic behaviour [91], are well equipped to address, at least generically, both micro and macro-economic rebounds [42]. Some studies further suggest that integrating LCA and CGE modelling is a valuable undertaking, either to include dynamic effects (e.g., related to price changes) into a conventional LCA [92,93] or to include technology-specific environmental coefficients calculated via LCA into a CGE model [41,94]. LCA-CGE models have great potential to study rebound effects from policy, for example by combining a technology-rich assessment of new technologies with their associated dynamic effects related to changes in prices, productivity, etc. Despite such potential, the explicit modelling of rebound effects is an outstanding issue. Future LCA-CGE models for the study of rebound effects will have to reflect on previous approaches, namely those from Dandres et al. [41] and Barker et al. [19,42]. The study from Dandres et al. offers a good methodological basis for combining LCA with CGE, while those from Barker et al. provide an illustrative example to identify specific technical changes from policy and to endogenize these into a CGE model.
4.2. Knowledge Gaps and Research Priorities
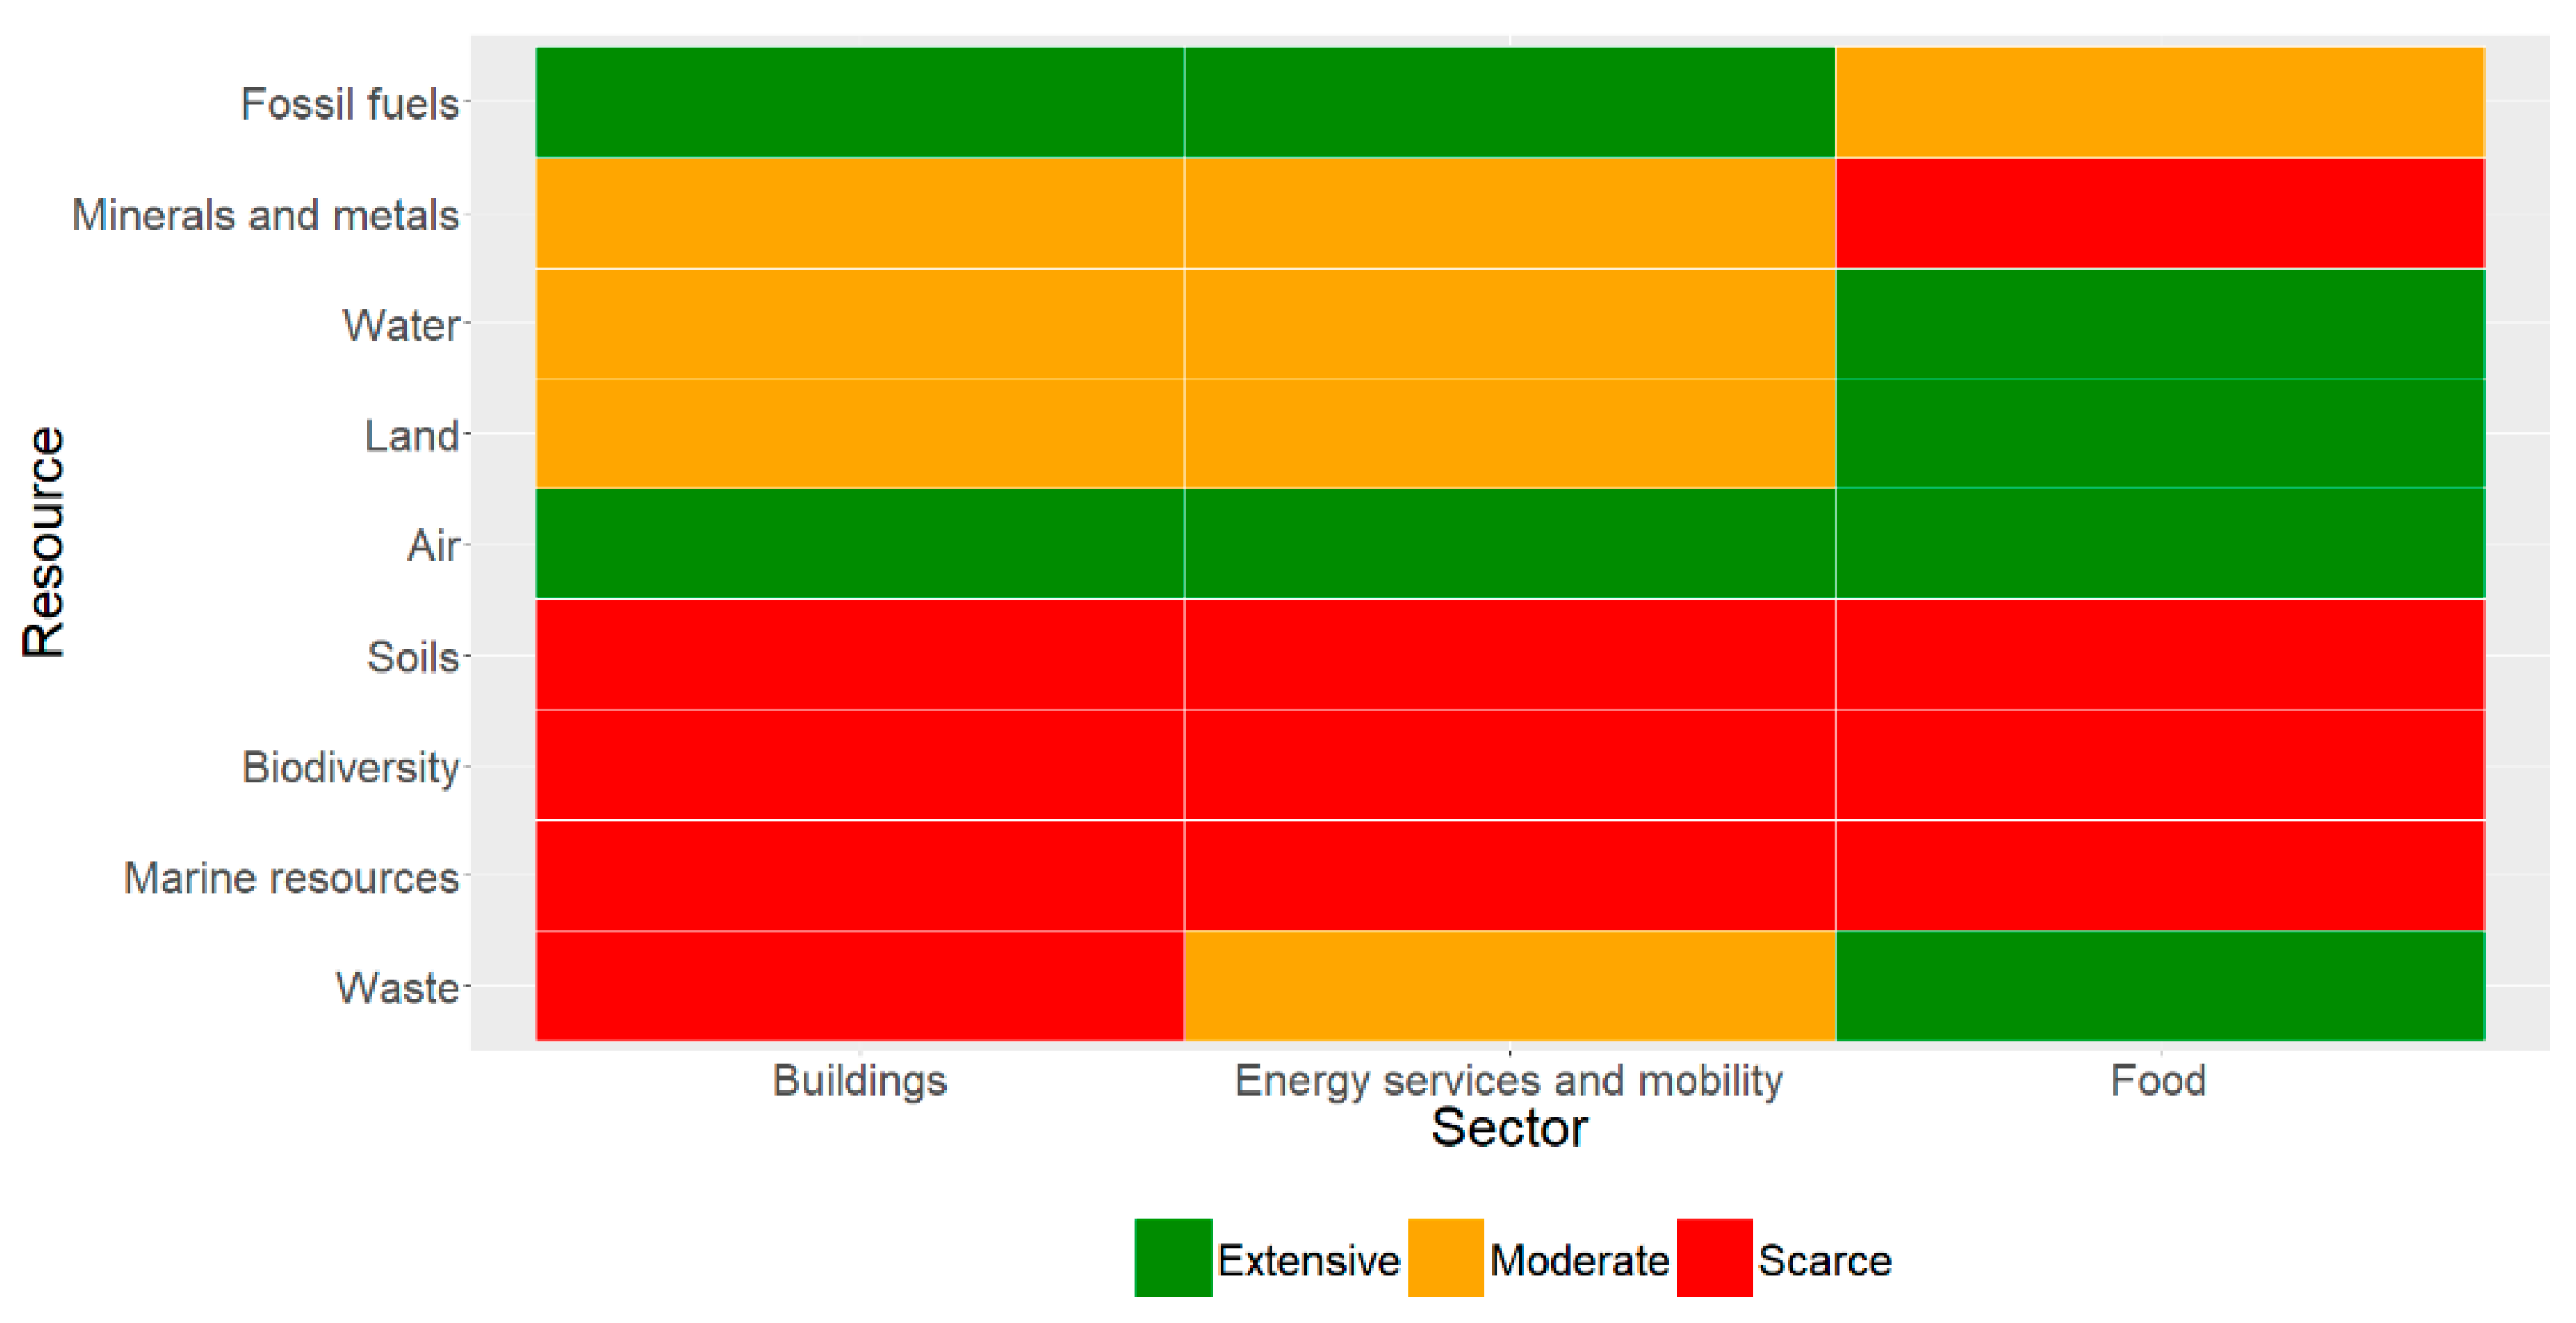
In Section 3, we reviewed the state of knowledge of rebound effects from resource efficiency policies. This review helps us better understand which broad policy areas have been addressed in rebound studies, and which ones remain unexplored. The latter ones should be considered, along with other criteria, when designing future rebound studies. A summary of this review is shown in Figure 1, where we depict the degree of evidence currently available: extensive (rebound effects have been quantitatively assessed in various studies), moderate (rebound effects have been qualitatively addressed and/or quantitative estimates can be extrapolated), and scarce (some or no qualitative considerations). Research efforts have focused mostly on energy use and related emissions in energy services, mobility, and buildings, while some research has explicitly addressed water, land, and waste efficiency in the food sector. In any case, it merits noting that few studies have assessed rebound effects from actual policy interventions (see Section 2), but rather broader policy targets. In doing so, inferred conclusions can overlook the context in which policies are implemented, such as penetration rates, changes in prices, and public spending. The rest of the policy areas are largely unexplored, which means that detrimental rebound effects could go unnoticed. Following, we outline under-researched policy areas that merit greater attention based on the findings of studies that, while not explicitly addressing rebound effects, offer additional insights.
While material rebounds have received little attention, some examples suggest that these can be important. Material efficiency interventions are gaining momentum in EU policy, largely spurred by concepts of the circular economy. Some key strategies include environmentally-friendly material extraction, lightweighting, industrial symbiosis, and secondary material markets [2]. For example, some authors associate wider dematerialisation strategies (e.g., shift towards the digital economy) with strong rebound effects via overall economic growth [95]. The implementation of industrial symbiosis has also been linked to rebound effects in cases where new technologies are more efficient and/or fail to replace existing technologies [96]. Moreover, some authors estimate that material efficiency in building construction, including material re-use during demolition and minimising losses during construction, could decrease raw material extraction by 50%, in turn improving cost and productivity [97] and so producing production-side rebound effects [98]. Lastly, circular economy strategies, particularly those based on reuse and recycling, have been associated with rebound effects from both re-spending and failing to substitute primary production on a 1:1 basis [99,100].
Rebounds from water and land use efficiency interventions have been widely analysed for the food sector yet remain unexplored for other sectors. In this sense, it might be worthwhile to explore rebound effects from interventions to minimise the impacts of transport infrastructure on land use and land fragmentation, such as elevated and underground roads, and habitat corridors. It is also thought that fuel efficiency improvements in transport can cause land use (in addition to energy) rebound when a cheaper commute leads to increased city and household size [101]. Similarly, material rebound can be associated with land use rebound when cheaper construction materials lead to larger construction projects [64]. These and other synergies between rebound effects, sometimes called indirect cross rebound effects [51] or treated within the water-energy-land-food nexus framework [102,103,104], have rarely been explored, especially in the context of specific policy interventions.
Lastly, while soils, biodiversity, marine resources, and waste are key elements of resource efficiency policies in the RREE, very little is known about their links with rebound effects. For biodiversity, rebound effects have been described as a consequence of biodiversity policies [105], and similar principles can be explored for resource-efficiency policies. For waste, while only food waste has been approached so far, similar re-spending and psychological mechanisms can be explored for other economic sectors. For example, the promotion of biodegradable and recycled materials, such as bioplastics in packaging, could make consumers more careless about purchasing such products [106].
5. Conclusions
Rebound effects can lead to a significant misestimation of the environmental effectiveness of resource efficiency policies. To provide guidance for assessing the implications of policy-induced rebound effects, this paper carries out a literature review to address two key aspects: (1) how to design the scope and methods of any future study and (2) which policy areas are most vulnerable to rebound effects. Our review reveals that few studies have focused on policy interventions, but rather on ‘zero-cost’ measures that ignore the context in which efficiency improvements take place, such as public spending, capital costs, and new product attributes. We further identify key aspects relating to scope and method design and highlight the need of further research to focus on the role of life cycle assessment and macro-economic modelling. We also find striking asymmetries in research efforts: price and income-related rebounds have been extensively studied, whereas other mechanisms, such as time and ‘mental’ rebounds, remain largely unexplored. Rebound effects have also been extensively studied for energy and related emissions, but less so for other key resources such as materials, water, land, and waste. In addition, rebound effects are generally treated in isolation, and much is ignored about the interlinkages between resource-specific rebounds (e.g., energy and material rebound).
Our findings can guide future research on policy-induced rebound, which we believe needs to take place at the intersection between two critical dimensions: (1) alignment with emergent paradigms and associated policies, such as the nexus framework, the circular economy, and the sustainable development goals (SDGs); and (2) the expansion of the existing knowledge base. A relevant research avenue is the role of rebound effects in enhancing combined resource use through system linkages, which can be captured through emerging nexus frameworks [107], such as the water-energy-food nexus (WEFN) [108] and, more generally, the global resource nexus [109,110]. Modelling the interplay and interdependencies of the elements of the nexus is an open challenge; however, LCA could represent a pivotal method to be further expanded in this respect [111]. Indeed, LCA aims at systematically addressing resource uses, linking them to potential impacts and allowing for modelling competing uses (e.g., via system expansion), applying constraints to use, and comparing environmental profiles of different scenarios. Policy interventions based on the circular economy need also to be properly assessed in light of several warnings regarding potential rebound effects [99,112]. Lastly, it is worthwhile to explore the role of rebound effects in reaching SDGs, given that rebound can stimulate interlinkages between individual goals, such as economic growth and climate change mitigation.
We believe that our work demonstrates that further research on policy-induced rebound effects is much needed, provides guidance on scope and method design for future studies, and points to emergent policy areas where the rebound community must focus their efforts.
Supplementary Materials
The following are available online at https://www.mdpi.com/2071-1050/10/6/2009/s1, Table S1: Classification of the reviewed studies according to desired characteristics in terms of scope, rebound mechanisms, product properties, and indicators, for assessing rebound effects from policy.
Author Contributions
Concept: D.F.V.; Literature review: D.F.V.; Original draft: D.F.V. and S.S.; Review and editing: D.F.V., S.S. and W.M.; Supervision: W.M.
Funding
This research is part of the “Effective environmental policies in Europe in the context of rebound effects” (EFFECT) project (effectprojectblog.wordpress.com), a Marie Skłodowska-Curie Individual Fellowship project (H2020-MSCA-IF-2015, grant agreement No. 702869).
Acknowledgments
The authors would like to thank three anonymous reviewers for their comments.
Conflicts of Interest
The authors declare no conflicts of interest.
References
- OECD. Policy Guidance on Resource Efficiency; OECD: Paris, France, 2016. [Google Scholar]
- European Commision. Roadmap to a Resource Efficient Europe; European Commission: Brussels, Belgium, 2011. [Google Scholar]
- European Commission. Closing the Loop—An EU Action Plan for the Circular Economy; European Commission: Brussels, Belgium, 2015. [Google Scholar]
- European Commision. Analysis Associated with the Roadmap to a Resource Efficient Europe Part II; European Commission: Brussels, Belgium, 2011. [Google Scholar]
- Greening, A.; Greene, D.L.; Difiglio, C. Energy efficiency and consumption—The rebound effect—A survey. Energy Policy 2000, 28, 389–401. [Google Scholar] [CrossRef]
- Berbel, J.; Gutiérrez-Martín, C.; Rodríguez-Díaz, J.A.; Camacho, E.; Montesinos, P. Literature Review on Rebound Effect of Water Saving Measures and Analysis of a Spanish Case Study. Water Resour. Manag. 2015, 29, 663–678. [Google Scholar] [CrossRef]
- Campbell, H.E.; Johnson, R.M.; Larson, E.H. Prices, Devices, People, or Rules: The Relative Effectiveness of Policy Instruments in Water Conservation1. Rev. Policy Res. 2004, 21, 637–662. [Google Scholar] [CrossRef]
- Jevons, W.S. The Coal Question. An Inquiry Concerning the Progress of the Nation and the Probable Exhaustion of Our Coal-Mines; Macmillan: London, UK, 1865. [Google Scholar]
- Khazzoom, J.D. Economic implications of mandated efficiency in standards for household appliances. Energy J. 1980, 1, 21–40. [Google Scholar]
- Brookes, L. The greenhouse effect: The fallacies in the energy efficiency solution. Energy Policy 1990, 18, 199–201. [Google Scholar] [CrossRef]
- Sorrell, S.; Centre, U.K.E.R. The Rebound Effect: An Assessment of the Evidence for Economy-Wide Energy Savings from Improved Energy Efficiency; Project Report; UKERC: London, UK, 2007. [Google Scholar]
- Font Vivanco, D.; McDowall, W.; Freire-González, J.; Kemp, R.; van der Voet, E. The foundations of the environmental rebound effect and its contribution towards a general framework. Ecol. Econ. 2016, 125, 60–69. [Google Scholar] [CrossRef] [Green Version]
- Font Vivanco, D.; Kemp, R.; van der Voet, E. How to deal with the rebound effect? A policy-oriented approach. Energy Policy 2016, 94. [Google Scholar] [CrossRef]
- Maxwell, D.; Owen, P.; McAndrew, L.; Muehmel, K.; Neubauer, A. Addressing the Rebound Effect, a Report for the European Commission DG Environment; European Commission: Brussels, Belgium, 2011. [Google Scholar]
- DCENR. National Energy Efficiency Action Plan 2014; Department of communications, Energy and Natural Resources: Dublin, Ireland, 2014.
- IRGC. The Rebound Effect: Implications of Consumer Behaviour for Robust Energy Policies; International Risk Governance Council: Lausane, Switzerland, 2013. [Google Scholar]
- Jenkins, J.; Nordhaus, T.; Shellenberger, M. Energy Emergence: Rebound and Backfire as Emergent Phenomena; The Breakthrough Institute: Oakland, CA, USA, 2011. [Google Scholar]
- Walnum, H.; Aall, C.; Løkke, S. Can Rebound Effects Explain Why Sustainable Mobility Has Not Been Achieved? Sustainability 2014, 6, 9510–9537. [Google Scholar] [CrossRef] [Green Version]
- Barker, T.; Ekins, P.; Foxon, T. Macroeconomic effects of efficiency policies for energy-intensive industries: The case of the UK Climate Change Agreements, 2000–2010. Energy Econ. 2007, 29, 760–778. [Google Scholar] [CrossRef]
- Gillingham, K.; Rapson, D.; Wagner, G. The Rebound Effect and Energy Efficiency Policy. Rev. Environ. Econ. Policy 2016, 10, 68–88. [Google Scholar] [CrossRef]
- Font Vivanco, D.; van der Voet, E. The rebound effect through industrial ecology’s eyes: A review of LCA-based studies. Int. J. Life Cycle Assess. 2014, 19. [Google Scholar] [CrossRef]
- EC. Better Regulation “Toolbox”; EC: Brussels, Belgium, 2015. [Google Scholar]
- Bartels, C.P.A.; Nicol, W.R.; van Duijn, J.J. Estimating the impact of regional policy: A review of applied research methods. Reg. Sci. Urban Econ. 1982, 12, 3–41. [Google Scholar] [CrossRef]
- Wood, R.; Moran, D.; Stadler, K.; Ivanova, D.; Steen-Olsen, K.; Tisserant, A.; Hertwich, E.G. Prioritizing Consumption-Based Carbon Policy Based on the Evaluation of Mitigation Potential Using Input-Output Methods. J. Ind. Ecol. 2017. [Google Scholar] [CrossRef]
- Freire-González, J. Methods to empirically estimate direct and indirect rebound effect of energy-saving technological changes in households. Ecol. Model. 2011, 223, 32–40. [Google Scholar] [CrossRef]
- D’Haultfœuille, X.; Givord, P.; Boutin, X. The Environmental Effect of Green Taxation: The Case of the French Bonus/Malus. Econ. J. 2014, 124, F444–F480. [Google Scholar] [CrossRef] [Green Version]
- Saunders, H.D. A view from the macro side: Rebound, backfire, and Khazzoom-Brookes. Energy Policy 2000, 28, 439–449. [Google Scholar] [CrossRef]
- Hennessy, H.; Tol, R.S.J. The impact of tax reform on new car purchases in Ireland. Energy Policy 2011, 39, 7059–7067. [Google Scholar] [CrossRef] [Green Version]
- Davis, L.W. Durable goods and residential demand for energy and water: Evidence from a field trial. RAND J. Econ. 2008, 39, 530–546. [Google Scholar] [CrossRef]
- Davis, L.W.; Fuchs, A.; Gertler, P. Cash for Coolers: Evaluating a Large-Scale Appliance Replacement Program in Mexico. Am. Econ. J. Econ. Policy 2014, 6, 207–238. [Google Scholar] [CrossRef]
- Henly, J.; Ruderman, H.; Levine, M.D. Energy Saving Resulting from the Adoption of More Efficient Appliances: A Follow-up. Energy J. 1988, 9, 163–170. [Google Scholar]
- Mizobuchi, K. An empirical study on the rebound effect considering capital costs. Energy Econ. 2008, 30, 2486–2516. [Google Scholar] [CrossRef]
- Bourrelle, J.S. Zero energy buildings and the rebound effect: A solution to the paradox of energy efficiency? Energy Build. 2014, 84, 633–640. [Google Scholar] [CrossRef]
- Font Vivanco, D.; Freire-González, J.; Kemp, R.; Van Der Voet, E. The remarkable environmental rebound effect of electric cars: A microeconomic approach. Environ. Sci. Technol. 2014, 48, 12063–12072. [Google Scholar] [CrossRef] [PubMed]
- Santarius, T.; Soland, M. How Technological Efficiency Improvements Change Consumer Preferences: Towards a Psychological Theory of Rebound Effects. Ecol. Econ. 2018, 146, 414–424. [Google Scholar] [CrossRef]
- Chitnis, M.; Sorrell, S.; Druckman, A.; Firth, S.K.; Jackson, T. Who rebounds most? Estimating direct and indirect rebound effects for different UK socioeconomic groups. Ecol. Econ. 2014, 106, 12–32. [Google Scholar] [CrossRef] [Green Version]
- Chitnis, M.; Sorrell, S.; Druckman, A.; Firth, S.K.; Jackson, T. Turning lights into flights: Estimating direct and indirect rebound effects for UK households. Energy Policy 2013, 55, 234–250. [Google Scholar] [CrossRef] [Green Version]
- Zhang, Y.-J.; Liu, Z.; Qin, C.-X.; Tan, T.-D. The direct and indirect CO2 rebound effect for private cars in China. Energy Policy 2017, 100, 149–161. [Google Scholar] [CrossRef]
- Allan, G.; Hanley, N.; McGregor, P.; Swales, K.; Turner, K. The impact of increased efficiency in the industrial use of energy: A computable general equilibrium analysis for the United Kingdom. Energy Econ. 2007, 29, 779–798. [Google Scholar] [CrossRef] [Green Version]
- Turner, K. Negative rebound and disinvestment effects in response to an improvement in energy efficiency in the UK economy. Energy Econ. 2009, 31, 648–666. [Google Scholar] [CrossRef] [Green Version]
- Dandres, T.; Gaudreault, C.; Tirado-Seco, P.; Samson, R. Macroanalysis of the economic and environmental impacts of a 2005–2025 European Union bioenergy policy using the GTAP model and life cycle assessment. Renew. Sustain. Energy Rev. 2012, 16, 1180–1192. [Google Scholar] [CrossRef]
- Barker, T.; Ekins, P.; Foxon, T. The macro-economic rebound effect and the UK economy. Energy Policy 2007, 35, 4935–4946. [Google Scholar] [CrossRef]
- Sorrell, S.; Dimitropoulos, J. The rebound effect: Microeconomic definitions, limitations and extensions. Ecol. Econ. 2008, 65, 636–649. [Google Scholar] [CrossRef] [Green Version]
- Suh, S.; Bergesen, J.; Gibon, T.; Hertwich, E.; Taptich, M. Green Technology Choices:The Environmental and Resource Implications of Low-Carbon Technologies; United Nations Environment Programme: Nairobi, Kenya, 2017. [Google Scholar]
- Sala, S.; Reale, F.; Crostobal Garcia, J.; Marelli, L.; Pant, R. Life Cycle Assessment for the Impact Assessment of Policies—European Commission; European Commission: Brussels, Belgium, 2016. [Google Scholar]
- Suh, S.; Huppes, G. Methods for life cycle inventory of a product. J. Clean. Prod. 2005, 13, 687–697. [Google Scholar] [CrossRef]
- Font Vivanco, D.; Kemp, R.; Van Der Voet, E. The relativity of eco-innovation: Environmental rebound effects from past transport innovations in Europe. J. Clean. Prod. 2015, 101. [Google Scholar] [CrossRef]
- Takase, K.; Kondo, Y.; Washizu, A. An Analysis of Sustainable Consumption by the Waste Input-Output Model. J. Ind. Ecol. 2005, 9, 201–219. [Google Scholar] [CrossRef]
- Thiesen, J.; Christensen, T.; Kristensen, T.; Andersen, R.; Brunoe, B.; Gregersen, T.; Thrane, M.; Weidema, B. Rebound effects of price differences. Int. J. Life Cycle Assess. 2008, 13, 104–114. [Google Scholar] [CrossRef]
- Thomas, B.A.; Azevedo, I.L. Estimating direct and indirect rebound effects for U.S. households with input-output analysis. Part 2: Simulation. Ecol. Econ. 2013, 86, 188–198. [Google Scholar] [CrossRef]
- Freire-González, J.; Font Vivanco, D. The influence of energy efficiency on other natural resources use: An input-output perspective. J. Clean. Prod. 2017, 162, 336–345. [Google Scholar] [CrossRef]
- Weidema, B.P.; Wesnaes, J.; Hermansen, J.; Kristensen, T.; Halberg, N. Environmental Improvement Potentials of Meat and Dairy Products; Eder, P., Delgado, L., Eds.; European Commission: Luxembourg, 2008. [Google Scholar]
- Bare, J.; Hofstetter, P.; Pennington, D.; de Haes, H. Midpoints versus endpoints: The sacrifices and benefits. Int. J. Life Cycle Assess. 2000, 5, 319–326. [Google Scholar] [CrossRef]
- Saunders, H.D. Historical evidence for energy efficiency rebound in 30 US sectors and a toolkit for rebound analysts. Technol. Forecast. Soc. Chang. 2013, 80, 1317–1330. [Google Scholar] [CrossRef]
- Sorrell, S. Jevons Paradox revisited: The evidence for backfire from improved energy efficiency. Energy Policy 2009, 37, 1456–1469. [Google Scholar] [CrossRef]
- Saunders, H.D. Fuel conserving (and using) production functions. Energy Econ. 2008, 30, 2184–2235. [Google Scholar] [CrossRef]
- De Haan, P.; Mueller, M.G.; Peters, A. Does the hybrid Toyota Prius lead to rebound effects? Analysis of size and number of cars previously owned by Swiss Prius buyers. Ecol. Econ. 2005, 58, 592–605. [Google Scholar] [CrossRef]
- Hens, H.; Parijs, W.; Deurinck, M. Energy consumption for heating and rebound effects. Energy Build. 2010, 42, 105–110. [Google Scholar] [CrossRef] [Green Version]
- Pehnt, M. Dynamic life cycle assessment (LCA) of renewable energy technologies. Renew. Energy 2006, 31, 55–71. [Google Scholar] [CrossRef]
- Santarius, T. Green Growth Unravelled. How Rebound Effects Baffle Sustainability Targets When the Economy Keeps Growing; Heinrich Böll Foundation: Berlin, Germany, 2012. [Google Scholar]
- Dixon, A.M.; McManus, M. An introduction to life cycle and rebound effects in water systems. In Water Demand Management; IWA Publishing: London, UK, 2005. [Google Scholar]
- Næss, P. Urban Planning: Residential Location and Compensatory Behaviour in Three Scandinavian Cities. In Rethinking Climate and Energy Policies; Santarius, T., Walnum, H., Aall, C., Eds.; Springer: New York, NY, USA, 2016; pp. 181–207. [Google Scholar]
- Friedler, E.; Hadari, M. Economic feasibility of on-site greywater reuse in multi-storey buildings. Desalination 2006, 190, 221–234. [Google Scholar] [CrossRef] [Green Version]
- Bahn-Walkowiak, B.; Bleischwitz, R.; Distelkamp, M.; Meyer, M. Taxing construction minerals: A contribution to a resource-efficient Europe. Miner. Econ. 2012, 25, 29–43. [Google Scholar] [CrossRef]
- Dace, E.; Bazbauers, G.; Berzina, A.; Davidsen, P.I. System dynamics model for analyzing effects of eco-design policy on packaging waste management system. Resour. Conserv. Recycl. 2014, 87, 175–190. [Google Scholar] [CrossRef]
- Scheierling, S.M.; Young, R.A.; Cardon, G.E. Public subsidies for water-conserving irrigation investments: Hydrologic, agronomic, and economic assessment. Water Resour. Res. 2006, 42. [Google Scholar] [CrossRef] [Green Version]
- Ward, F.A.; Pulido-Velazquez, M. Water conservation in irrigation can increase water use. Proc. Natl. Acad. Sci. USA 2008, 105, 18215–18220. [Google Scholar] [CrossRef] [PubMed] [Green Version]
- Contor, B.A.; Taylor, R.G. Why Improving Irrigation Efficiency Increases Total Volume of Consumptive Use. Irrig. Drain. 2013, 62, 273–280. [Google Scholar] [CrossRef]
- Tukker, A.; Goldbohm, R.A.; de Koning, A.; Verheijden, M.; Kleijn, R.; Wolf, O.; Pérez-Domínguez, I.; Rueda-Cantuche, J.M. Environmental impacts of changes to healthier diets in Europe. Ecol. Econ. 2011, 70, 1776–1788. [Google Scholar] [CrossRef]
- Grabs, J. The rebound effects of switching to vegetarianism. A microeconomic analysis of Swedish consumption behavior. Ecol. Econ. 2015, 116, 270–279. [Google Scholar] [CrossRef] [Green Version]
- Bernstad Saraiva Schott, A.; Andersson, T. Food waste minimization from a life-cycle perspective. J. Environ. Manag. 2015, 147, 219–226. [Google Scholar] [CrossRef] [PubMed]
- Papargyropoulou, E.; Lozano, R.K.; Steinberger, J.; Wright, N.; Ujang, Z. bin The food waste hierarchy as a framework for the management of food surplus and food waste. J. Clean. Prod. 2014, 76, 106–115. [Google Scholar] [CrossRef]
- Salemdeeb, R.; Font Vivanco, D.; Al-Tabbaa, A.; zu Ermgassen, E.K.H.J. A holistic approach to the environmental evaluation of food waste prevention. Waste Manag. 2017, 59. [Google Scholar] [CrossRef] [PubMed]
- Druckman, A.; Chitnis, M.; Sorrell, S.; Jackson, T. Missing carbon reductions? Exploring rebound and backfire effects in UK households. Energy Policy 2011, 39, 3572–3581. [Google Scholar] [CrossRef] [Green Version]
- Reale, F.; Cinelli, M.; Sala, S. Towards a research agenda for the use of LCA in the impact assessment of policies. Int. J. Life Cycle Assess. 2017, 22, 1477–1481. [Google Scholar] [CrossRef]
- EC. Better Regulation for Better Results—An EU Agenda. Communication from the Commission COM (2015) 215; EC: Brussels, Belgium, 2015. [Google Scholar]
- Earles, J.M.; Halog, A. Consequential life cycle assessment: A review. Int. J. Life Cycle Assess. 2011, 16, 445–453. [Google Scholar] [CrossRef]
- Wood, R.; Hertwich, E.G. Economic modelling and indicators in life cycle sustainability assessment. Int. J. Life Cycle Assess. 2013, 18, 1710–1721. [Google Scholar] [CrossRef]
- Suh, S.; Yang, Y. On the uncanny capabilities of consequential LCA. Int. J. Life Cycle Assess. 2014, 19, 1179–1184. [Google Scholar] [CrossRef]
- Girod, B.; Haan, P.; Scholz, R. Consumption-as-usual instead of ceteris paribus assumption for demand. Int. J. Life Cycle Assess. 2011, 16, 3–11. [Google Scholar] [CrossRef]
- Frischknecht, R.; Benetto, E.; Dandres, T.; Heijungs, R.; Roux, C.; Schrijvers, D.; Wernet, G.; Yang, Y.; Messmer, A.; Tschuemperlin, L. LCA and decision making: When and how to use consequential LCA; 62nd LCA forum, Swiss Federal Institute of Technology, Zürich, 9 September 2016. Int. J. Life Cycle Assess. 2017, 22, 296–301. [Google Scholar] [CrossRef]
- EC-JRC. International Reference Life Cycle Data System (ILCD) Handbook—General Guide for Life Cycle Assessment—Detailed Guidance; Publications Office of the European Union: Luxembourg, 2010. [Google Scholar]
- Font Vivanco, D.; Tukker, A.; Kemp, R. Do methodological choices in environmental modeling bias rebound effects? A case study on electric cars. Environ. Sci. Technol. 2016. [Google Scholar] [CrossRef] [PubMed]
- EPA. Renewable Fuel Standard Program (RFS2) Regulatory Impact Analysis; EPA: Washington, DC, USA, 2010.
- Tukker, A.; de Koning, A.; Wood, R.; Hawkins, T.; Lutter, S.; Acosta, J.; Rueda Cantuche, J.M.; Bouwmeester, M.; Oosterhaven, J.; Drosdowski, T.; et al. Exiopol—Development and Illustrative Analyses of A Detailed Global Mr Ee Sut/Iot. Econ. Syst. Res. 2013, 25, 50–70. [Google Scholar] [CrossRef]
- De Camillis, C.; Brandão, M.; Zamagni, A.; Pennington, D. Sustainability Assessment of Future-Oriented Scenarios: A Review of Data Modelling Approaches in Life Cycle Assessment; Publications Office of the European Union: Luxemburg, 2013. [Google Scholar]
- Wender, B.A.; Foley, R.W.; Hottle, T.A.; Sadowski, J.; Prado-Lopez, V.; Eisenberg, D.A.; Laurin, L.; Seager, T.P. Anticipatory life-cycle assessment for responsible research and innovation. J. Responsib. Innov. 2014, 1, 200–207. [Google Scholar] [CrossRef]
- Miller, S.A.; Keoleian, G.A. A Framework for Analyzing Transformative Technologies in Life Cycle Assessment. Environ. Sci. Technol. 2015. [Google Scholar] [CrossRef] [PubMed]
- Barker, T.; Dagoumas, A.; Rubin, J. The macroeconomic rebound effect and the world economy. Energy Effic. 2009, 2, 411–427. [Google Scholar] [CrossRef]
- Dimitropoulos, J. Energy productivity improvements and the rebound effect: An overview of the state of knowledge. Energy Policy 2007, 35, 6354–6363. [Google Scholar] [CrossRef]
- Burfisher, M.E. Introduction to Computable General Equilibrium Models; Cambridge University Press: Cambridge, UK, 2017; ISBN 1316889378. [Google Scholar]
- Somé, A.; Dandres, T.; Gaudreault, C.; Majeau-Bettez, G.; Wood, R.; Samson, R. Coupling Input-Output Tables with Macro-Life Cycle Assessment to Assess Worldwide Impacts of Biofuels Transport Policies. J. Ind. Ecol. 2017. [Google Scholar] [CrossRef]
- Nguyen, T.T.H.; Corson, M.S.; Doreau, M.; Eugène, M.; van der Werf, H.M.G. Consequential LCA of switching from maize silage-based to grass-based dairy systems. Int. J. Life Cycle Assess. 2013, 18, 1470–1484. [Google Scholar] [CrossRef]
- Lee, D.H. Development and environmental impact of hydrogen supply chain in Japan: Assessment by the CGE-LCA method in Japan with a discussion of the importance of biohydrogen. Int. J. Hydrog. Energy 2014, 39, 19294–19310. [Google Scholar] [CrossRef]
- Jokinen, P.; Malaska, P.; Kaivo-Oja, J. The environment in an “information society”—A transition stage towards more sustainable development? Futures 1998, 30, 485–498. [Google Scholar] [CrossRef]
- Mattila, T.; Lehtoranta, S.; Sokka, L.; Melanen, M.; Nissinen, A. Methodological Aspects of Applying Life Cycle Assessment to Industrial Symbioses. J. Ind. Ecol. 2012, 16, 51–60. [Google Scholar] [CrossRef]
- Ruuska, A.; Häkkinen, T. Material Efficiency of Building Construction. Buildings 2014, 4, 266–294. [Google Scholar] [CrossRef] [Green Version]
- Buyle, M.; Braet, J.; Audenaert, A. Life cycle assessment in the construction sector: A review. Renew. Sustain. Energy Rev. 2013, 26, 379–388. [Google Scholar] [CrossRef]
- Zink, T.; Geyer, R. Circular Economy Rebound. J. Ind. Ecol. 2017, 21, 593–602. [Google Scholar] [CrossRef]
- Makov, T.; Font Vivanco, D. Does the Circular Economy Grow the Pie? The Case of Rebound Effects From Smartphone Reuse. Front. Energy Res. 2018, 6, 39. [Google Scholar] [CrossRef]
- Larson, W.; Liu, F.; Yezer, A. Energy footprint of the city: Effects of urban land use and transportation policies. J. Urban Econ. 2012, 72, 147–159. [Google Scholar] [CrossRef]
- Mohtar, R.H.; Lawford, R. Present and future of the water-energy-food nexus and the role of the community of practice. J. Environ. Stud. Sci. 2016, 6, 192–199. [Google Scholar] [CrossRef]
- Wakeford, J.J.; Lagrange, S.M.; Kelly, C. Managing the Energy-Food-Water-Nexus in Developing Countries: Case Studies of Transition Governance; Stellenbosch University: Stellenbosch, South Africa, 2016. [Google Scholar]
- Jacobsen, B. Energy Use in Water Utilities. Available online: http://ec.europa.eu/environment/archives/greenweek2012/sites/default/files/3-1_jacobsen.pdf (accessed on 29 May 2018).
- Maestre Andrés, S.; Calvet Mir, L.; van den Bergh, J.C.J.M.; Ring, I.; Verburg, P.H. Ineffective biodiversity policy due to five rebound effects. Ecosyst. Serv. 2012, 1, 101–110. [Google Scholar] [CrossRef]
- Girod, B.; de Haan, P. Mental Rebound (Rebound Research Report No. 3); ETH: Zürich, Switzerland, 2009. [Google Scholar]
- Liu, J.; Mooney, H.; Hull, V.; Davis, S.J.; Gaskell, J.; Hertel, T.; Lubchenco, J.; Seto, K.C.; Gleick, P.; Kremen, C.; et al. Systems integration for global sustainability. Science 2015, 347. [Google Scholar] [CrossRef] [PubMed]
- Bazilian, M.; Rogner, H.; Howells, M.; Hermann, S.; Arent, D.; Gielen, D.; Steduto, P.; Mueller, A.; Komor, P.; Tol, R.S.J.; et al. Considering the energy, water and food nexus: Towards an integrated modelling approach. Energy Policy 2011, 39, 7896–7906. [Google Scholar] [CrossRef]
- Andrews-Speed, P.; Bleischwitz, R.; Boersma, T.; Johnson, C.; Kemp, G.; VanDeveer, S.D. Want, Waste or War?: The Global Resource Nexus and the Struggle for Land, Energy, Food, Water and Minerals; Routledge: London, UK, 2014; ISBN 1317665864. [Google Scholar]
- Font Vivanco, D.; Wang, R.; Hertwich, E. Nexus Strength: A Novel Metric for Assessing the Global Resource Nexus. J. Ind. Ecol. 2017. [Google Scholar] [CrossRef]
- Karabulut, A.A.; Crenna, E.; Sala, S.; Udias, A. A proposal for integration of the ecosystem-water-food-land-energy (EWFLE) nexus concept into life cycle assessment: A synthesis matrix system for food security. J. Clean. Prod. 2018, 172, 3874–3889. [Google Scholar] [CrossRef]
- Cooper, D.R.; Gutowski, T.G. The Environmental Impacts of Reuse: A Review. J. Ind. Ecol. 2017, 21, 38–56. [Google Scholar] [CrossRef]
Figure 1.
Degree of evidence in the literature (extensive, moderate, or scarce) of rebound effects from policy interventions for policy areas defined according to targeted sectors and resources.
Figure 1.
Degree of evidence in the literature (extensive, moderate, or scarce) of rebound effects from policy interventions for policy areas defined according to targeted sectors and resources.


Table 1.
Types of rebound mechanisms for the case of a policy promoting electric vehicles (EV). Based on Jenkins et al. [17].
Table 1.
Types of rebound mechanisms for the case of a policy promoting electric vehicles (EV). Based on Jenkins et al. [17].
| Type of Effect | Consumption Side | Production Side | |
|---|---|---|---|
| Micro-economic | Direct | Income effect: Consumers respond to the increase in effective income by increasing the demand for EV. | Output effect: Producers that require EV as production factors (e.g., delivery companies) respond to the decrease in production costs by increasing the demand for EV. |
| Substitution effect: The lower driving costs make consumers prioritize driving EV over other goods and services. | Substitution effect: The lower driving costs make producers prioritize the demand for EV over other production factors, e.g., capital and/or labour. | ||
| Indirect | Re-spending effect: Saturation in the demand for EV cause consumers to spend the remaining effective income in other goods and services. | Re-investment effect: Limits to the use of EV as a production factor lead producers to investments in other production factors. | |
| Macroeconomic | Market price effect: Aggregate increases in demand for EV at the microeconomic level can cause a decrease in EV’s market price, e.g., because of economies of scale, inducing extra demand for them from both consumers and producers. Composition effect: Economic sectors using EV as a production factor can decrease its production costs, resulting in a decrease in the market price and subsequent increased demand for their goods and services. Growth effect: Increases in productivity can, ceteris paribus, spur greater economic output and growth, either through sectorial reallocation of growth or overall growth via an increase in total factor productivity. | ||
© 2018 by the authors. Licensee MDPI, Basel, Switzerland. This article is an open access article distributed under the terms and conditions of the Creative Commons Attribution (CC BY) license (http://creativecommons.org/licenses/by/4.0/).
Share and Cite
MDPI and ACS Style
Font Vivanco, D.; Sala, S.; McDowall, W. Roadmap to Rebound: How to Address Rebound Effects from Resource Efficiency Policy. Sustainability 2018, 10, 2009. https://doi.org/10.3390/su10062009
AMA Style
Font Vivanco D, Sala S, McDowall W. Roadmap to Rebound: How to Address Rebound Effects from Resource Efficiency Policy. Sustainability. 2018; 10(6):2009. https://doi.org/10.3390/su10062009
Chicago/Turabian StyleFont Vivanco, David, Serenella Sala, and Will McDowall. 2018. "Roadmap to Rebound: How to Address Rebound Effects from Resource Efficiency Policy" Sustainability 10, no. 6: 2009. https://doi.org/10.3390/su10062009
Note that from the first issue of 2016, this journal uses article numbers instead of page numbers. See further details here.