Incorporation of Circular Aspects into Product Design and Labelling: Consumer Preferences

 ,
,
Abstract
:1. Introduction
2. Background
- -
- Durability refers to a product’s ability to maintain its functions over a prolonged time and the degree to which it is repairable before it becomes obsolete [31].
- -
- Repairability refers to the ability and ease of a product to be repaired during its life cycle [32], including aspects related to its disassemblability or modulability.
- -
- Recycled material content refers to the amount of product materials from secondary sources instead of raw/primary materials [33].
- -
- Low environmental impact includes any aspect that contributes to reduce the environmental performance of a product during its life cycle. It considers both inputs and outputs of materials, energy, emissions or waste generated during the life cycle of products, measured in different impact categories [34,35].
- -
- Fair working conditions includes indicators related to the characteristics of the work done in the product manufacturing stage, from raw material extraction activities to the distribution stage, such as workers’ fair salary, hours worked, forced labour, gender discrimination, etc. [36].
- -
- Origin of production is related to the distance from the product manufacturing location to the point of sale. This aspect is gaining importance internationally as “zero-mile” products are being considered an essential tool to fight against pollution by reducing the consumption of fossil fuels that result from transportation [37].
3. Survey and Sample Definition
4. Statistical Analysis of the Results
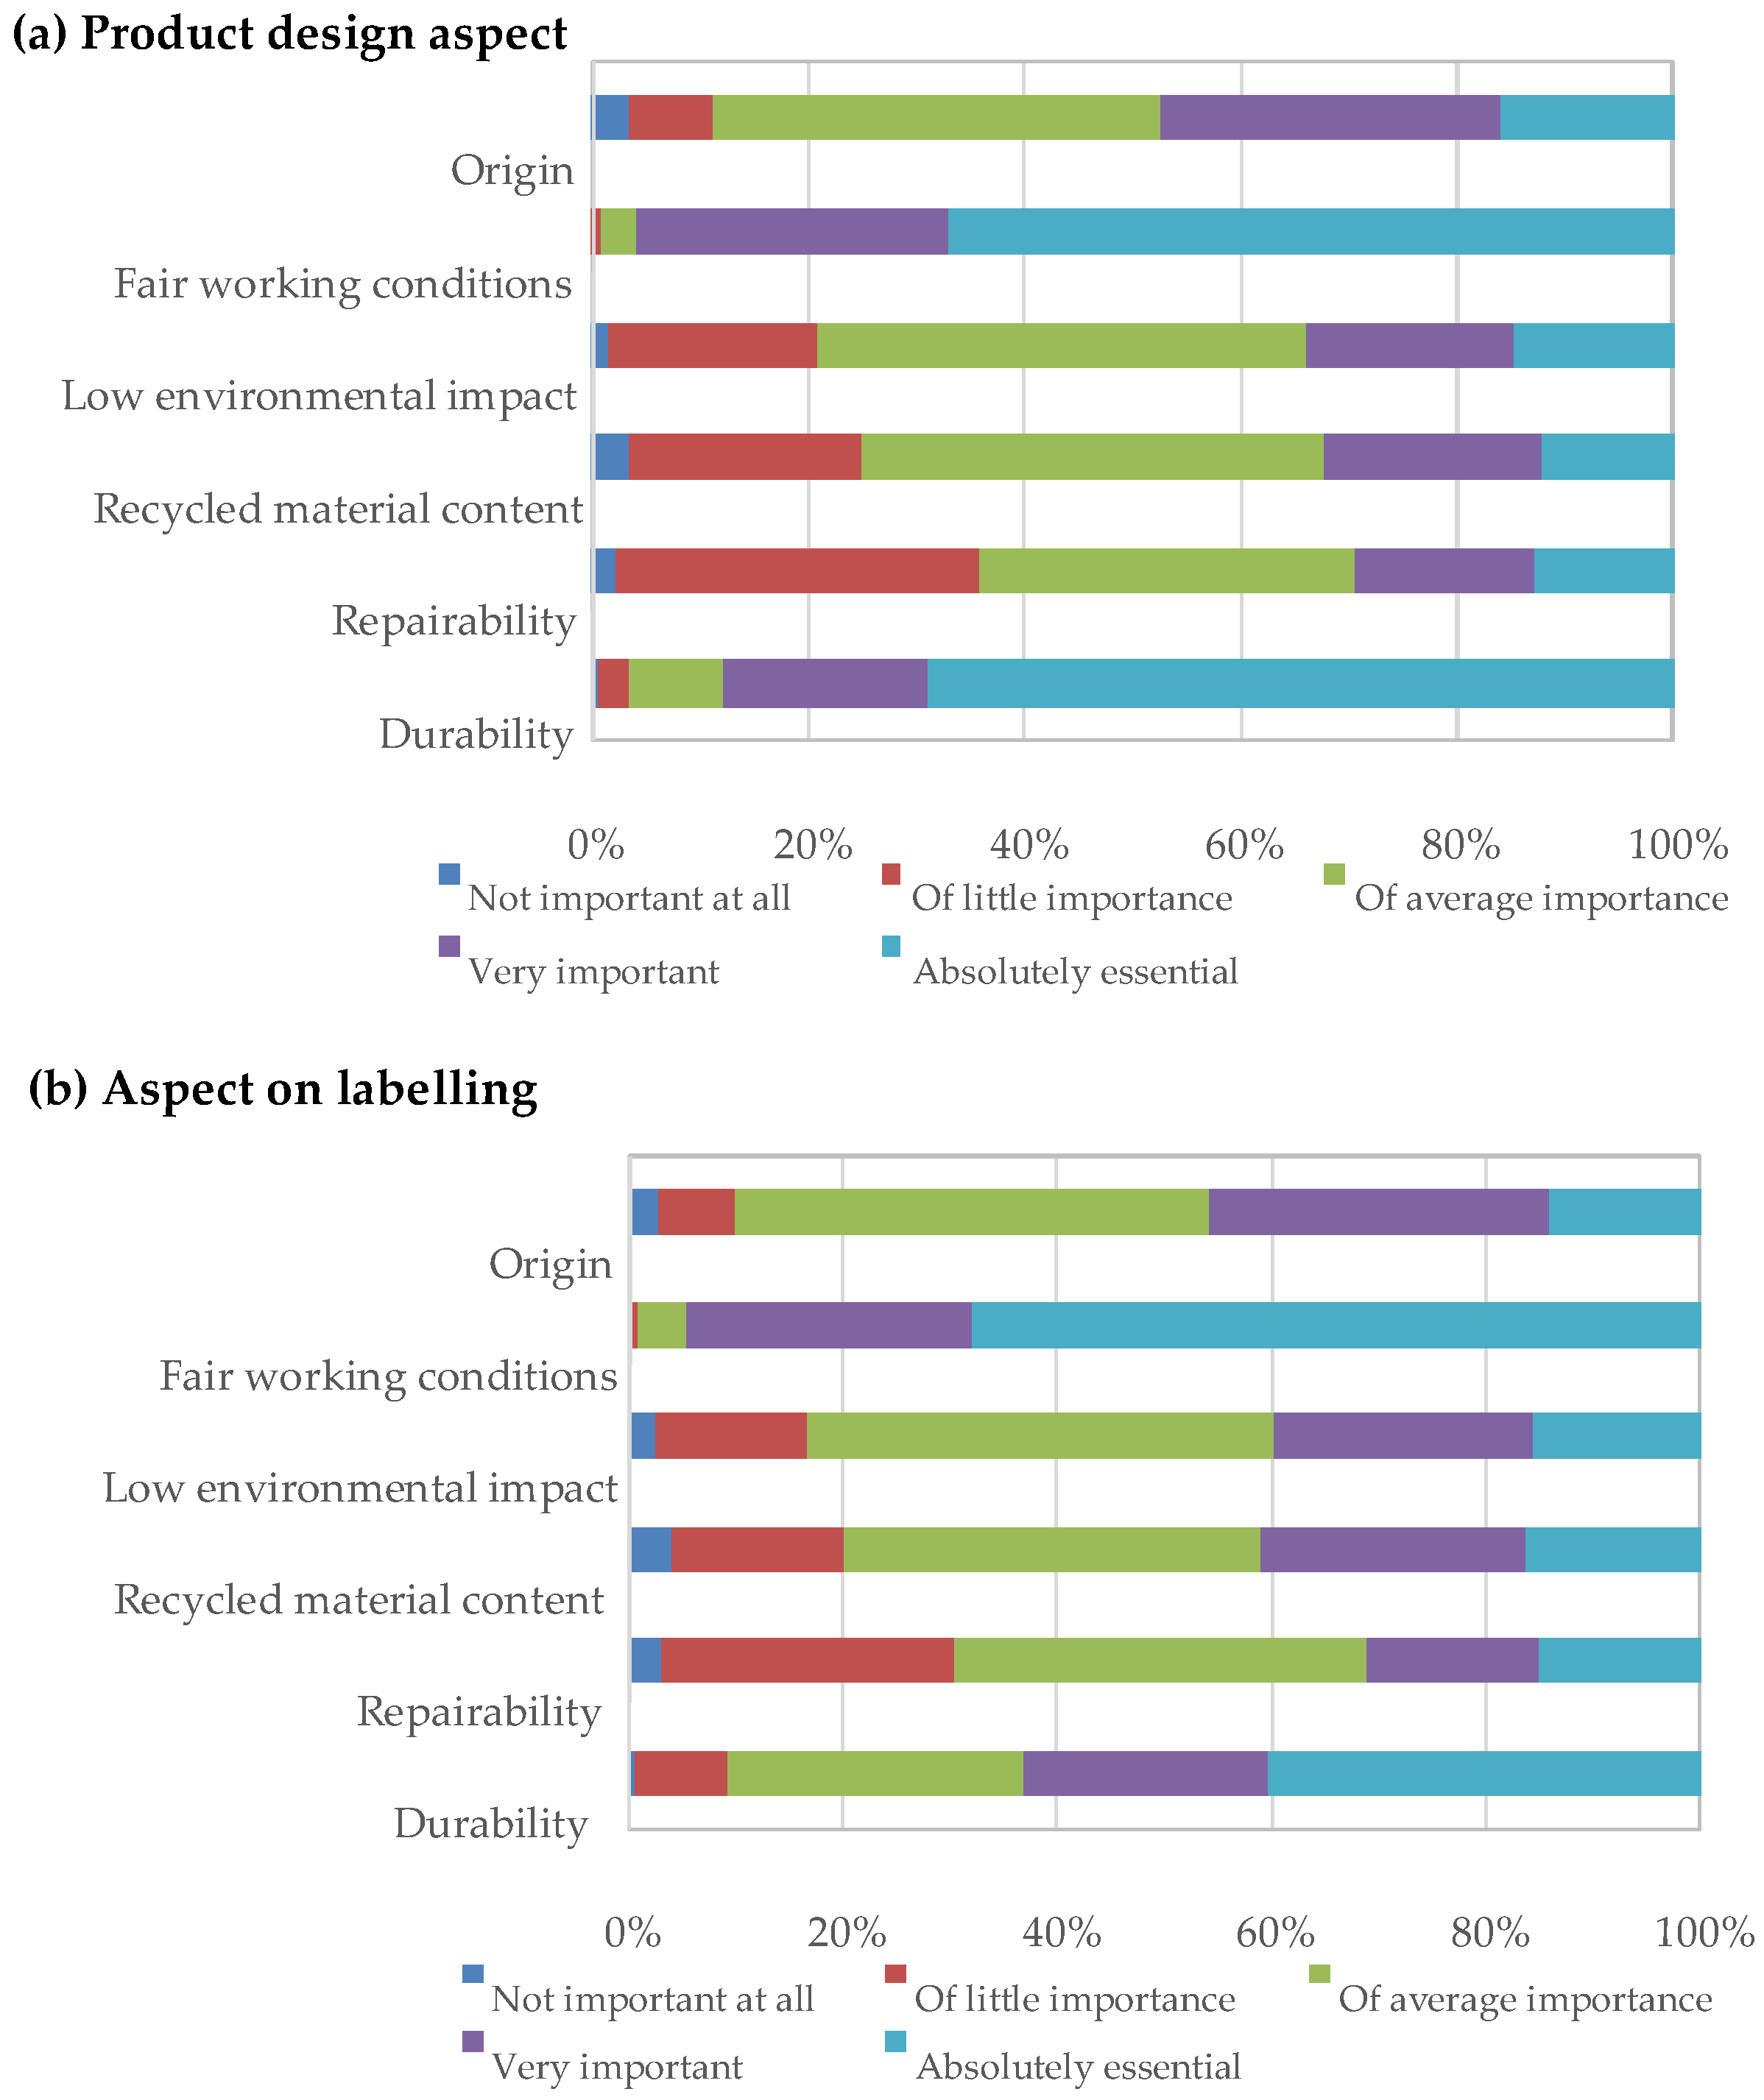
4.1. Descriptive Analysis of the Survey Responses
- The contingency tables for aspects related to Repairability, Recycled material content and Low environmental impact show a large number of responses on the main diagonal (57–60% of the responses), with a larger number of responses in the central part of the diagonal, while 22–26% of the responses are grouped above the main diagonal and 18–19% of them below the diagonal. This means that slightly more than half of the respondents attach the same level of importance to incorporating each aspect and to including them on product labelling by assigning an average level of importance, range from 3.1 to 3.3, depending on the aspect (scale from 1 to 5). Of those remaining, slightly more than a half prioritise labelling as opposed to design.
- The contingency tables for Durability also show many responses on the main diagonal (58% of the responses), with more responses in the lower part of the diagonal; 4% of the responses are grouped above the main diagonal and 38% of them below the diagonal. This means that nearly 60% of the respondents attach the same level of importance to incorporating each aspect and to including them on product labelling by assigning an average level of importance (4.5). Of those remaining, almost the whole sample prioritises the incorporation of the given aspect during product design as opposed to including this aspect on product labelling.
- The contingency table for Fair working conditions and Origin show practically all the responses on the main diagonal (96% and 99%, respectively), with more responses at the bottom of the diagonal for the aspect Fair working conditions, and in the middle-lower area for Origin. The percentage of responses grouped above or below the main diagonal is around 0–2%. This means that almost all the respondents attach the same level of importance to incorporating each aspect and including them on product labelling by attaching an average level of importance (4.7) for Fair working conditions and 3.5 for Origin.
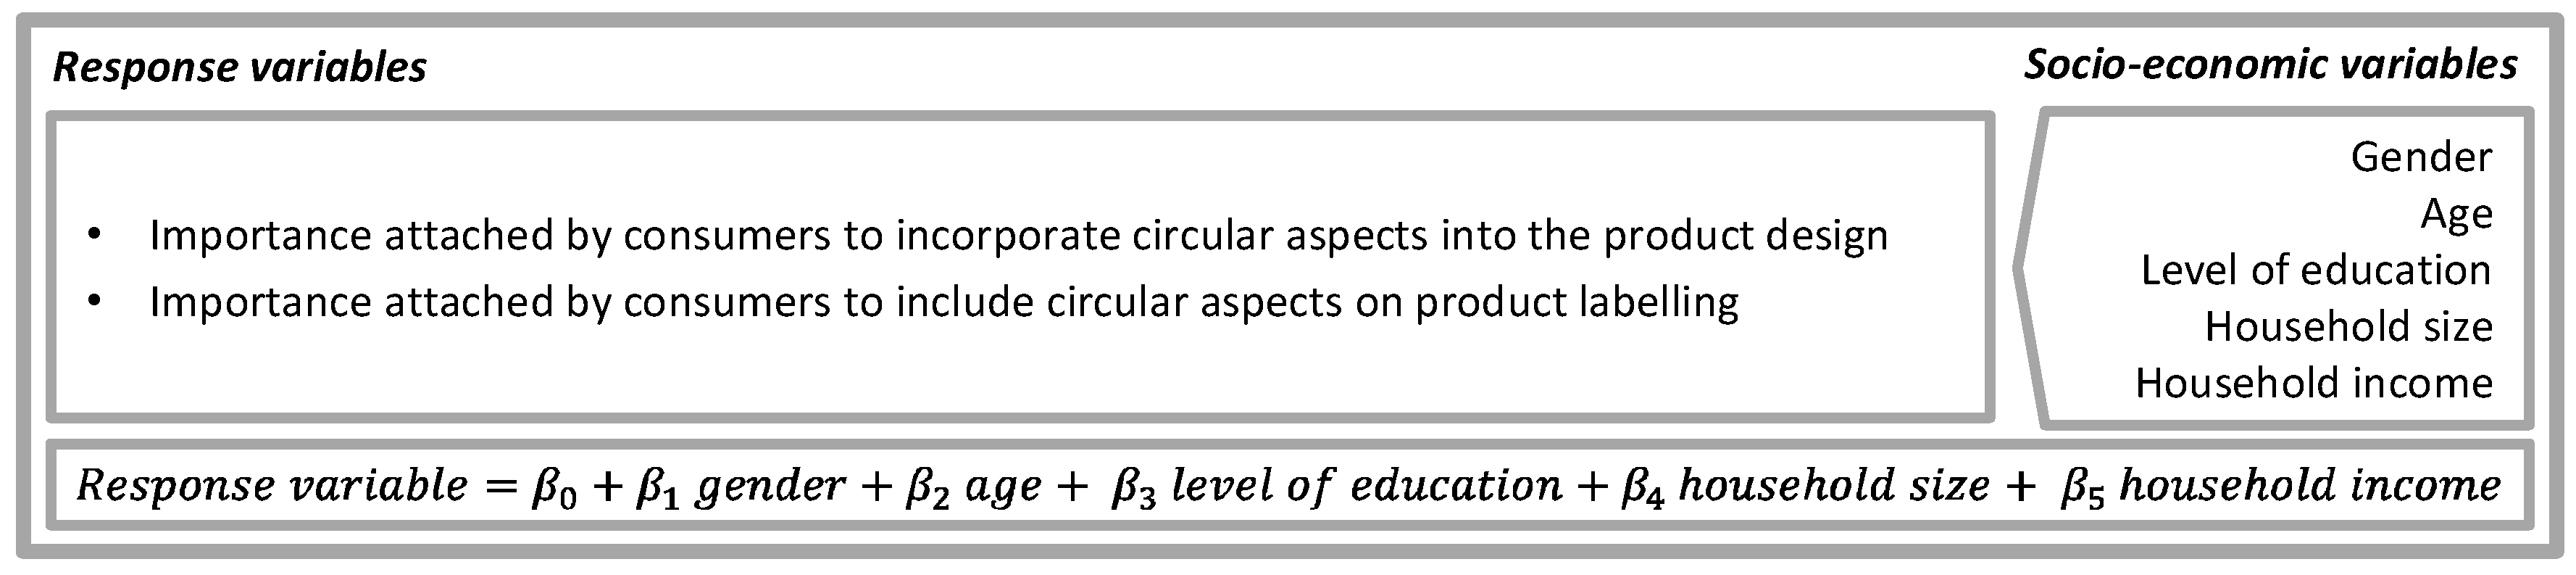
4.2. Multinomial Regression
5. Discussion and Conclusions
Author Contributions
Funding
Conflicts of Interest
References
- World Business Council of Sustainable Development (WBCSD). Sustainable Consumption Facts and Trends, from a Business Perspective. The Business Role Focus Area; World Business Council of Sustainable Development: Geneva, Switzerland, 2008. [Google Scholar]
- The Ellen Macarthur Foundation. Towards the Circular Economy; The Ellen Macarthur Foundation: Cowes, UK, 2013. [Google Scholar]
- Organisation for Economic Co-Operation and Development (OECD). Promoting Sustainable Consumption: Good Practices in OECD Countries; OECD: Paris, France, 2008. [Google Scholar]
- COM 33 (2017) Implementation of the Circular Action Plan; Report from the Commission to the European Parliament, the Council, the European Economic and Social Committee and the Committee of the Regions. Available online: http://ec.europa.eu/environment/circular-economy/implementation_report.pdf (accessed on 27 June 2018).
- United Nations. Sustainable Development Goals: 17 Goals to Transform Our World. Available online: www.un.org/sustainabledevelopment/es/economic-growth/ (accessed on 27 June 2018).
- Gurauskienė, I. The behaviour of consumers as one of the most important factors in e-waste problem. Environ. Res. Eng. Manag. 2008, 4, 56–65. [Google Scholar]
- Guo, B.; Geng, Y.; Sterr, T.; Zhu, Q.; Liu, Y. Investigating public awareness on circular economy in western China: A case of Urumqi Midong. J. Clean. Prod. 2017, 142, 2177–2186. [Google Scholar] [CrossRef]
- Braithwaite, N.; Densley-Tingley, D.; Moreno, M. Should energy labels for washing machines be expanded to include a durability rating? In Proceedings of the Product Lifetimes and the Environment (PLATE) Conference, Notthingham, UK, 17–19 June 2015. [Google Scholar]
- Maurer, C.S.; Pachl, U. Durable Goods: More Sustainable Products, Better Consumer Rights; The European Consumer Organisation: Belgium, Brussels, 2015; Volume 32. [Google Scholar]
- Nicholls, A.; Opal, C. Fair Trade: Market-Driven Ethical Consumption; Sage Publications: Thousand Oaks, CA, USA, 2005; ISBN 9781446211526. [Google Scholar]
- Hertel, S.; Scruggs, L.; Heidkamp, C.P. Human Rights and Public Opinion: From Attitudes to Action. Polit. Sci. Q. 2009, 124, 443–459. [Google Scholar] [CrossRef]
- Coelho, S.L. Fair trade consumers in Portugal: Values and lifestyles. Int. J. Consum. Stud. 2015, 39, 437–444. [Google Scholar] [CrossRef]
- Spanish Circular Economy Strategy. Available online: http://www.mapama.gob.es/es/calidad-y-evaluacion-ambiental/temas/economia-circular/estrategia/ (accessed on 27 June 2018).
- Porter, A. How Long Should Your Washing Machine Last? Available online: https://conversation.which.co.uk/home-energy/washing-machines-faulty-broken-lifespan-lifetime-warranty-guarantee/ (accessed on 27 June 2018).
- De Pelsmacker, P.; Janssens, W. A model for fair trade buying behaviour: The role of perceived quantity and quality of information and of product-specific attitudes. J. Bus. Ethics 2007, 75, 361–380. [Google Scholar] [CrossRef]
- European Commission. Europeans’ Attitudes towards the Issue of Sustainable Consumption and Production. Available online: http://ec.europa.eu/commfrontoffice/publicopinion/flash/fl_367_en.pdf (accessed on 27 June 2018).
- European Economic and Social Committee. The Influence of Lifespan Labelling on Consumers; European Economic and Social Committee: Bruxelles, Belgium, 2016. [Google Scholar]
- Dünnhoff, E.; Palm, A. Comprehensibility of the EU Energy Label. Results of Two Focus Groups and a Representative Consumer Survey; Ministry of Economic Affairs, Climate Protection, Energy and Regional Planning, Rhineland-Palatinate; European Union: Brussels, Belgium, 2014. [Google Scholar]
- D’Souza, C. Bridging the communication gap: Dolphin-safe “ecolabels”. Corp. Commun. Int. J. 2000, 5, 185–190. [Google Scholar] [CrossRef]
- Grunert, K.G.; Hieke, S.; Wills, J. Sustainability labels on food products: Consumer motivation, understanding and use. Food Policy 2014, 44, 177–189. [Google Scholar] [CrossRef] [Green Version]
- Schumacher, I. Ecolabeling, consumers’ preferences and taxation. Ecol. Econ. 2010, 69, 2202–2212. [Google Scholar] [CrossRef]
- Saphores, J.D.M.; Ogunseitan, O.A.; Shapiro, A.A. Willingness to engage in a pro-environmental behavior: An analysis of e-waste recycling based on a national survey of U.S. households. Resour. Conserv. Recycl. 2012, 60, 49–63. [Google Scholar] [CrossRef]
- Nixon, H.; Saphores, J.-D.M.; Ogunseitan, O.A.; Shapiro, A.A. Understanding preferences for recycling electronic waste in California: The influence of environmental attitudes and beliefs on willingness to pay. Environ. Behav. 2009, 41, 101–124. [Google Scholar] [CrossRef]
- Saphores, J.D.M.; Nixon, H.; Ogunseitan, O.A.; Shapiro, A.A. Household willingness to recycle electronic waste: An application to California. Environ. Behav. 2006, 38, 183–208. [Google Scholar] [CrossRef]
- Yang, Y.; Li, B.; Yao, R. A method of identifying and weighting indicators of energy efficiency assessment in Chinese residential buildings. Energy Policy 2010, 38, 7687–7697. [Google Scholar] [CrossRef]
- Park, K.C. Understanding ethical consumers: Willingness-to-pay by moral cause. J. Consum. Mark. 2018, 35, 157–168. [Google Scholar] [CrossRef]
- Rousseau, S. The role of organic and fair trade labels when choosing chocolate. Food Qual. Prefer. 2015, 44, 92–100. [Google Scholar] [CrossRef] [Green Version]
- Panico, T.; Del Giudice, T.; Caracciolo, F. Quality dimensions and consumer preferences: A choice experiment in the Italian extra-virgin olive oil market. Agric. Econ. Rev. 2014, 15, 100–112. [Google Scholar]
- Ladhari, R.; Tchetgna, N.M. Values, socially conscious behaviour and consumption emotions as predictors of Canadians’ intent to buy fair trade products. Int. J. Consum. Stud. 2017, 41, 696–705. [Google Scholar] [CrossRef]
- Coppola, A.; La Barbera, F.; Verneau, F. Fair trade products’ consumption: A market segmentation by personal values. Qual.-Access Success 2015, 16, 23–31. [Google Scholar]
- European Commission. Durability and the Construction Products Directive-Guidance Paper F-(Concerning the Construction Products Directive-89/106/EEC); Enterprise and Industry Directorate-General; European Commission: Brussels, Belgium, 2004. [Google Scholar]
- Eco3e Ecodesign Guide of WEEE Compliance Schemes. Available online: http://eco3e.eu/introduction_en/ (accessed on 10 January 2018).
- European Commission. Directive 2012/19/EU of the European Parliament and of the Council of 4 July 2012 on Waste Electrical and Electronic Equipment (WEEE); European Commission: Brussels, Belgium, 2012. [Google Scholar]
- International Organization for Standardization. Environmental Management. Life Cycle Assessment. Principles and Framework; ISO 14040; ISO: Geneva, Switzerland, 2006. [Google Scholar]
- International Organization for Standardization. Environmental Management. Life Cycle Assessment. Requirements and Guidelines; ISO 14044; ISO: Geneva, Switzerland, 2006. [Google Scholar]
- United Nations Environment Programme (UNEP-SETAC). The Methodological Sheets for Subcategories in Social Life Cycle Assessment (S-LCA); United Nations Environment Programme: Nairobi, Kenya, 2013. [Google Scholar]
- Laureati, M.; Jabes, D.; Russo, V.; Pagliarini, E. Sustainability and organic production: How information influences consumer’s expectation and preference for yogurt. Food Qual. Prefer. 2013, 30, 1–8. [Google Scholar] [CrossRef]
- Cerri, J.; Testa, F.; Rizzi, F. The more I care, the less I will listen to you: How information, environmental concern and ethical production influence consumers’ attitudes and the purchasing of sustainable products. J. Clean. Prod. 2018, 175, 343–353. [Google Scholar] [CrossRef]
- Pedrini, M.; Ferri, L.M. Socio-demographical antecedents of responsible consumerism propensity. Int. J. Consum. Stud. 2014, 38, 127–138. [Google Scholar] [CrossRef]
- Hudson, M.; Hudson, I.; Edgerton, J.D. Political consumerism in context: An experiment on status and information in ethical consumption decisions. Am. J. Econ. Sociol. 2013, 72, 1009–1037. [Google Scholar] [CrossRef]
- Taylor, J.E.; Boasson, V. Who buys fair trade and why (or Why Not)? A random survey of households. J. Consum. Aff. 2014, 48, 418–430. [Google Scholar] [CrossRef]
- D’Souza, C.; Taghian, M.; Lamb, P.; Peretiatko, R. Green decisions: Demographics and consumer understanding of environmental labels. Int. J. Consum. Stud. 2007, 31, 371–376. [Google Scholar] [CrossRef]
- Kumar, A.; Holuszko, M.; Espinosa, D.C.R. E-waste: An overview on generation, collection, legislation and recycling practices. Resour. Conserv. Recycl. 2017, 122, 32–42. [Google Scholar] [CrossRef]
- Sama, C.; Crespo-Cebada, E.; Díaz-Caro, C.; Escribano, M.; Mesías, F.J. Consumer Preferences for Foodstuffs Produced in a Socio-environmentally Responsible Manner: A Threat to Fair Trade Producers? Ecol. Econ. 2018, 150, 290–296. [Google Scholar] [CrossRef]
- World Business Council for Sustainable Development. WBCSD Sustainable Procurement of Wood and Paper-Based Products; World Business Council for Sustainable Development: Geneva, Switzerland, 2011. [Google Scholar]
- The Nordic Consumer Ombudsmen. Nordic Consumer Ombudsmen. The Consumer Ombudsman’s Guidelines on the Use of Environmental and Ethical Claims in Marketing; The Nordic Consumer Ombudsmen: Oslo, Norway, 2009. [Google Scholar]
- Vehmas, K.; Raudaskoski, A.; Heikkilä, P.; Harlin, A.; Mensonen, A. Consumer attitudes and communication in circular fashion. J. Fash. Mark. Manag. Int. J. 2018. [Google Scholar] [CrossRef]
- Hiller Connell, K.Y. Exploring consumers’ perceptions of eco-conscious apparel acquisition behaviors. Soc. Responsib. J. 2011, 7, 61–73. [Google Scholar] [CrossRef]
- Sarti, S.; Darnall, N.; Testa, F. Market segmentation of consumers based on their actual sustainability and health-related purchases. J. Clean. Prod. 2018, 192, 270–280. [Google Scholar] [CrossRef]
- Panico, T.; Verneau, F.; Capone, V.; La Barbera, F.L.; Del Giudice, T. Antecedents of intention and behavior towards fair trade products: A study on values and attitudes in Italy. Int. J. Food Syst. Dyn. 2017, 8, 96–105. [Google Scholar] [CrossRef]
- European Commission. Flash Eurobarometer 367 Attitudes of Europeans towards Building the Single Market for Green Products; European Commission: Brussels, Belgium, 2013; Volume 114. [Google Scholar]
- Birch, D.; Memery, J.; De Silva Kanakaratne, M. The mindful consumer: Balancing egoistic and altruistic motivations to purchase local food. J. Retail. Consum. Serv. 2018, 40, 221–228. [Google Scholar] [CrossRef]
- Van Loo, E.J.; Caputo, V.; Nayga, R.M.; Seo, H.S.; Zhang, B.; Verbeke, W. Sustainability labels on coffee: Consumer preferences, willingness-to-pay and visual attention to attributes. Ecol. Econ. 2015, 118, 215–225. [Google Scholar] [CrossRef]
- Grebitus, C.; Steiner, B.; Veeman, M.M. Paying for sustainability: A cross-cultural analysis of consumers’ valuations of food and non-food products labeled for carbon and water footprints. J. Behav. Exp. Econ. 2016, 63, 50–58. [Google Scholar] [CrossRef]
- Fabricio, A.C.B.; Da Veiga, C.P.; Marchetti, R.Z. Measuring consumer-oriented sustainability: A Brazilian perspective. Int. J. Environ. Sustain. Dev. 2017, 16, 257. [Google Scholar] [CrossRef]
- De Carvalho, B.L.; Salgueiro, M.D.F.; Rita, P. Consumer sustainability consciousness: A five dimensional construct. Ecol. Indic. 2015, 58, 402–410. [Google Scholar] [CrossRef]
- Department for Environment Food and Rural Affairs (Defra); Department of Trade and Industry (DTI). I Will If You Will. Towards Sustainable Consumption; Sustainable Development Commission: London, UK, 2006.
- European Parliament. Directive 2009/125/EC of the European Parliament and of the Council of 21 October 2009 Establishing a Framework for the Setting of Ecodesign Requirements for Energy-Related Products. Available online: https://eur-lex.europa.eu/legal-content/en/ALL/?uri=celex%3A32009L0125 (accessed on 27 June 2018).
- European Commission. Communication from the Commission to the European Parliament and the Council. Energy Efficiency and Its Contribution to Energy Security and the 2030 Framework for Climate and Energy Policy; European Commission: Brussels, Belgium, 2014. [Google Scholar]
- Eurobarometer, F. Attitudes of Europeans towards Waste Management and Resource Efficiency. Available online: http://ec.europa.eu/commfrontoffice/publicopinion/flash/fl_388_en.pdf (accessed on 27 June 2018).
- Grankvist, G.; Biel, A. Predictors of purchase of eco-labelled food products: A panel study. Food Qual. Prefer. 2007, 18, 701–708. [Google Scholar] [CrossRef]
- Koszewska, M. Social and eco-labelling of textile and clothing goods as a means of communication and product differentiation. Fibres Text. East. Eur. 2011, 87, 20–26. [Google Scholar]
- Noblet, C.L.; Teisl, M.F.; Rubin, J. Factors affecting consumer assessment of eco-labeled vehicles. Transp. Res. D Transp. Environ. 2006, 11, 422–431. [Google Scholar] [CrossRef]
- Pickett-Baker, J.; Ozaki, R. Pro-environmental products: Marketing influence on consumer purchase decision. J. Consum. Mark. 2008, 25, 281–293. [Google Scholar] [CrossRef]
- Food Standards Australia New Zealand (FSANZ). Consumer Attitudes Survey 2007 Food. A Benchmark Survey of Consumer’s Attitudes to Food Issues; FSANZ: Canberra, Australia, 2008; ISBN 978-0-642-34556-1. [Google Scholar]
- Pérez-Belis, V.; Braulio-Gonzalo, M.; Juan, P.; Bovea, M.D. Consumer attitude towards the repair and the second-hand purchase of small household electrical and electronic equipment. A Spanish case study. J. Clean. Prod. 2017, 158, 261–275. [Google Scholar] [CrossRef] [Green Version]
- Bovea, M.D.; Ibáñez-Forés, V.; Pérez-Belis, V.; Juan, P. A survey on consumers’ attitude towards storing and end of life strategies of small information and communication technology devices in Spain. Waste Manag. 2018, 71, 589–602. [Google Scholar] [CrossRef] [PubMed]
- Bartlett, J.E.; Kotrlik, J.W.; Higgins, C.C. Organizational research: Determining appropriate sample size in survey research. Inf. Technol. Learn. Perform. J. 2001, 19, 43–50. [Google Scholar] [CrossRef]
- Instituto Nacional De Estadistica (INE). Available online: http://www.ine.es (accessed on 27 June 2018).
- Agresti, A. Categorical Data Analysis; John Wiley & Sons Inc.: Hoboken, NJ, USA, 2002; Volume 45, ISBN 0471360937. [Google Scholar]
- Development Core Team R. R: A Language and Environment for Statistical Computing; 2011; Volume 1, ISBN 3900051070. Available online: http://softlibre.unizar.es/manuales/aplicaciones/r/fullrefman.pdf (accessed on 27 June 2018.).
- Tucker, P. Understanding Recycling Behaviour. Pap. Technol. 2001, 42, 51. [Google Scholar]


| Products | Design Requirements | Labelling | Consumer Preferencees | Circular Aspects Considered | Region | Year When Data Were Collected | Data Collecting Technique | |||||||||||||
|---|---|---|---|---|---|---|---|---|---|---|---|---|---|---|---|---|---|---|---|---|
| Environmental Aspects | Social Aspects | |||||||||||||||||||
| Generic | Food | EEE | Vehicles | Timber and Paper | Textile | Other | Durability | Repairability or Reuse | Recycled Material Content | Low Environmental Impact | Fair Working Conditions | Origin of Production | Social or Ethical General Aspects | |||||||
| WBCSD, 2008 [1] | x | x | x | x | Worldwide | 2008 | Review | |||||||||||||
| WBCSD & WRI, 2008 [45] | x | x | x | x | x | x | x | x | Worldwide | 2008 | Review | |||||||||
| OECD 2008 [3] | x | x | x | x | x | OECD Countries | 2008 | Survey, literature review | ||||||||||||
| Nordic Consumer Ombudsmen, 2009 [46] | x | x | x | x | Denmark, Finland, Norway and Sweden | 2009 | Review | |||||||||||||
| Maurer, 2015 [9] | x | x | x | x | x | Europe | 2015 | Review | ||||||||||||
| Vehmas et al., 2018 [47] | x | x | x | x | x | x | Finland | n.s. | Surveys | |||||||||||
| Connell, K.Y.H. (2011) [48] | x | x | x | x | x | x | x | USA | n.s. | Semi-structured interviews | ||||||||||
| De Pelsmacker, P. 2007 [15] | x | x | x | x | x | Belgic | 2003 | Questionnaire | ||||||||||||
| Sarti, S., 2018 [49] | x | x | x | x | x | Italy | 2014–2016 | Cluster analysis (consumer monitor) | ||||||||||||
| Panico, T., 2017 [50] | x | x | x | x | x | Italy | n.s. | Survey | ||||||||||||
| Cerri, J., 2018 [38] | x | x | x | x | Italy | 2012 | Survey | |||||||||||||
| European Commission, 2013 [16] Eurobarometer 367 [51] | x | x | x | x | x | Europe | 2012 | Survey | ||||||||||||
| European Economic and Social Committee, 2016 [17] | x | . | . | . | x | x | France, Spain, Czech Republic and Benelux | 2016 | Questionnaire | |||||||||||
| Dünnhoff, E., 2014 [18] | x | x | x | Germany | 2014 | Survey | ||||||||||||||
| Sama, C., 2018 [44] | x | x | x | x | x | Spain | 2016–2017 | Survey | ||||||||||||
| Park, K.C., 2018 [26] | x | x | x | x | x | x | USA | n.s. | Survey | |||||||||||
| Birch, D., 2018 [52] | x | x | x | x | Australia | n.s. | Survey | |||||||||||||
| Grunert, K.G., 2014 [20] | x | x | x | x | x | x | x | UK, France, Germany, Spain, Sweden & Poland | 2012 | Survey | ||||||||||
| Van Loo, E.J., 2015 [53] | x | x | x | x | x | x | USA | 2013 | Eye-tracking | |||||||||||
| Grebitus, C., 2016 [54] | x | x | x | x | x | Canada & Germany | 2013–2015 | Questionnaire-Discrete choice | ||||||||||||
| Schumacher, I. 2010 [21] | x | x | x | Europe | 2010 | Questionnaire-Cross individual data | ||||||||||||||
| Fabricio, 2017 [55] | x | x | x | x | x | Brasil | 2015 | Survey | ||||||||||||
| D’Souza, C., 2007 [42] | x | x | x | Australia | n.s. | Questionnaires | ||||||||||||||
| Pedrini, M., 2014 [39] | x | x | x | x | Italy | 2009 | Questionnaires | |||||||||||||
| De Carvalho, 2015 [56] | x | x | x | x | x | x | Portugal | n.s. | Questionnaires | |||||||||||
| DEFRA and DTI, 2006 [57] | x | x | x | UK | 2006 | Consumer Forum | ||||||||||||||
| Directive 2009/125/EC [58] | x | x | x | x | x | x | Europe | 2009 | Normative | |||||||||||
| European Commission 2014 [59] Eurobarometer 388 [60] | x | x | x | x | x | x | Europe | 2013 | Questionnaires-survey | |||||||||||
| Grankvist, G., 2007 [61] | x | x | x | x | Sweden | n.s. | Questionnaires-panel study | |||||||||||||
| Koszewska, M., 2011 [62] | x | x | x | x | x | Poland | 2010 | Survey-interviews | ||||||||||||
| Noblet, C. L., 2006 [63] | x | x | x | x | USA | 2004–2005 | Survey | |||||||||||||
| Pickett-Baker, J., 2008 [64] | x | x | x | x | London | n.s. | Questionnaire | |||||||||||||
| Rousseau, S., 2015 [27] | x | x | x | x | x | x | Belgium | 2012 | Discrete choice experiment, survey | |||||||||||
| FSANZ, 2008 [65] | x | x | x | Autralia | 2007 | Survey | ||||||||||||||
| Response variables | Score on a scale from 1 (not important at all) to 5 (absolutely essential) about how important it is that a product includes aspects related to: | |
 | - Lasts longer (Durability) - Can be more easily repaired (Repairability) - Its recycled material content - Its low environmental impact - Fair working conditions - Origin/place of production (Origin) | |
| Score on a scale from 1 (not important at all) to 5 (absolutely essential) about how necessary it is that the product labelling includes aspects related to: | ||
 | - Lasts longer (Durability) - Can be more easily repaired (Repairability) - Its recycled material content - Its low environmental impact - Fair working conditions - Origin/place of production (Origin) | |
| Questions | Answers | |
| Socio-economic variables | Gender | 1: Female 2: Male |
| Age | 1: 18–34 2: 35–49 3: 50–64 4: ≥65 | |
| Household size | (no. of inhabitants in the household) | |
| Level of education | 1: Without primary studies 2: Primary studies 3: Secondary studies 4: University studies | |
| Regular monthly household income | 1: Less than €500/month 2: € 500–1000 3: €1000–1500 4: €1500–2000 5: €2000–2500 6: €2500–3000 7: More than €3000 | |
| Age Ranges | ||||||
| 18–34 | 35–49 | 50–64 | >65 | |||
| Population | ||||||
| Males | 15,843 (11.5%) | 22,557 (16.3%) | 15,382 (11.1%) | 12,387 (9.0%) | 66,169 (47.9%) | 138,181 (100%) |
| Females | 16,303 (11.8%) | 22,376 (16.2%) | 16,625 (12.0%) | 16,708 (12.1%) | 72,012 (52.1%) | |
| Sample | ||||||
| Males | 11.5% | 16.3% | 11.3% | 9.0% | 48.0% | 100% |
| Females | 11.8% | 16.3% | 12.0% | 12.0% | 52.0% | |
| Durability | Repairability | Recycled Material Content | |||||||||||||||||||
| Importance of aspect on product labelling | Importance of aspect on product labelling | Importance of aspect on product labelling | |||||||||||||||||||
| Importance of aspect in a product design | 1 | 2 | 3 | 4 | 5 | Importance of aspect in a product design | 1 | 2 | 3 | 4 | 5 | Importance of aspect in a product design | 1 | 2 | 3 | 4 | 5 | ||||
| 1 | 3 | 0 | 0 | 0 | 1 | 1 | 2 | 5 | 4 | 0 | 1 | 1 | 11 | 1 | 1 | 4 | 4 | ||||
| 2 | 2 | 13 | 3 | 0 | 1 | 2 | 13 | 112 | 46 | 14 | 13 | 2 | 1 | 65 | 22 | 20 | 11 | ||||
| 3 | 0 | 5 | 35 | 8 | 6 | 3 | 4 | 33 | 135 | 22 | 17 | 3 | 7 | 18 | 149 | 45 | 25 | ||||
| 4 | 0 | 15 | 20 | 75 | 11 | 4 | 1 | 10 | 26 | 48 | 11 | 4 | 3 | 6 | 34 | 62 | 16 | ||||
| 5 | 0 | 23 | 110 | 67 | 245 | 5 | 0 | 7 | 11 | 8 | 48 | 5 | 0 | 3 | 14 | 15 | 40 | ||||
| X-squared | 602.16 | 396.23 | 453.98 | ||||||||||||||||||
| p-value | 2.2 × 10⁻¹⁶ | 2.2 × 10⁻¹⁶ | 2.2 × 10⁻¹⁶ | ||||||||||||||||||
| Low Environmental Impact | Fair working Conditions | Origin of Production | |||||||||||||||||||
| Importance of aspect on product labelling | Importance of aspect on product labelling | Importance of aspect on product labelling | |||||||||||||||||||
| Importance of aspect in a product design | 1 | 2 | 3 | 4 | 5 | Importance of aspect in a product design | 1 | 2 | 3 | 4 | 5 | Importance of aspect in a product design | 1 | 2 | 3 | 4 | 5 | ||||
| 1 | 2 | 0 | 0 | 2 | 4 | 1 | 0 | 0 | 0 | 0 | 0 | 1 | 20 | 0 | 2 | 0 | 0 | ||||
| 2 | 2 | 47 | 19 | 24 | 9 | 2 | 0 | 4 | 0 | 0 | 2 | 2 | 0 | 46 | 4 | 0 | 0 | ||||
| 3 | 3 | 16 | 179 | 44 | 13 | 3 | 0 | 0 | 18 | 0 | 2 | 3 | 0 | 0 | 282 | 0 | 0 | ||||
| 4 | 4 | 11 | 28 | 58 | 14 | 4 | 2 | 0 | 4 | 190 | 14 | 4 | 0 | 0 | 0 | 212 | 0 | ||||
| 5 | 1 | 1 | 22 | 12 | 52 | 5 | 0 | 0 | 8 | 0 | 472 | 5 | 0 | 0 | 5 | 0 | 94 | ||||
| X-squared | 374.06 | 744.22 | 1234.2 | ||||||||||||||||||
| p-value | 2.2 × 10⁻¹⁶ | 2.2 × 10⁻¹⁶ | 2.2 × 10⁻¹⁶ | ||||||||||||||||||
| Independent Variables | Scale | Proportion of the Total (%) |
|---|---|---|
| Gender | 1: Female | 48.0 |
| 2: Male | 52.0 | |
| Age | 1: 18–34 | 23.3 |
| 2: 35–49 | 32.5 | |
| 3: 50–64 | 23.3 | |
| 4: ≥65 | 21.0 | |
| Level of education | 1: Incomplete primary education | 1.4 |
| 2: Primary education | 13.5 | |
| 3: Secondary education | 47.6 | |
| 4: University Studies | 35.6 | |
| 99: do not answer/do not know | 1.9 | |
| Household size | 1: one person | 6.8 |
| 2: two people | 28.3 | |
| 3: three people | 30.3 | |
| 4: four people | 27.5 | |
| 5: five people | 6.1 | |
| 6: six people | 1.0 | |
| 7: seven people | 0.1 | |
| Level of family income | 1: less than €500/month | 6.8 |
| 2: €500–1000 | 12.8 | |
| 3: €1000–1500 | 19.5 | |
| 4: €1500–2000 | 17.3 | |
| 5: €2000–2500 | 11.0 | |
| 6: €2500–3000 | 11.4 | |
| 7: more than €3000 | 10.0 | |
| 99: Do not know | 11.4 |
| Gender | Age | Level of Education | Household Size | Household Income | ||
|---|---|---|---|---|---|---|
| Durability | 2 3 4 5 | −0.442[1.042] 0.659[0.956] 0.574[0.937] 0.472[0.925] | 0.31131[0.59390] 0.36996[0.56058] 0.66102[0.55116] 0.53578[0.54534] | −0.063[0.214] 0.064[0.197] −0.068[0.194] −0.003[0.190] | −0.084[0.508] −0.296[0.474] −0.061[0.463] −0.148[0.457] | −0.11457[0.24073] −0.03293[0.22515] −0.15743[0.22017] −0.07701[0.21709] |
| Repairability | 2 3 4 5 | −0.232[0.564] −0.328[0.563] −0.509[0.582] −0.175[0.591] | 0.35253[0.27160] 0.16666[0.27101] 0.62702[0.28332] 0.25691[0.28715] | 0.17143[0.13014] 0.15094[0.12983] 0.20453[0.13459] 0.11126[0.13605] | 0.62202[0.29606] 0.61411[0.29532] 0.67410[0.30586] 0.67235[0.30918] | −0.02797[0.14134] −0.04856[0.14111] −0.02818[0.14561] −0.02086[0.14741] |
| Material recycled content | 2 3 4 5 | 0.541[0.455] −0.118[0.438] −0.021[0.456] 0.513[0.482] | −0.151[0.236] 0.164[0.228] −0.166[0.238] −0.576[0.255] | 0.04749[0.10636] 0.07663[0.10315] 0.01402[0.10678] −0.023[0.111] | −0.054[0.237] −0.032[0.229] 0.25327[0.23743] 0.06949[0.24855] | 0.09091[0.11055] 0.07049[0.10661] 0.05074[0.11054] 0.03919[0.11614] |
| Low environmental impact | 2 3 4 5 | 0.58009[0.67482] 0.67001[0.66046] 0.08993[0.67497] 0.09049[0.68330] | −0.086[0.348] 0.241[0.341] −0.205[0.349] −0.458[0.355] | 0.11865[0.15082] 0.07629[0.14792] 005629[0.15053] 0.04338[0.15199] | 0.20821[0.35844] 0.22209[0.35180] 0.38477[0.35792] 0.33240[0.36146] | −0.26210[0.17546] −0.26502[0.17233] −0.21093[0.17528] −0.21603[0.17700] |
| Fair working conditions | 3 4 5 | −0.660[1.364] −0.432[1.252] −0.504[1.242] | 0.02676[0.80478] −0.884[0.733] −0.594[0.729] | 0.38534[0.43935] 0.42901[0.41477] 0.42795[0.41344] | 0.40303[0.75335] 0.27540[0.69538] 0.24771[0.69109] | 0.04045[0.347171] 0.11918[0.31921] 0.09373[0.31710] |
| Origin | 2 3 4 5 | −0.119[0.681] −0.090[0.583] −0.049[0.590] −0.197[0.619] | 0.13977[0.35942] 0.24230[0.31070] 0.20965[0.31405] 0.15549[0.32986] | −0.020[0.152] 0.04780[0.12910] 0.01966[0.13096] 0.02469[0.13715] | 0.06662[0.34587] 0.08049[0.29634] 0.05970[0.30002] 0.01106[0.31525] | −0.14223[0.16347] −0.02972[0.14025] −0.08928[0.14194] 0.02136[0.14928] |
| Gender | Age | Level of Education | Household Size | Household Income | ||
|---|---|---|---|---|---|---|
| Durability | 2 3 4 5 | 0.23983[0.89660] 0.50561[0.86894] 0.58897[0.87138] 0.60675[0.86499] | 0.10409[0.40905] 0.27776[0.39406] 0.22653[0.39569] 0.04562[0.39198] | 0.21662[0.51988] 0.21609[0.51988] 0.21511[0.51988] 0.21600[0.51898] | −0.19842[0.44492] −0.19085[0.43052] −0.05845[0.43147] −0.14634[0.42810] | −0.01599[0.23766] 0.02367[0.2309] 0.02951[0.2314] 0.00689[0.22988] |
| Repairability | 2 3 4 5 | −0.15649[0.47075] −0.33728[0.46292] −0.28644[0.48718] −0.24590[0.49039] | 0.41050[0.24966] 0.29361[0.24579] 0.30134[0.25880] 0.03712[0.26478] | −0.00067[0.00127] −0.00065[0.00123] 0.00025[0.00128] −0.25266[0.18478] | 0.15335[0.23752] 0.13203[0.23345] 0.04187[0.24674] 0.17020[0.24666] | 0.03302[0.11770] 0.08568[0.11585] 0.14865[0.12253] 0.03570[0.12277] |
| Material recycled content | 2 3 4 5 | 1.50340[0.45961] 0.89346[0.43044] 1.02471[0.44227] 0.96939[0.45758] | −0.13006[0.19429] 0.06730[0.17585] −0.15179[0.18398] −0.30702[0.19530] | 0.36097[0.23594] 0.36146[0.23594] 0.36206[0.23595] 0.36143[0.23595] | 0.30423[0.23299] 0.19907[0.21927] 0.32429[0.22478] 0.36475[0.23192] | −0.06190[0.12165] −0.11212[0.11491] −0.08269[0.11767] −0.07842[0.12111] |
| Low environmental impact | 2 3 4 5 | 0.59060[0.57205] 0.59979[0.54433] 0.20878[0.55628] 0.36636[0.56922] | −0.14871[0.29318] 0.08648[0.27802] −0.15740[0.28509] −0.45147[0.29238] | 0.00719[0.05036] 0.00587[0.05036] 0.00691[0.05036] 0.00657[0.05036] | 0.11428[0.29639] 0.11843[0.28246] 0.26316[0.28787] 0.10232[0.29391] | 0.03049[0.14274] −0.06577[0.13561] 0.11454[0.13866] −0.05240[0.14161] |
| Fair working conditions | 2 3 4 5 | 21.83313[1.37761] −26.62403[1.53908] −26.62644[1.49994] −26.83099[1.49526] | −0.44589[1.01849] 0.73759[0.96700] 0.25911[0.93001] 0.60800[0.92554] | −4.92119[2.18041] −0.61355[0.39042] −0.20867[0.19245] 0.00259[0.04185] | −0.73443[1.68245] 0.00718[0.91411] 0.36800[0.87806] 0.33053[0.87476] | 1.39259[0.98166] 0.04282[0.52868] 0.12630[0.51214] 0.09525[0.51052] |
| Origin | 2 3 4 5 | 0.01259[0.76867] 0.09334[0.66308] 0.09676[0.67134] 0.05360[0.70650] | 0.14250[0.43926] 0.29915[0.37646] 0.29393[0.38025] 0.13501[0.40208] | −0.00248[0.63835] 0.58441[0.53467] 0.58932[0.53461] 0.39117[0.58516] | 0.34450[0.39293] 0.18248[0.34116] 0.17215[0.34532] 0.23085[0.36253] | −0.07143[0.19719] 0.00995[0.17059] −0.04883[0.17255] 0.02897[0.18160] |
© 2018 by the authors. Licensee MDPI, Basel, Switzerland. This article is an open access article distributed under the terms and conditions of the Creative Commons Attribution (CC BY) license (http://creativecommons.org/licenses/by/4.0/).
Share and Cite
Bovea, M.D.; Ibáñez-Forés, V.; Pérez-Belis, V.; Juan, P.; Braulio-Gonzalo, M.; Díaz-Ávalos, C. Incorporation of Circular Aspects into Product Design and Labelling: Consumer Preferences. Sustainability 2018, 10, 2311. https://doi.org/10.3390/su10072311
Bovea MD, Ibáñez-Forés V, Pérez-Belis V, Juan P, Braulio-Gonzalo M, Díaz-Ávalos C. Incorporation of Circular Aspects into Product Design and Labelling: Consumer Preferences. Sustainability. 2018; 10(7):2311. https://doi.org/10.3390/su10072311
Chicago/Turabian StyleBovea, María D., Valeria Ibáñez-Forés, Victoria Pérez-Belis, Pablo Juan, Marta Braulio-Gonzalo, and Carlos Díaz-Ávalos. 2018. "Incorporation of Circular Aspects into Product Design and Labelling: Consumer Preferences" Sustainability 10, no. 7: 2311. https://doi.org/10.3390/su10072311