From Zero Emission Buildings (ZEB) to Zero Emission Neighbourhoods (ZEN): A Mapping Review of Algorithm-Based LCA


SINTEF Building and Infrastructure, 7465 Trondheim, Norway
*
Author to whom correspondence should be addressed.
Sustainability 2018, 10(7), 2405; https://doi.org/10.3390/su10072405
Submission received: 31 May 2018
/
Revised: 3 July 2018
/
Accepted: 7 July 2018
/
Published: 10 July 2018
(This article belongs to the Collection Sustainable Built Environment)
Abstract
:The building industry is responsible for approximately 40% of energy consumption and 36% of greenhouse gas emissions in the European Union (EU). The most efficient way of reducing a building’s environmental impact is addressing it in the design stage. Here, design freedom is the greatest, but uncertainty is high and there is a nearly limitless number of design options. Based on experiences with zero emission buildings (ZEB) and zero emission neighbourhoods (ZEN), a mapping review has been conducted to analyse how parametric life cycle assessment (LCA) and algorithms have been used to address neighbourhoods, buildings, and construction materials. Results have identified a general gap of knowledge regarding the use of parametric LCA models for decision-support purposes, demonstrated by the substantial focus on analytical methods compared to procedural methods. Implications for the evolution from ZEB to ZEN are twofold: (i) an integrated approach with multiple tools and methods is required, and (ii) further development of algorithms in the tool are needed to address complexity, sensitivity, and uncertainty. This study is expected to foster the development of algorithmic approaches to improve the ZEB tool as a decision-support tool. Further research should address the key questions of when and how.
1. Introduction
1.1. Background: Reducing the Carbon Footprint of Buildings and Neighbourhoods
The building industry is responsible for approximately 40% of energy consumption and 36% of greenhouse gas emissions in the European Union (EU) [1]. Energy consumption has typically been addressed through stricter building code requirements for its consumption during the use phase. An example is the EU directive on the energy performance of buildings, which requires near zero energy buildings (nZEB) by 2020 [2]. There are no similar legal requirements when it comes to greenhouse gas emissions from buildings, but voluntary efforts have been directed at both the building materials scale and buildings scale by both private and public organisations. An example of this is the zero emission buildings (ZEB) project [3,4], which led to the development of a parametric ZEB tool [4,5]. Recently, the focus has increased on the neighbourhood level, for example, as described by Lotteau et al. [6], and has addressed projects such as ZEN [7], BREEAM Communities [8], PI-SEC [9], and so forth.
The most efficient way of reducing a building’s environmental impact is to address it in the design stage, where one has the greatest design freedom. Another incentive to get it right from the start is the cost of changes. A large change late in the process will be more expensive to implement than a similar change during the design stage. However, calculating the environmental impact is more difficult earlier in the process, due to uncertainty and a nearly limitless number of design options, and also due to a lack of tools for early design stages [10]. Thus, on one hand, there is a high potential to reduce costs and environmental impact in the design stage. On the other hand, it is evident that uncertainty and the large volume of design options represent a significant challenge.
The aforementioned challenges relate to building scale design. Expanding from a building-scale to a neighbourhood-scale perspective adds further to the complexity and interconnectivity. A neighbourhood can be seen as a system of systems, where subsystems such as buildings and infrastructure can have very different functions, system boundaries, time perspectives, and so forth. Consequently, a more overarching decision-making process during the design stage is required for materials/components, buildings, and neighbourhoods, to be able to explore design options, understand the consequences at different system levels, and for reducing the carbon footprint.
1.2. Definitions: Zero Emission Building (ZEB) and Zero Emission Neighbourhood (ZEN)
A zero emission building (ZEB) is an energy-efficient building with on-site renewable energy generation that can export enough energy to compensate for the carbon footprint of the building’s own energy and material consumption in a life cycle perspective. The ZEB definition from the research centre FME ZEB [4] defines a number of ambition levels for a ZEB. Examples of ambition levels are ZEB-O and ZEB-COMPLETE. For the ZEB-O ambition, the exported energy must be sufficient to compensate for the carbon footprint of all operational energy use. For the ZEB-COMPLETE, the exported energy must compensate the carbon footprint of the whole building in a life cycle perspective [11]. It should be noted that the term ZEB can also refer to a zero energy building. This is not the same as a zero emission building. Although multiple definitions exist, a zero energy building (ZEB) or a nearly zero energy building (nZEB) typically focuses on the energy production and consumption during the use phase only [3]. For an overview of definitions, please see Andresen [3].
Broadening the scope from the zero emission building (ZEB), the goal of the zero emission neighbourhood (ZEN) is to bring the zero emission concept to a neighbourhood scale. Defining the ZEN is part of the ongoing research project FME ZEN [7]. ZEN expands the scope to include buildings, energy systems, mobility, and infrastructure. Here, the exported energy must compensate for the carbon footprint of the entire neighbourhood, over a specified study period. The ZEN definition includes indicators on carbon footprint, energy, power/load, mobility, economy, spatial qualities, and innovation. Neighbourhoods are context-dependent, and stakeholder consultations are therefore needed to capture the relevant social aspects for a specific neighbourhood.
ZEB and ZEN aim to reduce the carbon footprint of buildings and neighbourhoods. This is based on using life cycle assessment (LCA), which is a common approach to identifying and reducing the environmental footprint of a product or service. Neither LCA nor carbon footprints are systematically used in the design of constructions today. In some cases when LCA is implemented in the design process, this analysis is undertaken too late, when most of the preliminary design decisions have already been made. This means that there is a risk of selecting either suboptimal designs or suboptimal materials and processes. The present paper proposes to address this risk by considering an LCA-based parametric approach that serves as a decision-support system from early design to erected building, making it possible to understand the effect of design choices on multiple system levels.
1.3. Aim of the Study
The aim of this paper is to investigate how the use of parametric LCA models can contribute to decision making for materials/components, buildings, and neighbourhoods. The motivation for investigating parametric LCA models for ZEB and ZEN is the need for decision support that extends the scope of current approaches [12]. This is in line with Lotteau et al.’s [6] identification of a “clear research need for the development of approaches that would enable the contextualization of the assessment of energy consumption in buildings while remaining consistent with data availability in a project’s early design phase”.
The starting point is the real-life experiences with the zero emissions buildings tool (ZEB tool), developed in the FME ZEB project [4] to calculate the carbon footprint of zero emission buildings (ZEB) and tested on several pilot buildings [13]. It is based on type III environmental product declarations (EPD) developed in accordance with the standards ISO 14025 [14], ISO 21930 [15], and EN 15804 [16].
Section 2 provides an overview of the ZEB tool and its adaptation to specific needs. In Section 3, a mapping review is conducted to provide an overview of how parametric LCA and algorithms have been used to address neighbourhoods, buildings, and construction materials. Section 4 discusses how parametric LCA can be evolved towards parametric design, and Section 5 draws the conclusions.
2. The ZEB Tool and Its Potential for Adapting to Changing Needs
2.1. Introduction to the ZEB Tool
The Research Centre on Zero Emission Buildings (ZEB Centre) was a Norwegian research project from 2009 to 2017 [5], with a key purpose of reducing the carbon footprint from buildings in a life cycle perspective. One result from this project was a definition of a zero emission building [17], including system boundary definitions and differentiated ambition levels for implementation in building projects [18]. Another result was a tool for calculating and documenting greenhouse gas emissions from buildings, referred to as the ZEB tool. The ZEB tool was continually developed through the ZEB Centre’s time period, and has been applied to a number of pilot buildings [11].
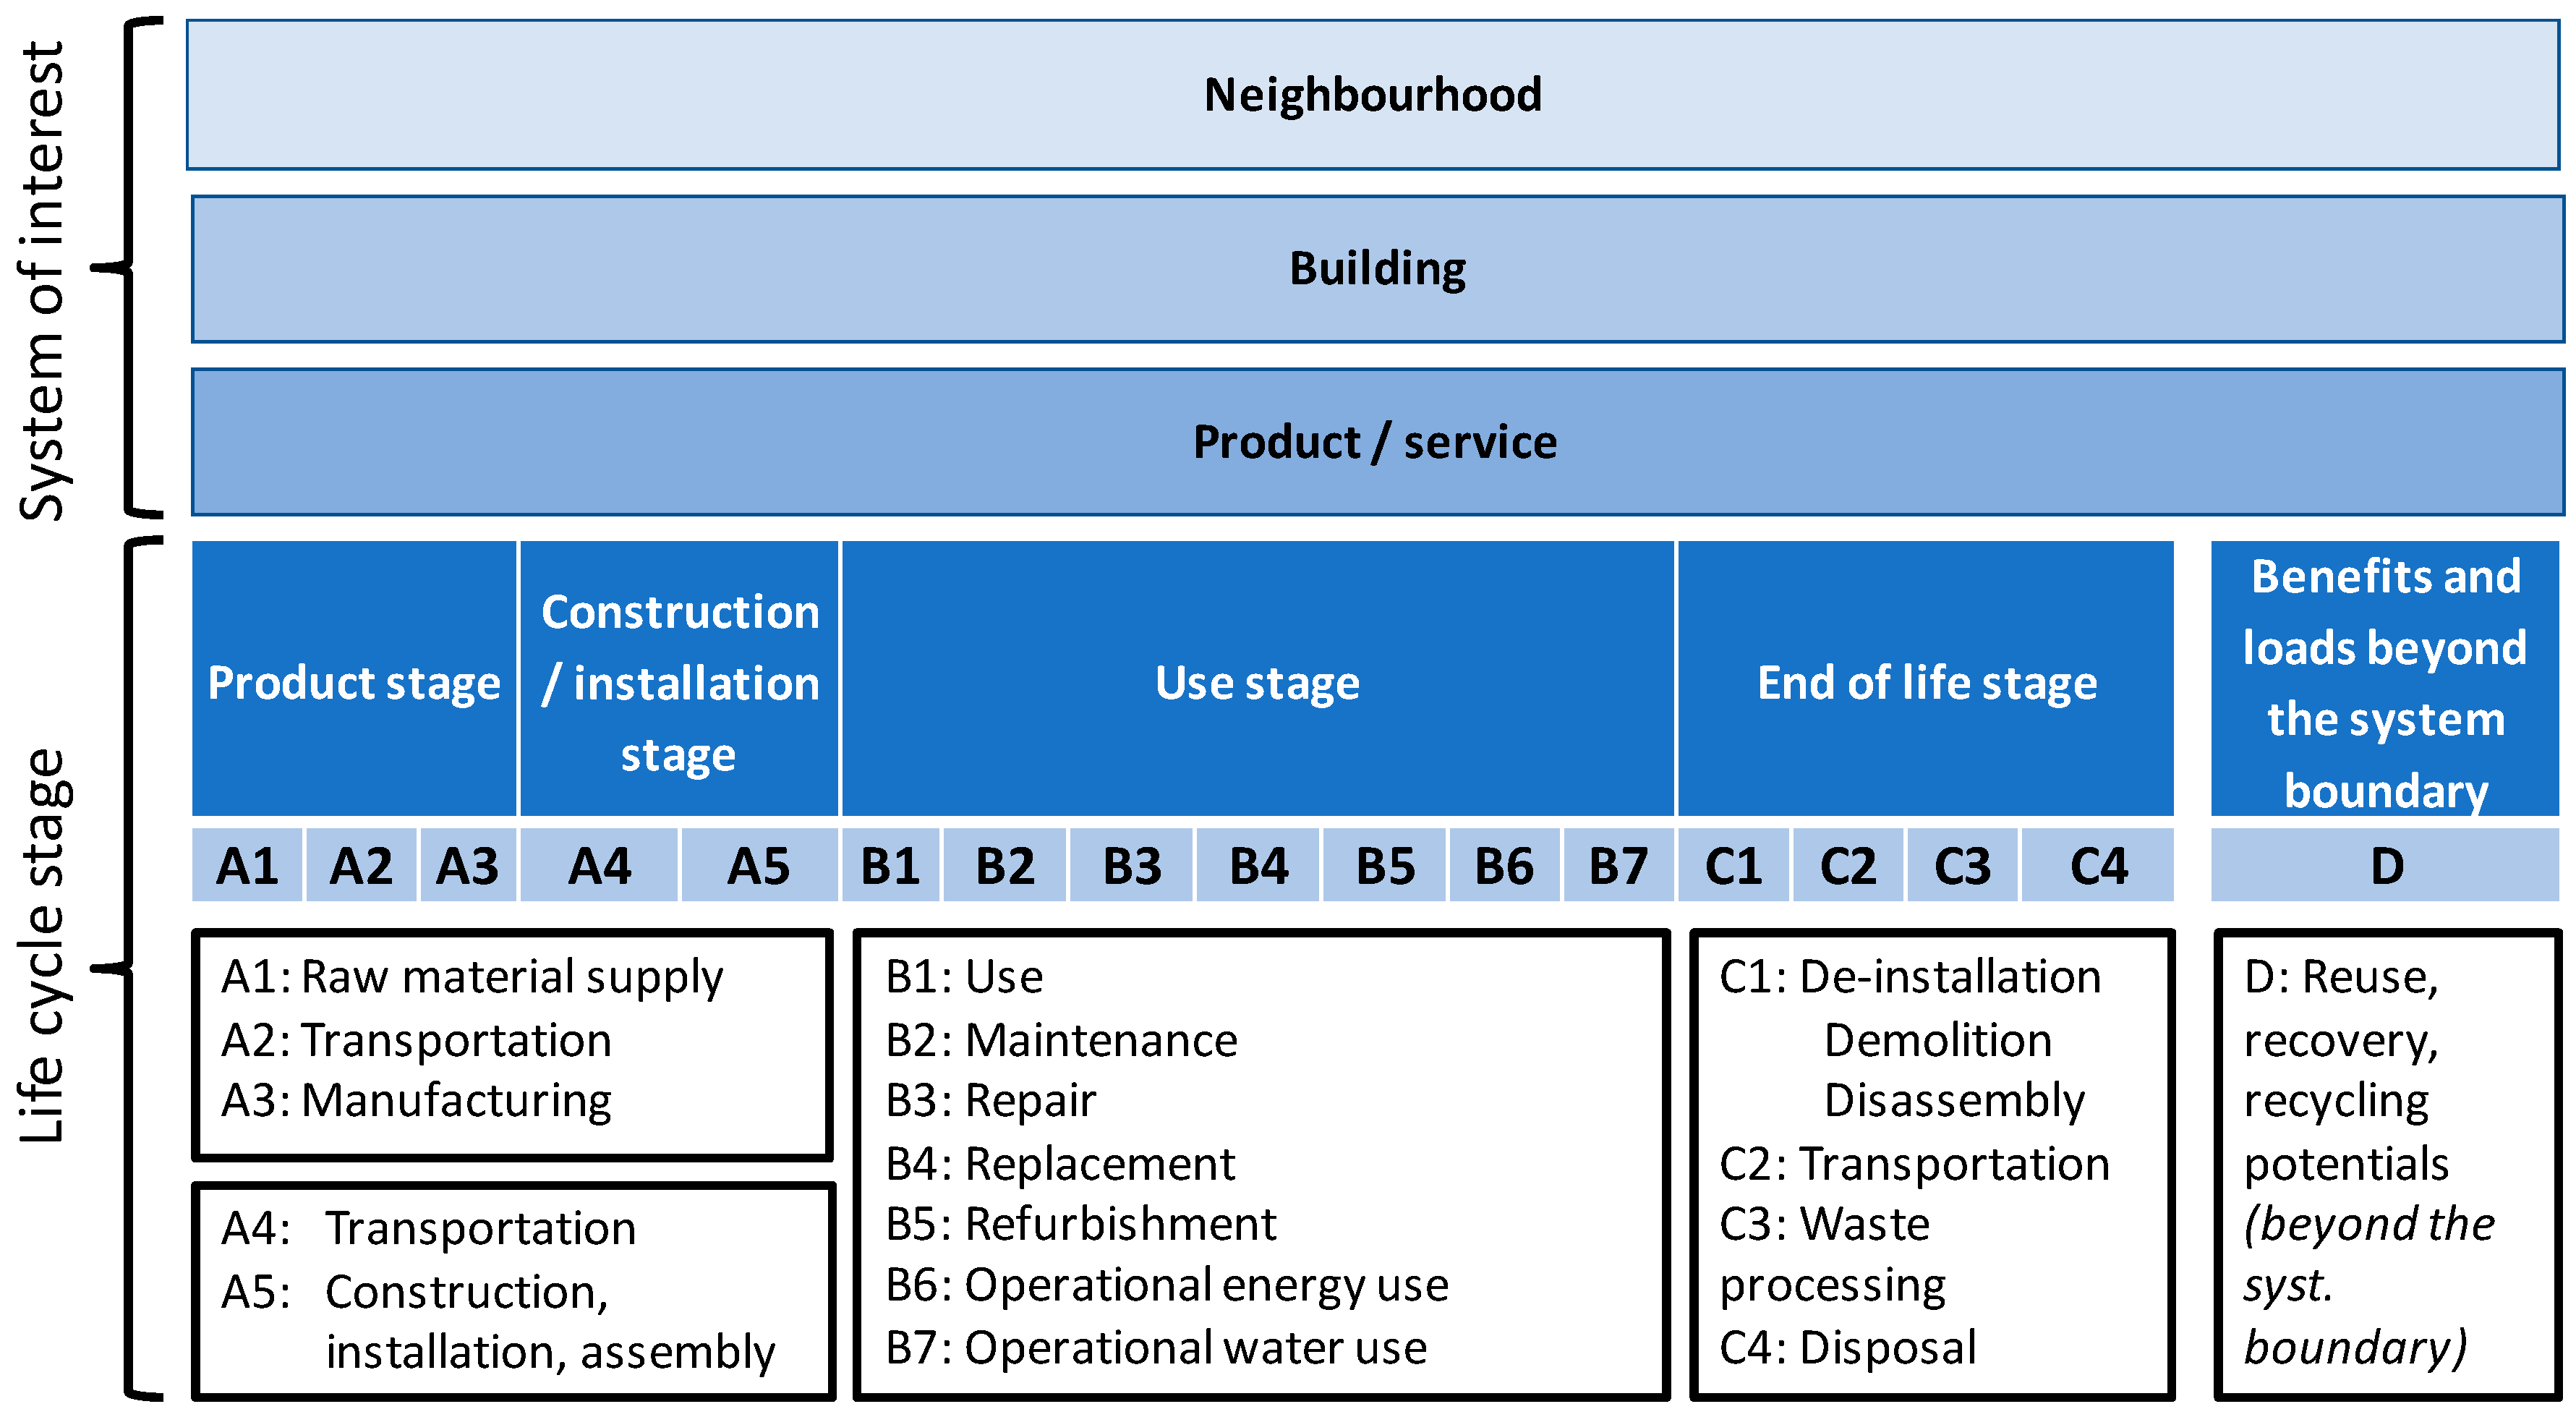
The ZEB tool calculates the carbon footprint of a building in a life cycle perspective. Depending on the scope of the project, this can include materials, transportation, building processes, and energy use, corresponding to life cycle modules A1–C4 as shown in Figure 1. The tool does not address occupant behaviour beyond energy consumption (i.e., consumption of goods and services, mobility, etc. are not included). The tool itself is limited to the carbon footprint and can be used anywhere in the building process from early design to as-built. One reason for limiting the scope to a single impact category was feasibility. The tool was applied in several pilot projects and was intended to be used also by people not familiar with LCA. This demonstrates how the carbon footprint “offers the potential to get life cycle approaches into organisations and decision making contexts which pure LCA did not reach yet” [19].
Figure 1 shows life cycle stages related to systems of interest. The life cycle stages of buildings and construction materials are based on standards from the European Committee for Standardization (CEN) and the International Organization for Standardization (ISO) [15,16,20]. They can be divided into the product stage, the construction/installation stage, the use stage, and the end of life stage. In addition, it is possible to calculate benefits and loads beyond the system boundary, for example, the benefits of exported heat from waste incineration. The calculation method for modules A1–C4 is attributional LCA, whereas module D is based on consequential LCA [21]. This means that values from modules A1–C4 and module D must be considered as two different types of indicators, even though both are quantified as kg CO2-equivalents. Aggregating them will require a value-based and normative judgment on the relative importance of each (a weighting approach), as outlined in the ISO standards on LCA [22,23]. It should furthermore be noted that all comparisons must be made in a building context. Figure 1 is applicable to buildings and construction materials, and adaptations/modifications should be considered if applied to the neighbourhood level.
The input parameters into the ZEB tool are material consumption per building component (including losses at the building site in module A5 and scenarios for the use stage), transportation distances, and energy consumption in the use stage. The output is the carbon footprint of the building, which can be presented in different forms (e.g., per life cycle module, per building component, etc.). The data in the ZEB tool is based on environmental product declarations (EPD) from EPD-Norway, Environdec, and IBU, which are three EPD programmes with a mutual recognition agreement that shall ensure harmonisation of the content of the EPD. Where additional data are needed, these can be based on results from an LCA, provided it adheres to the requirements of the ISO and CEN standards mentioned above.
2.2. Adapting of the ZEB Tool to Specific Needs
The core of the ZEB tool is a database with carbon footprints for products, materials, and processes that are gathered from environmental product declarations, supplemented with LCA calculations with background data from the ecoinvent database [24] for products that lack EPD. The tool has been developed in Excel and can therefore quite easily be modified and adapted without knowledge of programming. The input parameters in this tool are the amounts and types of the materials and energy that are used in the construction, where the units are kg/m3/m2/piece for the materials that are used and kWh for energy. The tools is, by default, structured according to the Norwegian table of building elements [25], where the materials and energy for each building element are entered in separate sheets. If needed, the default structure is easily modified by the user. The ZEB tool is not directly connected to other applications, so these must be created manually. An example of this is using bill of materials (BoM) from a computer-aided design (CAD) tool as the basis for the input parameters. Below is an overview of four adaptations that have been made to the ZEB tool in order to address specific challenges. Two of the examples are of buildings (office building and apartment building) and two are of building components (façade and floor system). An overview of each is provided in Table 1, with a reference to further information where available. The purpose is to demonstrate both the flexibility of the tool and the limitations.
Two key advancements of the ZEB tool were identified in these four examples, as the following:
- 1.
- connecting the ZEB tool to other tools (e.g., BIM, building performance simulation), and
- 2.
- transferring information between design phases.
Such developments would enable the ZEB tool to follow a project from concept to finished building; therefore, facilitating the following:
- 3.
- verifying that the early design is on track to reach the desired ZEB ambition level,
- 4.
- following up and optimising the carbon footprint in the detailed design and in the building process,
- 5.
- enabling a clear association of the early-stage design parameters and their consequences in terms of carbon footprint, and
- 6.
- documenting that the as-built office building has actually reached the ZEB ambition.
However, challenges arise due to the complexity of interconnecting all the previous developments. Remodelling due to changes can be a time-demanding task, sometimes requiring the remodelling of the entire project (i.e., starting a new blank project). Consequently, effective possibilities are sought to (i) expand the system boundary to the neighbourhood level and (ii) address the complexity of the early design stage.
2.3. Expanding of the ZEB Tool to a Neighbourhood Level (ZEN)
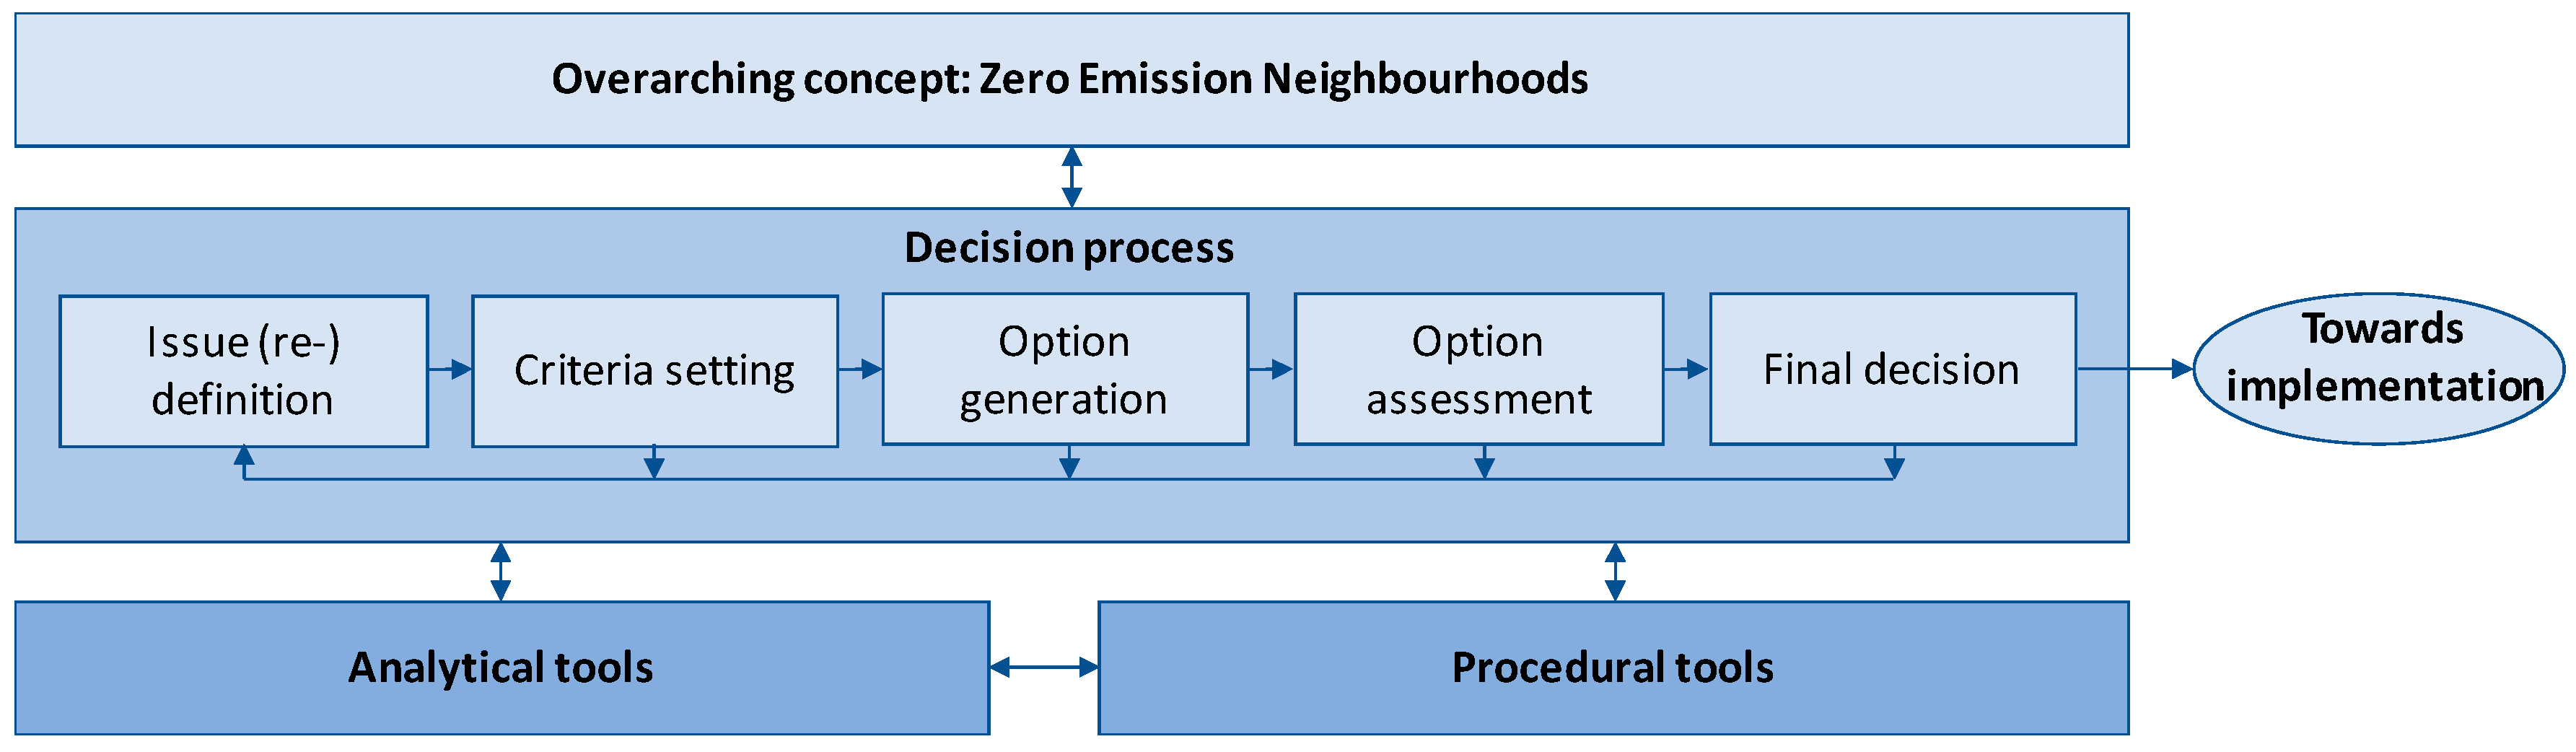
Developing a ZEB or ZEN can be understood as part of an environmental decision-making process. Wrisberg [29] proposed a framework for environmental decision-making. This is based on seeing the decision process in the context of an overarching environmental or sustainability concept, and the use of analytical and procedural tools to aid the decision-making process. The first step in the decision-making process is to define or redefine the issue. Environmental decision-making is often an iterative process, with the need to go back to the issue of definition when new information requires this. Figure 2 shows a modified version of Wrisberg’s framework for environmental decision-making [29], with zero emission neighbourhoods as the overarching concept.
As shown in the figure, the overarching concept is the zero emission neighbourhood. In the current ZEN definition in the FME ZEN project, this includes buildings, energy systems, mobility, and infrastructure [7]. To support decision-making regarding such neighbourhoods, it is necessary to use a combination of analytical tools and procedural tools. The analytical tools provide insight and understanding to the design process, whereas the procedural tools provide a guide for using the information from the analytical tools towards implementing the decisions needed to develop a zero emission neighbourhood.
A key analytical tool in this context is life cycle assessment. As the overarching concept is a zero emission neighbourhood, it is necessary to calculate the environmental impact in a life cycle perspective to be able to evaluate if the goal is reached. However, performing a life cycle assessment in the early design stage is not the same as performing an LCA later in the design process. There is a large degree of freedom and significant design changes can be made in the early design process, leaving little time to perform the LCA and requiring multiple changes to the LCA model. The results of the LCA can be used as indicators that provide information to the decision process. A good indicator must meet both scientific requirements (e.g., related to validity, sensitivity to change, robust against manipulation, verifiable, etc.) and pragmatic requirements (easily understood, relevant, timely, manageable, etc.) [30,31]. In the early design stage, the pragmatic requirements will be relatively more important, but they must still be consistent with later results.
2.4. Enabling ZEB Tool Advancement: Algorithms in LCA for Buildings and Construction Products
It is a highly complex task to assess the environmental performance of buildings and construction products. It becomes drastically more complex when the task is to use this information to make improvements. There is a need for common guidelines for calculating the impacts of each element (e.g., construction product) and for aggregating information from constructions and services to the building level (e.g., do you need to include 1.5 or 2 windows if you have a window with a 40-year reference service life in a building with a 60-year reference study period?). This part has been addressed through standardisation, both by ISO and CEN (e.g., ISO21930, EN EN15804). This paper does not address this specific challenge, but builds on these standards. The second challenge is to use this information for improving the design of the building.
All adaptions of the ZEB tool discussed in the previous sections were about decisions at either a building level or material/component level. Building level challenges were therefore either defined out of the scope (e.g., TallFacades, where the function of the wall is identical in all examples) or via parameters that limited the selection before using the tool (e.g., WoodSols, where the fire, sound, and span length limited the number of solutions). Modelling consequences across system levels and allowing a more flexible use of parameters (e.g., not just a limited set of predetermined parameters) will add complexity to the model. The main challenge is the added complexity when expanding from ZEB to ZEN, especially in the early design stage, where there is a large amount of design options available. Going through all the options one by one is not possible, and parameterization becomes necessary.
However, parameterization on its own can rapidly lead to an overwhelming and time-consuming task of exploring, analysing, and evaluating all available options under the form of all possible combinations, in order to understand the behaviour at different system levels. Algorithms can be used to overcome these challenges and will help in identifying either a specific solution or a limited set of preferable options. Consequently, the question raises into: “How have algorithms and life cycle assessment been used in the building and construction industry?”. To address this question, a mapping review has been carried out.
3. Algorithms and Life Cycle Assessment in the Building and Construction Industry: A Mapping Review
3.1. Systematic Mapping: Methodology
The literature review presented in this study is built upon an established research methodology [32,33] that ensures a comprehensive search process and systematic review of the relevant literature. The approach is based on guidelines for conducting systematic mapping studies in software engineering [33], whose principles are applicable to other fields of study. Systematic reviews provide the tool for a transparent and reproducible research synthesis, thus offering greater clarity, internal validity, and audibility [32,33].
Mapping review has been selected among different types of reviews to map out and categorise the existing literature, in order to identify gaps in the literature and subsequently to identify where there are research needs. The first step in the review process is to define the scope of the research, which allows focusing of the research question [32]. The present study opts to map out the use of algorithms and life cycle assessment in the building and construction industry. The PICOC framework [34], as shown in Table 2, is applied to define the key concepts of the research. The research question develops into: “How (O) have algorithms (I) and life cycle assessment (P) been used (C—comparison) in the building and construction industry (C—context)?”.
The following search strategy was used to:
- Perform an initial search on general terms.
- Perform a database search specific to algorithms application in life cycle assessment.
- Use key results from initial search to find further literature (snowballing).
Use the commercially available software NVivo [35] to classify literature and identify correlations between topics.
Table 3 shows an overview of initial search terms on Google Scholar, Scopus, and Web of Science. These were used to provide an idea of the volume of literature related to buildings and LCA. The results are sensitive to the choice of search term, typically leading either to a large amount of hits or a small amount of hits.
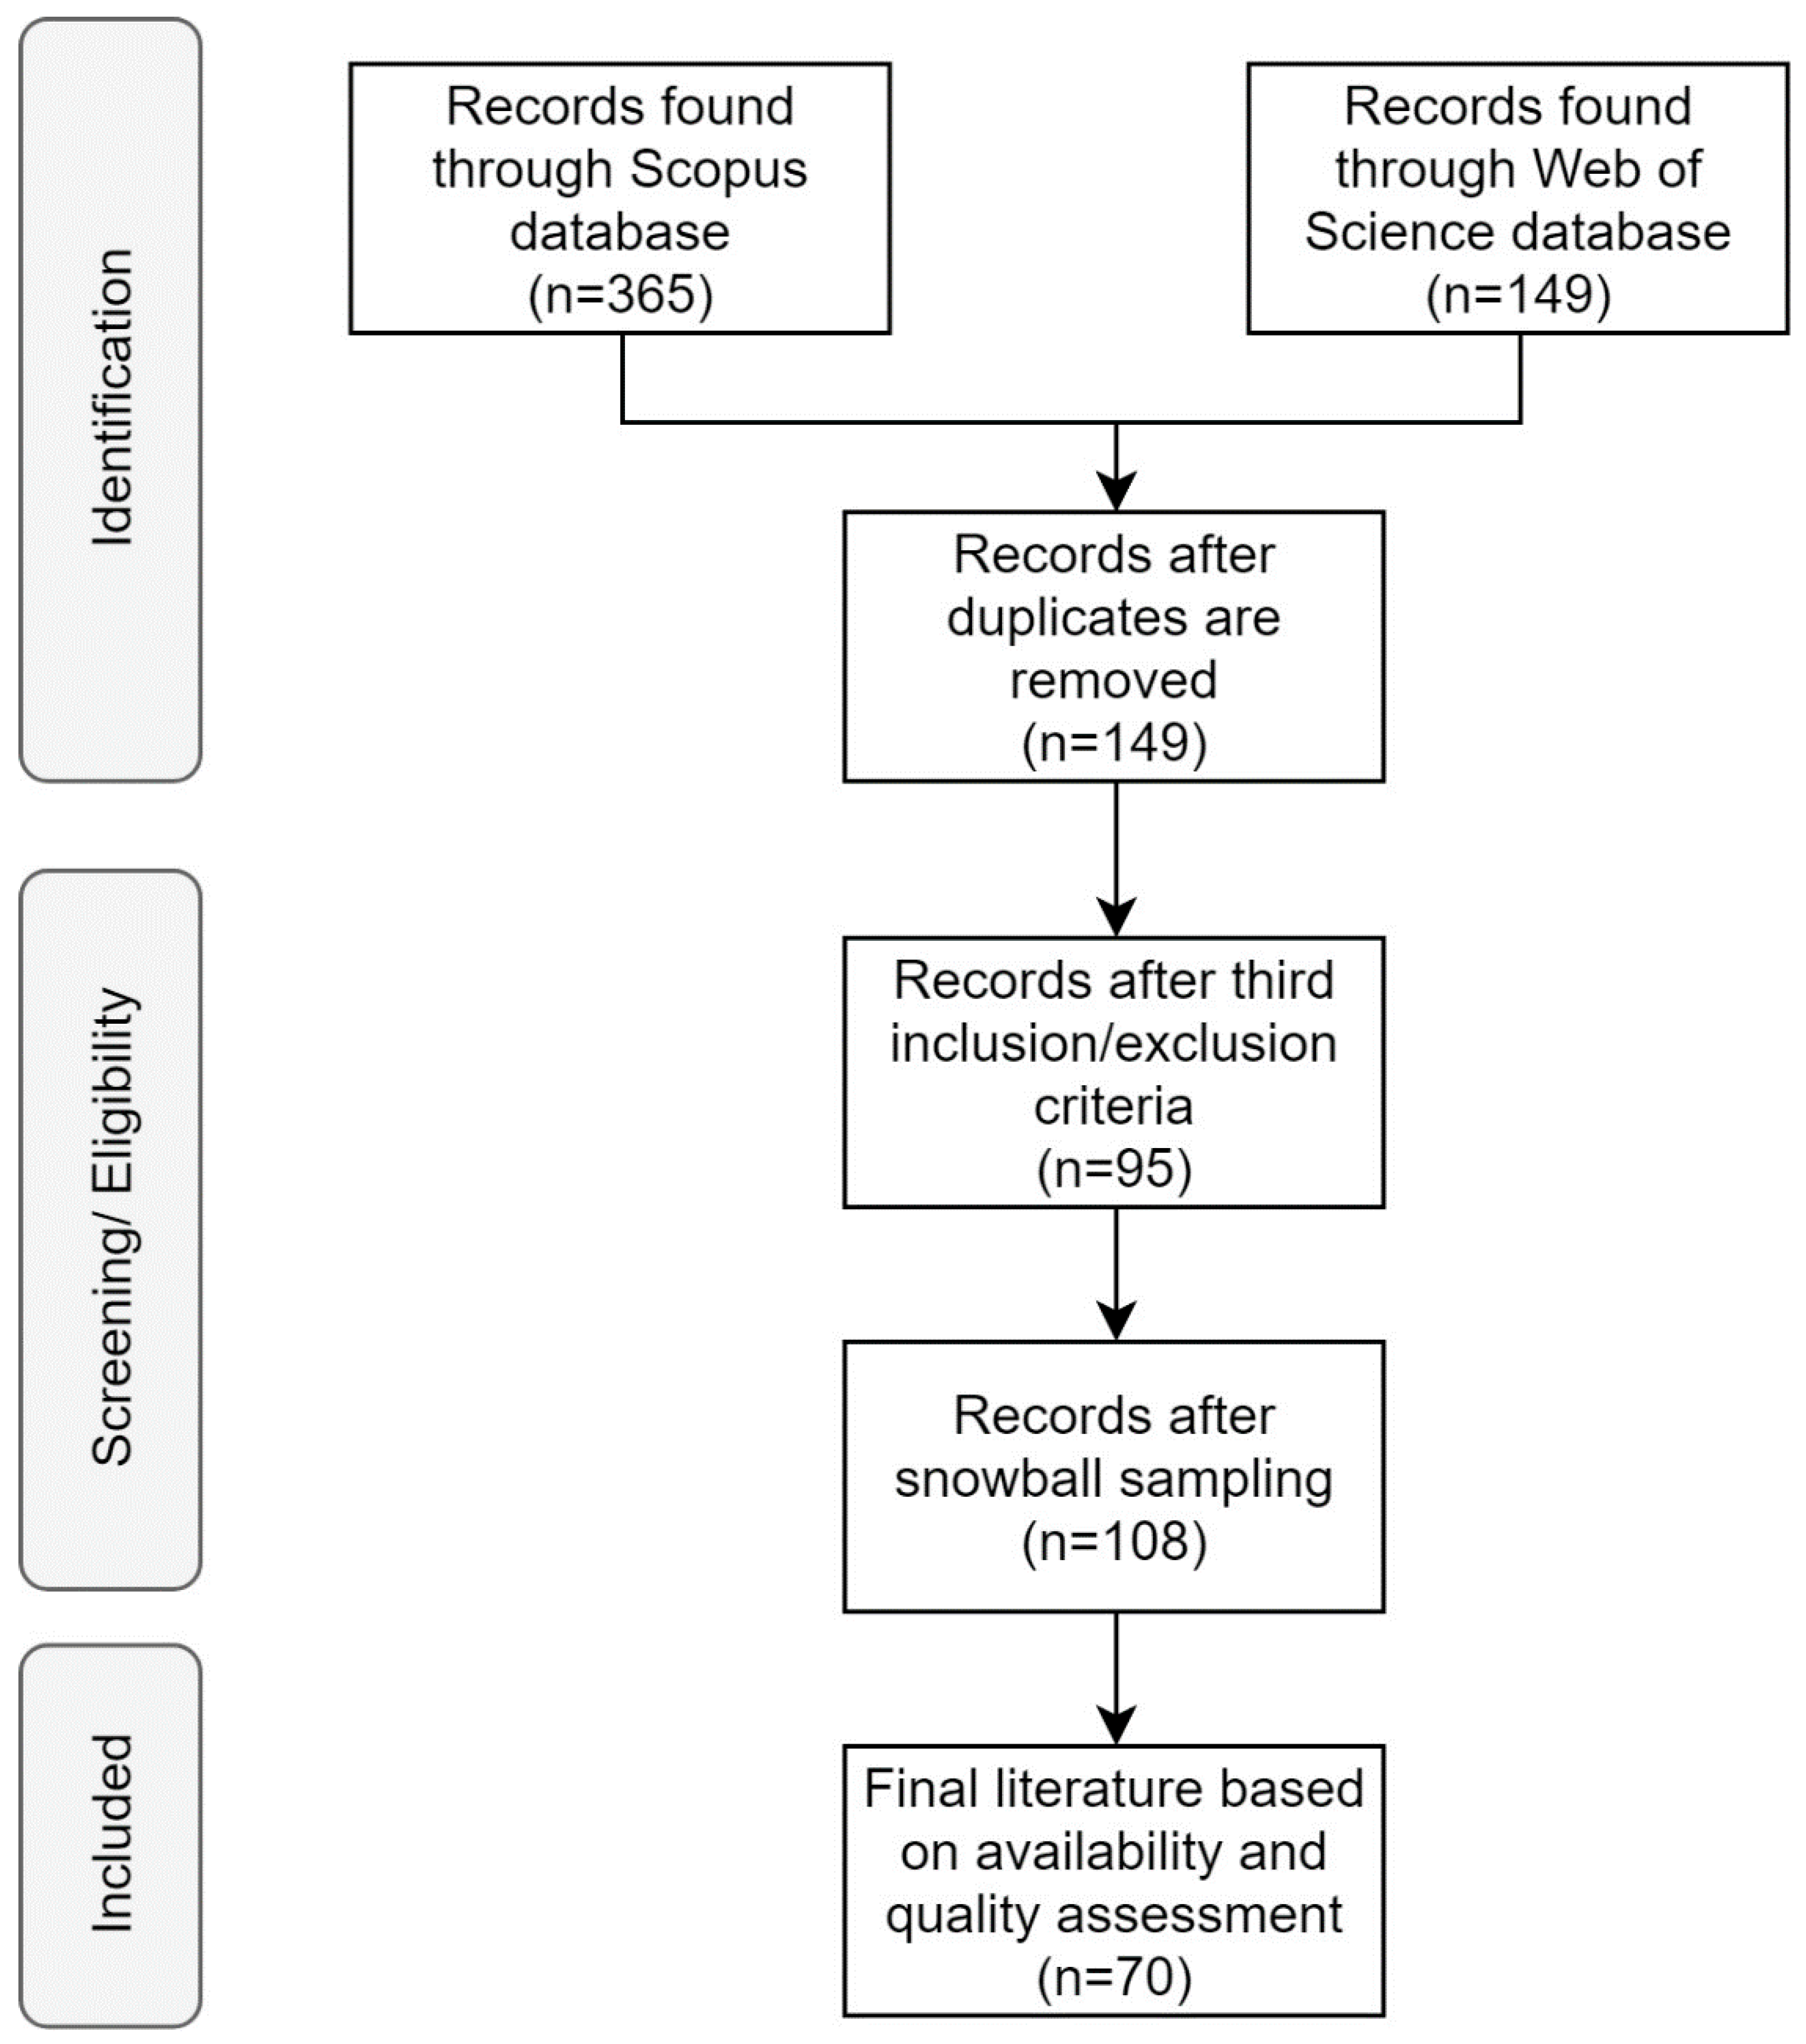
The next step was to identify literature related to LCA and the use of algorithms. Two electronic databases of peer-reviewed literature were used. Scopus and Web of Science are relevant sources of information in this research area [36,37]. The keywords, operators, and nesting combinations are presented in Table 4. The keywords were applied to the title/abstract/keywords level. The last search was performed in March 2018. Based on the highest ranked results in the search databases presented in Table 3, further literature was identified through snowballing. Table 4 shows the elements of the PICOC framework, and Figure 3 shows the screening process of the literature based on the PRISMA (preferred reporting items for systematic reviews and meta-analyses) statement [38]. Table 5 shows the inclusion and exclusion criteria used in the mapping. The final number of included articles is 70.
3.2. Systematic Mapping: Results
3.2.1. Classification and Analysis
To answer the question on how algorithms and life cycle assessment been used in the building and construction industry, it was necessary to identify which methods were used and how they were used. All articles addressed algorithms. Twenty-three analytical or procedural methods and eight types of purposes were identified:
- Methods: CAD, decision-tree, eco-design, eco-efficiency, energy simulation, finite element, fuzzy, genetic algorithm, heuristic, LCC (abbreviation for “life cycle costing”), Markov chain, Monte Carlo, multicriteria, neural network, nonlinear programming, parametric design, propagation, risk analysis, sensitivity analysis, simulation, swarm, uncertainty analysis
- Purpose: Building rating, compare, decide, design (excluding “research design”), optimize, renovate/rehabilitate, simplify, solve
The classification is based on the occurrence of the words in the publications without evaluating the context it is used in. The approach is therefore suitable for providing an overview.
Table 6 shows an overview of the frequency of occurrence of the methods and purposes in the identified literature on LCA and algorithms. Red represents high occurrence and green low occurrence. This means that red indicates a theme that is commonly addressed, and green indicates a theme where it is likely that more research is needed. From the table, we can see that for purposes, “building rating” and “renovation/rehabilitation” are not addressed often, whereas “design” and “compare” are often addressed. For method, “finite element” and “CAD” are not addressed often, whereas “simulation” and “sensitivity analysis” are often addressed. The methods have been grouped according to method type.
3.2.2. Analytical Methods
This section provides an overview of algorithms used in analytical methods. This is not an exhaustive overview of all the methods and their application, as this is beyond the scope of this paper. Analytical methods were divided either according to the object of the algorithm (“what?”): buildings or construction products, either to the purpose of the algorithm (“what for?”): to investigate scenarios or to solve multicriteria optimization problems.
Buildings. Hollberg and Ruth [39] provided an overview of parametric design and LCA from the architects’ perspective. They found that most LCA tools are based on calculating environmental impact based on a bill of materials (BoM; or bill of quantities, BoQ). There are many approaches for generating the BoM, but the use of CAD for this purpose is increasing. This leads towards the use of BIM, which allows further parametrisation. However, they also note that “[p]arametric approaches for building LCA are rare”. Rodrigues et al. [40] performed a case study of the retrofitting of residential buildings, with a focus on streamlining the analysis to reduce time and resource use.
Construction products. Sousa and Wallace [41] addressed the challenge of classifying products into groups of comparable products. They used decision-tree algorithms and artificial neural networks to perform an approximate life cycle assessment of design components. The result of using this algorithm was an automated classification of products. Preliminary best options were first identified and were developed further in full parametric LCA models in later design stages. Ardente et al. [42] addressed a similar problem, but focused more on the uncertainty for specific products instead of groups of products. They employed a fuzzy approach to calculate eco-profiles of products that allow the user to evaluate the quality of the life cycle inventory.
Scenarios. Scenarios are necessary to determine the environmental impact of a building or construction product. In the early design stage of a building, all modules from A4 to C4 represent scenarios. Scenarios can be developed for all the modules or for specific modules, for example, a scenario for A5 to describe the installation or assembly process. Scenarios can also be developed for specific aspects. Energy simulation is one of the most common approaches for use-stage scenarios, partly due to building code requirements for energy consumption in the use stage. Tam et al. [43] performed a review of biologically inspired algorithms to simulate energy use in life cycle assessment. They distinguished between black box, grey box, and white box approaches. A black box model is based on models where we do not—or even cannot—understand the internal functions; for example, machine learning algorithms. A white box model is based on physical modelling, where we understand the relationships. Finally, a grey box model is a combination of black and white box models. Their findings indicate that there is no single optimal approach and that the choice of algorithm depends on the decision context. Shi et al. [44] discussed energy simulation from the architects’ perspective. They identified genetic algorithms as the most used design optimisation technique. However, they also found that although there is extensive use of algorithms for energy simulation, there is a lack of integration with tools that are used by architects (e.g., CAD). There concluded that there is a need both for more accurate simulation models and for procedural methods that integrate the energy results with other decisions. Gregory et al. [45] used a decision-tree algorithm to compare alternative solutions in a life cycle perspective. This approach identified the most influential parameters in the scenarios, including parameters related to system boundaries. A case study on pavement showed that albedo effects and modelling of the maintenance were more influential parameters than parameters that often receive more attention, such as study period and allocation principles. Focusing on an often overlooked theme, Schöbi and Chatzi [46] developed a framework for LCA and maintenance planning using Markov chain algorithms. The strength of this approach is that it goes beyond a priori simulation to also include feedback on the state of the construction work in the use stage. This can increase the precision considerably. A drawback is the amount of information required on the state of the construction work. The literature mapping indicates that algorithms could be used to further develop and evaluate scenarios (A4–C4).
Multicriteria decisions: Complexity and value choices. Multicriteria decision problems are another salient result from the literature mapping. These are decisions where one wishes to optimise several criteria at the same time. Multicriteria decision problems arise when there are multiple and conflicting criteria. Solving these will involve a value judgment on the relative importance of criteria compared against each other, either in the form of a weighting factor (e.g., global warming impacts are deemed twice as important as eutrophication impacts) or the introduction of constraints (e.g., no more than x kg CO2-eq. per product or no more than y Euro per product). Introducing additional parameters, constraints, and value choices will lead to more complex models. Carreras et al. [47] showed how multiobjective optimisation can be used as a tool to study trade-off solutions, using nonlinear programming to identify redundant environmental metrics. The approach allows a simplification of multicriteria problems, reducing the computational time to identify the best options. As mentioned above, Gregory et al. [45] proposed a methodology for making robust decisions under uncertainty, based on decision-tree algorithms and probability distributions. This method can also be used to address multicriteria decision problems. Finally, for weighting problems (i.e., combining incommensurable results into a single indicator), the overarching challenge is that weighting is based on value judgements and not on science [23].
3.2.3. Procedural Methods
This section provides an overview of algorithms used in procedural methods. This is not an exhaustive overview of all the methods and their application, as this is beyond the scope of this paper. Procedural methods are divided depending on the purpose of the algorithm: either decision-making, labelling, and rating schemes, or design in general.
Decision-making. The results from analytical methods can be used as input into procedural methods, as support for making better decisions. Especially results from multicriteria decision analysis can be used in decision-making. A survey by Zanghelini et al. [48] found that multicriteria decision analysis is typically used in three different stages in an LCA: life cycle impact assessment (e.g., weighting), life cycle inventory, and goal and scope definition. Decisions can also be made for different systems of interest, for example, the neighbourhood level [49], building level [39,40], component level [50], and material level [51,52]. A general challenge is to balance precision with timeliness, or to know “when ‘good enough’ is best” as formulated by Bala et al. [53]. To improve the decision-making process, an automated or streamlined process is needed that can account for environmental aspects and other aspects such as costs [40,44]. Several authors also stressed the need to take uncertainty into account [51,53,54]. This is especially a challenge for emerging technologies and novel materials [55].
Labelling and rating schemes. Building rating schemes (e.g., BREEAM, LEED, Green-Star, DGBC, etc.) and product labels and declarations (e.g., EU Flower, EPD, Nordic Swan, etc.) are common procedural approaches in the building and construction industry. However, the literature mapping shows that there has been limited focus on the combination of LCA/algorithms and labelling/rating. Zanghelini and Cherubini [48] discussed the connection between multicriteria decision analysis, product declarations, and building rating schemes, and identified global warming, acidification, and eutrophication as the three most common environmental impacts in this area in existing studies. Tam, Le, Tran and Wang [43] discussed the challenge of performing an LCA that conforms both with the requirements of building rating schemes and the legal requirements in building codes (especially for energy requirements). Their findings showed that the complexity of adapting an LCA model is a barrier for architectural designers, who typically are not familiar with LCA software products.
Design. Procedural approaches for the design of neighbourhoods, buildings, building components, or construction materials have been found in the literature mapping, although to a much lesser extent than analytical approaches. There is a large variation in description of design methods, from specific methodologies to more general concepts (e.g., recommendation to include LCA results in a design process or eco-design, without further details provided). Some articles outline a procedural method, for example, Hollberg and Ruth’s [39] method for performing a parametric LCA on buildings and Perez-Gallardo et al. [56] design for an end-of-life approach for photovoltaic modules. In a parametric context, a procedural method includes defining parameters (decision variables), constraints, and the function or functions of the system of interest. This will depend on the system of interest and the decision context. For example, in the early design stages at the building level, the geometry (shape/form) is the key parameter that an architect, planner, or designer takes into account [39,44]. An example of this is the general procedure for combining optimisation algorithms into the design process developed by Shi et al. [44]. Challenges identified by Attia et al. [57] for building performance optimisation include the low return and lack of appreciation in the industry.
4. Discussion
4.1. General Focus of Research
Table 6 can be used to identify gaps of knowledge and themes which have been investigated most: green indicates a theme that is less salient and where it is likely that more research is needed, whereas red indicates a theme that is commonly addressed. An under-researched purpose is a column with mainly green. An under-researched method is a row with mainly green.
Low analytical-level purposes such as Design, Compare, and Optimize have been shown to occur the most frequently, while high analytical-level purposes such as Simplify or Decide have been shown to occur the least frequently. This demonstrates that the focus has been more on analysing, modelling, and understanding, whereas the use of the results in decisions or to simplify are left to the reader. This corresponds to the general behaviour of stakeholders interested in (raw) data, with very few of them able to analyse it to transform it into knowledge. Actions and decisions need to be knowledge-based so that evaluation can take place according to the framework for smart use of data defined by Labonnote et al. [58]:
- Monitoring is defined as a short-term collection of data and information, which does not take into account outcomes and impact. Here, monitoring could refer to the collection of bills of materials.
- Reasoning is defined as any data-analysing process that enables one to transform data into valuable knowledge. All the identified methods belong to the reasoning step.
- Acting is defined as the short-term result of access to new knowledge. End-users are usually expected to make decisions, whocan then create specific tasks to be performed by specific persons or specific equipment. The decision may be taken within the reasoning process as part of the generation of new knowledge. All the identified purposes of the algorithms belong to the acting step.
- Evaluating is defined as the process of assessing the outcomes and long-term impact of previous actions, decisions, and data collection. The evaluating process is a management tool.
4.2. Project Phases
A construction project can be divided into the following phases: the (i) planning phase, (ii) early design phase, (iii) detailed design phase, (iv) as-built phase, and (v) in-operation phase. The literature mapping has shown numerous possibilities of applying algorithmic approaches within each phase, for example, parametric design to explore the design space. However, the transition between the phases is rarely addressed. This is also the experience in the ZEB tool examples, especially for the office building. Here, there is a need for further research. A possible development of the ZEB tool in this regard can be to integrate it with either CAD or BIM, allowing changes in one tool to be automatically integrated in the other; this eliminates redundancy. The early design stage has been more specifically shown to lack standardised and systematic approaches, including uncertainty and variability; for example, under the form of probability distributions. This knowledge is critical as this is the stage where major design changes can and should occur. Similarly, the early design stage has unveiled a general challenge for parametric models: how to identify comparable alternatives. For example, in one decision context, a broad range of building boards may be applicable. In another decision context, it will make more sense to distinguish between building boards for indoor and outdoor use. This is a context-sensitive problem that needs further research. Another challenge is to address the detailing level as a feature specific to each project and to each project phase. Parametric design has been so far mostly used in the early design phase, because the level of detailing is coarse enough to enable a substantial number of computational runs within a reasonable amount of time. The massive increase in computational power in recent years is likely to enable a greater level of detailing for any project phases, even those requiring complex analyses or large amounts of data. The main barrier to parameterization is often not directly related to technology, but to the amount of structured information people need and can process. The correct trade-off is therefore always project-, people-, and project phase-related, and its evaluation should always be user-centric.
4.3. System of Interest
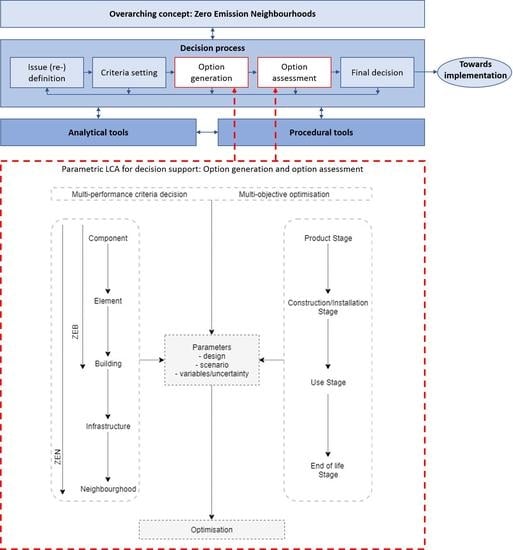
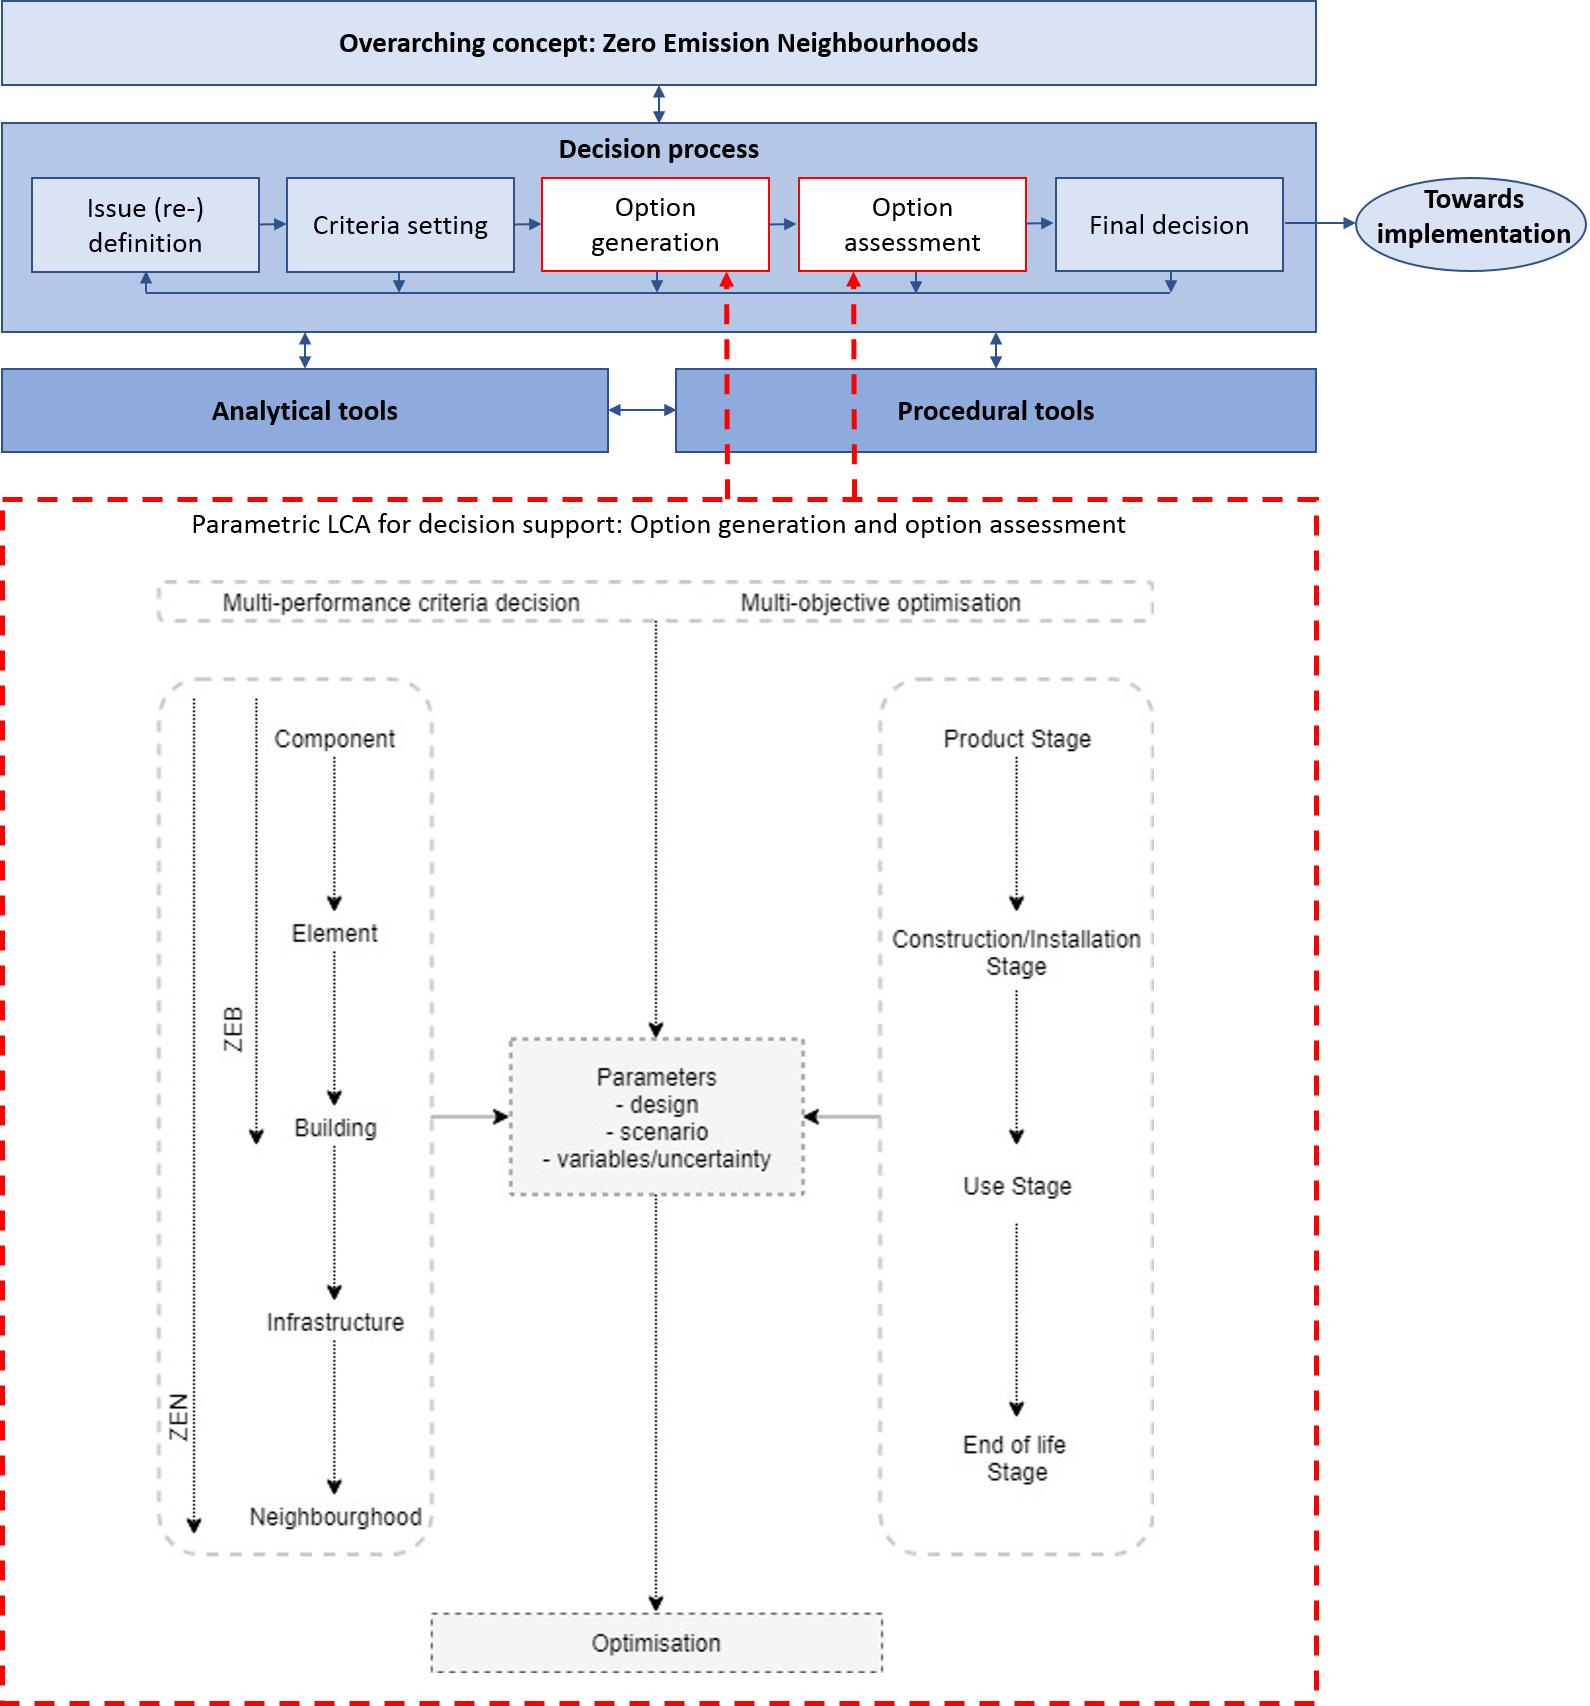
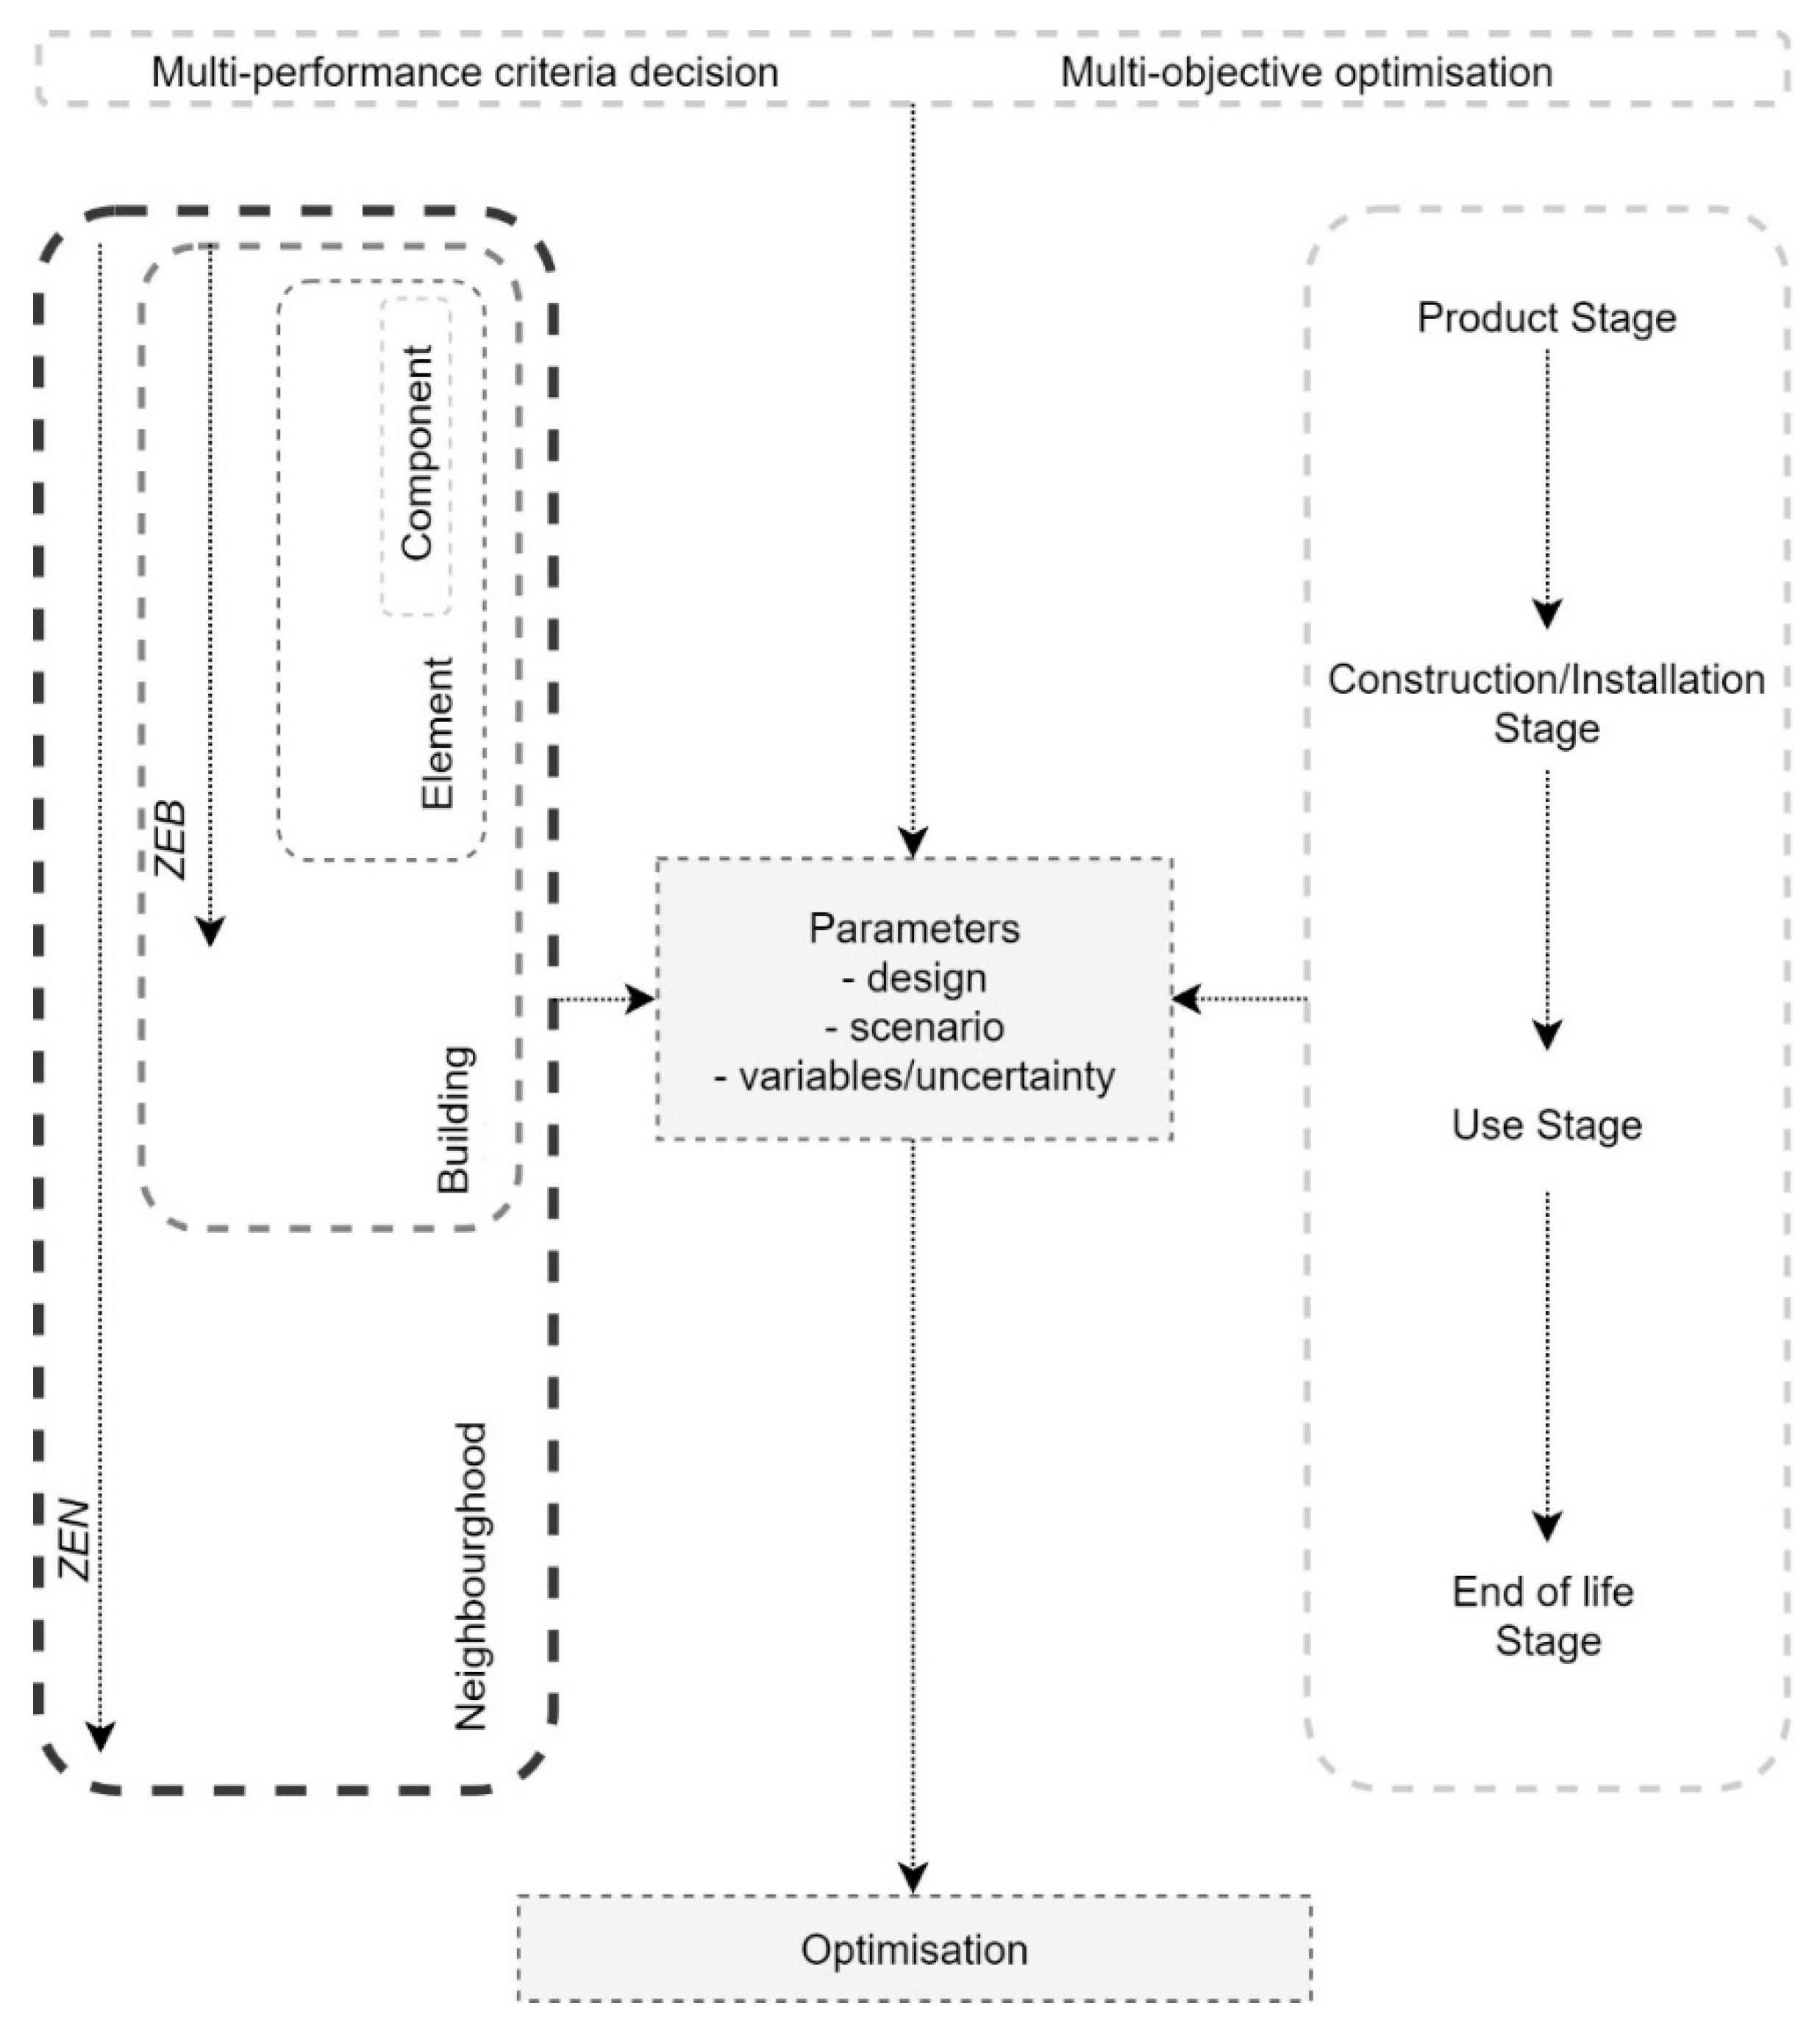
None of the articles identified in the literature mapping have focused on the neighbourhood level and algorithms. The focus has been on buildings or building components, with some also addressing the construction materials. A key challenge is the connections between the systems of interest, for example, how the design of a construction product takes the consequences on the building and neighbourhood level into account (see Figure 4). The ZEB tool used on floor systems is an example of this, where the floor system considered consequences due to performance requirements at the building level. This could be further evolved by analysing the consequences for the load-bearing structure. Algorithms show here a substantial potential for exploring consequences. It may however be challenging to develop algorithms that can account for all multiperformance criteria.
4.4. Analytical Methods
The analysis of the distribution of methods between analytical and procedural categories shows that the focus is mainly on analytical methods, with detailed descriptions of method and results. In theory, all the analytical methods can also be used as input into procedural methods. Parametric design is used both as an analytical tool and as a combined analytical and procedural tool. This confirms that algorithms including LCA have been developed up to now predominantly for producing data, and not to support decisions. This is in line with the identified needs that include: the simplification and parametrisation of tools, better modelling of scenarios, integration of tools, incorporation of multiperformance criteria and/or multiobjective optimisation, and adaptation to the decision context. The literature on analytical methods shows a predominant focus on the design stage, for example, the design of buildings or design of construction products. Energy consumption in the use stage is also often addressed. Fewer articles focus on maintenance and repair scenarios for the building, and even fewer focus on the end of life. None of the identified publications addressed the neighbourhood level, indicating that this is an under-researched system level.
The finite element method stands out as the least used, followed by CAD and parametric design. Although CAD is a common approach when designing buildings or construction products, it is shown here that the combination of LCA and algorithms within CAD is an under-researched theme. One reason for this may be that a common combination of LCA and CAD is to either supplement the CAD model with static LCA properties (e.g., kg CO2-eq. per kg material) or to export a bill of materials (BoM) from the CAD model to an LCA software. Both approaches end up with a static and linear combination of LCA and CAD.
4.5. Uncertainty and Sensitivity Analysis
The literature mapping results show that sensitivity analyses have been performed in LCA, while uncertainty analysis and parametric analysis have lower frequency. The review shows that advances have been made toward applying global sensitivity analysis [59,60]; however, accounting simultaneously for varying parameters (i.e., design, scenario) and involved uncertainties in LCA calculations is identified as another under-researched method. The importance of accounting for uncertainties in LCA has been already been discussed in previous literature [40,45,59,60,61,62,63,64,65,66,67,68] and also recognized in the ISO 14044 standard [69]. Sensitivity analyses can be used to identify the dominant parameters of the expected overall LCA of the considered system. Subsequently, the LCA model can be simplified while enabling a clearer overview of the variance of the multiperformance criteria and multiobjective optimisation decisions (minimisation of cost and environmental impact). Such a combination can become even more useful while expanding the system of interest or life cycle stage, shifting though building scales (component, element, building, infrastructure, and neighbourhood) and/or though stages (product, construction/installation, use, and end-of-life stage) as shown in Figure 4. The complexities and nonlinearities that are enhanced from the transition from buildings to neighbourhoods may be also overcome by the application of algorithms.
4.6. Procedural Methods
The literature mapping revealed that the use of algorithms in LCA for buildings and construction materials has mainly been analytical methods, providing decision support. There is a lack of procedural methods. This is also reflected in the examples for the ZEB tool, for which it has been used analytically and with a less defined procedural approach. For the design process, this is likely a useful tool. In particular, there is a need for procedural methods that allow the ZEB tool to easily transfer between project phases, from early design to as-built.
4.7. From ZEB to ZEN
Andresen [3] provides a nine-step approach to developing a ZEB: (i) location, orientation, and form; (ii) daylight and sun; (iii) material choices; (iv) the building envelope—insulation and air tightness; (v) effective lights and appliances; (vi) efficient heating, ventilation, and cooling systems; (vii) renewable thermal energy; (viii) renewable electricity; and (ix) measurements and controls. This is not a linear process, but key steps that can be revisited during the design process. Combining these steps with algorithmic approaches can provide more insight into the options of each step, but this requires more procedural methods that could guide the process. The evolution from ZEB to ZEN corresponds to the addition of energy systems, mobility, and infrastructure within the original scope: buildings. A central question is therefore how the design of ZEB can and should adapt to the neighbourhood perspective. Broadening from buildings to neighbourhoods with the help of algorithms can reduce the risk of designing buildings that are suboptimal in a neighbourhood context. Finally, the need for simplification in the decision-making process is likely to be even more substantial as the complexity increases at the neighbourhood level. The carbon footprint approach represents therefore a favourite candidate for practical implementation reasons, even if correlation with other environmental impact categories should be investigated to avoid the risk of problem shifting.
In conclusion, parametric approaches using algorithms have been shown to be a promising approach to designing zero emission neighbourhoods and zero emission buildings. They can address the key challenges of time and resource use, both in exploring options and in transitioning through the design process. This is in line with Lotteau et al.’s [6] identification of a “clear research need for the development of approaches that would enable the contextualization of the assessment of energy consumption in buildings while remaining consistent with data availability in a project’s early design phase”. Writing on parametric design thinking, Oxman [70] states that “[s]cripting and tool-making are becoming required forms of knowledge in research, education, and practice”. This seems to be just as relevant for performing LCA of neighbourhoods, buildings, and construction materials. The adaptability of the ZEB tool is, in practice, limited by the time and effort that is required to adapt the tool. Parametric approaches can overcome these barriers.
5. Summary and Conclusions
The purpose of this study was to investigate how the use of parametric LCA models can contribute to better decision-making for materials/components, buildings, and neighbourhoods during different life cycle stages. The motivation for investigating parametric LCA models for ZEB and ZEN is the need for decision support that extends the scope of current approaches [12]. This article first presents the ZEB tool and its adaptation to changing needs, and then provides an overview of how algorithms have been used in the context of LCA and buildings and construction industry. The literature mapping has provided an overview of how algorithms and life cycle assessment have been used in the building and construction industry by identifying research gaps, thus providing a foundation for further possibilities of evolving the ZEB tool. Analytical methods have been mapped according to the object of the algorithms: buildings or construction products, and according to the purpose of the algorithms: to investigate scenarios or to solve multicriteria optimization problems. Procedural methods have been mapped according to the purpose of the algorithms: either decision-making, labelling, and rating schemes, or design in general. Results have identified a general gap of knowledge regarding the use of parametric LCA models for decision-support purposes, demonstrated by the substantial focus on analytical methods compared to procedural methods. Other specific findings were discussed; among them: transitions between construction project phases were poorly addressed; the early design stage exhibited specific challenges; the neighbourhood level was investigated very little; and the simultaneous integration of parametric and sensitivity analysis. Implications for the evolution from ZEB to ZEN are twofold: (i) an integrated approach with multiple tools and methods is required, and (ii) further development of algorithms in the tool is needed to address complexity, sensitivity, and uncertainty. The tool itself and the use of the tool should be context-specific. This study is expected to foster the development of algorithmic approaches to improve the ZEB tool as a decision-support tool. Further research should address the key questions of when and how.
Author Contributions
Conceptualization, C.S., N.L. and K.G.; Formal Analysis, C.S.; Investigation, C.S.; Methodology, C.S., N.L. and K.G.; Validation, C.S., N.L. and K.G.; Visualization, C.S., N.L. and K.G.; Writing-Original Draft Preparation, C.S., N.L. and K.G.; Writing-Review & Editing, C.S., N.L. and K.G.
Funding
This research was funded by the Research Council of Norway grant number 257660.
Acknowledgments
This article has been written within the Research Centre on Zero Emission Neighbourhoods in Smart Cities (FME ZEN, project number 257660). The authors gratefully acknowledge the support from the ZEN partners and the Research Council of Norway.
Conflicts of Interest
The authors declare no conflict of interest.
References
- EC. Buildings. Available online: https://ec.europa.eu/energy/en/topics/energy-efficiency/buildings (accessed on 31 October 2017).
- EU. Directive 2010/31/EU of the European Parliament and of the Council of 19 May 2010 on the Energy Performance of Buildings; Official Journal of the European Union: Brussels, Belgium, 2010. [Google Scholar]
- Andresen, I. Towards Zero Energy and Zero Emission Buildings—Definitions, Concepts, and Strategies. Curr. Sustain. Renew. Energy Rep. 2017, 4, 63–71. [Google Scholar] [CrossRef]
- Woods, R.; Samdal, M. ZEB Final Report 2009–2017; The Research Centre on Zero Emission Buildings (ZEB): Trondheim, Norway, 2017. [Google Scholar]
- ZEB. The Research Centre on Zero Emission Buildings. Available online: http://www.zeb.no (accessed on 30 May 2018).
- Lotteau, M.; Loubet, P.; Pousse, M.; Dufrasnes, E.; Sonnemann, G. Critical review of life cycle assessment (LCA) for the built environment at the neighborhood scale. Build. Environ. 2015, 93, 165–178. [Google Scholar] [CrossRef]
- FME ZEN. Available online: http://fmezen.com/ (accessed on 30 May 2018).
- NGBC. BREEAM-NOR. Available online: http://ngbc.no/breeam-nor/ (accessed on 30 May 2018).
- Nielsen, B.F.; Juhasz-Nagy, E.; Lindkvist, C.; Wyckmans, A.; Andresen, I.; Baer, D. Planning Instruments for Smart Energy Communities (Pi-Sec); SINTEF and NTNU: Trondheim, Norway, 2017. [Google Scholar]
- Schlanbusch, R.D.; Fufa, S.M.; Häkkinen, T.; Vares, S.; Birgisdottir, H.; Ylmén, P. Experiences with LCA in the Nordic Building Industry-Challenges, Needs and Solutions. Energy Procedia 2016, 96, 82–93. [Google Scholar] [CrossRef]
- Wiik, M.K.; Fufa, S.M.; Kristjansdottir, T.; Andresen, I. Lessons learnt from embodied GHG emission calculations in zero emission buildings (ZEBs) from the Norwegian ZEB research centre. Energy Build. 2018, 165, 25–34. [Google Scholar] [CrossRef]
- Labonnote, N.; Skaar, C.; Rüther, P. The potential of decision support systems for more sustainable and intelligent constructions: A short overview. Procedia Manuf. 2017, 12, 33–41. [Google Scholar] [CrossRef]
- Kristjansdottir, T.F.; Good, C.S.; Inman, M.R.; Schlanbusch, R.D.; Andresen, I. Embodied greenhouse gas emissions from PV systems in Norwegian residential Zero Emission Pilot Buildings. Sol. Energy 2016, 133, 155–171. [Google Scholar] [CrossRef] [Green Version]
- ISO. ISO 14025: Environmental Labels and Declarations—Type III Environmental Declarations—Principles and Procedures; International Organization for Standardization: Geneva, Switzerland, 2006. [Google Scholar]
- ISO. ISO 21930: Sustainability in Building Construction: Environmental Declaration of Building Products, 1st ed.; International Organization for Standardization: Geneva, Switzerland, 2007. [Google Scholar]
- CEN. EN 15804:2012+A1:2013: Sustainability of Construction Works-Environmental Product Declarations—Core Rules for the Product Category of Construction Products; International Organization for Standardization: Geneva, Switzerland, 2013. [Google Scholar]
- Kristjansdottir, T.; Fjeldheim, H.; Selvig, E.; Risholt, B.; Time, B.; Georges, L.; Dokka, T.H.; Bourelle, J.; Bohne, R.A.; Cervenka, Z. A Norwegian ZEB-Definition Embodied Emission; ZEB Project Report 17-2014; SINTEF Byggforsk: Oslo, Norway, 2014. [Google Scholar]
- Fufa, S.M.; Schlanbusch, R.D.; Sørnes, K.; Inman, M.R.; Andresen, I. A Norwegian ZEB Definition Guideline; ZEB Project Report 29–2016; SINTEF Byggforsk: Oslo, Norway, 2016. [Google Scholar]
- Finkbeiner, M. Carbon footprinting—Opportunities and threats. Int. J. Life Cycle Assess. 2009, 14, 91–94. [Google Scholar] [CrossRef]
- CEN. NS-EN 15978: Bærekraftige Byggverk: Vurdering av Bygningers Miljøpåvirkning: Beregningsmetode = Sustainability of Construction Works: Assessment of Environmental Performance of Building: Calculation Method; Standard Norge: Oslo, Norway, 2011. [Google Scholar]
- Erlandsson, M.; Ekvall, T.; Jelse, K.; Lindfors, L.-G.; Gustavsson, M.; Karlsson, P.-E.; Stripple, H.; Zetterberg, L. Robust LCA: PCR Guide for Construction Products and Works; IVL Report No B 2101; IVL Swedish Environmental Research Institute: Stockholm, Sweden, 2013. [Google Scholar]
- ISO. Miljøstyring, Livsløpsvurdering, Prinsipper og Rammeverk (ISO 14040:2006) = Environmental Management, Life Cycle Assessment, Principles and Framework (ISO 14040:2006); Standard Norge: Lysaker, Norway, 2006. [Google Scholar]
- ISO. Miljøstyring, Livsløpsvurdering, Krav og Retningslinjer (ISO 14044:2006) = Environmental Management, Life Cycle Assessment, Requirements and Guidelines (ISO 14044:2006); Standard Norge: Oslo, Norway, 2006. [Google Scholar]
- Ecoinvent. ecoinvent. Available online: http://www.ecoinvent.org (accessed on 30 May 2018).
- Standard Norge. NS 3451:2009 Bygningsdelstabell (Table of Building Elements); Standard Norge: Lysaker, Norway, 2009. [Google Scholar]
- Skaar, C.; Elvebakk, K.; Skeie, K.S. Klimafotspor fra Byggematerialer ved Ambisiøs Oppgradering av Boligblokker; 2017:00580; SINTEF Building and Infrastructure: Oslo, Norway, 2018. [Google Scholar]
- Fufa, S.M.; Skaar, C.; Gradeci, K.; Labonnote, N.; Time, B.; Kohler, J. Parametric LCA of a ventilated timber wall construction in tall timber buildings. In Proceedings of the XIV DBMC 14th International Conference on Durability of Building Materials and Components, Gent, Belgium, 29–31 May 2017; Rilem Publications: Paris, France, 2017; p. 434. [Google Scholar]
- Skaar, C.; Solem, B.; Rüther, P. Composite floors in urban buildings: Options for a low carbon building design. In 6th Forum Wood Building Nordic; SINTEF: Trondheim, Norway, 2017. [Google Scholar]
- Wrisberg, N. Analytical Tools for Environmental Design and Management in a Systems Perspective: The Combined Use of Analytical Tools; Kluwer Academic: Boston, MA, USA, 2002; p. xii. 275p. [Google Scholar]
- Kjellén, U. The Civil Corporation, rev. ed.; Earthscan: London, UK; Sterling, VA, USA, 2007; p. xiv. 288p. [Google Scholar]
- Kjellén, U. Prevention of Accidents through Experience Feedback; Taylor & Francis: London, UK; New York, NY, USA, 2000; p. xxvi. 424p. [Google Scholar]
- Booth, A.; Papaioannou, D.; Sutton, A. Systematic Approaches to a Successful Literature Review; Sage: Newcastle upon Tyne, UK, 2011. [Google Scholar]
- Petersen, K.; Vakkalanka, S.; Kuzniarz, L. Guidelines for conducting systematic mapping studies in software engineering: An update. Inf. Softw. Technol. 2015, 64, 1–18. [Google Scholar] [CrossRef]
- Petticrew, M.; Roberts, H. Systematic Reviews in the Social Sciences: A Practical Guide; John Wiley & Sons: Hobo, NJ, USA, 2008. [Google Scholar]
- NVivo. What Is NVivo? Available online: http://www.qsrinternational.com/nvivo/what-is-nvivo (accessed on 29 May 2018).
- Falagas, M.E.; Pitsouni, E.I.; Malietzis, G.A.; Pappas, G. Comparison of PubMed, Scopus, web of science, and Google scholar: Strengths and weaknesses. FASEB J. 2008, 22, 338–342. [Google Scholar] [CrossRef] [PubMed]
- Aghaei Chadegani, A.; Salehi, H.; Yunus, M.M.; Farhadi, H.; Fooladi, M.; Farhadi, M.; Ale Ebrahim, N. A comparison between two main academic literature collections: Web of Science and Scopus databases. Asian Soc. Sci. 2013, 9, 18–26. [Google Scholar] [CrossRef]
- Moher, D.; Liberati, A.; Tetzlaff, J.; Altman, D.G.; Group, P. Preferred reporting items for systematic reviews and meta-analyses: The prisma statement. PLoS Med. 2009, 6, e1000097. [Google Scholar] [CrossRef] [PubMed]
- Hollberg, A.; Ruth, J. LCA in architectural design—A parametric approach. Int. J. Life Cycle Assess. 2016, 21, 943–960. [Google Scholar] [CrossRef]
- Rodrigues, C.; Kirchain, R.; Freire, F.; Gregory, J. Streamlined environmental and cost life-cycle approach for building thermal retrofits: A case of residential buildings in South European climates. J. Clean. Prod. 2016, 172, 2625–2635. [Google Scholar] [CrossRef]
- Sousa, I.; Wallace, D. Product classification to support approximate life-cycle assessment of design concepts. Technol. Forecast. Soc. Chang. 2006, 73, 228–249. [Google Scholar] [CrossRef]
- Ardente, F.; Beccali, M.; Cellura, M. FALCADE: A fuzzy software for the energy and environmental balances of products. Ecol Mod. 2004, 176, 359–379. [Google Scholar] [CrossRef]
- Tam, W.Y.V.; Le, K.N.; Tran, C.N.N.; Wang, J.Y. A review on contemporary computational programs for Building’s life cycle energy consumption and greenhouse-gas emissions assessment: An empirical study in Australia. J. Clean. Prod. 2018, 172, 4220–4230. [Google Scholar] [CrossRef]
- Shi, X.; Tian, Z.; Chen, W.; Si, B.; Jin, X. A review on building energy efficient design optimization rom the perspective of architects. Renew. Sustain. Energy Rev. 2016, 65, 872–884. [Google Scholar] [CrossRef]
- Gregory, J.R.; Noshadravan, A.; Olivetti, E.A.; Kirchain, R.E. A methodology for robust comparative life cycle assessments incorporating uncertainty. Environ. Sci. Technol. 2016, 50, 6397–6405. [Google Scholar] [CrossRef] [PubMed]
- Schöbi, R.; Chatzi, E.N. Maintenance planning using continuous-state partially observable Markov decision processes and non-linear action models. Struct. Infrastruct. Eng. 2016, 12, 977–994. [Google Scholar] [CrossRef]
- Carreras, J.; Pozo, C.; Boer, D.; Guillen-Gosalbez, G.; Caballero, J.A.; Ruiz-Femenia, R.; Jimenez, L. Systematic approach for the life cycle multi-objective optimization of buildings combining objective reduction and surrogate modeling. Energy Build. 2016, 130, 506–518. [Google Scholar] [CrossRef]
- Zanghelini, G.M.; Cherubini, E.; Soares, S.R. How multi-criteria decision analysis (mcda) is aiding life cycle assessment (LCA) in results interpretation. J. Clean. Prod. 2018, 172, 609–622. [Google Scholar] [CrossRef]
- Frischknecht, R.; Benetto, E.; Dandres, T.; Heijungs, R.; Roux, C.; Schrijvers, D.; Wernet, G.; Yang, Y.; Messmer, A.; Tschuemperlin, L. LCA and decision making: When and how to use consequential LCA; 62nd LCA forum, Swiss Federal Institute of Technology, Zürich, 9 September 2016. Int. J. Life Cycle Assess. 2017, 22, 296–301. [Google Scholar] [CrossRef]
- Azari, R.; Garshasbi, S.; Amini, P.; Rashed-Ali, H.; Mohammadi, Y. Multi-objective optimization of building envelope design for life cycle environmental performance. Energy Build. 2016, 126, 524–534. [Google Scholar] [CrossRef]
- Shi, Q.; Xu, Y.L. The Selection of Green Building Materials Using GA-BP Hybrid Algorithm. In Proceedings of the 2009 International Conference on Artificial Intelligence and Computational Intelligence, Shanghai, China, 7–8 November 2009; Volume III, pp. 40–45. [Google Scholar]
- Zhou, C.C.; Yin, G.F.; Hu, X.B. Multi-objective optimization of material selection for sustainable products: Artificial neural networks and genetic algorithm approach. Mater. Des. 2009, 30, 1209–1215. [Google Scholar] [CrossRef]
- Bala, A.; Raugei, M.; Benveniste, G.; Gazulla, C.; Fullana-i-Palmer, P. Simplified tools for global warming potential evaluation: When ‘good enough’ is best. Int. J. Life Cycle Assess. 2010, 15, 489–498. [Google Scholar] [CrossRef]
- Shimako, A.H.; Tiruta-Barna, L.; Bisinella de Faria, A.B.; Ahmadi, A.; Spérandio, M. Sensitivity analysis of temporal parameters in a dynamic LCA framework. Sci. Total Environ. 2018, 624, 1250–1262. [Google Scholar] [CrossRef] [PubMed]
- Tsang, M.P.; Bates, M.E.; Madison, M.; Linkov, I. Benefits and risks of emerging technologies: Integrating life cycle assessment and decision analysis to assess lumber treatment alternatives. Environ. Sci. Technol. 2014, 48, 11543–11550. [Google Scholar] [CrossRef] [PubMed]
- Perez-Gallardo, J.R.; Azzaro-Pantel, C.; Astier, S.; Domenech, S.; Aguilar-Lasserre, A. Ecodesign of photovoltaic grid-connected systems. Renew. Energy 2014, 64, 82–97. [Google Scholar] [CrossRef]
- Attia, S. Towards regenerative and positive impact architecture: A comparison of two net zero energy buildings. Sustain. Cities Soc. 2016, 26, 393–406. [Google Scholar] [CrossRef] [Green Version]
- Labonnote, N.; Hauge, Å.L.; Sivertsen, E. A Climate Services Perspective on Norwegian Stormwater-Related Databases; Submitted to Climate Services; Elsevier: Amsterdam, The Netherlands, 2018. [Google Scholar]
- Groen, E.A.; Bokkers, E.A.M.; Heijungs, R.; de Boer, I.J.M. Methods for global sensitivity analysis in life cycle assessment. Int. J. Life Cycle Assess. 2017, 22, 1125–1137. [Google Scholar] [CrossRef]
- Cucurachi, S.; Borgonovo, E.; Heijungs, R. A protocol for the global sensitivity analysis of impact assessment models in life cycle assessment. Risk Anal. 2016, 36, 357–377. [Google Scholar] [CrossRef] [PubMed]
- Bieda, B. Application of stochastic approach based on Monte Carlo (MC) simulation for life cycle inventory (LCI) to the steel process chain: Case study. Sci. Total Environ. 2014, 481, 649–655. [Google Scholar] [CrossRef] [PubMed]
- Bourgault, G.; Lesage, P.; Samson, R. Systematic disaggregation: A hybrid LCI computation algorithm enhancing interpretation phase in LCA. Int. J. Life Cycle Assess. 2012, 17, 774–786. [Google Scholar] [CrossRef]
- Heijungs, R.; Tan, R.R. Rigorous proof of fuzzy error propagation with matrix-based LCI. Int. J. Life Cycle Assess. 2010, 15, 1014–1019. [Google Scholar] [CrossRef] [Green Version]
- Ozcan-Deniz, G.; Zhu, Y.; Ceron, V. Time, cost, and environmental impact analysis on construction operation optimization using genetic algorithms. J. Manag. Eng. 2011, 28, 265–272. [Google Scholar] [CrossRef]
- Pomponi, F.; D’Amico, B.; Moncaster, A.M. A method to facilitate uncertainty analysis in LCAs of buildings. Energies 2017, 10, 524. [Google Scholar] [CrossRef]
- Prado, V.; Wender, B.A.; Seager, T.P. Interpretation of comparative LCAs: External normalization and a method of mutual differences. Int. J. Life Cycle Assess. 2017, 22, 2018–2029. [Google Scholar] [CrossRef]
- Reyes-Labarta, J.A.; Salcedo-Díaz, R.; Ruiz-Femenia, R.; Guillén-Gosálbez, G.; Caballero, J.A. Handling of uncertainty in life cycle inventory by correlated multivariate lognormal distributions: Application to the design of supply chain networks. In Computer Aided Chemical Engineering; Elsevier: Amsterdam, The Netherlands, 2014; Volume 33, pp. 1075–1080. [Google Scholar]
- Verbeeck, G.; Hens, H. Life Cycle Inventory of Extremely Low Energy Dwellings; Proceedings Plea: Edinburgh, UK, 2007. [Google Scholar]
- Finkbeiner, M.; Inaba, A.; Tan, R.; Christiansen, K.; Klüppel, H.-J. The new international standards for life cycle assessment: ISO 14040 and ISO 14044. Int. J. Life Cycle Assess. 2006, 11, 80–85. [Google Scholar] [CrossRef]
- Oxman, R. Thinking difference: Theories and models of parametric design thinking. Des. Stud. 2017, 52, 4–39. [Google Scholar] [CrossRef]
Figure 1.
Life cycle stages and system of interest, based on EN15804 [16].
Figure 1.
Life cycle stages and system of interest, based on EN15804 [16].

Figure 2.
Decision-making process (modified from Wrisberg (2002)).

Figure 3.
PRISMA diagram showing the screening process of the literature.

Figure 4.
Optimisation procedure accounting for different building scales and life cycle stages, from Zero Emission Building (ZEB) to Zero Emission Neighbourhood (ZEN).
Figure 4.
Optimisation procedure accounting for different building scales and life cycle stages, from Zero Emission Building (ZEB) to Zero Emission Neighbourhood (ZEN).


Table 1.
Summary of the four examples of the Zero Emission Building (ZEB) tool adapted to specific needs.
Table 1.
Summary of the four examples of the Zero Emission Building (ZEB) tool adapted to specific needs.
| Case | Description | Lessons Learned |
|---|---|---|
| Office building | Construction of an office building with a ZEB-COM ambition level. | This case is an office building with a ZEB-COM ambition, where the export from on-site renewable energy production shall offset the carbon footprint of the materials, the construction site and the operational energy. The ZEB tool works well to document the carbon footprint for a specific design, but it is challenging to transfer from early design to detailed design and to update the ZEB tool model when the BIM (building information modelling) model is updated. There is a need for better integration with the BIM model. Ongoing project. |
| Apartment building | Renovation or upgrading of an apartment building and evaluating it in terms of ZEB performance. | The ZEB tool provides information on the carbon footprint of two alternative renovations for an apartment building. Two challenges have been identified. The first is the challenge of extracting data from the design basis and entering it into the ZEB tool. The second is evaluating the sensitivity of the results to different assumptions, e.g., on carbon footprint per kWh for the electricity [26]. |
| Façade | Evaluating the consequences on the carbon footprint of moisture damage in tall timber façades. | It has been demonstrated that the ZEB tool can (i) be parametrised to evaluate different damage scenarios and (ii) be combined with a probabilistic-based design methodology to include risk of decay and mould. This works well when there are few parameters and these can be varied stepwise. Two key challenges are (i) the amount of options that can be generated when varying parameters and (ii) linking the probabilistic methodology to the ZEB tool [27]. |
| Floor system | Compare four floor systems, taking into account requirements of joist span, sound insulation, and fire resistance. | The ZEB tool could be used to compare four different floor systems with specified design requirements. The database was modified to provide information for generic materials (e.g., glulam) on the average carbon footprint and the probability distribution based on all relevant environmental product declaration (EPD). A key challenge is identifying which EPD are relevant in a specific decision context and calculating the probability distribution for the carbon footprint [28]. |
Table 2.
The PICOC framework.
| Population | Life cycle assessment (LCA). |
| Intervention or Exposure | Application of algorithms. |
| Comparison | Comparison and correlation between different methods that interconnect with different purposes in the application of life cycle assessment. |
| Outcome(s) | Current knowledge and potential gaps in the literature and applications. |
| Context | Building and construction industry. |
Table 3.
Initial search terms and results.
| Search Term * | Google Scholar | Scopus | Web of Science |
|---|---|---|---|
| LCA buildings | 32,500 | 2034 | 1239 |
| LCA “building sector” | 4500 | 736 | 85 |
| LCA “building sector” parametric | 405 | 2 | 2 |
| LCA “building sector” optimization | 2440 | 9 | 11 |
| LCA “building sector” parameter | 2880 | 14 | 8 |
| LCA construction | 84,900 | 7637 | 1180 |
| LCA construction parametric | 7100 | 259 | 16 |
| LCA construction optimization | 19,900 | 2045 | 93 |
| LCA construction parameter | 23,000 | 1398 | 92 |
* The search terms were adapted to the search syntax for each database, e.g., LCA “building sector” optimization in Google scholar and lca AND “building sector” AND (optimization OR optimisation) in Web of Science and Scopus.
Table 4.
Keywords and Boolean operators.
| Elements of PICOC | Population | AND | Intervention | AND | Comparison | AND | Outcomes | AND | Context |
| Search terms | LCA OR “life cycle” | algorithm * (wildcard search) | - | - | - |
Table 5.
Inclusion and exclusion criteria.
| Criteria | 1st Exclusion Criteria | 2nd Exclusion Criteria | 3rd Exclusion Criteria |
|---|---|---|---|
| Reason | Qualitative based on the type of literature | Scientific based on keywords, titles, and abstract | Scientific based on article |
| What | Scientific journal articles and conference proceedings; English | Publications that were specific to other industries than the building industry/construction were not included, but articles on general LCA methodology were included. | |
Table 6.
Frequency of combinations of purpose and methods.
| Building Rating | Renovate, Rehabilitate | Design | Compare | Simplify | Optimize | Solve | Decide | Total, Row | |
|---|---|---|---|---|---|---|---|---|---|
| Monte Carlo | 0 | 29 | 57 | 99 | 34 | 69 | 34 | 11 | 333 |
| Parametric design | 0 | 14 | 56 | 56 | 42 | 56 | 14 | 19 | 257 |
| Sensitivity analysis | 12 | 85 | 289 | 370 | 147 | 264 | 226 | 123 | 1516 |
| Uncertainty analysis | 0 | 37 | 107 | 172 | 47 | 102 | 60 | 68 | 593 |
| Risk analysis | 0 | 52 | 156 | 187 | 49 | 119 | 89 | 97 | 749 |
| CAD * | 0 | 0 | 41 | 41 | 29 | 41 | 10 | 29 | 191 |
| Finite element | 12 | 12 | 14 | 14 | 0 | 14 | 12 | 12 | 90 |
| Simulation | 13 | 162 | 502 | 570 | 204 | 475 | 326 | 138 | 2390 |
| Energy simulation | 12 | 26 | 63 | 61 | 33 | 63 | 40 | 31 | 329 |
| Decision-tree | 0 | 10 | 111 | 100 | 64 | 99 | 47 | 99 | 530 |
| Fuzzy | 7 | 16 | 159 | 190 | 40 | 123 | 115 | 79 | 729 |
| Genetic algorithm | 7 | 65 | 189 | 169 | 33 | 196 | 102 | 21 | 782 |
| Heuristic | 0 | 14 | 150 | 148 | 81 | 162 | 107 | 43 | 705 |
| Markov chain | 0 | 36 | 37 | 37 | 33 | 40 | 20 | 0 | 203 |
| Neural network | 19 | 26 | 165 | 150 | 76 | 163 | 65 | 53 | 717 |
| Propagation | 7 | 46 | 200 | 314 | 146 | 197 | 157 | 84 | 1151 |
| Linear programming | 0 | 41 | 216 | 231 | 105 | 213 | 229 | 38 | 1073 |
| Nonlinear programming | 0 | 0 | 77 | 76 | 63 | 78 | 78 | 0 | 372 |
| Multicriteria | 7 | 54 | 288 | 286 | 84 | 231 | 202 | 76 | 1228 |
| Swarm | 0 | 14 | 74 | 71 | 15 | 74 | 74 | 0 | 322 |
| LCC ** | 0 | 76 | 158 | 149 | 45 | 162 | 36 | 19 | 645 |
| Eco-design | 0 | 0 | 191 | 189 | 159 | 165 | 112 | 80 | 896 |
| Eco-efficiency | 0 | 16 | 75 | 77 | 59 | 77 | 59 | 45 | 408 |
| Total, column | 96 | 831 | 3375 | 3757 | 1588 | 3183 | 2214 | 1165 |
Occurrence: ![Sustainability 10 02405 i001]() . * CAD = Computer Aided Design; ** LCC = Life Cycle Costing.
. * CAD = Computer Aided Design; ** LCC = Life Cycle Costing.
 . * CAD = Computer Aided Design; ** LCC = Life Cycle Costing.
© 2018 by the authors. Licensee MDPI, Basel, Switzerland. This article is an open access article distributed under the terms and conditions of the Creative Commons Attribution (CC BY) license (http://creativecommons.org/licenses/by/4.0/).
Share and Cite
MDPI and ACS Style
Skaar, C.; Labonnote, N.; Gradeci, K. From Zero Emission Buildings (ZEB) to Zero Emission Neighbourhoods (ZEN): A Mapping Review of Algorithm-Based LCA. Sustainability 2018, 10, 2405. https://doi.org/10.3390/su10072405
AMA Style
Skaar C, Labonnote N, Gradeci K. From Zero Emission Buildings (ZEB) to Zero Emission Neighbourhoods (ZEN): A Mapping Review of Algorithm-Based LCA. Sustainability. 2018; 10(7):2405. https://doi.org/10.3390/su10072405
Chicago/Turabian StyleSkaar, Christofer, Nathalie Labonnote, and Klodian Gradeci. 2018. "From Zero Emission Buildings (ZEB) to Zero Emission Neighbourhoods (ZEN): A Mapping Review of Algorithm-Based LCA" Sustainability 10, no. 7: 2405. https://doi.org/10.3390/su10072405
Note that from the first issue of 2016, this journal uses article numbers instead of page numbers. See further details here.