Case Report

Comprehensive Study of Reclaimed Soil, Plant, and Water Chemistry Relationships in Highly S-Contaminated Post Sulfur Mine Site Jeziórko (Southern Poland)

by
Marcin Pietrzykowski
* and
Justyna Likus-Cieślik
Department of Forest Ecology and Reclamation, Institute of Forest Ecology and Silviculture, Faculty of Forestry, University of Agriculture in Krakow, Al. 29 Listopada 46, 31-425 Krakow, Poland
*
Author to whom correspondence should be addressed.
Sustainability 2018, 10(7), 2442; https://doi.org/10.3390/su10072442
Submission received: 6 June 2018 / Revised: 2 July 2018 / Accepted: 9 July 2018 / Published: 12 July 2018
(This article belongs to the Special Issue Sulfur Compounds in a Sustainable World)

Abstract

:
The aim of the work was a comprehensive study of the soils (pH, EC, SOC, NT, ST), surface waters (pH, EC, Ca2+ Mg2+, Na+, NO3−, SO42−, Cl, HCO3), and reactions of trees and herbaceous plants in the restored forest ecosystem of a former sulfur mine. Common birch and Scots pine growth reaction, vitality (according to IUFRO standards- International Union of Forest Research Organizations), nutrient supply (Na, K, P, Ca, Mg, K), and Calamagrostis epigejos (L.) Roth chemical composition (Na, K, P, Ca, Mg, K) were assayed. The chemistry dynamics (pH, EC, DOC, NT, Ca, Mg, and S at the beginning and end of the experiment) of soil leaching and the sulfur load leached from the sulfur-contaminated soil substrates were evaluated. The remediation effects of birch and pine litter were assayed in an experiment under controlled conditions. It was found that reclamation was effective in the majority of the post-mining site; however, hotspots with sulfur contamination reaching even 45,000 mg kg−1, pH < 2.0 and electrical conductivity (EC) of 6500 µS cm−1 were reported. Surface waters typically displayed elevated concentrations of sulfate ions (average 935.13 mg L−1), calcium ions (up to 434 mg L−1), and high EC (average 1797 µS cm−1), which was related both to sulfur contamination and the sludge lime that was used in neutralization. Calamagrostis epigejos was found to be a species that adapted well to the conditions of elevated soil salinity and sulfur concentration. It was observed that the application of organic matter had a significant beneficial impact on the chemistry of soil solutions, but did not show a remediation effect by increased sulfur leaching in a short-term study.

Graphical Abstract

1. Introduction

Currently, Poland is the only country where native sulfur is extracted on a large scale. In 2015, 627.6 thousand Mg sulfur was mined [1,2]. Sulfur deposits occur in southern Poland, in the areas near Tarnobrzeg (Osiek, Baranów, Machów, Jeziórko deposits), Staszów (Solec and Grzybów deposits), and Lubaczów (Basznia field) [2]. Sulfur deposits were first extracted in the 1960s using the open strip mining method (Piaseczno Mine and Machów Mine), and the borehole Frasch method [3,4]. This method of melting an underground sulfur deposit was patented by Herman Frasch in 1894 in the United States. It involves an injection of superheated water at a temperature of 140–160 °C into a sulfur field. Subsequently, sulfur is melted underground and pumped to the surface in liquid form [5]. This method was used in Poland in the following mines: Grzybów (1966–1996), Basznia (1977–1993), Machów II (1985–1993), Jeziórko (1967–2001), and around the world in mines in the United States (USA) (until 2000) and Iraq (until 2003) [6]. Currently, the Frasch method is used in the Osiek mine in Poland (since 1993), and in Mexico (since 2010) [6,7].
The reclamation of sulfur-bearing sites, in particular ones mined using the Frasch process, is very difficult and complex, as it leads to significant and multifactorial transformations of the environment, including chemical contamination with sulfur, acidification, geomechanical deformations of the Earth’s surface in the form of subsidence, hydrological changes in the form of flooding events, changes in the direction of watercourses, and acid mine drainage (AMD) [3]. A characteristic feature of the distribution of contaminated sites and soil acidification in the areas mined using the Frasch process is the occurrence of hotspots resulting from numerous liquid sulfur leakages due to borehole and pipeline technological problems (transmission installations [4]). Furthermore, in post-mining sites, liquefied sulfur spills uncontrollably from technological storage sites, thus heavily contaminating the adjacent areas [8].
Although reclamation requires considerable technical involvement in post-mining sites, the remaining dispersed hotspots become an example of microhabitats with excessive sulfur concentration, constituting new conditions for animals, vegetation, and microorganisms. Thus, research conducted in such sites provides a unique opportunity to learn about the response and the rate of forest ecosystem restoration, including an assessment of tree and herbaceous plant reactions to environmental stress with heavy soil and water sulfur contamination.
The paper has been produced to fill a gap on the subject of excessive sulfur concentration in soil, and the negative sulfur impact on vegetation. In the previous century, increased concentrations of SO2 in the atmosphere associated with fossil fuel combustion, wet deposition, and acid rain were reported and frequently described [9]. Despite a reduction of sulfur deposition in recent decades, sulfur-contaminated soils may still be found, and in consequence, there is still a need to study the negative impact of sulfur excess on soil properties [10]. The literature on the subject indicates that sulfurous and acidic soils occur in industrialized regions, especially in the USA, Canada, Southern China, and in places located in the vicinity of sulfur mines or sour gas processing plants and former lignite coal mining sites [11,12,13]. However, these are contaminants with sulfur compounds rather than with mineral (solid) sulfur. There is no literature at all on soil contamination with mineral sulfur, or if it exists, articles are published in local journals, and are not available online. Severe soil contamination with mineral sulfur occurs at sites following sulfur mining using the Frasch process.
The aim of the work was a comprehensive study of the soils, surface waters, and reactions of trees and herbaceous plants in the restored forest ecosystem on the former sulfur mine. The data is based on collected preliminary study results that were partly and separately published. Soil contamination and plant reactions were analyzed both spatially in a network of monitoring points covering over 200 ha of reclaimed land, as well as in a reductionist approach of study plots representing various categories of ecosystem degradation. The chemistry of surface water was also analyzed as an indispensable element of the restored ecosystem in spatial and seasonal variations. The results were supplemented by a simulation of the rate of sulfur leaching from soils and changes in soil solution chemistry in the leaching experiment conducted under controlled conditions.

2. Materials and Methods
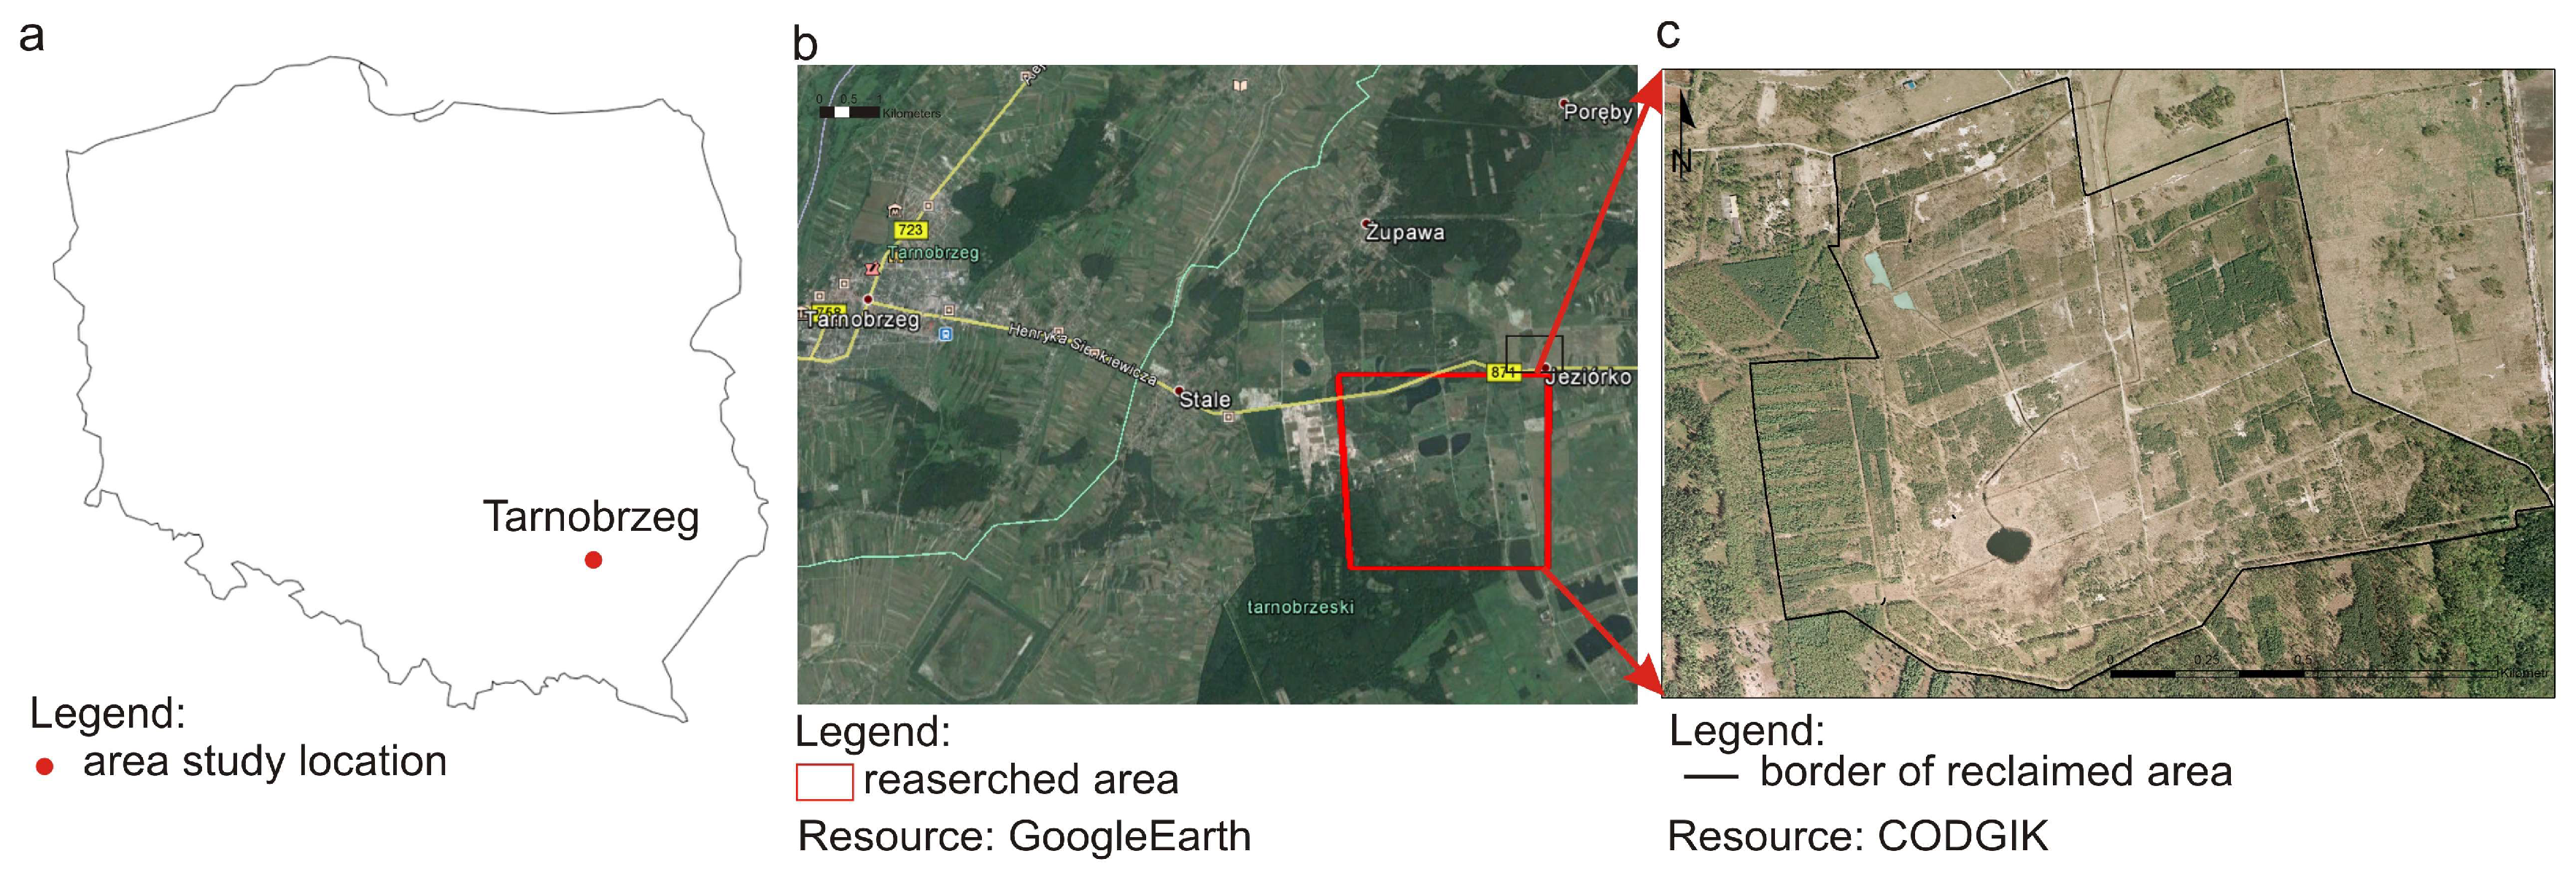
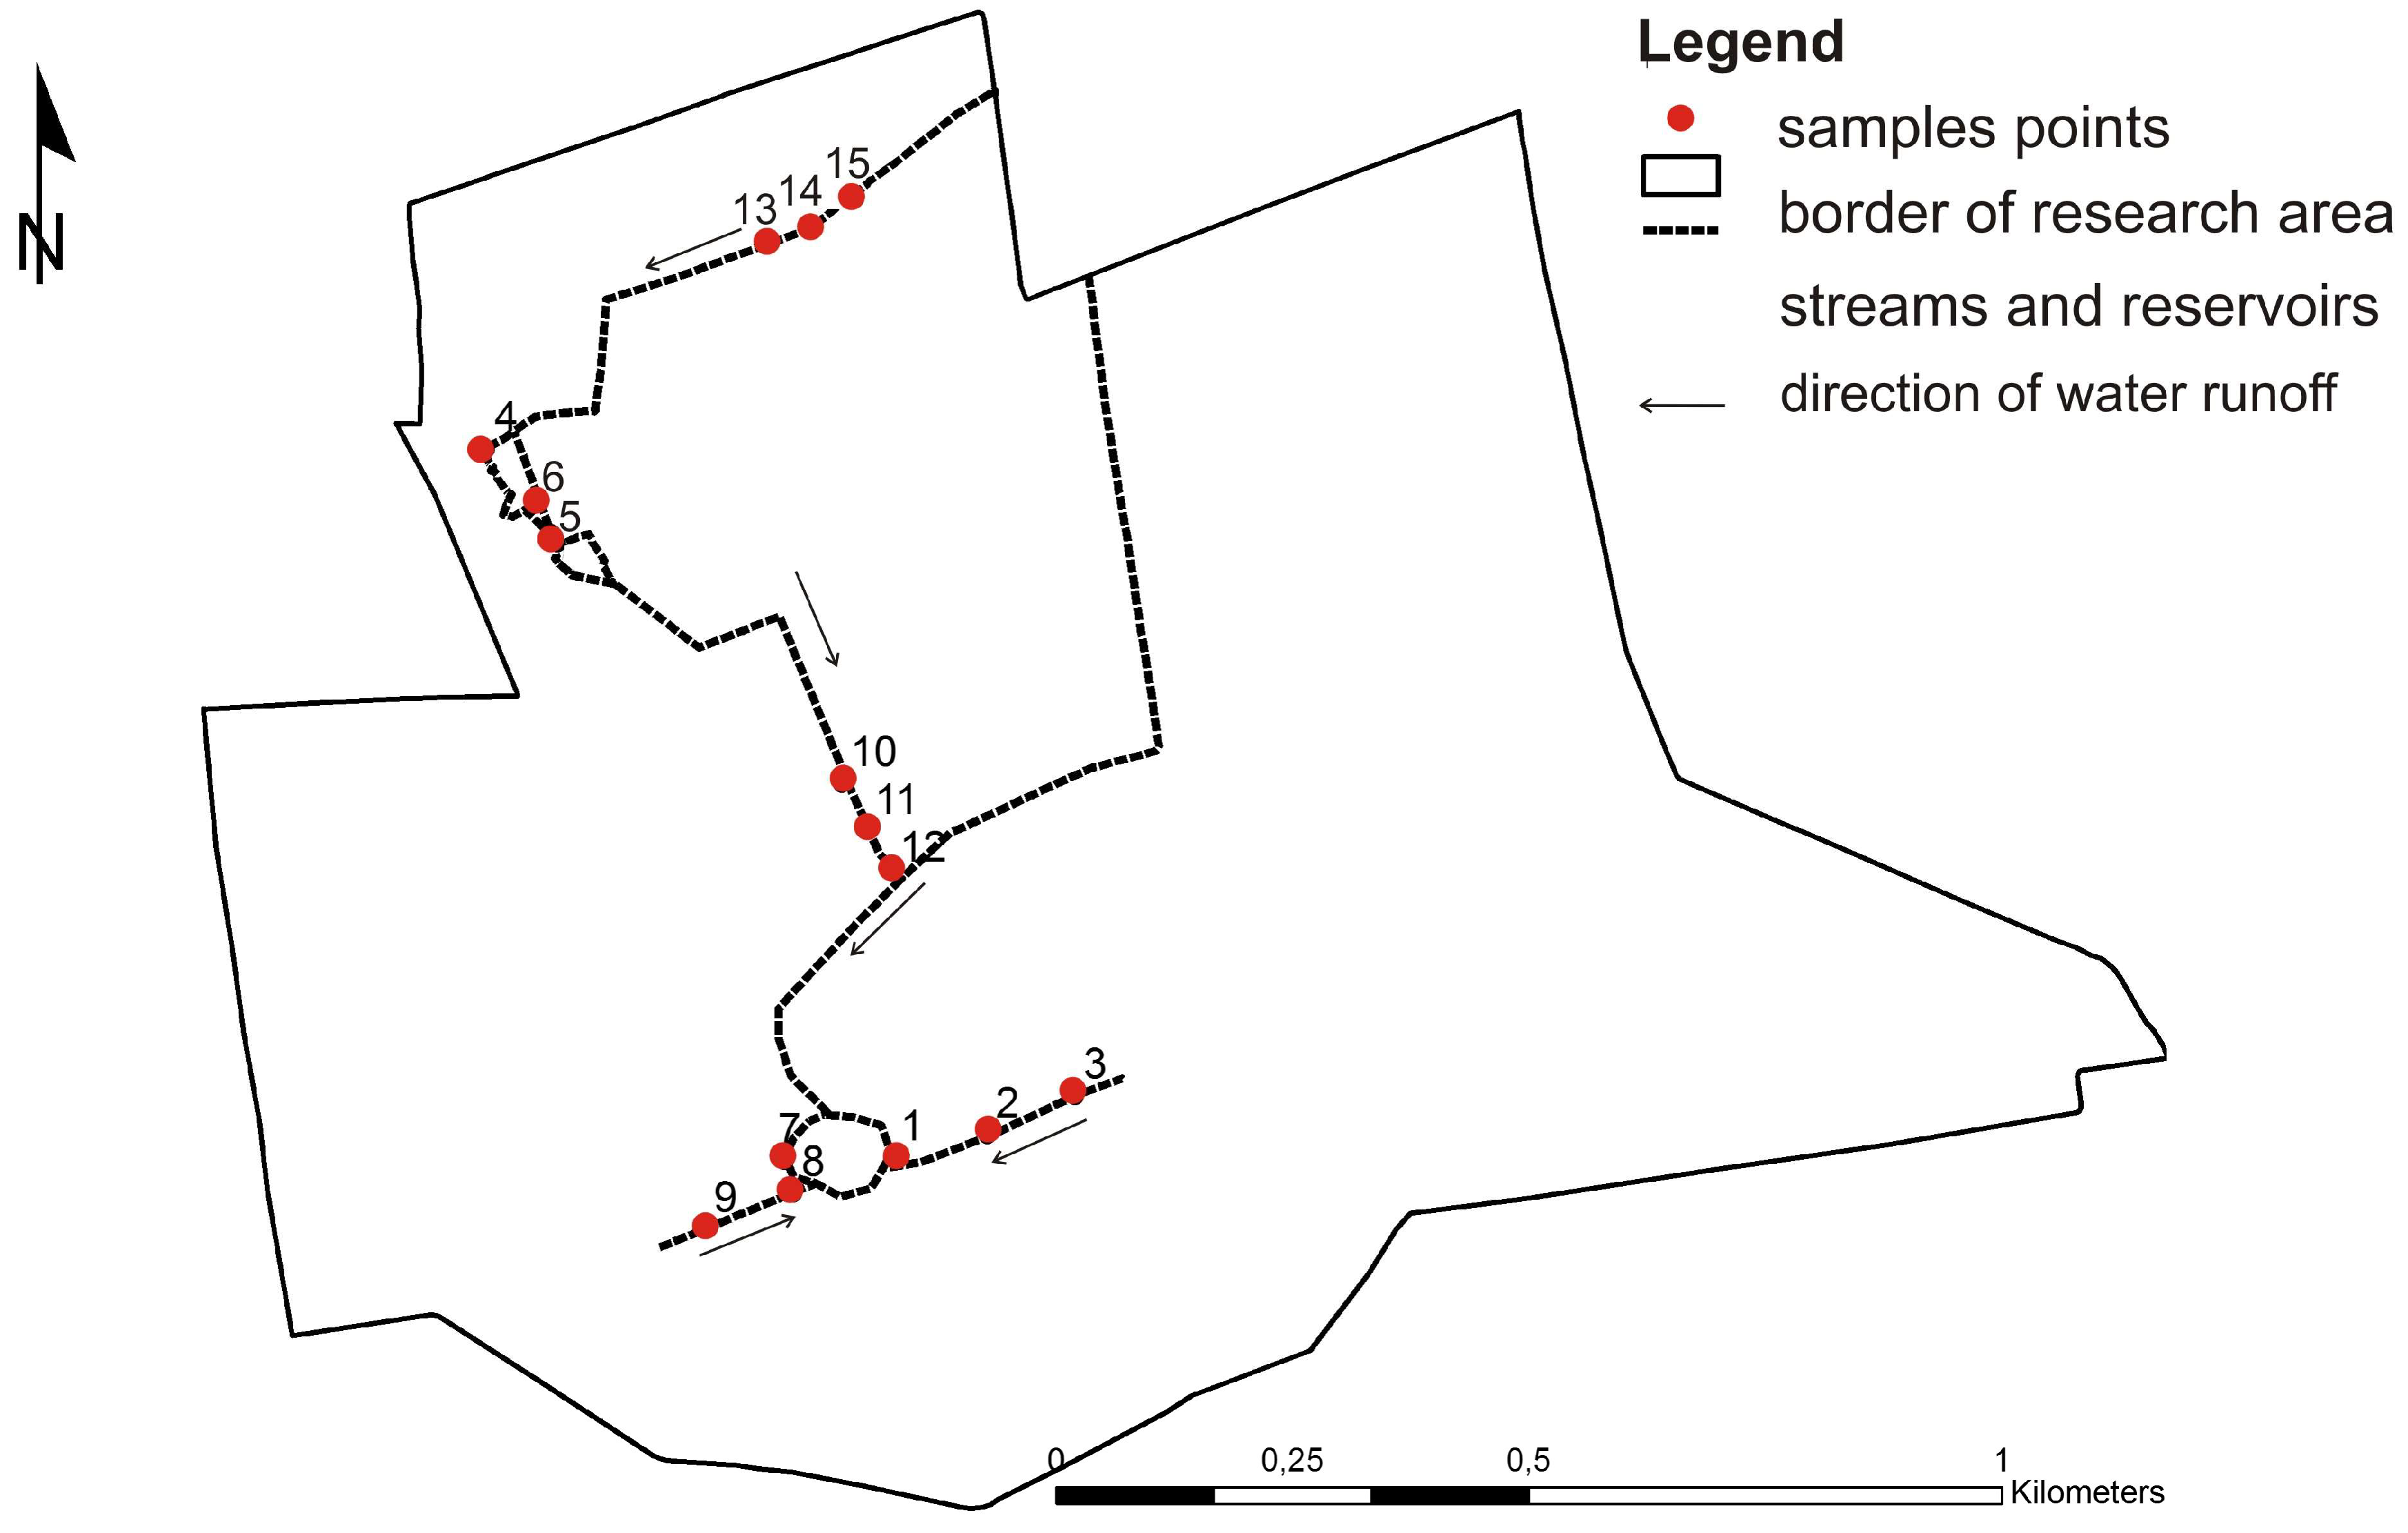
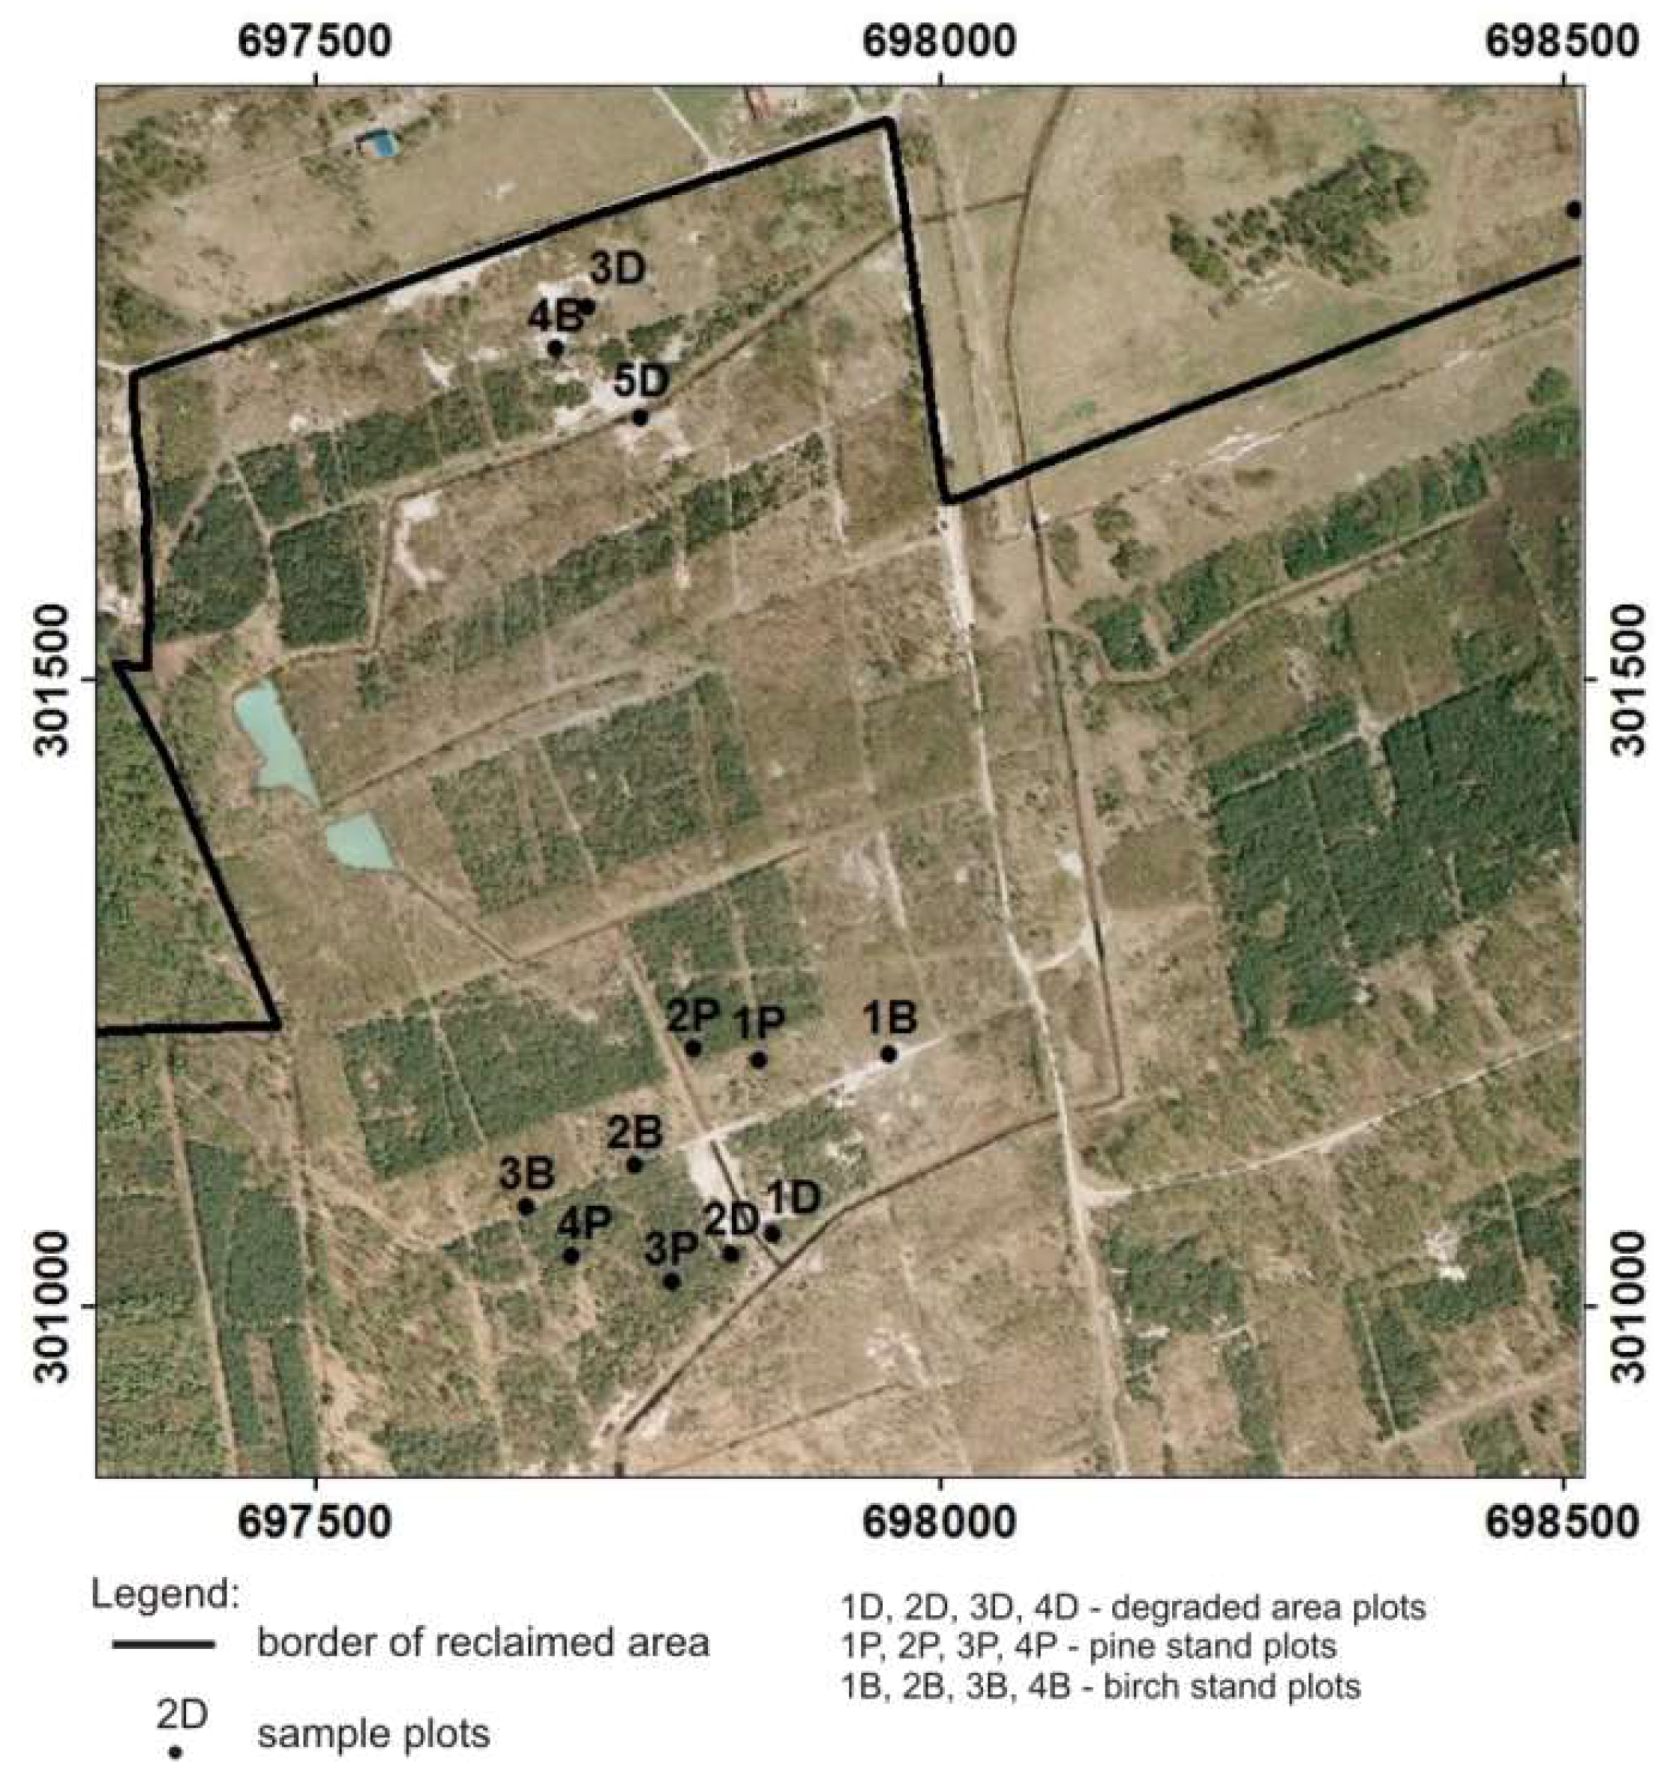
2.1. Study Site

The study was conducted on reclaimed and reforested mining areas of the former Jeziórko sulfur mine (FSMJ) (Southern Poland, 50°32′34” N, 21°47′46” E) (Figure 1). The region has an average annual temperature of +8.2 °C (−1.6 °C in January, and +18.7 °C in July), and average annual precipitation ranges from 550 to 650 mm. The growing season lasts from 200 days to 220 days per annum.
Reclamation treatment of the FSMJ site started in 1993. Of the over 2000 ha previously occupied by the mine, over 700 ha in total were reforested, of which 216.5 ha—where this research was conducted—are currently managed by State Forest National Forest Holding (Figure 1b). Reclamation treatment included removing the mine infrastructure (such as mine wells, pipelines, and access roads), improving the hydrographic conditions, landscaping, neutralizing the pH of sulfurous and excessively acidic soils by liming (average 400–500 Mg ha−1 of sludge lime), fertilizing (70 kg ha−1 P2O5, 60 kg ha−1 K2O), and sowing grass seeds [4]. These treatments were followed by reforestation, mainly with one-year-old Scots pine seedlings (Pinus sylvestris L.) and an admixture of silver birch (Betula pendula Roth) and boreal oak (Quercus rubra L.) [3].

2.2. Field and Laboratory Study

As part of field work, a total of 88 sampling points were located in the FSMJ site in a regular grid of squares with sides measuring 150 m (Figure S1). The sampling points were first identified on the map using ArcGIS software (ESRI Poland (Environmental Systems Research Institute), Warszawa, Poland) [14], and then targeted and stabilized using the Garmin GPS receiver (GPSMAP® 60CSx, Garmin Ltd., Olathe, KS, USA).
Soil samples were collected from the top layer (0–20 cm) of the monitoring points [15]. In the laboratory, the collected soil samples were analyzed for grain size using the Fritsch GmbH Laser Particle Sizer ANALYSETTE 22 (Fritsch GmbH, Idar-Oberstein, Germany); pH was measured potentiometrically in 1 mol L−1 KCl (maintaining a ratio of soil:solution 1:2.5), and electrical conductivity (EC) was measured at a ratio of soil:solution 1:5. Soil organic Carbon (SOC), total Nitrogen (NT), and total Sulfur (ST), were measured with the TruMacLeco CNS analyzer (Leco Corporation, Saint Joseph, MI, USA) [16]. The degree of soil sulfur contamination was assessed on the basis of the guidelines of the Institute of Soil Cultivation and Fertilization Institute of Crop and Soil Fertilization (IUNG, Poland) [17].
Samples of surface water were collected from 15 monitoring points on reservoirs and watercourses (Figure 2) in summer, autumn, winter, and spring. The water samples were analyzed for pH, EC, and ionic content (Ca2+ Mg2+, Na+, NO3−, SO42−, Cl, HCO3) on a Dionex Ion Chromatography 5000 apparatus [18,19]. The spatial variability of ionic content and hydrogeochemical classification were assessed according to Szczukariew–Prikłoński classification [20].
Based on GPS measurements, the exact position of the research sites was determined, and data was collected to make a photo-interpretation key (geotagging of photographs). After determining land-cover classes (orthophoto screen vectorization in the ArcMap ArcGIS 10.2, Esri program [14]), patches of microhabitats were selected in three categories (Figure 3), i.e., an effectively reclaimed and forested site category (pine P and birch B stands, four plots each), and a degraded D stand with little herbaceous vegetation cover and occasional trees from natural succession (four plots). Detailed research was conducted on 0.01-ha (r = 5.64 m) circular study plots, from which composite soil samples were collected from a 0–5 cm and 5–40 cm horizon (sampling at five points arranged in a regular pattern: one point in the middle, and four in the corners of the square, as inscribed in the circular study plots). Next, pH, EC, ST, SOC, and NT were analyzed in the samples, according to standard methodology (described previously). The degree of herbaceous plant cover on study plots was determined using the Braun–Blanquet scale, and an inventory of the existing trees was made. DBH and height Ht were measured in case of trees.
Samples for the chemistry of foliage and the nutrient supply assessment of plants were collected from sites in previously defined categories (D, P, B), including one-year-old (current year Pc) and two-year-old (Pc+1) Scots pine needles and silver birch leaves. Foliage samples were collected from tree tops (southwest exposition) growing on reclaimed and reforested sites (pine and birch stands, i.e., P and B category plots). Also, mixed samples (one per each plot) of wood small-reed leaves (Calamagrostis epigejos (L.) Roth) were collected. This was because it was an undergrowth species that occurred in every research plot. The content of N and S in the plant tissue samples was determined using LecoTruMac, while the other macroelements (Na, K, P, Ca, Mg, and K) were determined after mineralization in a mixture of HNO3 and HClO4 (in ratio of 3:1) with an ICP OES ICAP 6000 Series spectrophotometer (Thermo Fisher Scientific, Waltham, MA, USA) [16].
Spatial imaging (map compositions, Figures S1 and S2) of variations in the studied soil features, i.e., sulfur concentration in the soil, pH, and EC, and herbaceous and woody vegetation surface cover, was obtained with the IDW (inverse distance weighted) interpolation algorithm in ArcMap ArcGIS 10.2 [14].
Using the Statistica 12 software (StatSoft Polska, Kraków, Poland) [21], correlations between the concentration of ST in topsoil horizons and pH, EC, and vegetation surface cover were investigated. The correlation between soil chemistry and plant macronutrient supply was also studied using the ANOVA test and Pearson correlation.
As part of the studies on the biogeochemical transformations of mineral sulfur and soil dissolution chemistry, changes in the highly contaminated environment of the experiment under controlled conditions were planned. In the experiment, the possible inhibitory impact of organic matter in the form of litterfall collected from birch and pine stands was taken into account. We planned two different variants of soil substrate sulfur contamination: LS (low sulfur substrate)—average 5090 mg kg−1 S, and HS (high sulfur substrate)—42,500 mg kg−1 S. At the beginning of the experiment, the input (starting) properties of the substrates prepared and used in the experiment were determined (soils: grain size, pH, EC, ST, SOC, NT, Ca, and Mg content, litter: pH, S, N, C, Ca, and Mg content using the methodology described previously, and the C:N ratio was calculated [22]). Soil material was collected in the post-mining site (substrates from plots in the previously described D category—degraded [3]). Litterfall was collected from managed stands to eliminate the impact of sulfur from the mine. In the course of the experiment, the soil–litter composites were rinsed with 100 mL of distilled water twice a week, and once a week, the filtrate was collected to determine the pH, EC, dissolved organic carbon (DOC), NT, Ca, Mg, and S content [22]. After the experiment, the properties of the used substrates and litter were analyzed again (substrate: pH, EC, ST, SOC, NT, Ca, and Mg content; litter: pH, S, N, C, Ca, and Mg content, and the C:N ratio was calculated) [22].

3. Results

3.1. Soil pH and Contamination Spatial Variability

Soil pHKCl varied from 2.6 to 7.6 (Table 1, Figure S2a). Sampling points with acidic pH (pHKCl from 2.7 to 6.5) constituted 49%, while neutral pH (pHKCl from 6.6 to 7.2) and alkaline pH (pHKCl >7.3) were found on 38% and 13% of the study area, respectively. The soil EC ranged from 15 μS cm−1 to 2080 μS cm−1 (Table 1, Figure S2b). Only at two monitoring points was the EC value exceeded at 2000 μS cm−1, which according to the FAO (Food and Agriculture Organization of the United Nations) guidelines [23] means that the growth of sensitive plants may be impeded. The ST content in the topsoil layers was from 10 mg kg−1 to 45,740 mg kg−1 (Table 1). ST content, which is similar to the natural content according to IUNG guidelines [17] was found on 35% of the analyzed site. According to these guidelines, elevated ST content was reported on 28%, high ST content (slight contamination) was reported on 12%, and very high content (heavy S contamination) was reported on 26% of the study area (Figure S2c). Extreme sulfur concentrations exceeded the highest IUNG scale by more than 10-fold. ST correlated positively with EC (r = 0.80) and pH (r = 0.42). In some spots that were extremely contaminated with sulfur, there was more than 30% herbaceous plant cover (three and four on the Braun–Blanquet scale).
The high ST concentration in the soil did not result in heavy acidification due to neutralization with high doses of sludge lime. However, high EC and limited vegetation were reported alongside a high sulfur concentration in soil samples, which may be considered a good bioindicator of ineffective reclamation.
Based on the conducted research, it may be concluded that the reclamation to forest was not fully effective due to significant sulfur contamination. However, locations with high sulfur contamination were considered hotspots (about 2% of the monitored site), and the distribution of topsoil contamination was irregular and dispersed. The most contaminated regions were concentrated mainly in the northern and central parts of the studied site.

3.2. Surface Water Chemistry Variability

The average water pH range, which was calculated on the whole database, was from pH 2.6 to 7.9 (Table 2). In the monitored site, hotspots were reported with extremely low pH values ranging from 2.6 to 3.1. Differences in pH between the studied seasons were insignificant. The average EC for the entire investigated period was 1797 µS cm−1, and ranged from 1083 µS cm−1 to 3430 µS cm−1, as shown in Table 2. According to standards [24], high EC indicating the salinity of waters is EC >1500 µS cm−1, and we found that 82% of the analyzed samples came in this category. SO42− content ranged from 472 mg L−1 to 1503 mg L−1 (Table 2). The concentration of sulfate ions in seasonal variability was four-fold to 12-fold higher than defined in the current standards [24] for good quality waters (i.e., SO42− < 138.5 mg L−1). Thus, generally, water mineralization in the studied site was high. The average total mineralization for the entire monitoring period was 1489 mg L−1. Sulfate ions (63%) and calcium ions (22%) accounted for the largest share. High SO42− ion content was related to high soil sulfation, while increased Ca2+ ion concentration was due to applying doses of sludge lime for neutralization in the course of site reclaim treatments. To sum up, the problem in the case of the investigated surface waters was mainly the outcome of extremely low pH values recorded at some points, as well as high EC and high SO42− concentration. The concentration of the remaining ions in the surface waters of the investigated site was relatively low (Table 2), and had no impact on the overall water chemical quality assessment.
SO42− and Ca2+ ions determined the chemistry and hydrogeochemical classification of water. According to Szczukariew–Prikłoński hydrogeochemical classification [20], the investigated water was mainly of sulfate–calcium class (58%). The investigated water was not natural mineral water, as indicated in Szczukariew–Prikłoński hydrogeochemical classification, but rather extensively anthropogenically transformed surface waters. Water chemistry was directly related to the specific geochemical system of the anthropogenically-transformed environment due to sulfation caused by borehole sulfur extraction and liming in the course of technical reclamation.

3.3. Soil and Vegetation Relations

It was confirmed that areas classified as degraded (D) typically displayed high sulfur contamination, i.e., from 50 mg kg−1 to 28,900 mg kg−1, acidic pH (pHKCl from 1.9 to 6.5), and high salinity (EC from 149 μS cm−1 to 1160 μS cm−1, as shown in Table 3). The soils also displayed low SOC and NT content (Table 3). Such unfavorable soil properties led to significant forest growth inhibition or even dieback. The density, i.e., the average number of trees ha−1 (N) was 612, the average DBH (diameter at breast height) was 7.7 cm, and the average height Ht was 5.5 m (Table 4). In these conditions, there is a significant inhibition of vascular plant succession (herbaceous vegetation surface cover on average 26%, as shown in Table 4). Category D surfaces are an example of inefficient reclamation, especially in terms of neutralization and the isolation of highly S-contaminated horizons. Surfaces that were classified as successfully reclaimed and reforested (categories P and B) had a lower soil sulfur concentration. In the P category, ST concentration in the soil ranged from 10 mg kg−1 to 1200 mg kg−1 (Table 3), while in the B category, it ranged from 90 mg kg−1 to even 5300 mg kg−1 (Table 3). Soil pH in these categories was also higher than in the category D, although it also varied widely from 3.9 to 7.1 and from 4.5 to 6.6 in category P and category B, respectively (Table 4). In the P and B site categories, significantly more trees with apparently better growth parameters were reported as opposed to category D, where trees were rare and deformed (Table 3).
However, it should be emphasized that category D covered a small total area of 4.39 ha in the entire facility. This, of course, compared with hundreds of effectively reclaimed hectares of land may seem little, but on the other hand, these areas represent extreme site conditions for plants, microorganisms, and animals, and the uniqueness of the reconstructed biochemical system being studied.

3.4. Foliage Chemistry and Macronutrient Supply

Macronutrient supply to trees in the reclaimed post-mining sites were generally adequate, i.e., within the ranges determined by ICP-Forest (the International Co-operative Programme on Assessment and Monitoring of Air Pollution Effects on Forests) [25]. The mean P content in birch foliage was 2320.4 mg kg−1; in pine needles (in Pc) the mean was 1348.1 mg kg−1, whereas in older needles (Pc+1), the mean was 1045.4 mg kg−1. The mean K content in birch leaves was 0.80%; in pine needles (in Pc), the mean was 0.50%, and in Pc+1, the mean was 0.50%, respectively (Table 5). The mean Ca content in birch leaves was 1.35%; in pine needles (in Pc), the mean was 0.33%, and in Pc+1, the mean was 0.75%, respectively (Table 5). The mean Mg content in birch leaves was 1526 mg kg−1; in pine needles (in Pc), the mean was 705 mg kg−1, and in Pc+1, the mean was 715 mg kg−1, respectively. The mean Na content (Na) in birch leaves was 34.9 mg kg−1; in pine needles (in Pc), the mean was 10.3 mg kg−1, and in Pc+1, the mean was 10.0 mg kg−1, respectively (Table 5). Significant differences were found in P, K, Ca, Mg, and Na content between the birch and the pine, while differences between needle ages were found only in the case of Ca (Table 5).
The highest S content was found in birch leaves (mean 1954 mg kg−1). The S content in pine needles in Pc was 1272 mg kg−1, and in Pc+1, it was 1221 mg kg−1. Significant differences were found in the S content between the species (Table 5).
The N content, as a deficient nutrient in these conditions, amounted to 1.71% in birch leaves and to 1.12% and 1.11% in pine needles for Pc and Pc+1, respectively.
In the above-ground parts of wood small-reed, a deficit of N and P was found (mean N 0.62%, mean P 904 mg kg−1 in category D; mean N 0.93%, mean P 1351 mg kg−1 in category P; and mean N 0.75 mg kg−1, mean P 1132 mg kg−1 in category B, as shown in Table 6). In category D, no elevated S content was found in wood small-reed tissue (1779 mg kg−1) compared with the other categories (2249 mg kg−1 for P and 1717 mg kg−1 for B, as shown in Table 6).
The S content in tree foliage correlated positively with ST content in the soil (r = 0.61) and EC (r = 0.68), and negatively with NT content in the soil (r = −0.66). In the case of wood small-reed on all of the plots in the site categories, linear correlations between the mentioned features did not occur. It was found that wood small-reed probably applied a strategy based on the mechanism of blocking the uptake of sulfur from highly contaminated soil. It is definitely a species that is resistant to the existing conditions of environmental stress and sulfurous soils. Thus, we found that wood small-reed, as a succession species, has a beneficial phytostabilizing impact, and may be used in the remediation of such types of soils.

3.5. Chemistry of Soil Solution in the Leaching Experiment under Controlled Conditions

It was predictable that the rate and amount of leached elements depended firstly on the amount of sulfur in the substrate (LS or HS) after 12 weeks of the experiment. In the highly sulfated HS composites, there was a significant reduction in sulfur concentration solely due to rinsing them (HS 42.521 mg kg−1, HS-c 35,634 mg kg−1, HS-B 33,247 mg kg−1, and HS-P 34,157 mg kg−1, as shown in Table 7). It was observed that despite a significant reduction in St content in the HS substrate composites, the level of sulfation was still very high, and exceeded the values provided by IUNG standards (the Institute of Crop and Soil Fertilization). The S content is very high (heavy contamination), i.e., above 1000 mg kg−1 [17] up to 35-fold. The results of the experiment in a less sulfated variant (LS) indicate that the rinsing of substrates has a significant impact on a big reduction of EC in the substrate (LS 1.87 mS cm−1, LS-c 0.39 mS cm−1, LS-B 0.59 mS cm−1, and LS-P 0.23 mS cm−1, as shown in Table 7). It was shown that pine litter has a significant impact on raising the pH of the soil substrate (LS-B 2.1 and LS-P 2.9, as shown in Table 7); however, it still remained phytotoxic (pH below 3.0). Low soil substrate pH during litter decay is a normal phenomenon in natural conditions, and it is due to the organic acids that are released, causing a drop in soil pH [26].
It was found that birch litter resulted in elevated Nt leaching from HS and Mg leaching from both substrates (Table 8). At the beginning of the experiment, birch litter was richer in Nt than pine litter; therefore, there was more leaching of this element in the case of composites with an addition of birch litter.
The obtained experiment results indicated that the application of litter, especially in the case of the most sulfur-contaminated soil, is not sufficient for detoxification in the short term (12 weeks). Probably in hotspots where previous neutralization was ineffective or not thorough, it will have to be repeated with higher doses of the neutralizer in the form of sludge lime, as was done on most of the former Jeziórko mine site [4].

4. Discussion

The total S content in uncontaminated soil usually ranges from 100 mg kg−1 to 1000 mg kg−1 [17,28]. The allowable level of sulfur concentration in agricultural soils is 500 mg kg−1 [29]. This level has been exceeded at 33 of the 86 points in the FSMJ. In areas susceptible to elevated sulfur content, such as in the vicinity of sulfur mines, processing plants, or in industrial areas, the recommended levels are frequently significantly exceeded. An example of a sulfur-contaminated site is the industrial areas of Alberta, Canada (a sour gas processing plant). There, the level of sulfur concentration in the soil ranged from 500 mg kg−1 to 6000 mg kg−1 [30]. In our study of the FSMJ, sulfur concentrations in the topsoil horizons reached up to 45,740 mg kg−1, exceeding by 45-fold the typical soil levels provided by Kabata-Pendias et al. [17], Stevenson and Cole [28], and by 90-fold the standards provided by the Canadians [29]. This demonstrates that the extensive remediation efforts were not sufficient at many spots of the sampled area.
High sulfur concentrations in the soil are usually associated with acidification and low pH [31]. In areas affected by lignite mining, with Miocene deposits and in areas with iron and gold mines, high sulfur contamination is often connected with iron, aluminum, or ferric sulfate [11,32,33]. High concentrations of Al and Fe, which are common in post-mining soils, have a strong negative impact on soil biota and vegetation [34]. In these studied soils in the reclaimed FSMJ area, Al and Fe concentrations were not excessive when compared with values for natural soils, which are considered to be 10,000 mg kg−1 to 35,000 mg kg−1 for Al, and 300 mg kg−1 to 50,000 mg kg−1 for Fe [35]. The sulfur in these studied soils was found to be native (elemental) sulfur, and its origin is connected with the transformation of gypsum and anhydrite deposits in a specific underground environment. Thus, the nature of soil sulfur contamination here is different than in the case of sulfur derived from the weathering of pyrites and marcasites, so Al and Fe soil concentrations in the FJSM area are not a limiting factor for vegetation. In the FSMJ, there were no significant correlations between soil sulfur concentration and soil acidification because of the impact of neutralization with flotation lime in various doses during the initial reclamation process in this area. Sulfur concentration in the topsoil had no relation to vegetation cover and abundance, and it proved impossible to determine the direct toxic effect of sulfur concentration on vegetation. In the FSMJ, many points were found where sulfur content in the topsoil horizons exceeded 2500 mg kg−1 and where pH was over 7.0 [4]. In some spots that were heavily contaminated with sulfur, there was up to 70% herbaceous vegetation surface cover. This could be, as mentioned above, a result of using high doses of flotation lime to neutralize the sulfur during the initial reclamation, which clearly could increase the pH of the soil if properly applied. Obviously, other soil characteristics, including available water, soil compaction, and nutrient availability, may be limiting factors for vegetation cover. However, healthy tree stands (points with pine and birch stands) were observed in some of the investigated soils, where high soil sulfur concentration was a significant differing factor in comparison to the degraded sites (points without vegetation cover).
Based on data from an analysis of dry needle weight, it may be concluded that tree supply with nutrients Ca, Mg, and K is suitable, while N is a deficit nutrient for the trees occurring in the investigated areas. The content of biogenic elements in the foliage of the investigated tree species is within the range provided by ICP-Forest [25] as excellent element content [7]. With regard to the nutrition of pine and birch trees on reclaimed land from the Lusatian Mine District (Eastern Germany) [36], tree supply with N in the investigated former sulfur mine sites was exceedingly low for the pine (supply grade 1), and low for the birch (supply grade 2). P, K, and Mg content in foliage was sufficient or good [7]. In assessing forest tree stand nutrition, it is also important to examine the proportions between macronutrients, especially the N:P ratio [37]. The N:P ratio in pine needles was 7.6 (in birch leaves), 8.3 (Pc), and 10.6 (Pc+1) [7]. The N:P ratio in pine needles obtained by Pietrzykowski et al. [38] in the former Piaseczno sulfur mine was 10. Pietrzykowski et al. [38] found no significant differences between the N:P in mine land and the control (managed stands in natural habitats). The results obtained in the FJSM yielded similar values as in the cited work. It may be thought that supply in biogenic element is rather good.
Calamagrostis epigejos is a plant that Holub found to be highly tolerant to abiotic stress factors [39]. Calamagrostis epigejos is a dominant species in central European post-mining lands at the initial successional stage [40]. We indicated that Calamagrostis epigejos is tolerant to high S concentrations in the soil. In degraded areas (elevated sulfur concentration), higher amounts of this element were not reported in the above-ground tissue parts of the plant compared with afforested areas, which displayed a lower sulfur content in the soil. In areas with pine stands (category P), N content in above-ground parts of Calamagrostis epigejos was similar to the content that was observed in natural habitats in the Podyjí National Park (0.84–1.03% N, where they amounted to between 1600–1700 mg kg−1 P) [39].
The condition of the surface waters was rated as good, but there were some points with low pH, high EC, and high SO42− concentration (hotspots). High concentrations of Ca2+ ions were found (in all of the sampling zones), which was associated with the release of this ion into the water from lime sludge for the neutralization and isolation of sulfur soils. Local hotspots with a low pH and high sulfate concentration indicated an AMD threat, which should be monitored.
The results after 12 weeks of the experiment conducted under controlled conditions show that the application of organic matter, especially in the case of the soils that were the most contaminated with sulfur, is not sufficient for fast detoxification. The results indicate that the rate and amount of the leached elements depended primarily on the amount of sulfur concentration in the substrate. Birch litter intensified Nt leaching from the substrate with HS, while Mg did likewise in LS and HS. In the experiment with rinsing technosol substrates and litter application in controlled conditions, Woś and Pietrzykowski [21] showed a significant impact of birch litter on the intensification of soil-forming processes and increased leaching of DOC, Nt, and Mg. It is obvious that the application of organic matter, irrespective of its type, has a significant impact on the rate of DOC leaching. Menyailo et al. [41] found that some species affected soil pH, DOC, and Mg content, but did not observe the impact of individual species on Ca and Nt content in soils. Also, Chodak and Niklińska [42] found that tree species had a significant impact on the chemical and microbial properties of mine soils, mainly through pH changes with SOC and Nt content. Apparently, the load of base cations contained in the litter was not enough to neutralize the toxic acidity of the investigated substrates. To mitigate the negative effects of excessive sulfur concentration in soil associated with the sulfur industry, the use of lime (limestone, hydrated lime, quick lime) is recommended [43]. McTee [44] reported that CaCO3 application was the most efficient way to improve the ecological properties of acidic soils contaminated with elemental sulfur. Although the pH of the substrates increased over 12 weeks of the experiment, it was still within the range of toxic values, and soil pH was found to be the major factor affecting soil microorganisms [45].
Probably in hotspots where the neutralization was ineffective or not thorough enough, it would be necessary to re-apply the process, taking into account higher doses of flotation lime, as has been done so far in most areas of the former Jeziórko sulfur mine [4]. In the next stage, it would be possible to introduce afforestation, which will gradually introduce litterfall and organic matter, which play a key role in soil-forming processes. Soil organic matter, even in its initial phase of accumulation, plays an important role in the nutrient balance in newly developed ecosystems on reclaimed and afforested post-mine sites [18]. Decaying organic matter and biochemical processes produce more intensive leaching and displacement of macronutrients into the soil profile, and soil development will occur, but without neutralization, it will be a very long-term process.

5. Summary and Conclusions

Based on comprehensive research, it was concluded that on reclaimed and afforested areas of the Jeziórko mine:
  • Hotspots that are highly contaminated with sulfur still occur. The hotspots cover a relatively small area of about 2% of the monitored site (216.5 ha). However, they typically display a significant disturbance of soil and surface water chemistry, affecting the reaction of vegetation.
  • The investigated surface waters mostly display relatively high pH (6.5 on average). Only in several points (three out 15), pH ranged from 2.6 to 3.1, indicating heavy acidification and AMD risk, so the area must be monitored.
  • It was found that at sulfur concentration in soils of up to 3% after suitable neutralization with sludge lime (at a minimum dose of 500 Mg kg−1), the introduced birch and pine stands displayed good growth parameters and viability. The remaining ones occur in spots constituting about 2% of heavily contaminated sites, where neutralization was not done properly. In order to introduce vegetation and achieve a satisfactory yield, thorough neutralization treatment should be repeated.
  • Wood small-reed proved extremely resistant to sulfur contamination and the relatively high salinity of soils, and it occurred even on extremely sulfated soils. Therefore, there is a perspective and an indication of the use of this species in the natural succession of similar sites as an alternative temporary biological stabilization.
  • Soil detoxification will not be achieved without neutralization. Changes in the chemistry of soil solution after the application of organic matter were due to the process of litter mineralization and the leaching of nutrients. This effect was more pronounced in the case of birch litter application, where more intensive nitrogen and magnesium leaching took place, which is important in the perspective of soil-forming processes and plant nutrition.

Supplementary Materials

The following are available online at https://www.mdpi.com/2071-1050/10/7/2442/s1.

Author Contributions

Conceptualization, Methodology, Resources, Formal Analysis and Manuscript Writing, Project Administration, Funding Acquisition M.P. and J.L.-C. in equal participation; Software, Graphical preparation and Visualization, Field and Laboratory studies J.L.-C.

Funding

The study were financed by Polish Ministry of Science and Higher Education within the framework of 2016–2018 Statutory Founds (DS ZEkLiR 3420, and BM 4444, BM 4544).

Acknowledgments

We would like to express our gratitude to Marcin Chodak (AGH Krakow) for his kind support in supplying the data of results of microbiological analysis and many critical tips during the manuscript preparation. Special thanks to Hubert Klubekforest officer of Federal Forest Lasy Państwowe for his excellent and huge support during field studies.

Conflicts of Interest

The authors declare no conflict of interest.

References

  1. USGS. 2014 Minerals Yearbook. Sulfur 9Advance Release; U.S. Department of the Interior: Washington, DC, USA; U.S. Geological Survey: Reston, VA, USA, 2014. Available online: https://minerals.usgs.gov/minerals/pubs/commodity/sulfur/myb1-2014-sulfu.pdf (accessed on 6 February 2017).
  2. PGI. Polish Geological Institute National Research Institute. Available online: http://geoportal.pgi.gov.pl/surowce/chemiczne/siarka (accessed on 6 February 2017).
  3. Likus-Cieślik, J.; Pietrzykowski, M.; Śliwińska-Siuśta, M.; Krzaklewski, W.; Szostak, M. A preliminary assessment of soil sulfur contamination and vegetations in the vicinity of former boreholes on the afforested post-mine site Jeziórko. Geol. Geophys. Environ. 2015, 41, 371–380. [Google Scholar] [CrossRef]
  4. Likus-Cieślik, J.; Pietrzykowski, M.; Szostak, M.; Szulczewski, M. Spatial distribution and concentration of sulfur in relation to vegetation cover and soil properties on a reclaimed sulfur mine site (Southern Poland). Environ. Monit. Assess. 2017, 189, 87. [Google Scholar] [CrossRef] [PubMed]
  5. Ober, J.A. Materials Flow of Sulfur; Open-File Report 02–298; U.S. Geological Survey: Reston, VA, USA, 2002. Available online: https://pubs.usgs.gov/of/2002/of02-298/ (accessed on 7 February 2017).
  6. TSI. The Sulfur Institute. Available online: http://www.sulfurinstitute.org (accessed on 7 February 2017).
  7. Likus-Cieślik, J.; Pietrzykowski, M. Vegetation development and nutrients supply of trees in habitats with high sulfur concentration in reclaimed former sulfur mines Jeziórko (Southern Poland). Environ. Sci. Pollut. Res. Int. 2017, 24, 20556–20566. [Google Scholar] [CrossRef] [PubMed] [Green Version]
  8. Likus-Cieślik, J.; Pietrzykowski, M. Ocena hydrochemiczna wód powierzchniowych na zrekultywowanym i zalesionym obszarze kopalni siarki “Jeziórko”. In Współczesne Problemy Ochrony Środowiska IV; Czop, M., Kajda-Szcześniak, M., Eds.; Katedra Technologii i Urządzeń Zagospodarowania Odpadów, Politechnika Śląska: Gliwice, Poland, 2017; pp. 41–47. ISBN 978-83-930232-6-4. (In Polish) [Google Scholar]
  9. Zhao, K.J.; McGrath, S.P.; Blake–Kalff, M.M.A.; Link, A.; Tucker, M. Crop responses to sulfur fertilization in Europe; International Fertiliser Society: York, UK, 2002; p. 28. ISBN 978-0853101406. [Google Scholar]
  10. Stern, D. Global sulfur emissions from 1850 to 2000. Chemosphere 2005, 58, 163–175. [Google Scholar] [CrossRef] [PubMed]
  11. Katzur, J.; Haubold-Rosar, M. Amelioration and reforestation of sulfur ous mine soils in Lusatia (Eastern Germany). Water Air Soil Pollut. 1995, 91, 17–32. [Google Scholar] [CrossRef]
  12. Larssen, T.; Carmichael, G.R. Acid rain and acidification in China: The importance of base cation deposition. Environ. Pollut. 2000, 110, 89–102. [Google Scholar] [CrossRef]
  13. Liu, K.H.; Fang, Y.T.; Yu, F.M.; Liu, Q.; Li, R.F.; Peng, S.L. Soil Acidification in Response to Acid Deposition in Three Subtropical Forests of Subtropical China. Pedosphere 2010, 20, 399–408. [Google Scholar] [CrossRef]
  14. Esri. 2014. ArcMap-ArcGIS 10.2 (software system). Available online: https://www.esri.pl/ (accessed on 10 July 2018).
  15. Race, M.; Ferraro, A.; Fabbricino, M.; La Marca, A.; Panico, A.; Spasiano, D.; Tognacchini, A.; Pirozzi, F. Ethylenediamine-N,N′-Disuccinic Acid (EDDS)—Enhanced Flushing Optimization for Contaminated Agricultural Soil Remediation and Assessment of Prospective Cu and Zn Transport. Int. J. Environ. Res. Public Health 2018, 15, 543. [Google Scholar] [CrossRef] [PubMed]
  16. Pietrzykowski, M. Soil quality index as a tool for Scots pine (Pinus sylvestris) monoculture conversion planning on afforested, reclaimed mine land. J. For. Res. 2014, 25, 63–74. [Google Scholar] [CrossRef]
  17. Kabata-Pendias, A.; Piotrowska, M.; Motowicka-Terelak, T.; Maliszewska-Kordybach, B.; Filipiak, K.; Krakowiak, A.; Pietruch, C. The Fundamentals of Assessment of Chemical Contamination of Soils. Heavy Metals, Sulfur and PAHs; Biblioteka Monitoringu Środowiska: Warszawa, Poland, 1995; pp. 19–20. ISBN 9788386676354. (In Polish) [Google Scholar]
  18. Pietrzykowski, M.; Krzaklewski, W. Soil organic matter, C and N accumulation during natural succession and reclamation in an opencast sand quarry (southern Poland). Arch. Agron. Soil Sci. 2007, 53, 473–483. [Google Scholar] [CrossRef]
  19. Kopáček, J.; Fluksová, H.; Hejzlar, J.; Kaňa, J.; Porcal, P.; Turek, J. Changes in surface water chemistry caused by natural forest dieback in an unmanaged mountain catchment. Sci. Total Environ. 2017, 585–585, 971–981. [Google Scholar] [CrossRef] [PubMed]
  20. Macioszczyk, A. Hydrogeochemistry; Wyd. Geol.: Warszawa, Poland, 1987; p. 475. ISBN 83-220-0298-X. (In Polish) [Google Scholar]
  21. StatSoft, Inc. 2014. STATISTICA (Data Analysis Software System), v. 12. Available online: www.statsoft.com (accessed on 10 July 2018).
  22. Woś, B.; Pietrzykowski, M. Simulation of Birch and Pine Litter Influence on Early Stage of Reclaimed Soil Formation Process under Controlled Conditions. J. Environ. Qual. 2015, 44, 1091–1098. [Google Scholar] [CrossRef] [PubMed]
  23. Abrol, I.P.; Yadav, J.S.P.; Massoud, F.I. Salinity and plant growth. In Salt-Affected Soils and Their Management; FAO Soil Bulletin; FAO: Rome, Italy, 1988; Volume 39, Available online: http://www.fao.org/docrep/x5871e/x5871e04.htm#3.1.2 (accessed on 18 April 2018).
  24. RME. Regulation of the Ministry of Environment of 21 July 2016—Regulation Establishing Way of Classifying the State of Uniform Parts of Surface Waters and Environmental Quality Standards for Priority Substances (Rozporządzenie Ministra Środowiska z dn. 21 lipca 2016 r. w sprawie sposobu klasyfikacji stanu jednolitych części wód powierzchniowych oraz środowiskowych norm jakości dla substancji priorytetowych). 2016; Dz.U. 2016 poz. 1187. Available online: http://dziennikustaw.gov.pl/du/2016/1187 (accessed on 18 April 2018). (In Polish)
  25. Stefan, K.; Fürst, A.; Hacker, R.; Bartels, U. Forest Foliar Condition in Europe. Forest Foliar Coordinating Centre in Cooperating with the Australian Federal Forest Research Centre; EC-UN/ECE-FBV A; United Nations Economic Commision for Europe: Brussels, Geneva, 1997; Available online: http://bfw.ac.at/600/pdf/1451_01.pdf (accessed on 10 July 2018).
  26. Augusto, L.; Ranger, J.; Binkley, D.; Rothe, A. Impact of several common tree species of European temperate forests on soil fertility. Ann. For. Sci. 2002, 59, 233–253. [Google Scholar] [CrossRef] [Green Version]
  27. Likus-Cieślik, J.; Pietrzykowski, M.; Chodak, M. Chemistry of sulfur-contaminated soil substrate from a former Frasch extraction method sulfur mine Leachate with various forms of litter in a controlled experiment. Water Air Soil Poll. 2018, 229, 71. [Google Scholar] [CrossRef] [PubMed]
  28. Stevenson, F.J.; Cole, M.A. Cycles of Soil—Carbon, Nitrogen, Phosphorus, Sulfur, Micronutrients; John Wiley and Sons Inc.: New York, NY, USA, 1999; p. 448. ISBN 978-0-471-32071-5. [Google Scholar]
  29. Environmental Management Act (EMA). Contaminated Sites Regulation; Environmental Management Act (EMA): British Columbia, Canada, 1996; Available online: http://www.bclaws.ca (accessed on 20 December 2016).
  30. Cárcamo, H.A.; Parkinson, D.; Volney, J.W. Effects of sulfur contamination on macroinvertebrates in Canadian pine forests. Appl. Soil Ecol. 1998, 9, 459–464. [Google Scholar] [CrossRef]
  31. Benison, K.C.; Bowen, B.B. Extreme sulfur-cycling in acid brine lake environments of Western Australia. Chem. Geol. 2013, 351, 154–167. [Google Scholar] [CrossRef]
  32. Katzur, J.; Liebner, F. Effects of Superficial Tertiary Dump Substrates and Recultivation Variants on Acid Output, Salt Leaching and Development of Seepage Water Quality. In Acidic Mining Lakes (Environmental Science); Geller, W., Klapper, H., Salomons, W., Eds.; Springer: Berlin/Heidelberg, Germany, 1998; pp. 251–265. [Google Scholar]
  33. Grande, J.A.; de la Torre, M.L.; Cerón, J.C.; Beltránc, R.; Gómez, T. Overall hydrochemical characterization of the Iberian Pyrite Belt. Main acid mine drainage-generating sources (Huelva, SW Spain). J. Hydrol. 2010, 390, 123–130. [Google Scholar] [CrossRef]
  34. Knoche, D.; Embacher, A.; Katzur, J. Element dynamics of oak ecosystems on acid-sulphurous mine soil in the Lusatian mining district (Eastern Germany). Lands Urban Plan 2000, 51, 113–122. [Google Scholar] [CrossRef]
  35. Kabata-Pendias, A. Trace Elements in Soils and Plants; CRC Press, Taylor & Francis Group: Boca Raton, FL, USA; London, UK; New York, NY, USA, 2011; p. 520. ISBN 978-1-4200-9368-1. [Google Scholar]
  36. Heinsdorf, D. Fertilization of Forest Crops on Lusatia Dumps (Düngung von Forstkulturen auf Lausitzer Kippen); Laubag: Eberswalde, Germany, 1999; p. 54. [Google Scholar]
  37. Baule, H.; Fricker, C. The Fertilizer Treatment of Forest Trees; PWRiL: Warsaw, Poland, 1973; p. 285. (In Polish) [Google Scholar]
  38. Pietrzykowski, M.; Woś, B.; Haus, M. Scots pine Needles macro-nutrient (N, P, K, Ca, Mg, and S) supply at different reclaimed mine soil substrates—As an indicator of the stability of developed forest ecosystems. Environ. Monit. Assess. 2013, 185, 7445–7457. [Google Scholar] [CrossRef] [PubMed]
  39. Holub, P.; Tůma, I.; Záhora, J.; Fiala, K. Different nutrient use strategies of expansive grasses Calamagrostis epigejos and Arrhenatherum elatius. Biologia 2012, 67, 673–680. [Google Scholar] [CrossRef] [Green Version]
  40. Mudrák, O.; Frouz, J.; Velichová, V. Understory vegetation in reclaimed and unreclaimed post-mining forest stands. Ecol. Eng. 2010, 36, 783–790. [Google Scholar] [CrossRef]
  41. Menyailo, O.V.; Hungate, B.A.; Zech, W. Tree species mediated soil chemical changes in a Siberian artificial afforestation experiment. Plant Soil 2002, 242, 171–182. [Google Scholar] [CrossRef]
  42. Chodak, M.; Niklińska, M. The effect of different tree species on the chemical and microbial properties of reclaimed mine soils. Biol. Fertil. Soils 2010, 46, 555–566. [Google Scholar] [CrossRef]
  43. Environmental Protection Agency (EPA). The Use of Soil Amendments for Remediation, Revitalization, and Reuse; EPA (Environmental Protection Agency) National Service Center for Environmental Publications: Cincinnati, OH, USA, 2007. Available online: https://www.epa.gov/sites/production/files/2015-05/documents/the_use_of_soil_amendments_for_remediation_revitalization_and_reule.pdf (accessed on 6 January 2017).
  44. McTee, R.M.; Lekberg, Y.; Bullington, L.; Rummel, A.; Mummey, D.L.; Ramsey, P.W.; Hinman, N.W. Restoring ecological properties of acidic soils contaminated with elemental sulfur. Sci. Total Environ. 2017, 587–588, 449–456. [Google Scholar] [CrossRef] [PubMed]
  45. Rousk, J.; Bååth, E.; Brookes, P.C.; Lauber, C.L.; Lozupone, C.; Caporaso, J.G.; Knight, R.; Fierer, N. Soil bacterial and fungal communities across a pH gradient in an arable soil. ISME J. 2010, 4, 1340–1351. [Google Scholar] [CrossRef] [PubMed] [Green Version]
Figure 1. Research area location on map of Poland (a) and reclaimed and reforested area border (b,c).
Sustainability 10 02442 g001
Figure 2. Distribution of surface water sampling points from watercourse reservoir in the reclaimed and afforested former Jeziórko sulfur mine (FSMJ) site.
Sustainability 10 02442 g002
Figure 3. Distribution of detailed study sites (after first phase of surface variability study in the monitoring grid) with designated categories.
Sustainability 10 02442 g003
Table 1. Selected topsoil layer (0–20 cm) characteristics on the FSMJ area, as grouped by soil texture [4].
USDASandSiltClaypHKClECNTSOCST
(%)(µS cm−1)(%)(%)(mg kg−1)
MeanS91715.12
(3.30–7.59)
92
(16–314)
0.02
(0.00–0.08)
0.57
(0.12–1.87)
212
(10–1099)
SD 1.581010.020.47322
MeanLS771944.43
(2.62–7.51)
222
(15–1573)
0.11
(0.00–0.41)
2.59
(0.25–10.68)
2185
(0–25,575)
SD 1.794250.143.106584
MeanSL672765.57
(2.75–7.49)
412
(21–2080)
0.08
(0.00–0.39)
2.28
(0.69–8.15)
5002
(10–40,805)
SD 1.896530.091.8611,221
MeanL4743106.46
(3.83–7.27)
1332
(27–2000)
0.03
(0.01–0.06)
3.67
(0.95–7.58)
15,388
(56–27,930)
SD 1.478330.022.4311,985
MeanSiL2855147.00
(6.79–7.13)
1625
(1212–1940)
0.02
(0.00–0.05)
5.42
(2.76–6.76)
35,731
(32,096–45,742)
SD 0.163080.021.886688
Explanations: LS—loamy sand; S—sand; SL—sandy loam; L—loam; SiL—silt loam (according to USDA 2014 (U.S. Department of Agriculture)) EC—electrical conductivity; NT—total nitrogen; SOC—soil organic carbon; ST—total soil sulfur, SD—standard deviation values in brackets indicate ranges.
Table 2. pH, EC, and concentration of selected ions in the sampled seasons in the FSMJ study site [8].
Season
SummerAutumnWinterSpring
pH16.5 (3.1–7.7)6.6 (3.4–7.7)6.2 (2.7–7.2)6.7 (2.6–7.9)
µS cm−1
EC1819 (1660–2070)1823 (1720–2120)1566 (1083–2190)1980 (1118–3430)
mg L−1
Cl76.83 (11.2–113.2)75.87 (9.5–122.4)67.42 (7.5–110.0)73.14 (7.2–123.7)
HCO38.63 (1.8–13.7)9.92 (2.4–15.6)bdl78.33 (8.5–131.0)
NO31.00 (0.4–3.4)1.24 (0.4–2.7)1.86 (0.4–6.9)bdl
SO42−1049.39 (829.5–1321.9)994.52 (593.8–1312.2)742.48 (472.0–988.1)954.11 (500.2–1502.9)
Na+97.61 (22.5–134.9)96.82 (24.0–145.7)79.47 (13.7–122.9)93.87 (11.2–147.1)
Mg2+21.44 (16.0–29.1)21.09 (14.4–30.8)15.83 (8.2–22.0)23.11 (14.3–30.8)
Ca2+358.32 (276.3–405.8)343.00 (197.9–406.7)285.40 (174.5–390.6)342.75 (222.3–433.9)
1 6.5 (3.1–7.7)—mean (range); bdl—below detection level.
Table 3. Selected soil characteristics (detailed areas) in the reclaimed and afforested areas of FSMJ [3].
CategorySoil HorizonpHKClECSTSOCNT
µS cm−1Mg kg−1%
B0–206.7 ± 1.3707 ± 113217,609.83 ± 57,882.881.8 ± 1.320.05 ± 0.04
20–505 ± 1.2421 ± 65312,717.75 ± 36,221.240.6 ± 1.020.01 ± 0.02
50–1004.2 ± 1.8564 ± 6587891.63 ± 16,631.180.87 ± 0.70.03 ± 0.03
P0–206.0 ± 1.7369 ± 4801891.72 ± 5388.581.5 ± 0.830.06 ± 0.03
20–504.6 ± 1.1347 ± 469978.8 ± 3284.430.76 ± 0.760.03 ± 0.03
50–1005.2 ± 1.1296 ± 262274.87 ± 2230.63 ± 0.440.02 ± 0.01
D0–203.9 ± 1.81840 ± 122024,569.68 ± 37,249.221.39 ± 1.150.03 ± 0.02
20–503.3 ± 1.41860 ± 141023,775.14 ± 43,725.621.11 ± 0.890.02 ± 0.02
50–1002.7 ± 0.91612 ± 96789,326.42 ± 107,323.191.06 ± 0.790.03 ± 0.03
D—degraded, P—pine stands, B—birch stands.
Table 4. Selected characteristics of trees and vegetation in the reclaimed areas of the FSMJ [3].
CategoryNDBHHtVIUFRONumber of Vascular Plant SpeciesCover Abundance of Vegetation
102030
(pcs ha−1) 1(cm)(m)(m3 ar−1)(%)(pcs plot−1)(%)
D612
(238–1090)
7.7
(5.0–10.04)
5.5
(3.61–6.88)
0.06
(0.02–0.11)
7405310 (1–16)26 (1–55)
P1457
(1051–2133)
10.6
(9.17–11.53)
10
(9.54–10.63)
0.93
(0.73–1.09)
25631214 (8–21)35 (3–75)
B1558
(637–2038)
7.8
(5.67–8.89)
8.3
(6.1–11.35)
0.50
(6.4–11.35)
9702114 (12–19)74 (60–85)
Mean (range), 1 pcs-pieces.
Table 5. The supply of S and other macronutrients in birch and pine foliage on sulfurous FSMJ soils [7].
Foliage Species 1,2
BP
Element PcPc+1
N(%)mean (median)1.71 a (1.68)1.12 b (1.07)1.11 b (1.10)
range1.58–1.891.05–1.301.05–1.81
P(mg kg−1)mean (median)2320.4 a (2309.3)1348.1 b (1358.3)1045.4 b (1049.6)
range1695.8–2969.31221.3–1454.3970.6–1111.8
Ca(%)mean (median)1.35 a (1.30)0.33 b (0.32)0.75 c (0.78)
range1.15–1.630.25–0.440.52–0.93
Mg(mg kg−1)mean (median)1525.7 a (1494.9)705.2 b (705.2)715.0 b (710.6)
range1039.9–2073.1645.0–765.5687.5–751.5
K(%)mean (median)0.80 a (0.72)0.50 b (0.49)0.50 b (0.49)
range0.68–1.070.46–0.560.48–0.53
Na(mg kg−1)mean (median)34.9 a (37.1)10.3 b (11.0)10.0 b (8.5)
range17.46–47.88bdl.—19.11.3–21.74
S(mg kg−1)mean (median)1954 a (1987)1272 b (1287)1221 b (1208)
range1218–26261054–1459955–1513
1 B—leaves of birch growing in category of birch stands, P—pine needles, and category; 2 Pc—current year needles, Pc+1—two-year-old pine needles, a,b significant difference between categories, bdl—below detection level; category D—lack of trees.
Table 6. Nutrient content and N:P ratio in wood small-reed leaves at different degrees of degraded site categories in reforested FSMJ areas [7].
Category 1
PBD
%
Nmean (median)0.93 a (0.97)0.75 ab (0.73)0.62 b (0.67)
Range0.71–1.090.56–0.990.40–0.72
Kmean (median)0.95 a (0.87)0.72 a (0.76)0.57 a (0.57)
Range0.82–1.250.37–0.980.23–0.91
Camean (median)0.34 a (0.33)0.27 a (0.31)0.22 a (0.24)
Range0.20–0.500.15–0.330.09–0.28
mg kg−1
Smean (median)2249.1 a (2262.8)1717.3 a (1689.1)1778.5 a (2042.4)
Range2087.8–2383.01406.6–2084.4790.6–2238.5
Pmean (median)1351.2 a (1381.1)1132.5 a (1182.3)904 a (739.3)
Range1235.3–1407.3749.2–1416.3519.3–1618.3
Mgmean (median)706.1 a (644.1)485.5 ab (506.1)363.9 b (390.6)
Range603.4–932.5296.8–633.1175.1–499.5
Namean (median)25.0 a (15.8)22.2 a (22.4)11.3 a (5.9)
Range13.6–54.713.3–30.44.2–29.3
N:P ratiomean (median)6.96.77.7
1 B—birch stand category, P—pine stand category, D—degraded category, a,b—significant difference between categories (at p = 0.05).
Table 7. Chemical parameter changes of soil substrate during a 12-week experiment under controlled conditions [27].
PropertiesLS 1LS-cLS-BLS-PHSHS-cHS-BHS-P
pH 2.1 a±0.02.6 bc±0.02.5 bd±0.12.9 e±0.32.5 bc±0.02.6 c±0.02.3 d±0.02.5 bc±0.1
EC(mS cm−1)1.87 a±0.0570.39 b±0.0320.59 c±0.110.23 d±0.232.59 e±0.0532.53 e±0.0752.98 f±0.1232.58 e±0.047
St(mg kg−1)5090 a±4836447 a±3975947 a±13196178 a±187042,521 b±267035,634 c±956833,247 c±403334,157 c±4291
SOC(g kg−1)3.22 a±0.092.89 a±0.322.97 a±0.163.09 a±0.207.78 b±0.137.23 b±0.347.80 b±1.147.20 b±0.44
Nt0.03 a±0.030.02 a±0.010.03 a±0.010.02 a±0.000.16 b±0.020.19 bc±0.040.22 c±0.040.18 b±0.01
Ca7.06 a±0.500.07 b±0.050.06 b±0.000.38 b±0.3611.68 c±1.564.21 de±2.252.95 d±0.735.99 de±2.23
Mg0.09 ac±0.010.04 b±0.010.04 b±0.000.05 b±0.000.11 a±0.000.08 c±0.040.11 a±0.010.11 a±0.01
Al0.97 ab±0.090.37 c±0.250.43 c±0.030.49 c 0.041.51 e±0.000.77 ad±0.441.02 ab±0.181.25 be±0.17
RESP(μg CO2/g/24 h)n.d. 3 2.49 a±0.482.75 a±1.381.91 a±0.71n.d.2 2.40 a±0.570.99 a±0.482.24 a±0.59
1 LS—soil substrate with 5090 mg kg−1 S before the experiment; LS-c—control sample of soil substrate with 5090 mg kg−1 S after the experiment; LS-B birch litter after the experiment on substrate with 5090 mg kg−1 S; LS-P—pine litter after the experiment on substrate with 5090 mg kg−1 S; HS-b—soil substrate with 42,500 mg kg−1 S before the experiment; HS-c—control sample of soil substrate with 42,500 mg kg−1 S after the experiment; HS-B—birch litter after the experiment on substrate with 42,500 mg kg−1 S; HS-P—pine litter after the experiment on substrate with 42,500 mg kg−1 S; a,b…f—mean values with the same letter are not significantly different at p = 0.5, 2.53 ± 0.04—mean and SD; 2 n.d.—no data.
Table 8. Mean values and standard deviations for pH, EC, content of dissolved organic carbon (DOC), and the concentrations of St, Nt, Ca, Mg, and Al in leachates at the beginning and after 12 weeks of leaching through soil substrates and composites in controlled conditions.
LS-cLS-BLS-PHS-cHS-BHS-P
pHs 11.8 b 3±0.041.8 b±0.021.8 b±0.102.2 b±0.032.2±0.102.3 b±0.10
f 22.5 a±0.082.8 a±0.123.8 a±0.262.6 a±0.182.2±0.222.9 a±0.26
mS cm−1
ECs10.80 a±1.3811.48 a±0.4210.91 a±3.074.85 a±0.295.52±0.774.51 a±0.49
f1.12 b±0.320.71 b±0.230.10 b±0.032.74 b±0.344.75±1.002.40 b±0.36
mg L−1
Sts1570.8 a±156.51585.9 a±100.11583.3 a±428.6814.3 a±31.4841.4±73.6741.0 a±74.4
f71.0 b±20.353.7 b±17.29.6 b±4.6625.7 b±36.6725.4±63.6588.0 b±24.0
DOCs82.84 a±8.9592.97 a±9.38117.13 a±18.80101.41 a±9.54127.00 a±33.11110.37 a±15.38
f5.08 b±0.3320.47 b±3.1737.20 b±10.729.78 b±1.6532.00 b±4.0329.56 b±2.48
Nts14.65 a±1.9718.05 a±1.0216.42 a±4.115.72 a±0.317.68 a±1.556.54 a±0.69
f0.53 b±0.041.46 b±0.171.17 b±0.330.43 b±0.022.58 b±0.670.82 b±0.05
Cs474.41 a±39.07445.30 a±26.10442.78 a±33.14550.23 a±17.79552.79 a±14.18553.38±50.04
f5.84 b±1.2813.66 b±4.085.20 b±6.11467.27 b±24.03494.78 b±21.99495.56±17.26
Mgs2.21 a±1.737.85 a±1.488.01 a±3.140.01 c±0.001.62 ad±0.960.85 d±1.70
f0.01 b±0.000.68 b±0.120.07 b±0.140.01 c±0.032.24 a±0.490.48 d±0.09
Als73.24 a±12.4261.17 a±6.9560.68 a±25.2342.95 a±6.3232.42 a±10.9821.66 a±9.22
f0.22 b±0.160.05 b±0.040.06 b±0.040.74 b±0.411.77 b±0.470.21 b±0.14
1 s—at the beginning of experiment; 2 f—after 12 weeks; 3 different letters indicate significant differences in the measured values at the beginning and at the end of the experiment (p = 0.05, pairwise t-test).

