1. Introduction
In recent years, pollution by micro-sized polymeric particles (henceforth called microplastics) in aquatic ecosystems has raised concerns [
1,
2]. Microplastics has been found to serve as both a transport medium and a potential source of toxic chemicals in the marine environment [
3]. In addition, spread of antibiotic resistance might increase among bacteria communities that form bio-films on microplastics compared to those that are free-living [
4]. Several sources describe the possible detrimental impacts from microplastics pollution on the ecosystem as well as human health [
5,
6,
7]. Environmental monitoring shows that microplastics are present in aquatic environments at a growing rate [
8,
9]. At the same time, there is an uncertainty to how large the risks are that microplastics pose, and there is currently no studies available that can provide evidence that the micro-sized plastic particles pose any hazard in itself [
10,
11]. However, for emissions to air and consequent inhalation in the human lung, the potential hazard related to size and shape especially related to emissions in working environment is discussed [
12]. Regardless of whether the microplastics’ size and shape is important in itself, the size is important for the possible impact on aquatic ecosystem and human health as a carrier of toxic substances. Here it is the hydrophobic properties that enable adsorption of persistent pollutants in the aquatic environment in contrast to cellulose based material and other hydrophilic materials. When the microplastics are small enough they can enter animals and plants in the aquatic environment, and if in the range of 2–200 µm, they can be mistaken for plankton and ingested by aquatic species.
In the literature on microplastics pollution, the particles studied vary in size. The common definition of a microplastics particle is below 5 mm (5000 µm) with no lower limit to be counted as microplastics. However, a lower limit of some μm is often employed of practical reasons [
13]. The definition of a textile fibre implies on the other hand a certain shape: fibres are very small in diameter in relation to the length. However, the fibre length is reduced during degradation in the environment. For the purpose of this study, particles are regarded to have fibre shape if the length is four times or more the diameter of the particle.
1.1. Textiles as a Source to Microplastics
The sources to microplastics in aquatic ecosystems are mainly land-based and are usually divided into primary sources (emissions of micro-sized polymeric particles) and secondary sources (larger sized polymer items that are broken down in the environment to microplastics) [
10]. The abrasion of synthetic textiles leads to shedding due to mechanical stress of the textile fibres and takes place both during production [
12] and use e.g., washing and drying procedures [
14]. This in turn lead to that microplastics are able to enter into the wastewater and to aquatic systems which was identified early as one of the sources [
15,
16,
17]. The importance of textiles as a microplastics source is not fully understood, and accounts vary from textiles being the most important source, responsible for emissions of 0.5 million tonnes of microplastics yearly [
5] to textiles being only a marginal contributor [
18]. In 2016 the textile world market size surpassed 100 million metric tonnes from which a high percentage of the textile production is based on synthetic polymers (65%), whereof polyester use alone stands for 53.4 million tonnes [
19]. Polyester-based materials (mainly polyethylene terephthalate (PET)) being the main material for synthetic fabrics, is therefore a source of microplastics pollution in need of adequate measures in production and in use of clothes and other textile end products.
With the United Nation’s sustainable development goals (SDG) [
20] now being established, several of the themes concern microplastics shedding from textiles with clear links to goals No 6 and 14 relating to clean drinking water respecting life below water. For mitigation, the issue of microplastics pollution can be addressed via goal No 12 addressing responsible consumption and production from raw material extraction to end of life. The issue of pollution must consequently be managed through the supply chain of textile industry, including fabric design and production methods. Considerations of environmental issues related to textile production and use are also well established in legislative frameworks, and microplastics are being scrutinized by authorities worldwide [
21]. The textile industry perceives its role as a contributor to the shedding of microplastics as worrying and seeks for solutions [
22,
23], and are consequently dependent on ability to measure improvements.
1.2. Measuring and Analyzing Microplastics from Textiles
In early 2017, a case study exploring the dependence of microplastics shedding on textile construction parameters was carried out [
24]. The study explored how recycled content in the polyester polymer, and how the cutting and some brushing techniques influenced the shedding from polyester materials. In the literature search a research gap had been identified regarding the link between fabric construction properties and microplastics shedding [
25]. Six studies provided data on fibre shedding during the washing of garments [
15,
25,
26,
27,
28,
29]. Two of the above studies explored the link between microplastics shedding and construction of the fabrics [
28,
29]. The other four did not include any details about fabric construction parameters. Browne et al. [
15] aimed to clarify whether fabrics do shed micro-sized particles and how much. Bruce et al. [
25] investigated if shedding depended on different washing conditions such as front load/top load machine. Two of the studies investigated the impact of the use of detergent and conditioners [
26,
27].
Shedding of textile fibres have both been measured in number of shed particles and as weight of shed fibres. Analyzing the size and shape does not imply what type of material, i.e., if it stems from a synthetic textile material or cellulose based material. In three of the six benchmark studies the optically visible fibres were counted manually [
15,
28,
29] which gives a size restriction to what is optically visible for the experimenter. Browne et al. [
15] had in addition an upper restriction on size counting only particles below 1 mm. Bruce et al. [
25] limited their study to particles of a specific size by using filters with a pore size of 20 respective 333 µm. As a general rule of thumb, the filter pore size should be five times smaller than the size of the fibre intended to be filtered. Napper & Thompson [
27] counted fibres based on average weight in their study. Pirc et al. [
26] reported the weight of the total material collected on the filter, all of which was assumed to be fibres.
It was observed that the experimental set-up and analytical means differed largely between the studies. Consequently, the results regarding the amount of shed particles also varied, from 120 [
15] to 728,289 [
27] particles per garment in recent studies. As none of the reviewed methods could be used to identify whether the shedding of microplastics from different types of fabric was dependent on construction parameters, a method was developed that fitted such purpose. The method is briefly described in Roos et al. [
24]. Further development of the method was then performed.
1.3. Existing Standard Methods for Textile Testing with Relevance for Shedding
Even though a specific test methods for microplastics shedding into the wastewater during laundry does not yet exist, several existing test methods measure related issues, such as the standardised method for linting, EN/ISO 9073-10:2003 [
30], concerns . Here a dry textile sample is shaken, and the shed dry fibres are counted. This is a standard method for testing textiles used for clean room facilities.
Several standard test methods for textiles are carried out in the Gyrowash equipment, such as colour fastness to both domestic and industrial laundering, as well as chlorinated water [
31,
32,
33]. Gyrowash is standardised laundry equipment for laboratories. The washing is performed in small sealed tubes, which leads to increased reliability as the risk for cross-contamination between test rounds is minimized.
1.4. Aim of the Paper
This paper proposes a test method for measuring microplastics shedding occurring when washing fabrics and garments. Such a method is needed to analyse why certain fabrics emit more microplastics than others. Different textile fabrics need to be compared to each other to enable mitigation of these emissions by for instance design solutions or cleaner production methods. The comparison must be on the one hand robust (low standard deviation) and on the other hand sensitive enough to differentiate between for example different types of synthetic materials, different weave/knit constructions or fabrics produced with different process equipments or set-ups. Another prerequisite is the feasibility for the method to be used at textile testing laboratories with existing equipment if possible and at a reasonable cost, while still resembling real life condition.
In addition, the paper attempts to contribute to the development of standardised test methods for measuring microplastics shedding from textiles. Thus, in the paper is explained the rationale behind the choices made in each step in the method, i.e., the selection of equipment and procedure for sample preparation, washing, filtering of the washing water and analysis of the shed microplastics. It is also discussed which existing standard test methods that have been selected and which have not. This discussion is intended to bring light on limitations and how the method can be modified for other purposes.
2. Materials and Methods
The information in the studies found in the literature concerning experimental set-up was used as benchmark for how to perform the measurements in the test method [
15,
25,
26,
27,
28,
29]. It was observed that the experimental set-up differed largely between the studies and the interpretation and comparison of the results needed therefore be made carefully.
Further, it was identified that the cause to shedding of microplastics from textiles can be divided into two main groups:
Textiles as a generator of microplastics (the polymeric material in the textile is broken down to micro-sized particles)
Textiles as a carrier of microplastics (dust and other polymeric particles as well as metal, glass and biological material can all be present in textiles)
The main aim of the developed test method has been to identify differences in generation of microplastics from different textiles. However, in the test method development, the fact that textiles also act as a carrier of microplastics was needed to take into consideration. Furthermore, the resulting test method intends to mimic a real life situation of washing of textile garments.
2.1. Identification of Causes behind Textiles Generating Microplastics
As the purpose behind the method development was to identify whether the shedding of microplastics from different types of fabric was dependent on construction parameters, a list of different parameters that can influence microplastics shedding in the construction of a textile product was set up (
Table 1). It was also identified that the textile product can shed both from the fabric surface and from the edges of the fabric (
Figure 1).
In the first round, polyester based materials (virgin and secondary raw material) with different constructions were evaluated. Furthermore, validation of the method itself was performed in the second test round using one specific material and running eight samples.
2.2. Controlling for Textiles as a Carrier of Microplastics
The preparation step can be designed to remove the foreign particles from the textiles to exclude much of the dust and other polymeric particles as well as metal, glass and biological material that all can be present in textiles. The preparation step turned out to have a large impact on the results, and the method development strived therefore to reduce the impact of the human factor interference. During the development, the samples were either vacuumed, rolled with a sticky garment roll, pre-washed (in a standard washing machine [
34]) or pre-treated in a combination of the three. Further, the samples were either cut with scissors or with an ultrasonic cutting machine to be able to differ between microplastics that shed from the surface of the fabric or from the cut edge of the fabric (
Figure 1). A Gyrowash machine was used to mimic the mechanical stress of washing five times in a domestic washing machine. Steel balls included within the fabric bag were used to increase the mechanical stress.
2.3. Existing Standard Methods for Textile Testing with Relevance for Shedding
The method development was based on previous experience in standard method development for textile testing. As far as possible, existent equipments and operating procedures were chosen in order for the method to be feasible for practical use in the textile laboratories. Textile materials have always a natural variation, wherefore most standard methods for textiles require several duplicates in each test round. In the current method, four duplicates were decided on to keep costs down.
The existing standard method for linting, EN/ISO 9073-10:2003 [
30], was first considered as an alternative. However, the dry shedding was not certain to be related to wet shedding and released load to the aquatic environment. Since impact on aquatic environments was the focus in the study, the dry linting method was rejected.
Next consideration regarded use of full-size washing machines or Gyrowash. Full size machine testing do have the advantage of representing the real use scenario, however there are some serious drawbacks. The first drawback is the cost, both regarding the equipment and the running costs. The cost for a standardized washing machine for laboratory testing amounts to around €9000, which is a large investment cost. Further, since duplicate tests are needed, filling the full-size washing machine with test samples and filtering the large amount of waste water from the machine will render a large cost for both material and staff for each single test. The most significant drawback is however that a washing machine is impossible to clean thoroughly between test rounds. There is an obvious risk for contamination between test rounds, and this last argument made it clear that in order to minimize error sources and draw correct conclusions regarding microplastics occurrence in the waste water, equipment that could be easily cleaned was needed.
Experiences among the authors from participation in the development of the test method for colour fastness to industrial laundering ISO 105-C12 [
32] were taken into account regarding the similarity of the Gyrowash compared with full-size washing machine with regards to mechanical stress (friction). With the older method for colour fastness to domestic and commercial laundering [
33], the fabric samples are inserted into the Gyrowash as they are. However, this method showed poor resemblance to the conditions in industrial laundering in relation to colour fastness. To increase the mechanical stress, the samples were instead constructed as “bags” that withheld small steel balls that produced friction to the fabric during washing. With this construction it was found that one wash in the Gyrowash equalled five washing in an industrial laundry (in relation to colour fastness).
The same equipment was selected for the microplastics shedding test, with some minor modifications. The fabric samples were constructed as “bags” that withheld 25 small steel balls instead of the original 10, to further increase the mechanical stress. In addition, the amount of washing water was reduced in order to decrease the filtration volume and minimize error sources. In the case study, the concentration of the detergent was first reduced compared to [
32] to decrease foaming and facilitate the filtration. Removing the detergent completely would mean that the pH would differ between real washing conditions and the laboratory testing. The pH factor can be important for the breakdown of the material. Thus, detergent was applied at a reduced amount in the case study. However, in the final method, the detergent was eliminated all together as it was one of the larger error sources.
2.4. Microscopy for Counting the Number of Microplastics
Since the purpose of the study was to count the number of microplastic particles, both the weighting approach as well as manual counting were considered to be too uncertain and hence large error sources.
The possibility to use Scanning Electron Microscopy (SEM) for the analysis was first explored. The advantage with SEM compared to optical microscopy would be that the material type could be identified (type of plastics, other material etc.). The drawback of the SEM technique is that only a small part of the filter area could be analysed per round. This would mean that the assumption would need to be made that all microplastics are distributed evenly on the filter. The uneven distribution of particles on the filter that could be seen with the naked eye spoke against such an assumption. Since the purpose of the study was to count the number of microplastics, optical microscopy was selected. However, the SEM experiments gave the important knowledge that all the particles on the filter were not microplastics. Particles of metal, glass and humus were also present in small amounts which fortified the conception of textiles as a carrier of particles and not only a generator.
Automatic optical microscopy is used since the end of the twentieth-century to evaluate the number of particles present at components for the automotive and hydraulic industries. In the standard methods for these applications the main focus is on particles of other origin than textile, however textile fibres are a common contamination and the methods contains definitions and methods to deal with textile fibres [
35].
It was decided to use the optical microscope Leica DM4000M with the connected software Cleanliness Expert v4.9 (publisher: Leica Microsystems, Stockholm, Sweden). This equipment offers the possibility to count particles in different size ranges from 5 µm and larger. In addition, the software can be set to identify particles with a certain length compared to its width. This opportunity was used to identify particles of fibre shape. Thus, the length-width ratio (fibre aspect ratio) was in this case set to either 10:1 or 20:1. The length is set to measure at fibres of at least 100 µm so no fibres below will be accounted for. However, particle shaped microplastics will be counted from 5 µm and above and results are presented accordingly. The microscope counts the particles that meet certain criteria: it must have a different colour than the filter background, as well as size and shape according to the set criteria.
Samples with many fibres are difficult to count because of fibre crossing, i.e., that fibres crossing each other were identified as a single particle. Further method development of the microscopy part is therefore needed. A mean-time solution is to increase the cascade filtering so that fewer fibres are caught in each filter and the risk for fibre crossing is reduced. Cascade filtering needs to be defined in the results as it affects the results. In test round two, a single filter step was applied due to the fact that this gave more robust results.
3. Results
Below is given a description of the materials and the result in the first respective second test round and the final method description together with an overview of what modifications that is needed to fit other purposes.
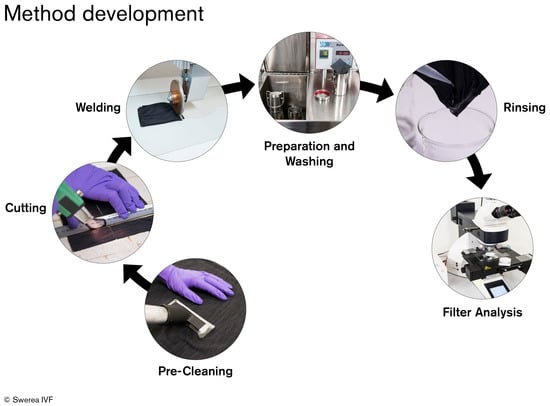
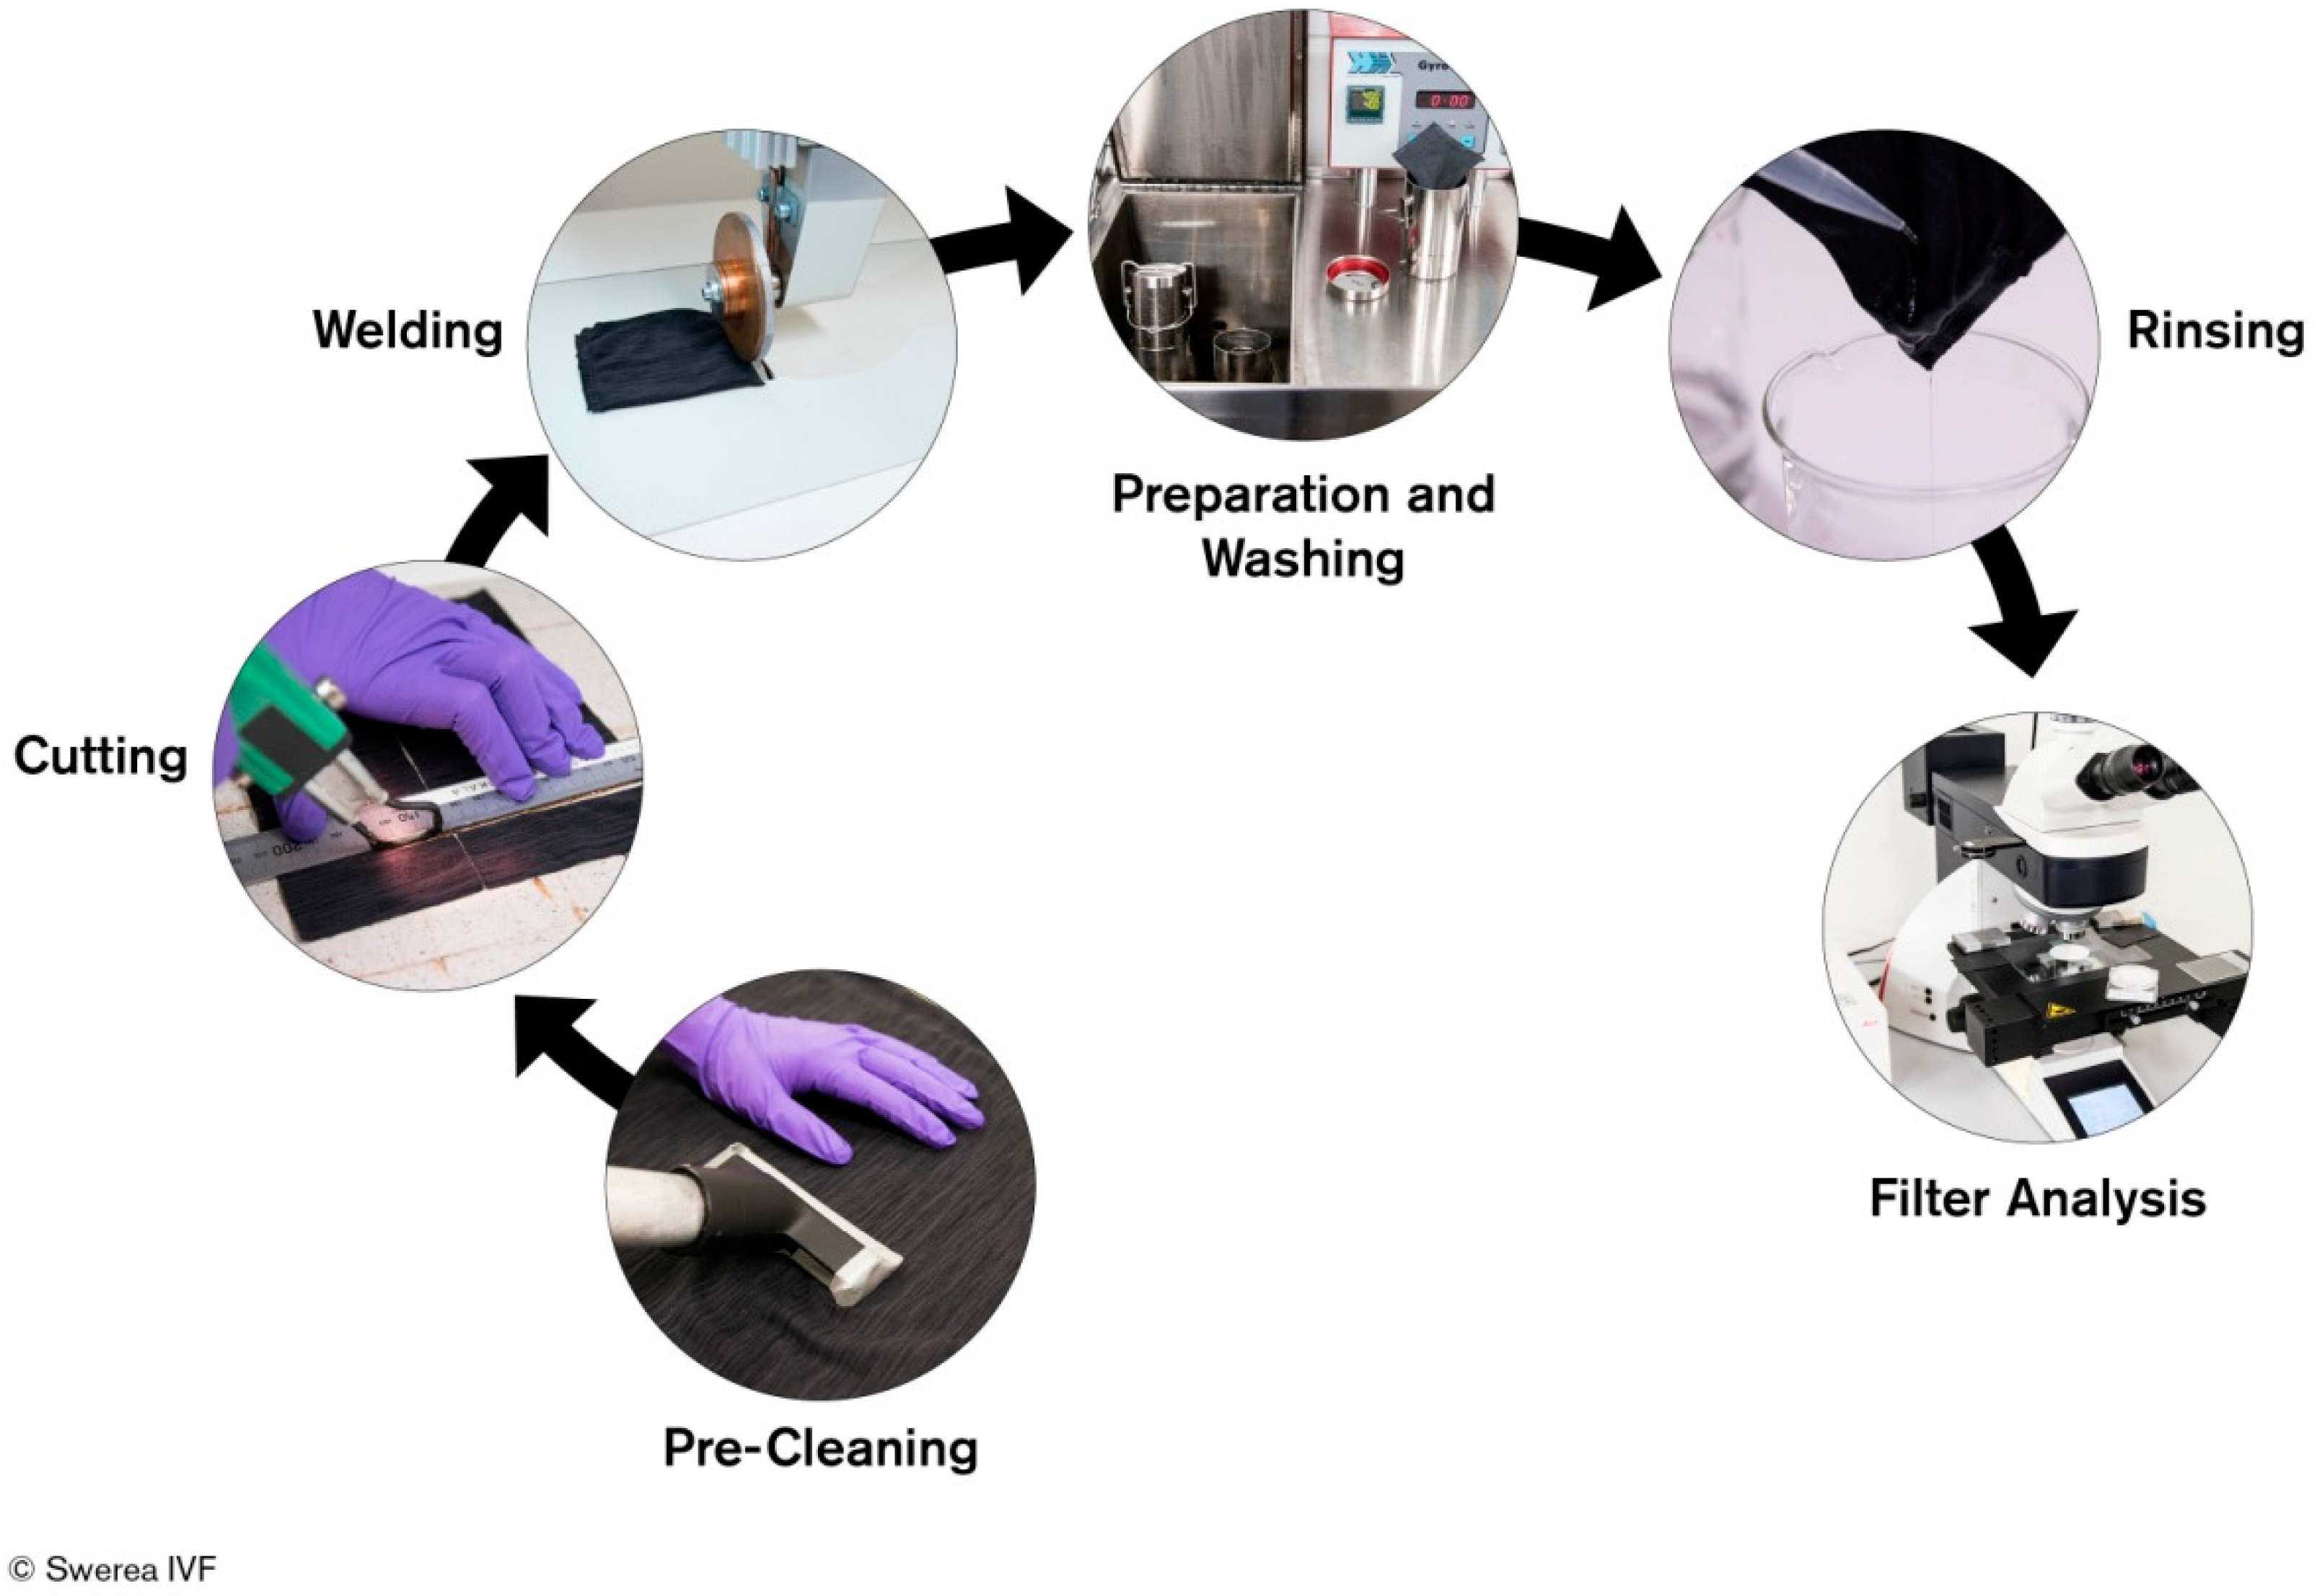
An overall scheme of the method at hand is presented in
Figure 2. The main steps are pre-cleaning of the sample fabric, cutting the sample replicas, welding fabric samples into a bag and introduction of steel balls, washing in Gyrowash, rinsing to collect the shed fibres, and finally automatic counting of fibres in a microscope.
3.1. Textile Materials for the First Round
The first round included test of different polyester (PET) based materials to identify differences between different fabric constructions (jersey and fleece), cutting equipments (ultrasonic or mechanical (scissor cut)) and material base (virgin or recycled), see
Table 2. The textile materials were sampled in pairs so that all parameters with a possible impact on shedding (see
Table 1) were kept the same except the parameter in focus for the testing.
3.2. Textile Materials for the Second Round
The recycled PET fleece (material No 1) was chosen for the second round aimed at validation of the method itself performing eight replicates to calculate mean, median and standard deviation. The equipment needed to execute the test method is listed in
Table 3.
3.3. Materials for the Final Method
The equipment and auxiliary materials needed to execute the final test method are listed in
Table 3.
3.4. Description of Final Method
The test method consists of six steps: (1) Pre-Cleaning, (2) Cutting, (3) Welding, (4) Washing, (5) Rinsing, (6) Filter Analysis. The steps are described below. To avoid contamination and for safety measures protective gloves and coats were used throughout the procedures 1 to 3 and changed in between step 5 and 6.
3.4.1. Pre-Cleaning
The work bench is cleaned to avoid contamination. The test fabric is vacuumed three times per side at a slow pace (approximately 15 cm/s) across the entire material.
3.4.2. Cutting
The fabric (woven or knitted fabric) is cut to 17.0 × 9.0 cm pieces using ultrasonic cutter. The fabric pieces are then immediately stored in smaller plastic bags (one sample in each bag) to prevent contamination. It is recommended to take four samples per test fabric.
3.4.3. Welding
The fabric pieces are folded together to make the folded size 8.5 × 9 cm. The two short sides are welded together using ultrasonic welding machine (5 mm joint size) to construct a bag where the non-welded fabric surface is now 8.0 × 8.0 cm. 25 steel balls per bag are first rinsed off with isopropanol and then added to the bag before the third side is welded together and the bag is closed. The bags are then stored immediately after welding in the same plastic bag as before to prevent contamination.
3.4.4. Washing
The Gyrowash has 8 cylinders and can handle 8 samples per wash cycle. Hence, two different test fabrics can be washed together. The 8 cylinders belonging to the Gyrowash are cleaned with distilled water and isopropanol prior to test of fabrics. 600 mL of distilled water is distributed into the 8 cylinders with 75 mL per cylinder.
The fabric bags belonging to test fabric number 1 are placed in the cylinders 1–4 and the fabric bags belonging to test fabric number 2 are placed in the cylinders 5–8. The Gyrowash is preheated to the working temperature of 40 °C. The 8 cylinders are mounted in the Gyrowash which is run for 60 min.
3.4.5. Rinsing
The cylinders are removed from the Gyrowash. The second beaker is filled with approximately 500 mL of distilled water.
Cylinder number 1 is opened and the fabric bag is removed using a tweezer. The bag is held over the third beaker and rinsed with 10 mL distilled water × 2 on each side using a pipette. The bag is then squeezed by hand and laid aside on a clean surface. The glove is rinsed with 20 mL of distilled water. Then the cylinder in rinsed with 10 mL distilled water × 2 along the walls and shaken in light rotating motion before pouring the water into the third beaker. The cylinder cover is rinsed with 10 mL distilled water × 1. The washing water from the cylinder is then poured into a plastic container. Finally the third beaker is also rinsed with 10 mL distilled water × 1 which is then shaken in light rotary motion before pouring this too into the plastic container. The lid is shut and the plastic container marked with test fabric identity and test number. The procedure is repeated for all fabric bags.
3.4.6. Filtration and Filter Analysis
The filter is placed in the filter container. Plastic container number 1 is shaken in light rotating motion and the wash water is poured over the filter. The plastic container is rinsed with isopropanol and the residue is also poured over the filter. The air suction is switched on to increase the flow rate. Isopropanol is poured along the edges of the filter system just before the liquid has passed through (when approximately 1 mm of liquid remains).
The filters are removed from the filter container using a tweezer and these are put on drying in an environment low in fibres, separate filter holders. The filter holders are labelled with the type of fabric, test number, and filter type. The procedure is repeated for all filters.
The microscope with associated software is then used to calculate the number of fibres on each individual filter. If the software used can calculate what is a fibre and not, it is necessary to manually set what the software should define as fibre. A minimum width of 50 μm is applied for fibres, together with the condition that the length-width ratio is set to either 10 or 20. Particle shaped microplastics are measured from 5 μm and up. The microscope gives images that are visible for the human eye and one can look at the fibres and make assumption on if they are of the same type and if they are textile.
3.5. First Round Results
The results from the first round regarding how recycled content in the polyester polymer, and how the cutting and some brushing techniques influence the shedding were presented briefly in Roos et al. [
24].
Table 4 shows the result, using the length-width ratio of 10:1 on the microscopic setting, in detail including standard deviations. As mentioned above, four samples were run per each material. At this stage of the study, detergent was used as part of the washing step in the test protocol. The standard deviation varied from 15% to 38% in the first round with an average standard deviation of 25%.
The measurements in the first round were performed using cascade filtering (using poor size of 100 and 5 µm) and counting the number of microplastics on each filter (below 20 or below 5 µm) except for fleece materials where only the 100 um filter was used due to clogging of the detergent. From the results presented in
Table 4 it can be seen that the difference between cutting with scissor and using a ultra sound cutter that welds the edges make a large differences. The rest of the samples therefore are only cu by the ultra sound equipment to avoid shedding from the edges. For recycled polyester content in the fleece or in the tricot the results shows little difference in number of shed fibres. Also in between the different fabric constructions fleece and tricot it is not an obvious difference. However, the standard deviation was rather high. This was probably mainly due to that fibres got stuck in between the cascaded filters (that were placed directly on top of each other without spacer in between). Another high error source was the clogging of the detergent on the filters. The method was therefore optimised for error minimization, using only one single filter and excluding the detergent to overcome these issues. As a result, a validation of the changed method was performed.
3.6. Validation of Test Method
The results from the validation of the method in the second round using a recycled fleece in polyester based material show mean, median and standard deviation (
Figure 3). Eight samples of the same textile fabric sample were analysed using the described method. The number of fibres for the eight samples is presented in
Table 5. The standard deviation in the second round was reduced to 7.7% compared to the average standard deviation of 25% in the first round.
Results from the validation of the test method at this point are best to be compared within the same set-up and benchmarking is currently taking place to enable future comparative studies. At this point, the method show high enough certainty with a mean value of 650 a median at 656 and a standard deviation of 7.7%. The next step will be to optimize further and align all methods used in academia or by industry to create a standard.
4. Discussion
The textile sector, being among the top five industries which contribute to microplastics pollution of oceans, needs to understand the reasons for and the extent of shedding in order to take appropriate measures. Shedding can occur at several different parts in the value chain, mainly due to mechanical stress of the fabric or even on yarn/filament level. Abrasion during washing and drying procedures are two main reasons for shedding, both during production and during use. In this study, diffuse emissions to water compartments via water streams starting from domestic washing have been one important question. Thus, the proposed analytical method has matched to that specific question in order to give as adequate answer as possible. In addition, it is clear that reliable and quantitative test methods are mandatory for all development of policies for requirements of analytical studies of textiles materials impact on the environment [
11].
In the presented study, two important steps are the backbone of the proposed analytical testing:
The reason why these two steps are included is to be able to distinguish shed microplastics that are generated from respective carried by a certain fabric. For environmental impact it does not matter whether the microplastics are generated from the textile material or only carried by the textile material. However, the most suitable options for mitigation depend on the cause behind the shedding, why it is important that the method can make this distinction.
As described above it is the microplastics in the smaller size range that are difficult to capture for the waste water treatment plants that might be of the greatest concern for the environment. To be able to draw the desired conclusions, it was chosen to use the filter size of 0.65 µm for the final method. Experiments were also made in the first round where two different filter sizes were used in cascade: 5 µm and 100 µm. The collected microplastics could then be analysed and results reported separately. However, in this experimental setup the larger filter was placed directly on top of the smaller, as equipment for setting a distance between them was missing. This gave the drawback that particles remained at the bottom of the upper filter, and did not pass down to the second filter. Thus, these particles were not recorded in the analysis. One single filter was therefore the only option at the time to record all particles.
The microplastics size is important when determining the cause to the shedding. Microplastics originating from textile fibres in the larger size range have still the fibre shape. Microplastics in the lower size range are more difficult to determine the origin of. Textile fibres will break down to shapes more close to spheres and look very similar to microplastics from other sources, such as dust in the surrounding environments. However, microplastics in the lower size range, known to be originating from mechanical stress on textiles (i.e., tumble drying), have been seen to also have fibre shape structures [
12].
The Gyrowash technology has been chosen since it is used in other standard textile testing [
32,
33] and due to its capacity to in a short period of time, with minimal error sources and with minimal material use and water resource use provide result, in comparison to for instance full-size washing machine testing. In the current method, four replicates were used to keep costs down, apart from the validation step that analysed 8 samples. The fabric was either woven or knitted fabrics. In principle the same procedure can be performed using a garment, where possibly two t-shirts or similar textile products are necessary for the four replicates.
The results show little difference in between virgin and recycled content in the fabric. Neither is there a large difference between polyester fleece and polyester jersey. The jersey material is a knitted product whereas the fleece is a brushed weave. However, a relatively large difference can be found between the scissor cut material and the ultra sound cut material. It seems likely that fibres are generated at the edges in the scissor cut material contributing to shedding.
Results from the validation of the test method at this point are best to be compared within the same set-up and benchmarking is currently taking place to enable future comparative studies. At this point, the method show high enough certainty with a mean value of 650 a median at 656 and a standard deviation of 7.7%.
Method Limitations and Possible Modifications for Other Purposes
The test method claims only to give a relative measure and not an absolute measure of the amount of shed fibres. The method does not claim to capture emissions to air which may instead use dry methods such as ISO 9073-10:2003 [
30]. Neither does it claim to work for measuring emission from textile mills.
The method chapter has touched on the most important limitations of the method. These are:
The optical microscopy part implies that the method can only analyse fibres that give contrast to the filter. Both white and coloured filters are available, but fabrics with mixed colours will be a challenge.
The fibres may be crossed and therefore calculated as one. This is more likely with high particle loads where cascade filtering can be considered as a solution.
Table 6 shows which steps in the method that can be modified to fit other purposes.
5. Conclusions
This study has shown that microplastics found in the washing water from textile laundry can be deduced to:
- (A)
shedding from the surface of the fabric, and
- (B)
shedding from the cut edge of the fabric (see
Figure 1).
Furthermore, textiles act both as a generator of microplastics (the polymeric material in the textile is broken down to micro-sized particles) but also as a carrier of microplastics (dust and other polymeric particles as well as metal, glass and biological material were all found to be present in textiles).
In comparison to other published methods (see
Section 1.2), the proposed method seem to be efficient in limiting the measurement to the actual shedding from the textile surface. Pre-cleaning the fabric surface with vacuum cleaning influences on the end results since the superficial dust and already loose fibres are removed. Further, the sample cutting step has proven to be highly important to ensure the loss of fibres from the surface and not from the cut edges is measured. This insight is important also for the textile industry as it shows an opportunity to mitigate microplastics emissions at factory level when cutting the fabric prior to sewing. The choice to have steel balls inside the bag means aligning with the standard for industry washing for colour fastness where they give mechanical stress at a level representing five domestic washes. Finally, to reduce the human error in counting, microscopy combined with software for automatic counting and fibre identification have been used.
The standard deviation in the validation was reduced to 7.7% compared to the average standard deviation of 25% via some distinct improvements between first and second round. The most important improvements were (1) exclusion of washing powder to prevent clogging of filters, and (2) using a single filter to prevent fibres to stick between the filters (as no spacer was available).
The work presented in this paper takes into consideration the existing standardized methods for textile testing and aims at supporting industry in their vision to measure improvements carried out in textile production and fabric design. It is appreciated that test methods are prone to be used widely if they are reliable, validated, as simple as possible and cheap. With the results at hand, the authors believe that this is a promising method to measure and analyse (in a comparative manner) the efficiency of different mitigation measures to reduce shedding of fabrics, thus reducing microplastics pollution of the oceans.
Author Contributions
Conceptualization, C.J. and S.R.; Methodology, O.L.A., A.-C.H., R.L. and E.H.; Validation, C.J., A.-C.H. and R.L.; Investigation, S.R.; Writing-Original Draft Preparation, C.J. and S.R.
Funding
This research was funded by Swedish Foundation for Strategic Environmental Research (MISTRA) via the Mistra Future Fashion research program, the Swedish Research Council for Environment, Agricultural Sciences and Spatial Planning (Formas) [“MinShed”—Design solutions for minimizing textile shedding (project ID 2017-00959_3, grant agreement No. 2017-00959)]. The authors also thank Sustainable production within XPRES Initiative for excellence in production research and Swerea IVF AB for financial support.
Acknowledgments
The authors acknowledge technical staff at Swerea IVF.
Conflicts of Interest
No conflict of interest.
References
- Bowmer, T.; Kershaw, P. Proceedings of the GESAMP International Workshop on Micro-Plastic Particles as a Vector in Transporting Persistent, Bio-Accumulating and Toxic Substances in the Oceans; The United Nations Educational, Scientific and Cultural Organization: Paris, France, 2010. [Google Scholar]
- United Nations Environment Programme. Marine Plastic Debris and Microplastics—Global Lessons and Research to Inspire Action and Guide Policy Change; United Nations Environment Programme: Nairobi, Kenya, 2016. [Google Scholar]
- Mato, Y.; Isobe, T.; Takada, H.; Kanehiro, H.; Ohtake, C.; Kaminuma, T. Plastic Resin Pellets as a Transport Medium for Toxic Chemicals in the Marine Environment. Environ. Sci. Technol. 2001, 35, 318–324. [Google Scholar] [CrossRef] [PubMed]
- Arias-Andres, M.; Klümper, U.; Rojas-Jimenez, K.; Grossart, H. Microplastic pollution increases gene exchange in aquatic. Environ. Pollut. 2018, 237, 253–261. [Google Scholar] [CrossRef] [PubMed]
- Boucher, J.; Friot, D. Primary Microplastics in the Oceans: A Global Evaluation of Sources; International Union for Conservation of Nature: Gland, Switzerland, 2017. [Google Scholar]
- Wright, S.L.; Thompson, R.C.; Galloway, T.S. The physical impacts of marine organisms: A review. Environ. Pollut. 2013, 178, 483–492. [Google Scholar] [CrossRef] [PubMed]
- Van Cauwenberghe, L.; Janssen, C.R. Microplastics in bivalves cultured for human consumption. Environ. Pollut. 2014, 193, 65–70. [Google Scholar] [CrossRef] [PubMed]
- Essel, R.; Engel, L.; Carus, M.; Ahrens, R.H. Sources of Microplastics Relevant to Marine Protection in Germany; Umweltbundesamt: Dessau-Roßlau, Germeny, 2015. [Google Scholar]
- Andersson, E. Micro Plastics in the Oceans and their Effect on the Marine Fauna; Sveriges Lantbruksuniversitet: Uppsala, Sweden, 2014. [Google Scholar]
- Völker, C.; Kramm, J.; Kerber, H.; Schramm, E.; Winker, M.; Zimmermann, M. More Than a Potential Hazard—Approaching Risks from a Social-Ecological Perspective. Sustainability 2017, 9, 1039. [Google Scholar] [CrossRef]
- Rist, S.; Carney, B.; Hartmann, N.B.; Karlsson, T.M. A critical perspective on early communications concerning human health aspects of microplastics. Sci. Total Environ. 2018, 626, 720–726. [Google Scholar] [CrossRef] [PubMed]
- Mellin, P.; Jönsson, C.; Åkermo, M.; Fernberg, P.; Nordenberg, E.; Brodin, H.; Strondl, A. Nano-sized by-products from metal 3D printing, composite manufacturing and fabric production. J. Clean. Prod. 2016, 139, 1224–1233. [Google Scholar] [CrossRef]
- Andrady, A.L. Microplastics in the marine environment. Mar. Pollut. Bull. 2011, 62, 1596–1605. [Google Scholar] [CrossRef] [PubMed]
- Jönsson, C.; Mellin, P.; Schellenberger, S.; Arturin, O.L.; Hanning, A. Characterisation of microplastic fibres released by functional textiles during washing. J. Clean. Prod. 2018. submitted for publication. [Google Scholar]
- Browne, M.A.; Crump, P.; Niven, S.J.; Teuten, E.; Tonkin, A.; Galloway, T.; Thompson, R. Accumulation of microplastic on shorelines woldwide: Sources and sinks. Environ. Sci. Technol. 2011, 45, 9175–9179. [Google Scholar] [CrossRef] [PubMed]
- Thompson, R.C.; Olsen, Y.; Mitchell, R.P.; Davis, A.; Rowland, S.J.; John, A.W.; McGonigle, D.; Russell, A.E. Lost at sea: where is all the plastic? Science 2004, 304, 838. [Google Scholar] [CrossRef] [PubMed]
- De Falco, F.; Gullo, M.P.; Gentile, G.; Di Pace, E.; Cocca, M.; Gelabert, L.; Brouta-Agnésa, M.; Rovira, A.; Escudero, R.; Villalba, R.; et al. Evaluation of microplastic release caused by textile washing processes of synthetic fabrics. Environ. Pollut. 2017, 236, 916–925. [Google Scholar] [CrossRef] [PubMed]
- Swedish Environmental Agency. Mikroplaster—Redovisning av Regeringsuppdrag om Källor till Mikroplaster och Förslag på Åtgärder för Minskade Utsläpp i Sverige; Swedish Environmental Agency: Stockholm, Sweden, 2017. [Google Scholar]
- The Fiber Year. The Fiber Year 2017. World Survey on Textile & Nonwovens; The Fiber Year: Speicher, Switzerland, 2017. [Google Scholar]
- Sustainable Development Goals. Available online: http://www.un.org/sustainabledevelopment/poverty/ (accessed on 30 October 2015).
- California Legislative Information. California’s Assembly Bill AB 2379. Available online: http://leginfo.legislature.ca.gov/faces/billTextClient.xhtml?bill_id=201720180AB2379 (accessed on 13 July 2018).
- Outdoor Industry Association. Outdoor Industry Association Priority Issues Brief: Microfibers; Outdoor Industry Association: Boulder, CO, USA, 2016. [Google Scholar]
- Mowbray, J. More concerns on textile microplastic pollution. Ecotextile News, 30 September 2015. [Google Scholar]
- Roos, S.; Arturin, O.L.; Hanning, A. Microplastics Shedding from Polyester Fabrics; Mistra Future Fashion: Stockholm, Sweden, 2017; Available online: http://mistrafuturefashion.com/wp-content/uploads/2017/06/MFF-Report-Microplastics.pdf (accessed on 13 July 2018).
- Bruce, N.; Hartline, N.; Karba, S.; Ruff, B.; Sonar, S.; Holden, P. Microfiber Pollution and the Apparel Industry; University of California Santa Barbara, Bren School of Environmental Science & Management: Santa Barbara, CA, USA, 2015. [Google Scholar]
- Pirc, U.; Vidmar, M.; Mozer, A.; Krzan, A. Emissions of microplastic fibers from microfiber fleece during domestic washing. Environ. Sci. Pollut. Res. 2016, 23, 22206–22211. [Google Scholar] [CrossRef] [PubMed] [Green Version]
- Napper, I.E.; Thompson, R.C. Release of synthetic microplastic plastic fibres from domestic washing machines: Effects of fabric type and washing conditions. Mar. Pollut. Bull. 2016, 112, 39–45. [Google Scholar] [CrossRef] [PubMed]
- Petersson, H.; Roslund, S. Tvättemission: En Undersökning av Polyesterplaggs Fiberutsläpp vid Hushållstvättning. Bachelor’s Thesis, University of Borås, Borås, Sweden, 2 June 2015. [Google Scholar]
- Åström, L. Shedding of Synthetic Microfibers from Textiles; University of Gothenburg: Gothenburg, Sweden, 2016. [Google Scholar]
- International Organization for Standardization. ISO 9073-10:2003 Textiles—Test Methods for Nonwovens—Part 10: Lint and Other Particles Generation in the Dry State; International Organization for Standardization: Geneva, Switzerland, 2003. [Google Scholar]
- International Organization for Standardization. ISO 105-E03:2010 Textiles—Tests for Colour Fastness—Part E03: Colour Fastness to Chlorinated Water (Swimming-Pool Water); International Organization for Standardization: Geneva, Switzerland, 2010. [Google Scholar]
- International Organization for Standardization. ISO 105-C06:2010 Textiles—Tests for Colour Fastness—Part C06: Colour Fastness to Domestic and Commercial Laundering; International Organization for Standardization: Geneva, Switzerland, 2010. [Google Scholar]
- International Organization for Standardization. ISO 105-C12:2004 Textiles—Tests for Colour Fastness—Part C12: Colour Fastness to Industrial Laundering; International Organization for Standardization: Geneva, Switzerland, 2004. [Google Scholar]
- International Organization for Standardization. ISO 6330:2012 Textiles—Domestic Washing and Drying Procedures for Textile Testing; International Organization for Standardization: Geneva, Switzerland, 2012. [Google Scholar]
- International Organization for Standardization. ISO 18413:2015 Hydraulic Fluid Power—Cleanliness of Components—Inspection Document and Principles Related to Contaminant Extraction and Analysis, and Data Reporting; International Organization for Standardization: Geneva, Switzerland, 2015. [Google Scholar]
© 2018 by the authors. Licensee MDPI, Basel, Switzerland. This article is an open access article distributed under the terms and conditions of the Creative Commons Attribution (CC BY) license (http://creativecommons.org/licenses/by/4.0/).

 ,
, 


