Article

Monetary Valuation of Urban Forest Attributes in Highly Developed Urban Environments: An Experimental Study Using a Conjoint Choice Model

1
Department of Forestry and Landscape Architecture, Konkuk University, Gwangjin-gu, Seoul 05029, Korea
2
Graduate Program, Department of Environmental Science, Konkuk University, Gwangjin-gu, Seoul 05029, Korea
3
Department of Ecological Landscape Architecture Design, Kangwon National University, Chuncheon 24341, Korea
*
Author to whom correspondence should be addressed.
Sustainability 2018, 10(7), 2461; https://doi.org/10.3390/su10072461
Submission received: 26 June 2018 / Revised: 7 July 2018 / Accepted: 12 July 2018 / Published: 13 July 2018
(This article belongs to the Special Issue Common-Pool Resources and Sustainability)

Abstract

:
It is important to integrate user preferences and demands into the design, planning, and management of urban forests. This is particularly important in highly urbanized areas where land is extremely limited. Based on a survey with 600 participants selected by quota sampling in Seoul, Korea, we developed a conjoint choice model for determining the preferences of urban dwellers on urban forest attributes, the levels of attributes, and the preferences for particular attributes. Then, the preferences were transformed into monetary values. The results indicated that urban dwellers preferred broadleaved forests over coniferous forests, soil-type pavement materials over porous elastic pavement materials on trails, and relatively flat trails over trails with steep slopes. The model indicated that participants were willing to pay an additional 11.42 USD to change coniferous forest to broadleaved forest, 15.09 USD to alter porous elastic pavement materials on trails to soil-type pavement materials on trails, and 23.8 USD to modify steeply sloping trails to relatively flat trails. As previously reported, considerable distance decay effects have been observed in the user preferences for urban forests. We also found a significant difference in the amount of the mean marginal willingness to pay among sociodemographic subgroups. In particular, there were significant positive responses from the male group to changes in urban forest attributes and their levels in terms of their willingness to pay additional funds. By contrast, the elderly group had the opposite response. In this study, we were not able to integrate locality and spatial variation in user preferences for urban forests derived from locational characteristics. In future studies, the role of limiting factors in user preferences for urban forests and their attributes should be considered.

1. Introduction

Urban forests are valuable and integral components of the urban environment. In previous studies, urban forests have been shown to provide numerous ecological and environmental benefits such as enhancing water quality, improving air quality, conserving energy, carbon storage, reducing storm water runoff, and enhancing biodiversity (e.g., [1,2,3,4,5,6,7,8]). At the same time, it has been well documented that urban forests and parks increase property values and housing prices in major cities worldwide [9,10,11,12,13,14] and moderate the adverse effects of chemical facilities in cities on property values [15]. In these studies, forests in urban settings enhance the aesthetic appeal of houses and neighborhoods, which has positive effects on housing prices and property values. In many studies, urban forests have also been shown to have psychological effects. Interestingly, urban forests increase neighborhood satisfaction [16,17] and enhance social interactions among residents in the community [18]. Recent studies on the benefits of urban forests have paid more attention to the wellbeing and health of urban dwellers, which is critical for securing sustainability of urban ecosystem in where human systems and eco-systems are strongly tied. For example, Tyrväinen (2001) [14] investigated the influence of urban green environments on stress relief in a study with 95 participants in Helsinki, Finland, and reported that natural settings may differ in terms of their restorative quality. Their results also suggested that remaining longer than 15 min in a natural environment was necessary to enhance the feelings of vitality. In addition, many recent studies have reported significant positive relationships of urban forests with mortality, physical conditions, mental indicators, and the level of physical activity undertaken by urban residents [19,20,21,22,23,24].
Despite the numerous positive effects of urban forests, most cities around the world have experienced a loss of forested area due to urban sprawl, population growth, and infrastructure developments [25]. It is very common to neglect the value of urban forests during land use decision making and the planning process, because policy makers and planners tend to undervalue urban forests compared to other land uses such as commercial, residential, and industrial land uses. For these reasons, researchers and scientists have attempted to assess the value of urban forests in monetary terms [26]. Many studies have demonstrated that the extent of urban forest or forest views in urbanized areas has significant economic value (e.g., [13,14,15,27,28,29]). With such knowledge of the value of urban forests, decision makers, planners, and stakeholders would be better equipped to argue for the preservation of forested areas in cities during the decision making and planning processes. In turn, this might secure the quality of urban environments, reduce the adverse effects of urbanization, and enhance the wellbeing of urban dwellers.
However, most previous studies have mainly focused on the extent of urban forest, forest views, or time spent in forests when considering the environmental, ecological, socio-economic, psychological, and physiological benefits of urban forests. Although such knowledge of the positive effects of urban forests and forest views might provide significant theoretical insights into the decision making and land use planning processes, it is not sufficient for urban forest designers and managers in practice. Designers and managers inevitably require more detailed information and knowledge of how urban dwellers respond to different forest attributes and how the different levels of forest attributes differ in terms of monetary value. A number of studies have investigated user preferences on the attributes of urban forests from a recreational perspective (e.g., [30,31,32]). It is difficult to utilize user preferences for particular attributes and the levels of attributes in practice, because the measurements of preferences made in previous studies have mostly been conceptual.
We assessed the preferences of urban dwellers for urban forests and estimated the relative monetary values of the general attribute levels of urban forests. In this study, we used the term ‘urban forests’ in a broad sense. Specifically, we considered urban forests to be all areas with trees such as small mountains, riparian buffers, neighborhood parks, and small urban parks that urban dwellers can easily access in their daily life. The underlying assumption was that people selected an urban forest that was equipped with the most preferable attributes and attribute levels among given alternative destinations to maximize their utility when visiting urban forests. We assumed that the differences in preference for particular attributes and their levels could be transformed into a monetary value.
Interpreting the preferences of urban dwellers as a monetary value could provide the relative importance of the attributes and attribute levels of urban forests. Often, it is very difficult to justify preserving urban forests or creating new urban forests in densely urbanized areas. According to many previous studies that have used choice models to select recreational sites in urban settings, the attributes of urban forests have a significant impact on the selection of recreational destinations by urban dwellers (e.g., [33,34,35]), and the preferred attributes of urban forests can be estimated in monetary terms [33,36,37]. Such knowledge and information could play a significant role in communicating with stakeholders during the decision-making process for securing sustainable urban systems. In this regard, it is a serious challenge for planners, designers, and forest managers to understand how to accommodate user preferences in practice.

2. Methods and Materials

2.1. A Conjoint Choice Model Approach

The approaches to valuing environmental amenities can be classified into either direct or indirect approaches. Typically, direct approaches ask urban dwellers how much they would willingly pay for an improvement in environmental amenities, whereas indirect approaches use the actual choices made by participants to develop a choice model [38]. A choice experiment (CE) is an indirect approach rooted in conjoint analyses, in which participants choose among multi-attribute goods [39]. The underlying theories of the CE approach are the characteristics theory of value [40] and random utility theory [41,42]. In the CE approach, participants are asked to choose among different bundles of environmental goods described in terms of their attributes, characteristics, and levels [39]. Compared to other approaches, the CE has several advantages. In particular, it is easy for investigators to estimate the value of the individual attributes, which is important because many management and planning decisions are concerned with changing attribute levels rather than losing or gaining attribute levels. CE is able to identify the marginal values of attributes that may be difficult to identify using the preference data that is revealed because of co-linearity or a lack of variation. The repeated sampling approach of CE also allows for internal consistency [39,43,44]. Because of these known benefits, we adopted the CE approach to investigate the preferences of urban dwellers for the attributes of urban forests. In fact, this approach has been effectively used in investigating preferences or values of non-market public goods (e.g., urban forests, water, ecosystem services, and environmental diversity) in urban forest studies or related areas [25,30,35,36,37,38,39,44].
In the general hypothesis of a CE, individuals attempt to integrate information about a number of variables (i.e., attributes) characterizing the given choice alternatives using their own rules. Of all of the variables, only information about the particular salient attributes is used to select alternatives due to the available information, limited information processing capabilities of humans, limited time, and/or individual differences. It is assumed that the utility of an individual after selecting a particular alternative can be represented as a combination of deterministic components and error terms [45] (Equation (1)).
U a = V a + ε a
The utility of an alternative ( U a ) can be estimated, with the deterministic components ( V a ) and random error ( ε a ) reflecting the measurement error and omitted explanatory variables, respectively. The linear function of the deterministic component depends on the way in which the part-worth utilities are combined; then Equation (1) can be transformed to Equation (2).
V a = + β k X k ( a = 1 ,   ,   K ) ,
where
  • = alternative specific constant (ASC);
  • β = parameter vector of the attributes; and
  • X = vector of k attributes from a choice set.
However, it is impossible to include socioeconomic variables and taste variables directly into the utility function because they are invariant across the alternatives in a choice set. Alternatively, these socioeconomic and taste variables can be included as interactions, with the ASC used for alternatives [46,47], as in Equation (3).
V a = + S h + β k X k + ε a ( h = 1 ,   ,   H ) ,
where
  • S h = socioeconomic or taste variables.
Based on the random utility theory, the CE assumes that choices are made in a utility-maximization process in which individuals tend to select the option maximizing utility on the basis of their circumstances. The probability that an individual will choose alternative a over option j is given by Equation (4), and the probability of choosing alternative a among a complete set of alternatives set can be estimated by Equation (5).
Ρ ( a | i ) = Ρ ( V a + ε a > V j + ε j ) , all   j i
Ρ ( a | i ) = exp ( V a ) j i exp ( V j ) ,
where
  • Ρ ( a | i ) = probability of choosing alternative a from i (i = 1, 2, …, n);
  • i = given complete alternative sets; and
  • V a = utility of alternative.
Then Equation (5) is estimated by means of a multi-nomial logit regression because the choices are affected not only by the levels of variables comprising alternatives but also by various surrounding conditions, and individuals may choose different alternatives, although the choice alternatives remain constant [48]. Therefore, a CE can directly predict choices in the form of the logit model by calculating the part-worth of attribute levels (or values) obtained from choice-type data rather than preference data. Eventually, it is possible to estimate the economic value of an attribute’s level by linking a price or cost factor with the levels (or values) of attributes, based on the choices made by urban dwellers. In this study, we developed a conjoint choice model based on Equation (5) with selected salient attributes. The larger the coefficient of levels of a certain attribute the larger the effects of the different levels of the attribute and the larger the difference in the preferences for the alternatives resulting from the different levels. If participants do not differ in their preferences for urban forests by attribute level, the estimated parameters are not significantly different from zero.

2.2. Determination of Salient Attributes and Their Levels

The recreational destination selections made by urban dwellers are significantly affected by the salient attributes of urban forests, and these attributes can be estimated to be a monetary value allowing planners and decision makers to compare the relative importance or degree of relative preference held by an urban dweller for a specific salient attribute of urban forests. However, it is difficult to specify which salient attributes are applicable for all urban forests because the characteristics of the forests and demands of visitors could vary greatly among countries, regions, and sites. For example, Atmiş et al. (2017) [33] recently reported that the decision factors in urban forest management in Turkey were forest versatility (e.g., variety in tree species), management intensity (e.g., well-staffed administrative unit), visitor services (e.g., general and information services), tranquility (e.g., lack of sport facilities and variety in number of animal species), and forest activities (e.g., sport facilities and terrace viewing platforms). In European cases, key attributes affecting forest selection were the phase of tree development, management intensity, and tree species type [31]. In South Korea, Koo et al. (2013) [36] investigated the relative importance attributes (e.g., trail length, biodiversity, accessibility, environmental education programs, and slope) of urban forests that affect the use of urban forests by urban dwellers using an “entrance fee.” The results of this study revealed differences in the marginal willingness to pay (MWTP) among the various attributes and user groups. It was found that the majority of respondents were willing to pay an additional 3.29 USD per visit (i.e., an additional entrance fee) to enter an urban forest with a rich level of biodiversity compared to an urban forest with a low level of biodiversity. These results supported the findings of other studies reporting positive correlations between the level of biodiversity and willingness to pay (WTP) (e.g., [49,50,51,52]). Interestingly, the preferences of urban dwellers for particular attributes of urban forests were different for the different major activity types that visitors wanted to undertake in the urban forest [53]. Andrada II et al. (2015) [54] reported similar results indicating that the preferences of urban dwellers for particular attributes of urban forests could vary depending on the reasons for the visit, age, sex, education level, visiting season, and frequency of visit. Despite the differences in the preferences of urban dwellers for particular attributes of urban parks among sub-user groups, the overall preferences were for high levels of plant variety, a scattered planting pattern, a variety of plant colors, and a managed plant distribution [54]. Edwards et al. (2012) [31] also reported that user preferences were positively correlated with tree size, mixed stand type, and the presence of broadleaved species, but no relationships were found with type and number of tree species in urban forests in Europe. A preference for broadleaves over coniferous forests was also found in a study of Korean forests [55]. The importance of the salient attributes of urban forests was consistent in small urban parks. According to Nordh (2011) [35], physical elements such as the amounts of grass, trees, and visitors in small urban parks were the most influential factors on the choices made by urban dwellers among park alternatives in urban settings. Urban dwellers were likely to select an urban park with large grass areas, many trees, and less crowded conditions among given alternative parks.
From previous studies, we were able to extract a few salient attributes of urban forests that affected the recreational destination selections made by urban dwellers in urbanized areas. However, it was not appropriate to include all of the potential salient attributes in the hypothetical model, because a number of studies have suggested that optimal conditions may not include more than seven attributes and four levels for each attribute in a choice experimental model [56,57]. The refining process (i.e., a literature review, preliminary analyses, and discussions with practitioners) resulted in five salient attribute types, each of which was assigned three or four levels. The selected salient attributes of urban forests were forest tree type (broadleaved trees, mixed, coniferous), paving material (soil-type, wooden deck, porous elastic) topography (hilly, flat, mountainous), walking time (≤1 h, between 1–2 h, ≥2 h), and travel time from home (≤15 min, 15–30 min, 30–60 min, ≥ 60 min). A “fund” value was included as an urban forest attribute to calculate the MWTP. The levels of attribute types were coded in a dummy format (i.e., select: 1, not select: 0) for model estimation. All attributes except “fund” were also coded as dummy variables to allow an estimation of the change from the baseline case (Table 1).
Despite the forest development stage (i.e., tree age or tree size) being a significant variable affecting user preferences for urban forests in previous studies (e.g., [31]), it was not included in this study because tree age was almost invariant across the country. In Korea, most forests in urbanized areas and natural areas were simultaneously created and managed by the Korean Forest Services after the Korean War. Thus, we only included tree type in the model. Walking is the most common activity in urban forests [58,59], and the characteristics of trails for walking are key factors in a user’s preferences for urban forests. In previous studies, people showed a preference for non-hardened paths over hardened paths [60,61]. In a previous study, preferences for trail length (or walking time) in urban forests were dependent on the user group, as classified by the frequency of visits to urban forests. The higher-frequency group preferred a longer trail than the lower frequency group [62]. In general, people prefer hilly topography over flat topography in urban forest areas (e.g., [61]), but the relative importance of topography is relatively low (e.g., [36,60]). However, we included topography of trails in the model because topography (i.e., slope) is critical for elder users in terms of accessibility. It has been widely accepted that there is a distance decay effect in the frequency of visits to urban forests or preferences for a particular urban forest. In England, more than 70% of respondents preferred an urban forest that was only a 5 min walk from their home [63]. In the United States, about 80% of metropolitan local trail users were people living within a distance of 5 miles from the trail [60]. In a Chinese study, the mean Euclidean distance to most urban parks was between 1 and 3 km [64], which was shorter than the distance studied in the United States.

2.3. MWTP and Bid Amount

MWTP is the additional amount of money for which individuals are willing to pay for a particular attribute’s level in a certain product. In other words, MWTP indicates how much individuals are ready to pay for an upgrade from level A to level B for an attribute (i.e., extra price above the current price they are already paying). The essential characteristics of the MWTP are the marginal rate of substitution among levels, prices, or costs of an alternative, and thus can be estimated by determining the ratio between the estimated parameter for an alternative k and an estimated parameter of price [32,65] (Equation (6)).
MWTP = β k β p r i c e ,
where
  • βk = coefficient of non-monetary attribute k; and
  • βprice = coefficient of price.
Many previous studies have adopted “tax” or “entrance fee” as the payment vehicle to calculate the MWTP (e.g., [37,39,66]). However, we used “fund” as the payment vehicle to compute the MWTP because not all residents in our study area visited urban forests, and additional tax payments for non-user groups would make it difficult to determine the exact MWTP. At the same time, there is no entrance fee for urban forests in Korea, and adopting “entrance fee” as the payment vehicle might result in negative answers from participants, resulting in a strategically biased WTP. Compared to the other types of payment, the use of fund did not cause a serious strategic bias [67]. For the analyses, the bid amount was decided on the basis of previous studies (e.g., [55,68]) and the results of a preliminary study which was performed from 1 to 6 June 2017 with 115 college students at Konkuk University in Seoul, Korea. Based on the results of the preliminary study, we selected 5000 KRW (4.62 USD), 10,000 KRW (9.24 USD), 30,000 KRW (27.72 USD), and 50,000 KRW (46.2 USD) as the bid amounts (Table 2).

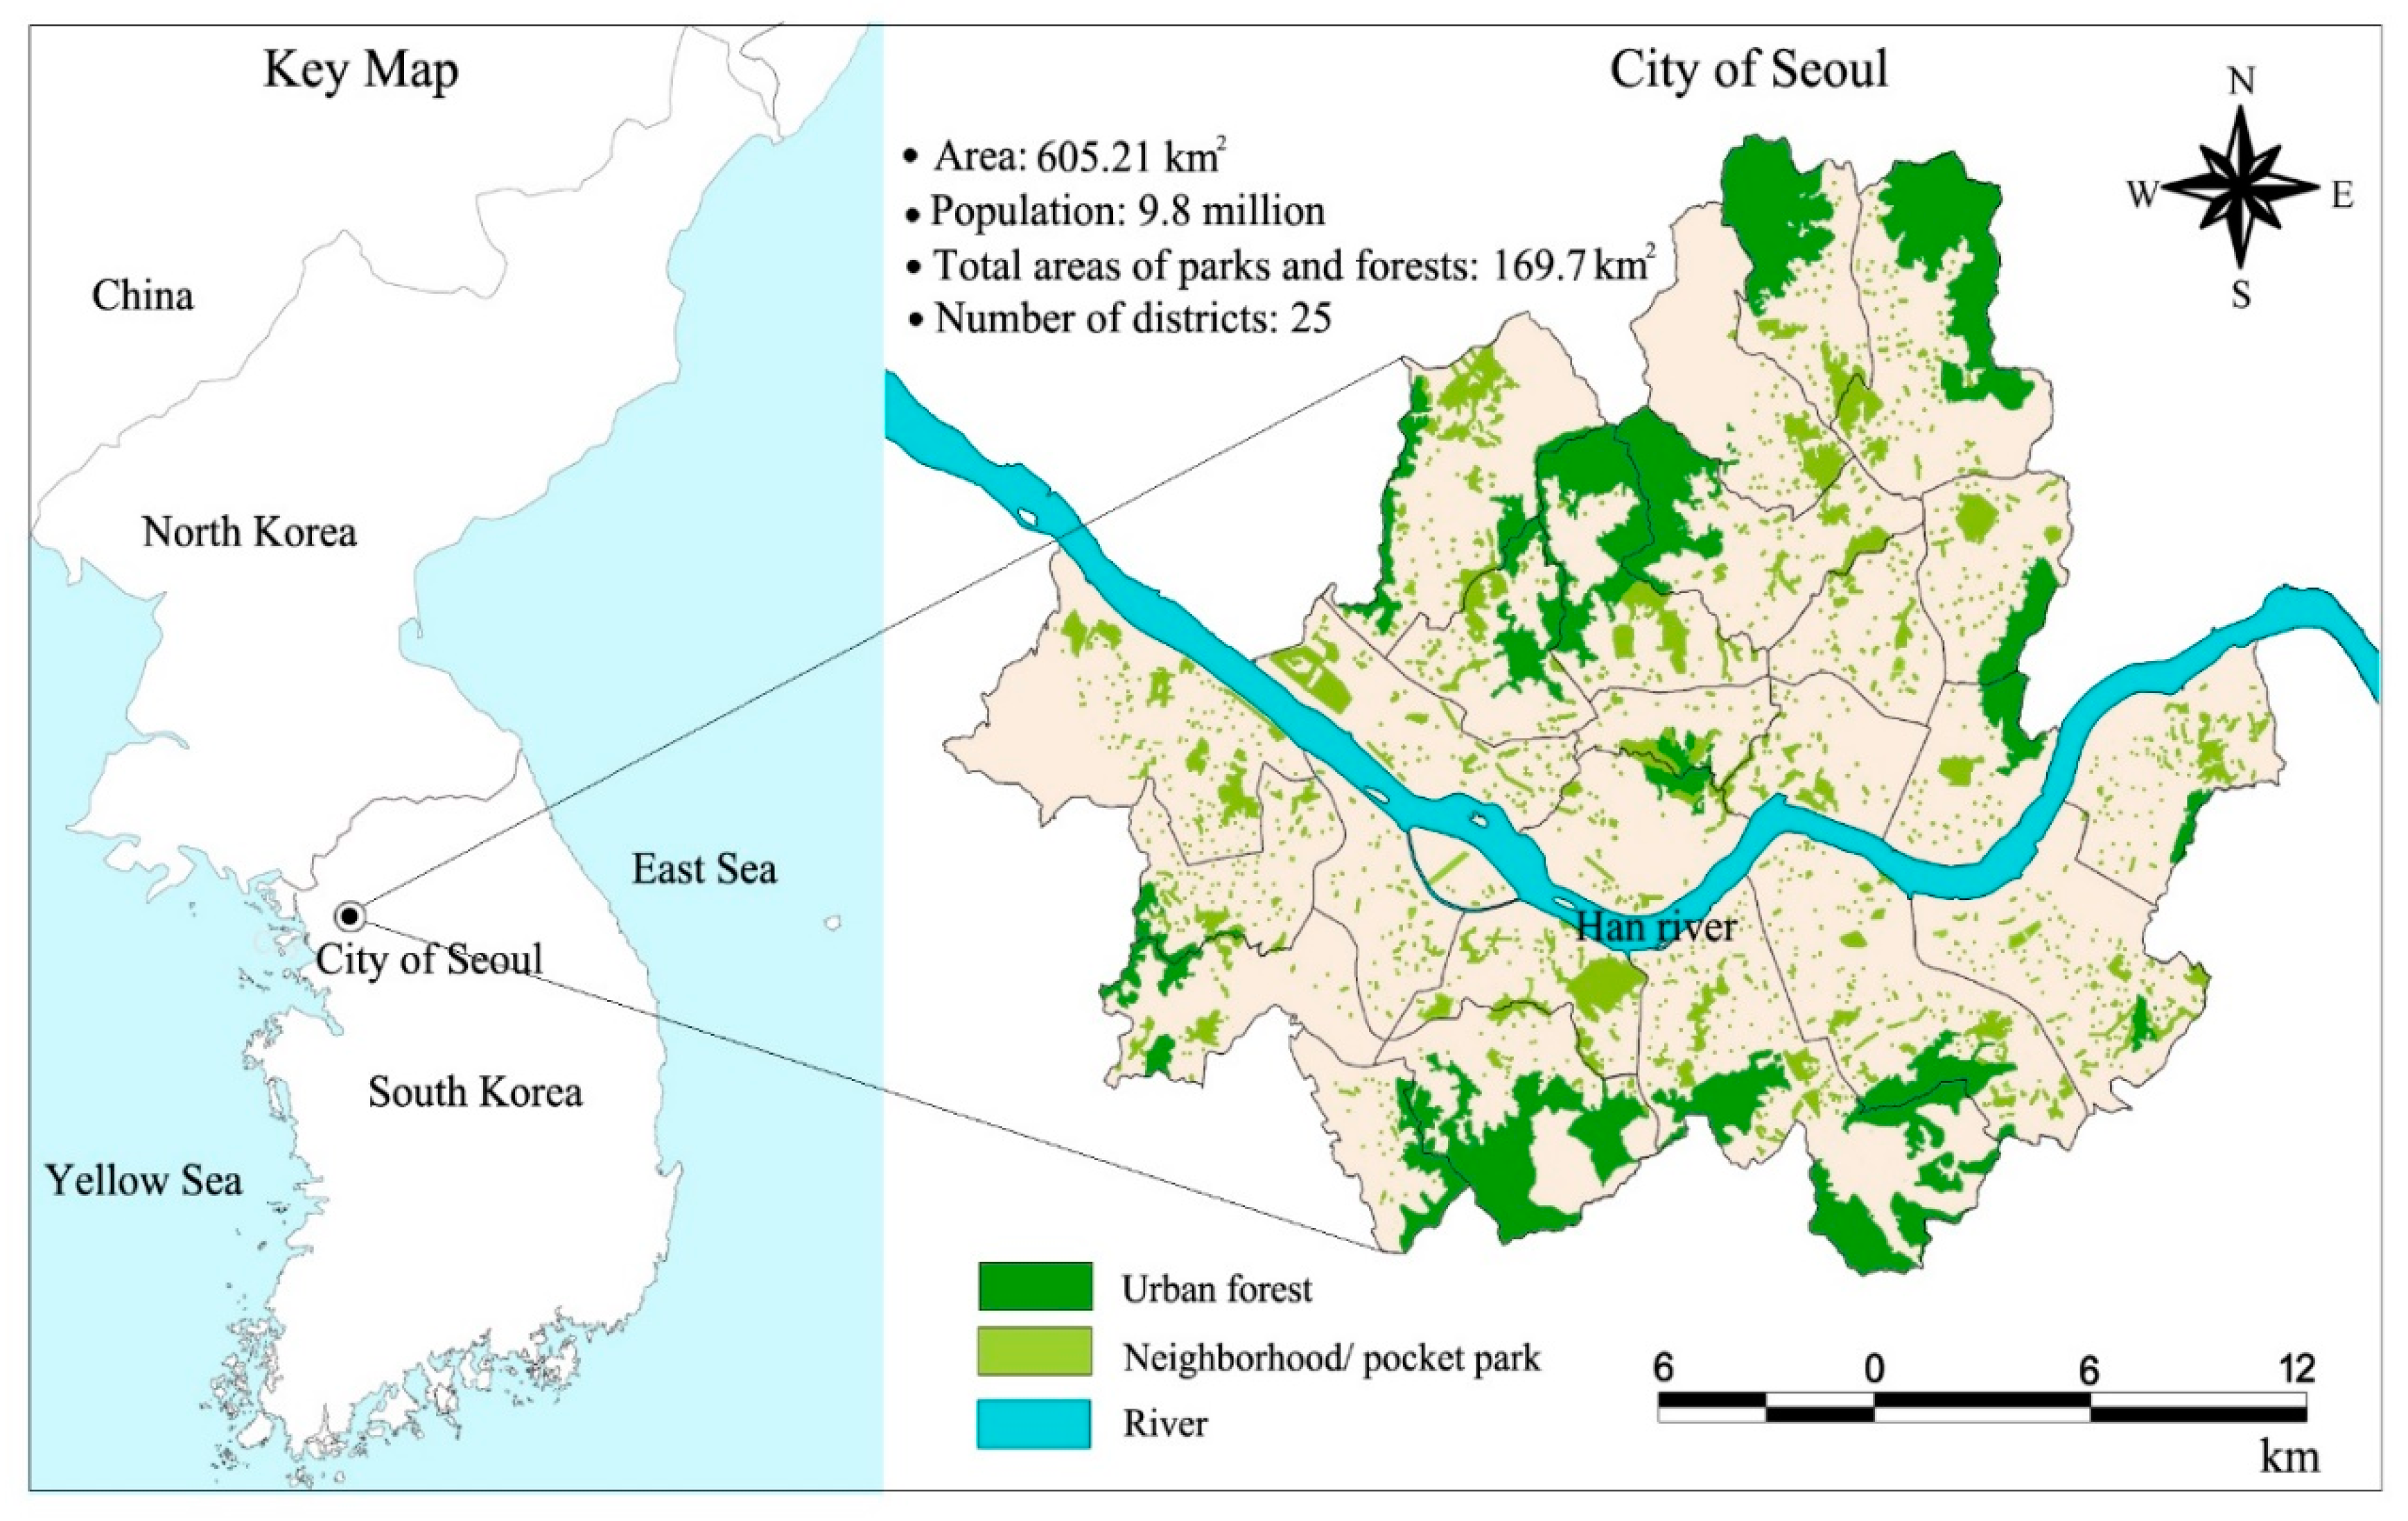
2.4. Characteristics of the Study Area and Sampling

The study was conducted in the City of Seoul, the capital of South Korea, in 2016. The Han River crosses the city from east to west and separates the old districts in the north from the new districts in the south. According to government statistics [69], the City of Seoul has a population of about 9.8 million, and the city boundary encompasses about 605.21 km2 including 25 sub-districts. About 169.7 km2 (28.0%) of the city is forested, encompassing various land use zones, such as urban natural forests, neighborhood parks, pocket parks, and children’s parks. The city is surrounded by densely forested mountains, except on the west side, while various neighborhood parks, small urban parks, and children’s parks are scattered throughout the city, with most located in central areas (Figure 1).

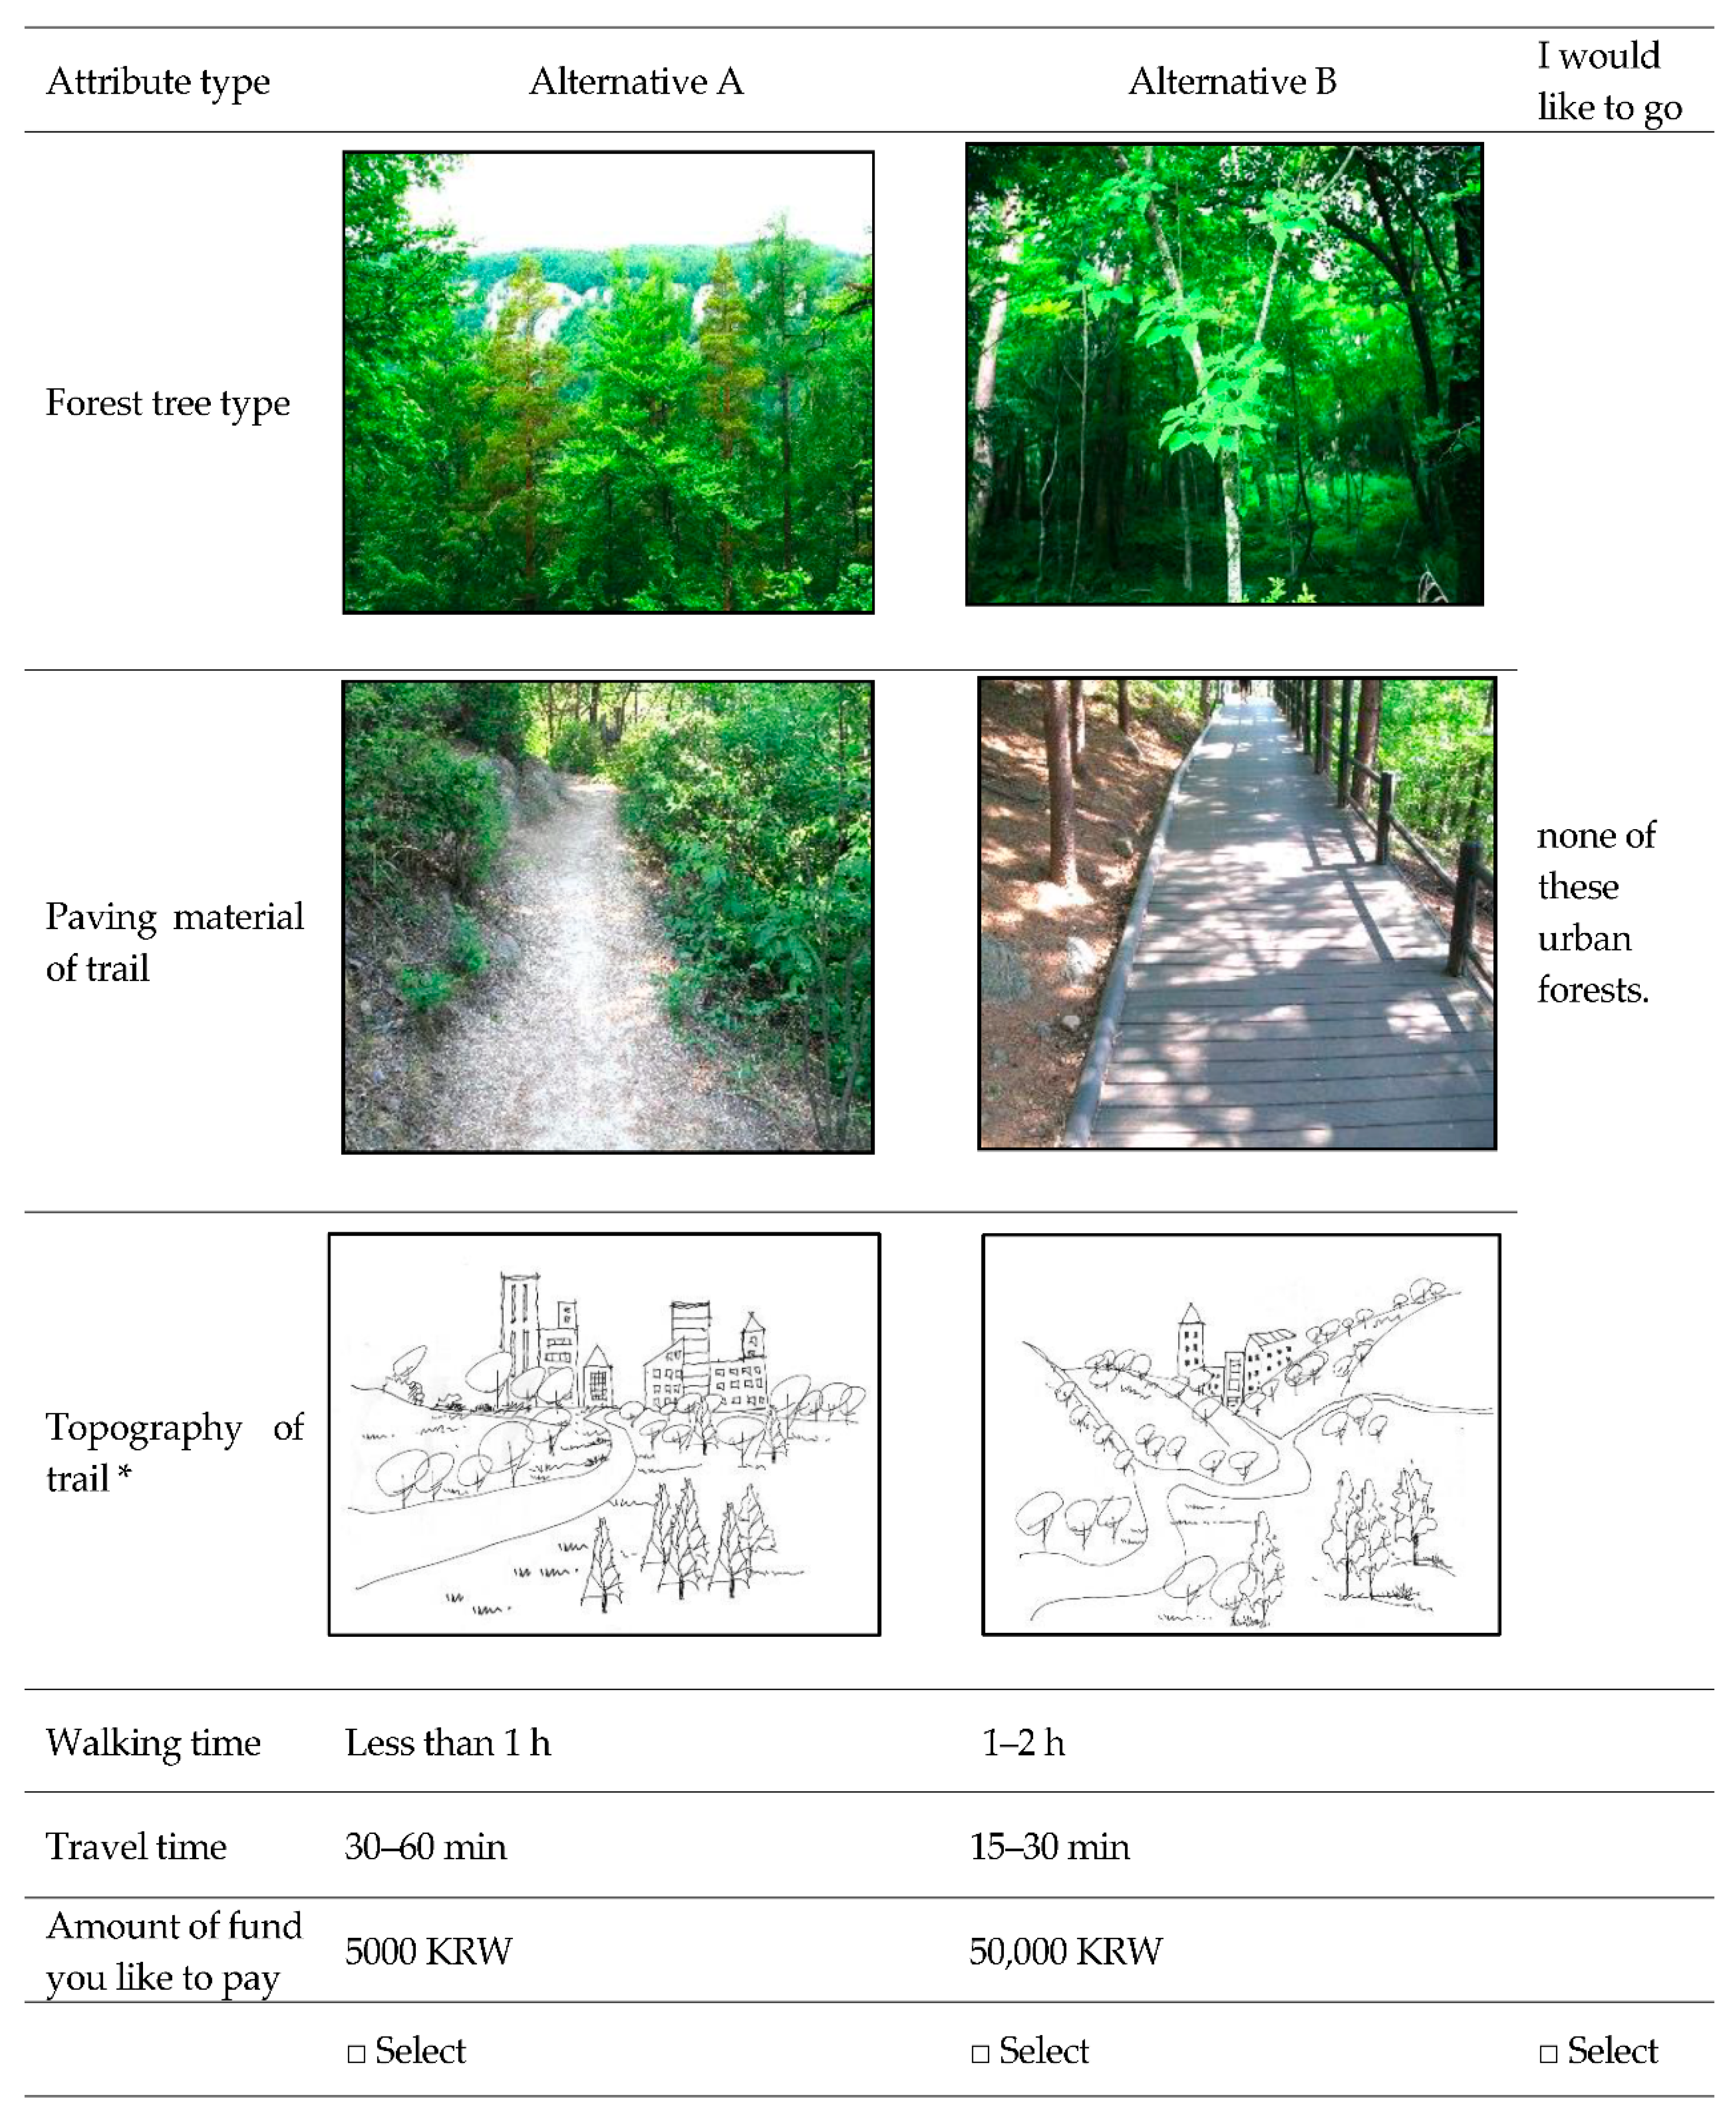
2.5. Constructing Hypothetical Choice Sets and Data Collection

Hypothetical alternatives for urban forest preferences were constructed using the six levels of attributes provided in Table 1, and two 64 choice set profiles were generated through a double fractional factorial design. The 64 choice sets were generated by randomly selecting one hypothetical alternative out of each of the two 64 profiles and adding the base alternative “I would not select both of them”. To secure the validity of responses, we tried to enhance the participants’ understanding of the choice attributes by providing example images for some questions. We designed the survey method so that each choice set had one base alternative and two alternatives, which were constructed by changing the levels of the attribute. It was demanding in terms of time for one respondent to evaluate all 64 choice sets, and participants might not be able to maintain their attention during the evaluation. To make the evaluation easier, each respondent was provided with only eight choice sets that were randomly selected from the 64 choice sets. Therefore, eight participants were needed to evaluate all 64 choice sets. A web survey of residents of Seoul was conducted by a polling agency (see Figure 2 for an example of the questionnaire used in the survey). Using quota sampling, based on the population of five geographical regions, ages, and sex ratio, a total of 600 residents were selected during 3 to 13 August 2017 (Table 3).

3. Results and Discussion

3.1. Profiles of Participants and Visiting Characteristics

The total number of participants was 600, and Table 4 describes the overall characteristics of participants in this study. The majority of participants had graduated from high school (12.3%), were attending college (8.5%), or had graduated from college (79.0%). The largest group of participants was office workers (42.5%), and the second largest group was homemakers (12.0%). The other occupation groups included students (8.7%), managers (8.0%), and the self-employed (8.0%). The ratio of monthly household income of participants within groups was relatively similar among regional groups. The largest income group was 5,000,000–6,000,000 KRW (4620–5544 USD) and the second largest income group was 4,000,000–4,500,000 KRW (3696–4158 USD). More than 50% of participants were married, and most had no children (elementary school age) at home (78.9%). Due to the survey design, there were equal numbers of male and female participants. There was also an almost even age distribution, with ages ranging from 20 to 60 years classified into four groups. The visiting frequency analyses indicated that 339 (56.5%) participants visited urban forests at least once a month. More than 61% (371 participants) stayed in the urban forest at least more than 1 h, with the highest frequency of time spent in the urban forest of 1–2 h (45.0%). The majority of participants usually visited the urban forest on weekends (272 participants, 50.4%), and in the afternoon (1–6 PM) (241 participants, 44.64%). Most participants visited the urban forest with family members (268 participants, 49.6%) and accessed the forests by walking (275 participants, 50.9%) or car (129 participants, 23.9%). The survey results also indicated that most participants (482 participants, 89.2%) could access an urban forest within 1 h. To summarize, most participants in this study visited the urban forests more than once a month in the afternoon on weekends with family members and stayed more than 1 h. They also visited urban forests that were accessible within 1 h by walking or driving. The main purposes of visiting urban forest were walking, resting, exercise, being away from home, spending time with family members, and enjoying the natural environment.

3.2. Estimated Model and Preferred Urban Forest Attributes

The estimated choice experiment model, which was composed of hypothetical salient urban forest attributes and their levels, is shown in Table 5. The likelihood ratio index (indicator of the overall goodness-of-fit, ρ2) was 0.1823, which was very close to the extremely good fit range (0.2–0.4) [70]. In a general sense, the constant of the model (i.e., ASC value) indicated the difference in utility between the changes in urban forests and the base alternative of no urban forest visit. In a practical sense, a positive coefficient of the constant indicated a user’s WTP a certain amount of money for visiting their preferred urban forest [71,72]. The constant of the estimated model had a negative sign but was not significant, which suggests that there were no significant differences between the probabilities of visiting and not visiting any of the given urban forest alternatives. The insignificance of the constant in the estimated model might indicate that participants were not very willing to change or enhance the attributes of urban forests. One reason for the insignificance of the constant could be the relatively high proportion of participants that were none- and low-frequency urban forest visitors (less than three times a year) in the sample (43.3%). The estimated model also indicated significant differences in the preferences of the participants for all attribute levels except trial length. The model suggested that participants significantly preferred broadleaved (b = 0.4361) or mixed forests (b = 0.3390) over coniferous forests (i.e., base level of forest tree type). Urban dweller utility could be increased by converting coniferous forests into mixed or broadleaved forests. This enhancement of the utility of an urban dweller would be higher if coniferous forests were converted into broadleaved forests rather than mixed forests. Urban dwellers preferred natural trails with a wooden deck (b = 0.5066) or soil-type pavement (b = 0.5765) rather than a porous elastic pavement. The positive coefficients of a wooden deck or soil-type pavement indicated that simply changing the trail pavement materials to a wooden deck or soil-type material would increase visitor utility when visiting an urban forest. The positive parameters of the topography attribute levels indicated that utility was increased with flat (b = 0.9091) or slightly hilly trails (b = 0.7824). Likewise, the preference and utility of an urban dweller for visiting an urban forest were increased with a shorter travel time from home to the forest. Compared to the base walking time on trails (more than 3 h), other walking times were not significant in the model. As expected, an increased amount of funds spent to enhance urban forest attributes might reduce the preference and utility of an urban dweller when visiting urban forests (b = −0.0353).

3.3. Estimated Values of Attribute Levels

On the basis of Equation (6) and the estimated model in Table 5, we transformed the preferences of participants for the attribute levels of urban forests into monetary values (US Dollars). It should be noted that the monetary values given in Table 6 were not the absolute amount of funds participants were willing to pay, but rather the additional funds they were willing to pay to enhance the base level to an alternative level of an attribute. Levels of “walking time” in urban forests did not have a significant coefficient in the estimated model (Table 5), and the monetary value needed to change the level of the attribute was not calculated. Overall, the values needed to change attribute levels were positive for the change in all attribute levels. Altering the topography of a trail had the highest value. Participants were willing to pay additional funds for changing the trail topography from a mountainous slope to a hilly slope (20.48 USD) and a flat trail (23.8 USD). Shortening the travel time from home to an urban forest was also a critical factor in determining the amount of additional funds that participants would provide. If the travel time could be shortened from more than 1 h to less than 15 min, urban dwellers were willing to pay an additional 18.03 USD. Similarly, the values for altering paving materials from porous elastic materials to a wooden deck and soil-type materials were 13.26 and 15.09, respectively. Participants were prepared to commit relatively smaller amounts to change forest type from coniferous to mixed forest (8.87 USD) or broadleaved forest (11.42 USD).

4. Discussions

4.1. Effects of Salient Attributes on Preferences

Urban dwellers preferred mixed or broadleaved forests over coniferous forests. This might be associated with the various characteristics of trees such as tree shape, foliage color, foliage shape, bark color, seasonal variation, and the sense of safety. The results of this study were consistent with the findings of previous studies that reported a preference for a spreading shape over more conical forms [30,73,74,75,76,77,78], coarse foliage (i.e., broadleaved trees) over fine foliage (i.e., conifers) [61,78], bright bark color over dark bark color [78], variety of colors in a forest over simple colors [54,79,80,81] and seasonal variation over no variation [77,82,83]. Often, people perceive conifer forests in relation to the terms “artificial”, “man-made”, “darkness”, “impermeable”, “repelling”, “uniform”, “monotony”, “young trees,” and “mushrooms,” whereas broadleaved forests are perceived in relation to the terms “native”, “natural,” “light diverse colors”, “permeable”, “inviting”, “individual”, “diversity”, “old trees”, and “flowers” [84]. It was noteworthy that user preferences for a particular tree type were partially influenced by cultural, regional, contextual, and subjective expectations [85]. The most common coniferous trees in Korea are Korean red pine (Pinus densiflora), Korea pine (P. koraiensis), Pitch pine (P. rigida), and needle fir (Abies holophylla), and these trees can be characterized as having a conical form, fine foliage, dark bark color, similar leaf color, and being evergreen, which are all characteristics that are undesirable in most previous studies. Another possible explanation for peoples’ preferences for broadleaved forest over coniferous forest is the “sense of safety” with broadleaved forest associated with “visual penetration”, “visibility”, and “openness” [31,86,87,88,89,90,91]. Many studies have reported that the perception of safety is strongly related to landscape preferences (e.g., [30,92,93,94,95,96]). The thick foliage of coniferous trees could obstruct view (i.e., low visual penetration) and evoke fear or a sense of being unsafe in visitors to urban forests (e.g., [93,94]). We found that participants were willing to pay an additional 11.42 and 8.87 USD to convert coniferous forest to mixed or broadleaved forest, respectively.
This study also found a greater preference for soil-type pavement or wooden decking over porous elastic pavement on trails in urban forests. Considering that the main purpose of visiting an urban forest was to take a walk, rest, be away from home, and to enjoy a natural environment, the lack of preference for porous elastic pavement materials was likely because elastic pavement materials are not natural and might restrict the sense of being in a natural environment when walking on a trail. It has been shown that walking in an urban forest is one of the most popular and important leisure activities among urban dwellers in terms of their physical and psychological benefits [97,98,99,100,101]. For these reasons, trails are considered to be the most preferred area of urban forests among visitors [58], with one of the critical factors affecting preferences on trails being the pavement material [102]. Gobster (1995) [60] suggested that poor trail conditions and poorly maintained trail environments were perceived as being too wild or overgrown and were not desirable. We found that urban dwellers preferred wooden decking or soil-type pavement materials over porous elastic materials and were willing to pay 13.26 USD for wooden decking and 15.09 USD for soil-type pavements if porous elastic materials were to be replaced. From a design and planning perspective, it is not easy to determine which materials should be placed on trails on urban forests. There is strong evidence that a heavy concentration of visitors on trails has adverse impacts on fauna, flora, and soil properties (e.g., [103,104,105]). To minimize the adverse impacts of trail use on ecological communities by visitors in urban forests, the use of soil-type materials on trails simply because of visitor preferences might not be the best way to apply the study results into design and planning practices. A recent study estimated trail demand model for bicyclist, pedestrian, and mixed-mode traffic in multiple states in the US and reported that trail demands of bicyclists and pedestrians were significantly associated with different variables [106]. Interestingly enough, they also reported that bicyclists and pedestrians responded differently to variations in specific weather variables such as temperature and precipitation [107]. With respect great difference in spatial extent between these studies and our study, the result of these recent studies suggested that users’ preferences on trails in urban forests might be greatly different due to types of trail uses (i.e., bicycling, walking, or others). The type of paving materials used in recreational trails should be determined on the basis of a number of critical factors including type of use, amount of use, slope, soil type, and aesthetic quality [108]. The study results could be applied by dividing urban forests into zones on the basis of these critical factors and using different pavement materials in the different zones.
The preference of participants for a flat terrain on trails was consistent with the results of Koo et al. (2013) [36], who reported that people preferred to walk on comfortable flat trails. However, a number of studies have reported the opposite results, which suggests a greater preference of people for sloping trails in Spain (e.g., [30]), Denmark (e.g., [109]), and elsewhere (e.g., [61,63]). Thus, the preference for flat trails identified in this study should not be overgeneralized. A preference for a sloping trail could depend on the purpose of the visit or the sociodemographic characteristics of visitors. For example, outdoor activity enthusiasts (i.e., climbing or hiking), cyclists, and all-terrain vehicle users might prefer the complex, dynamic, and challenging topography of trails in forests located in areas remote from cities rather than urban forests [110]. In contrasts, elders might prefer gently sloping trails in urban forests over steeper trails in remote areas [111,112]. Furthermore, various attributes of trails, socio-demographic variables, and their interactions might also influence the preferences of urban dwellers and their demand for trails (for more details see [113]). Our study revealed that participants were willing to pay 23.8 USD to alter trail topography from mountainous slopes to flat trails.
Spatial and temporal accessibility were preferred, which was consistent with the findings of many previous studies that have reported higher utility for forests or parks located close to user’s homes rather than remotely located forests (e.g., [114,115,116,117,118,119,120,121]). By contrast, a recent study reported that people in Korea were not sensitive to the spatial accessibility of urban forests when they were located in urbanized areas and public transportation systems were effective [36]. The attribute levels of travel time were very short (5, 10, and 15 min), and this short time difference among travel time attributes did not significantly change the utility. It was assumed that people were more sensitive to the accessibility of an urban forest rather than the time required to travel to the forest.
It was not possible to specify the journey time or distance at which people became sensitive in this study. In European cases, a number of studies have reported slightly different preferred distances (or travel time) between their place of residence and an urban forest. In previous European studies, the preferred maximum travel distance was 10–25 km in Belgium [61], 8.6 km in Ireland [122,123,124], and 1 km in Sweden [125]. In central Europe and Great Britain, the distance declared by respondents was approximately 10 km, while a Scandinavian study reported a substantially shorter distance of approximately 1 km [126]. The great difference in preferred maximum distance might be associated with the demand for accessing green spaces. People living in highly urbanized areas have limited access to green areas in a city, a greater demand for natural areas, and are more willing to travel longer distances for recreational purposes [126]. People living close to forests or parks have a higher likelihood of visiting forests or parks than those living further away [121,127]. From a planning standpoint, the results of this and previous studies provide a rational justification for why more urban forests and parks should be provided to maximize the socio-cultural and environmental benefits for urban dwellers and urban ecosystems [128]. In our study, urban dwellers were willing to pay an additional 18.03 USD to shorten the journey time from home to an urban forest from more than 1 h to less than 15 min.
As discussed earlier, walking on a trail was the main reason for visiting an urban forest, and trail condition was a critical factor affecting the preferences for urban forests [58,60,97,98,99,100,101,102,129]. Our results and the urban forest literature suggest that management conditions, topography, and the paving materials used to construct trails are more significant variables determining user preferences than walking time. Walking time was not a significant variable in this study. The provision of multiple trail routes with different lengths, topography, and forest types could provide a diverse range of choices that would attract various sociodemographic groups and visitors, with different purposes for their visit.

4.2. Effects of Sociodemographic Characteristics and Use Patterns

There is much evidence that sociodemographic characteristics and the patterns of use by visitors have a significant impact on a user’s preferences for urban forests (e.g., [36,59,130,131,132,133]). Based on the estimated base model (Table 5), we added a number of variables into the estimated model and re-estimated the comprehensive model to investigate the effects of sociodemographic characteristics and the patterns of use by visitors on the WTP additional funds. The ρ2 of the comprehensive model was 0.2115 (Table 7), which was considerably greater than the attribute only model (ρ2 = 0.1823) in Table 5. On a general level, the comprehensive model better explained the true nature of a user’s preferences for urban forest. The estimated comprehensive model revealed that the sociodemographic characteristics of participants and their patterns of use had significant impacts on user preferences and the selection of urban forests. Respondents that were frequent visitors to urban forests were more actively prepared to pay additional funds to enhance their preferred urban forest than those who less frequently visited urban forests. This result reinforced previous findings that active forest users would be willing to improve the attributes of urban forests [39,132,134]. We also identified two participant groups that were classified by the travel mode taken to reach the urban forest. The estimated comprehensive model indicated that car users were more actively interested in enhancing urban forest attributes than those who accessed urban forests by walking, bicycle, taxi, or public transport (e.g., subway or bus). In our study, about 41.1% of respondents used a car to visit urban forests, which was similar to a European case study conducted in Belgium [61], which found that most urban forest visitors used private vehicles. Travel mode was associated with travel distance, with about 70% of study participants indicating that they travelled up to 10 km. In Sweden, people preferred to walk up to 2 km to visit urban forests and take a car to visit forests if the travel distance was greater than 2 km [125]. In general, personal car users can travel farther to visit high quality forests than visitors who travel on foot [135]. In transportation science, the selection of travel mode depends on various environmental, sociocultural, and land use variables such as distance, quality of road systems, weather conditions, number of children, income, education, and age (e.g., [136,137,138]). However, we were not able to find published studies of the relationships between car users and preferences for forest attributes. Thus, it was not possible to directly compare our results with previous studies, and further studies are needed to verify our findings.
Interestingly, male and younger participants exhibited a WTP to enhance urban forest attributes. However, as discussed by Koo et al. (2013) [36], there were great differences in the preferences for urban forest attributes among sociodemographic groups. Specifically, male and younger participants were willing to enhance urban forest attributes by paying additional funds compared to female and elder participants. A possible explanation for this is that the main household income in Korea depends on a male’s income, and males are more aggressive in changing environments than females [55]. McAlister and Pessemier (1982) [139] reported that younger people have a stronger tendency to seek variety than elderly people. Regarding the role of sex in preferences of urban forest attributes, we found slightly different results in the urban forest literature. For example, there is no difference between males and females in the WTP for enhancing forest attributes [36]. In addition, the WTP of females was higher than that of males in a nature-based forest study [32]. We did not observe any significant difference in the WTP among income groups in our study. The reasons for the inconsistency of the sex effect between this study and previous studies and insignificant income effects in our estimated model were not clear.

5. Conclusions

For planners, decision makers, and the designers of urban forests, it is an important but difficult task to respond to user’s preferences and demands. This is particularly critical in highly urbanized areas where land values are extremely high and the land available for urban forests is extremely limited, because every planning, management, and design practice is required to be justified. Using a conjoint choice model, this study assessed user preferences for the attributes of urban forests and estimated the monetary values of attribute levels in Seoul, Korea, which is a highly urbanized environment. Based on a survey with 600 respondents, we were successfully able to estimate a conjoint choice model and transform user preferences for attributes and attribute levels into monetary values. The results indicated that urban dwellers in our study area preferred broadleaved forest (11.42 USD) over coniferous forest, soil-type pavement materials (15.09 USD) over porous elastic pavement materials on trails, relatively flat trails (23.8 USD) over trails with steep slopes and a short travel time (18.03 USD for less than 15 min) to the urban forest from home. A comparison of the monetary values of the preferences estimated in the topography of the trail had the highest preference value, while forest type had the lowest preference value. The sociodemographic characteristics (i.e., age, sex, and access mode) of visitors also had a significant impact on the attributes of urban forests and their levels. From a practical perspective, our study results suggest that the preferences of urban dwellers can be enhanced by providing more broadleaved trees, paving trails with natural materials and appropriate maintenance, and providing gently sloping or flat trails (or various slope trail alternatives). Both previous studies and our study results strongly indicate that the distance to urban parks is a critical factor in user’s preferences and their frequency of visits. However, the provision of large new urban forests is not an option in most large cities. Instead, providing urban forests in neighborhood parks or small urban parks could be a practical alternative, with consideration of the sociodemographic characteristics of the surrounding area.
Despite our study providing useful insights into urban forest planning, design, and management, the results of this study raise some practical questions. For example, we estimated a conjoint choice model for the entire city. However, there could be differences in people’s preferences for urban forests depending on the location of the forest within the city. In the urban edge area, residents may have many alternative forests to visit while the residents of central areas do not. In this case, the demand for urban forests and the user preferences could be considerably different among the residents of different parts of the city. To address this issue, we adopted a quota sampling method. However, we were not able to verify that this sampling method neutralized the spatial and locality issues sufficiently, with such an analysis being beyond the scope of the study. Alternatively, a segregated survey or geographically weighted regression (GWR) methods might be useful to integrate our study results with locality and spatial dimension issues. This study was not able to integrate a number of important salient attributes such as infrastructure (e.g., information boards, open play areas) [61] and perceived safety into our model because there was a limit on the maximum number of salient attributes. The potential demand and preferences of visitors for particular urban forests could vary across a city, and it may be necessary to adopt different attributes in a CE, corresponding to the different demands and preferences in a particular location within a city on the basis of the results of our study.
Considering that the decision to visit an urban forest is often made based on the limiting factors rather than the opportunity, an investigation of the limiting factors preventing visits to urban forests might be theoretically meaningful to verify the results of this study. Most previous studies have investigated user preferences for urban forests using attributes revealed by visitor statements. However, “why do people not visit urban forests?” is also a critical question from a non-user perspective. According to prospect theory, people are more sensitive to “what to lose” than “what to gain” [140]. This theory suggests that people are not willing to visit an urban forest if they think the expected utility of not-visiting the forest (i.e., loss) is greater than the expected utility (i.e., gain) of visiting the forest. Visiting an urban forest requires time, cost, and effort, and identifying the attributes greatly affecting “loss” factors in a visitor’s perception can significantly contribute to urban forest planning and management in urban areas, where available land for forests is extremely limited. In addition, it would be a quite interesting and fresh perspective to view urban forests as local economic opportunity [141]. Using hedonic price model, many studies reported that amounts of urban forests and proximation to urban forests increase property values or housing price. However, these previous studies often neglect attributes and attribute levels of urban forests. Conjoint choice modeling used in this study may help to elaborate hedonic price model used housing market research.

Author Contributions

All authors significantly contributed to this paper. S.-K.H. and H.-K.J. were responsible for conceiving the study, the study design, and the basic statistical analyses. J.-M.K. made a unique contribution to the survey and data coding. S.-W.L. performed additional statistical analyses and wrote the manuscript.

Acknowledgments

This study was conducted with the support of the “R&D Program for Forest Science Technology (Project No. 2017043B10-1819-BB01)” provided by the Korea Forest Service (Korea Forestry Promotion Institute).

Conflicts of Interest

The authors declare no conflict of interest.

References

  1. Cornelis, J.; Hermy, M. Biodiversity relationships in urban and suburban parks in Flanders. Landsc. Urban Plan. 2004, 69, 385–401. [Google Scholar] [CrossRef]
  2. Escobedo, F.J.; Nowak, D.J. Spatial heterogeneity and air pollution removal by an urban forest. Landsc. Urban Plan. 2009, 90, 102–110. [Google Scholar] [CrossRef]
  3. Escobedo, F.J.; Kroeger, T.; Wagner, J.E. Urban forests and pollution mitigation: Analyzing ecosystem services and disservices. Environ. Pollut. 2011, 159, 2078–2087. [Google Scholar] [CrossRef] [PubMed]
  4. James, P.; Banay, R.F.; Hart, J.E.; Laden, F. A Review of the Health Benefits of Greenness. Curr. Epidemiol. Rep. 2015, 2, 131–142. [Google Scholar] [CrossRef] [PubMed] [Green Version]
  5. Livesley, S.J.; Baudinette, B.; Glover, D. Rainfall interception and stem flow by eucalypt street trees—The impacts of canopy density and bark type. Urban For. Urban Green. 2014, 13, 192–197. [Google Scholar] [CrossRef]
  6. Livesley, S.J.; Ossola, A.; Threlfall, C.G.; Hahs, A.K.; Williams, N.S.G. Soil carbon and carbon/nitrogen ratio change under tree canopy, tall grass, and turf grass areas of urban green space. J. Environ. Qual. 2016, 45, 215–223. [Google Scholar] [CrossRef] [PubMed]
  7. McPherson, E.G.; Simpson, J.R.; Xiao, Q.; Wu, C. Million trees Los Angeles canopy cover and benefit assessment. Landsc. Urban Plan. 2011, 99, 40–50. [Google Scholar] [CrossRef]
  8. Scharenbroch, B.C.; Morgenroth, J.; Maule, B. Tree Species Suitability to Bioswales and Impact on the Urban Water Budget. J. Environ. Qual. 2016, 45, 199–206. [Google Scholar] [CrossRef] [PubMed]
  9. Bolitzer, B.; Netusil, N.R. The impact of open space on property values in Portland, Oregon. J. Environ. Manag. 2000, 59, 185–193. [Google Scholar] [CrossRef]
  10. Ge, X.J. Determinants of house prices in New Zealand. Pac. Rim Prop. Res. J. 2009, 15, 90–112. [Google Scholar] [CrossRef]
  11. Luttik, J. The value of vegetation covers, water and open space as reflected by house prices in the Netherlands. Landsc. Urban Plan. 2000, 48, 161–167. [Google Scholar] [CrossRef]
  12. Mallick, H.; Mahalik, M.K. Factors determining regional housing prices: Evidence from major cities in India. J. Prop. Res. 2015, 32, 123–146. [Google Scholar] [CrossRef]
  13. Tse, R.Y.; Love, P.E. Measuring residential property values in Hong Kong. Prop. Manag. 2000, 18, 366–374. [Google Scholar] [CrossRef] [Green Version]
  14. Tyrväinen, L. Economic valuation of urban forest benefits in Finland. J. Environ. Manag. 2001, 62, 75–92. [Google Scholar] [CrossRef] [PubMed]
  15. Lee, S.-W.; Taylor, P.D.; Hong, S.-K. Moderating effects of forests cover on the effects of proximity to chemical facilities on property values. Landsc. Urban Plan. 2008, 86, 171–176. [Google Scholar] [CrossRef]
  16. Kaplan, R. The nature of the view from home: Psychological benefits. Environ. Behav. 2001, 33, 507–542. [Google Scholar] [CrossRef]
  17. Lee, S.-W.; Ellis, C.D.; Kweon, B.-S.; Hong, S.-K. Relationship between landscape structure and neighborhood satisfaction in urbanized areas. Landsc. Urban Plan. 2008, 85, 60–70. [Google Scholar] [CrossRef]
  18. Kweon, B.-S.; Sullivan, W.C.; Wiley, A.R. Green common spaces and the social interaction of inner-city older adults. Environ. Behav. 1998, 30, 832–858. [Google Scholar] [CrossRef]
  19. Gascon, M.; Triguero-Mas, M.; Martínez, D.; Dadvand, P.; Forns, J.; Plasència, A.; Nieuwenhuijsen, M.J. Mental Health Benefits of Long-Term Exposure to Residential Green and Blue Spaces: A Systematic Review. Int. J. Environ. Res. Public Health 2015, 12, 4354–4379. [Google Scholar] [CrossRef] [PubMed] [Green Version]
  20. Grahn, P.; Stigsdotter, U.A. Landscape planning and stress. Urban For. Urban Green. 2003, 2, 1–18. [Google Scholar] [CrossRef]
  21. Hartig, T.; Mitchell, R.; de Vries, S.; Frumkin, H. Nature and health. Annu. Rev. Public Health 2014, 35, 207–228. [Google Scholar] [CrossRef] [PubMed]
  22. Lachowycz, K.; Jones, A.P. Towards a better understanding of the relationship between greenspace and health: Development of a theoretical framework. Landsc. Urban Plan. 2013, 118, 62–69. [Google Scholar] [CrossRef]
  23. De Vries, S.; ten Have, M.; van Dorsselaer, S.; van Wezep, M.; Hermans, T.; de Graaf, R. Local availability of green and blue space and prevalence of common mental disorders in the Netherlands. BJPsych Open 2016, 2, 366–372. [Google Scholar] [CrossRef] [PubMed] [Green Version]
  24. Wilker, E.H.; Wu, C.-D.; McNeely, E.; Mostofsky, E.; Spengler, J.; Wellenius, G.A.; Mittleman, M.A. Green space and mortality following ischemic stroke. Environ. Res. 2014, 133, 42–48. [Google Scholar] [CrossRef] [PubMed] [Green Version]
  25. Dumenu, W.K. What are we missing? Economic value of an urban forest in Ghana. Ecosyst. Serv. 2013, 5, 137–142. [Google Scholar] [CrossRef]
  26. Chan, K.M.A.; Satterfield, T.; Goldstein, J. Rethinking ecosystem services to better address and navigate cultural values. Ecol. Econ. 2012, 74, 8–18. [Google Scholar] [CrossRef]
  27. Anderson, S.T.; West, S.E. Open space, residential property values, and spatial context. Reg. Sci. Urban Econ. 2006, 36, 773–789. [Google Scholar] [CrossRef] [Green Version]
  28. Larson, E.K.; Perrings, C. The value of water-related amenities in an arid city: The case of the Phoenix Metropolitan Area. Landsc. Urban Plan. 2013, 109, 45–55. [Google Scholar] [CrossRef]
  29. Czembrowski, P.; Kronenberg, J. Hedonic pricing and different urban green space types and sizes: Insights into the discussion on valuing ecosystem services. Landsc. Urban Plan. 2016, 146, 11–19. [Google Scholar] [CrossRef]
  30. Bestard, B.A.; Font, A.R. Environmental diversity in recreational choice modelling. Ecol. Econ. 2009, 68, 2743–2750. [Google Scholar] [CrossRef]
  31. Edwards, D.M.; Jay, M.; Jensen, F.S.; Lucas, B.; Marzano, M.; Montagne, C.; Peace, A.; Weiss, G. Public preferences across Europe for different forest stand types as sites for recreation. Ecol. Soc. 2012, 17, 27. [Google Scholar] [CrossRef]
  32. Nielsen, A.B.; Olsen, S.B.; Lundhede, T. An economic valuation of the recreational benefits associated with nature-based forest management practices. Landsc. Urban Plan. 2007, 80, 63–71. [Google Scholar] [CrossRef]
  33. Atmiş, E.; Günşen, H.B.; Yücedağ, C.; Lise, W. Factors affecting the use of urban forests in Turkey. Turk. J. For. 2017, 18, 1–10. [Google Scholar] [CrossRef]
  34. Nordh, H.; Hartig, T.; Hagerhall, C.M.; Fry, G. Components of small urban parks that predict the possibility for restoration. Urban For. Urban Green. 2009, 8, 225–235. [Google Scholar] [CrossRef]
  35. Nordh, H.; Alaouch, C.; Hartig, T. Assessing restorative components of small urban parks using conjoint methodology. Urban For. Urban Green. 2011, 10, 95–103. [Google Scholar] [CrossRef]
  36. Koo, J.-C.; Park, M.S.; Youn, Y.-C. Preferences of urban dwellers on urban forest recreational services in South Korea. Urban For. Urban Green. 2013, 12, 200–210. [Google Scholar] [CrossRef]
  37. Hong, S.-K.; Kim, J.-H.; Jung, S.-J.; Tae, Y.-L. An Economic Valuation of Arboretum Using Choice Experiments. J. Korean Inst. Landsc. Archit. 2010, 37, 1–11. [Google Scholar]
  38. Adamowicz, W.; Louviere, J.; Williams, M. Combining Revealed and Stated Preference Methods for Valuing Environmental Amenities. J. Environ. Econ. Manag. 1994, 26, 271–292. [Google Scholar] [CrossRef]
  39. Hanley, N.; Wright, R.E.; Adamowicz, V. Using choice experiments to value the environment: Design issue, current experience and future prospect. Environ. Resour. Econ. 1998, 11, 413–428. [Google Scholar] [CrossRef]
  40. Lancaster, K. A New Approach to Consumer Theory. J. Polit. Econ. 1966, 74, 132–157. [Google Scholar] [CrossRef]
  41. Manski, C.F. The Structure of Random Utility Models. Theor. Decis. 1977, 8, 229–254. [Google Scholar] [CrossRef]
  42. Thurstone, L.L. A Law of Comparative Judgement. Psychol. Rev. 1927, 4, 273–286. [Google Scholar] [CrossRef]
  43. Boxall, P.C.; Adamowicz, W.L.; Swait, L.; Williams, M.; Louviere, J. A Comparison of stated preference methods for environmental valuation. Ecol. Econ. 1996, 18, 243–253. [Google Scholar] [CrossRef]
  44. Christie, M.; Hanley, N.; Warren, J.; Murphy, K.; Wright, R.; Hyde, T. Valuing the diversity of biodiversity. Ecol. Econ. 2006, 58, 304–317. [Google Scholar] [CrossRef]
  45. Ben-Akiva, M.E.; Lerman, S.R. Discrete Choice Analysis: Theory and Application to Travel Demand; MIT Press: London, UK, 1985; ISBN 0262022176. [Google Scholar]
  46. Tuan, T.H.; Navrud, S. Valuing cultural heritage in developing countries: Comparing and pooling contingent valuation and choice modelling estimates. Environ. Resour. Econ. 2007, 38, 51–69. [Google Scholar] [CrossRef]
  47. Wang, X.; Bennett, J.; Xie, C.; Zhang, Z.; Liang, D. Estimating non-market environmental benefits of the conversion of cropland to forest and grassland program: A choice modeling approach. Ecol. Econ. 2007, 63, 114–125. [Google Scholar] [CrossRef]
  48. Louviere, J.; Timmermans, H. Stated preference and choice models applied to recreation research: A review. Leisure Sci. 1990, 12, 9–32. [Google Scholar] [CrossRef] [Green Version]
  49. Horne, P.; Boxall, P.C.; Adamowicz, W.L. Multiple-use management of forest recreation sites: A spatially explicit choice experiment. For. Ecol. Manag. 2005, 207, 189–199. [Google Scholar] [CrossRef]
  50. Walpole, M.J.; Goodwin, H.J.; Ward, K.G.R. Pricing policy for tourism in protected areas: Lessons from Komodo National Park, Indonesia. Conserv. Biol. 2001, 15, 218–227. [Google Scholar] [CrossRef]
  51. Wang, P.-W.; Jia, J.-B. Tourists’ willingness to pay for biodiversity conservation and environment protection, Dalai Lake protected area: Implications for entrance fee and sustainable management. Ocean. Coast. Manag. 2012, 62, 24–33. [Google Scholar] [CrossRef]
  52. Watson, D.O.; McFarlane, B.L.; Haener, M.K. Human dimensions of biodiversity conservation in the interior forests of British Columbia. BC J. Ecosyst. Manag. 2004, 4, 1–20. [Google Scholar]
  53. Yoo, R.-H.; Lee, K.-S.; Kim, S.-K.; Bae, S.-W.; Yoon, E.-Y. A study on the preference analysis by use type of urban forests. J. Korean Inst. For. Recreat. 2007, 11, 1–6. [Google Scholar]
  54. Andrada, R., II; Deng, J.; Gazal, K. Exploring people’s preferences on specific attributes of urban forests in Washington DC: A conjoint approach. J. Hortic. For. 2015, 9, 200–209. [Google Scholar] [CrossRef]
  55. Kim, E.-G.; Kim, D.-H.; Yoo, J.-C.; Kim, M.-O. Estimation of Economic Valuation of Forest Landscape Function Using Conditional Logit Model. J. Korean For. Soc. 2010, 99, 891–899. [Google Scholar]
  56. Cattin, P.; Wittink, D.R. Commercial Use of Conjoint Analysis: A Survey. J. Mark. 1982, 46, 44–53. [Google Scholar] [CrossRef]
  57. Green, P.E.; Srinivasan, V. Conjoint Analysis in Consumer Research: Issues and Outlook. J. Consum. Res. 1978, 5, 103–123. [Google Scholar] [CrossRef]
  58. Hammitt, W.E. Urban forests and parks as privacy refuges. J. Arboric. 2002, 28, 19–26. [Google Scholar]
  59. Tyrväinen, L.; Pauleit, S.; Seeland, K.; de Vries, S. Benefits and uses of urban forests and trees. In Urban Forests and Trees; Nilsson, K., Randrup, T.B., Konijnendijk, C.C., Eds.; Springer: Heidelberg, Berlin, 2005; pp. 81–114. ISBN 978-3-540-25126-2. [Google Scholar]
  60. Gobster, P.H. Perception and use of a metropolitan greenway system for recreation. Landsc. Urban Plan. 1995, 33, 401–413. [Google Scholar] [CrossRef]
  61. Roover, P.; Hermy, M.; Gulinck, H. Visitor profile, perceptions and expectations in forests from a gradient of increasing urbanisation in central Belgium. Landsc. Urban Plan. 2002, 59, 129–145. [Google Scholar] [CrossRef]
  62. Japelj, A.; Mavsar, R.; Hodges, D.; Kovač, M.; Juvančič, L. Latent preferences of residents regarding an urban forest recreation setting in Ljubljana, Slovenia. For. Policy Econ. 2016, 71, 71–79. [Google Scholar] [CrossRef]
  63. Coles, R.; Bussey, S.C. Urban forest landscapes in the UK: Progressing the social agenda. Landsc. Urban Plan. 2000, 52, 181–188. [Google Scholar] [CrossRef]
  64. Liu, W.; Chen, W.; Dong, C. Spatial decay of recreational services of urban parks: Characteristics and influencing factors. Urban For. Urban Green. 2017, 25, 130–138. [Google Scholar] [CrossRef]
  65. Louviere, J.J.; Islam, T. A comparison of importance weights and willingness-to-pay measures derived from choice-based conjoint, constant sum scales and best-worst scaling. J. Bus. Res. 2008, 61, 903–911. [Google Scholar] [CrossRef]
  66. Kemperman, A.D.A.M.; Borgers, A.W.J.; Oppewal, H.; Timmermans, H.J.P. Consumer Choice of Theme Parks: A Conjoint Choice Model of Seasonality Effects and Variety Seeking Behavior. Leisure Sci. 2000, 22, 1–18. [Google Scholar] [CrossRef]
  67. Lockwood, M.; Tracy, K. Nonmarket economic valuation of an urban recreation park. J. Leisure Res. 1995, 27, 155–167. [Google Scholar] [CrossRef]
  68. Lee, C.-K.; Kim, Y.-G.; Kim, Y.-S.; Han, S.-Y. Valuation of national parks by types of resources: Application of contingent valuation method. Korean J. Environ. Ecol. 2001, 15, 79–91. [Google Scholar]
  69. Seoul Metropolitan Government. 2017 Information Communication Plaza. Available online: http://opengov.seoul.go.kr/disclosure-of-information/en/ (accessed on 2 June 2018).
  70. Louviere, J.; Hensher, D.A.; Swait, J. Stated Choice Methods: Analysis and Application; Cambridge University Press: Cambridge, UK, 2000; ISBN 0521782759. [Google Scholar] [CrossRef]
  71. Adamowicz, W.; Boxall, P.; Williams, M.; Louviere, J. Stated preference approaches for measuring passive use values: Choice experiments and contingent valuation. Am. J. Agric. Econ. 1998, 80, 64–75. [Google Scholar] [CrossRef]
  72. Maleknia, R.; Moghaddam, M.N.; Geraili, S.; Azizi, F.; Ahang, S.R. Willing to Pay in Urban Forests, Finance Support from Public Case Study, Shorab Urban Forest in Khoram Abad, Iran. Res. J. Appl. Sci. Tech. 2013, 5, 5119–5121. [Google Scholar] [CrossRef]
  73. Lohr, V.I.; Pearson-Mims, C.H. Responses to scenes with spreading, rounded, and conical tree forms. Environ. Behav. 2006, 38, 667–688. [Google Scholar] [CrossRef]
  74. Palmer, J.F. Using spatial metrics to predict scenic perception in a changing landscape: Dennis, Massachusetts. Landsc. Urban Plan. 2004, 69, 201–218. [Google Scholar] [CrossRef]
  75. Sommer, R.; Summit, J. An exploratory study of preferred tree form. Environ. Behav. 1995, 27, 540–557. [Google Scholar] [CrossRef]
  76. Sommer, R.; Summit, J. Cross-national rankings of tree shape. Ecol. Psychol. 1996, 8, 327–341. [Google Scholar] [CrossRef]
  77. Van Mansvelt, J.D.; Kuiper, J. Criteria for the humanity realm: Psychology and physiognomy and cultural heritage. In Checklist for Sustainable Landscape Management; van Mansvelt, J.D., van der Lubbe, M.J., Eds.; Elsevier: Amsterdam, The Netherlands, 1999; pp. 116–134. ISBN 0080528988. [Google Scholar]
  78. Williams, K. Exploring resident preferences for street trees in Melbourne, Australia. J. Arboric. 2002, 28, 161–170. [Google Scholar]
  79. Andrada, R., II; Deng, J. Enjoying Green Cities: Assessing Visitors’ Attitudes and References for Urban Forests in Washington, D.C., Northeastern Recreation Research Symposium; USDA Forest Service: Washington, DC, USA, 2010; pp. 168–174. [Google Scholar]
  80. Plot, A.T.; Akay, A. Relationships between the visual preferences of urban recreation area users and various landscape design elements. Urban For. Urban Green. 2015, 14, 573–582. [Google Scholar] [CrossRef]
  81. Qin, J.; Zhou, X.; Sun, C.; Leng, H.; Lian, Z. Influence of green spaces on environmental satisfaction and physiological status of urban residents. Urban For. Urban Green. 2013, 12, 490–497. [Google Scholar] [CrossRef]
  82. Ahas, R.; Aasa, A.; Silm, S.; Rooaare, J. Seasonal indicators and seasons of Estonian landscapes. Landsc. Res. 2005, 30, 173–191. [Google Scholar] [CrossRef]
  83. Hendriks, K.; Stobbelaar, D.J.; van Mansvelt, J.D. The appearance of agriculture. An assessment of the quality of landscape of both organic and conventional horticultural farms in West Friesland. Agric. Ecosyst. Environ. 2000, 77, 157–175. [Google Scholar] [CrossRef]
  84. Schraml, U.; Volz, K.-R. Do species matter? Valuable broadleaves as an object of public perception and policy. In Valuable Broadleaved Forests in Europe, 2nd ed.; Spiecker, H., Hein, S., Makkonen-Spoecker, K., Thies, M., Eds.; Brill: Leiden, The Netherlands, 2009; pp. 213–236. ISBN 9004167951. [Google Scholar]
  85. Edwards, D.; Jay, M.; Jensen, F.S.; Lucas, B.; Marzano, M.; Montagne, C.; Peace, A.; Weiss, G. Public Preferences for Silvicultural Attributes of European Forests; European Forest Institute: Joensuu, Finland, 2010. [Google Scholar]
  86. Gundersen, V.; Stange, E.; Kaltenborn, B.; Vistad, O. Public visual preferences for dead wood in natural boreal forests: The effects of added information. Landsc. Urban Plan. 2017, 158, 12–24. [Google Scholar] [CrossRef]
  87. Lindhagen, A.; Hӧrnsten, L. Forest recreation in 1977 and 1997 in Sweden: Changes in public preferences and behaviour. Forestry 2000, 73, 143–151. [Google Scholar] [CrossRef]
  88. Silvennoinen, H.; Pukkala, T.; Tahvanainen, L. Effects of cuttings on the scenic beauty of a tree stand. Scand. J. For. Res. 2002, 17, 263–273. [Google Scholar] [CrossRef]
  89. Tyrvӓinen, L.; Nouisiainen, I.; Silvennoinen, H.; Tahvanainen, L. Rural tourism in Finland: Tourist expectation of landscape and environment. Scand. J. Hosp. Tour. 2001, 1, 133–149. [Google Scholar] [CrossRef]
  90. Tyrvӓinen, L.; Mӓkinen, K.; Schipperijn, J. Tools for mapping social values urban woodlands and other green areas. Landsc. Urban Plan. 2001, 79, 5–19. [Google Scholar] [CrossRef]
  91. Tyrvӓinen, L.; Silvennoinen, H.; Kolehmainen, O. Ecological and aesthetic values in urban forest management. Urban For. Urban Green. 2003, 1, 135–149. [Google Scholar] [CrossRef]
  92. Zhang, H.; Lin, S.-H. Affective appraisal of residents and visual elements in the neighborhood: A case study in an established suburban community. Landsc. Urban Plan. 2011, 101, 11–21. [Google Scholar] [CrossRef]
  93. Zhang, H.; Chen, B.; Sun, Z.; Bao, Z. Landscape perception and recreation needs in urban green space in Fuyang, Hangzhou, China. Urban For. Urban Green. 2013, 12, 44–52. [Google Scholar] [CrossRef]
  94. Jorgensen, A.; Hitchmough, J.; Calvert, T. Woodland spaces and edges: Their impact on perception of safety and preference. Landsc. Urban Plan. 2002, 60, 135–150. [Google Scholar] [CrossRef]
  95. Peckham, S.C.; Duinker, P.N.; Ordóñez, C. Urban forest values in Canada: Views of citizens in Calgary and Halifax. Urban For. Urban Green. 2013, 12, 154–162. [Google Scholar] [CrossRef]
  96. Voelker, S.; Kistemann, T. “I’m always entirely happy when I’m here!” Urban blue enhancing human health and well-being in Cologne and Dusseldorf, Germany. Soc. Sci. Med. 2013, 78, 113–124. [Google Scholar] [CrossRef] [PubMed]
  97. Arnberger, A. Recreation use of urban forests: As inter-area comparison. Urban For. Urban Green. 2006, 4, 135–144. [Google Scholar] [CrossRef]
  98. Eyler, A.A.; Brownson, R.C.; Bacak, S.J.; Housemann, R.A. The epidemiology of walking for physical activity in the United States. Med. Sci. Sports Exerc. 2003, 35, 1529–1536. [Google Scholar] [CrossRef] [PubMed]
  99. Janowsky, D.; Becker, G. Characteristics and needs of different user groups in the urban forest of Stuttgart. J. Nat. Conserv. 2003, 11, 251–259. [Google Scholar] [CrossRef]
  100. Jorgensen, A.; Anthopoulou, A. Enjoyment and fear in urban woodlands—Does age make a difference? Urban For. Urban Green. 2007, 6, 267–278. [Google Scholar] [CrossRef]
  101. Shin, W.-S.; Yeoun, P.-S.; Lee, J.-H.; Lee, J.-K.; Kim, K.-M. The important-performance analysis of urban recreational forests. J. Korean Inst. For. Recreat. 2010, 14, 17–29. [Google Scholar]
  102. Lindsey, G.; Wilson, J.; Anne Yang, J.; Alexa, C. Urban greenways, trail characteristics and trail use: Implications for design. J. Urban Des. 2008, 13, 53–79. [Google Scholar] [CrossRef]
  103. Duffey, E. The effects of human trampling on the fauna of grassland litter. Biol. Conserv. 1975, 7, 255–274. [Google Scholar] [CrossRef]
  104. Hammitt, W.E.; Cole, D.N. Wildland Recreation: Ecology and Management; Wiley: New York, NY, USA, 1998; ISBN 0471194611. [Google Scholar]
  105. Leung, Y.F.; Marion, J.L. Recreation Impacts and Management in Wilderness: A State-Of-Knowledge Review. In Proceedings of the Wilderness Science in a Time of Change Conference, Vol. 5: Wilderness Ecosystems, Threats, and Management, Missoula, MT, USA, 23–27 May 1999; Cole, D.N., McCool, S.F., Borrie, W.T., O’Loughlin, J., Eds.; U.S. Department of Agriculture, Forest Service, Rocky Mountain Research Station: Ogden, UT, USA, 2000. [Google Scholar]
  106. Ermagun, A.; Lindsey, G.; Loh, T.H. Bicycle, pedestrian, and mixed-mode trail traffic: A performance assessment of demand models. Landsc. Urban Plan. 2018, 177, 92–102. [Google Scholar] [CrossRef]
  107. Ermagun, A.; Lindsey, G.; Loh, T.H. Urban trails and demand response to weather variations. Transp. Res. D Transp. Environ. 2018, 63, 404–420. [Google Scholar] [CrossRef]
  108. Tomczyk, A.M.; Ewertowski, M. Planning of recreational trails in protected areas: Application of regression tree analysis and geographic information systems. Appl. Geogr. 2013, 40, 129–139. [Google Scholar] [CrossRef]
  109. Zandersen, M.; Termansen, M.; Jensen, F.S. Evaluating approaches to predict recreation values of new forest sites. J. For. Econ. 2007, 13, 103–128. [Google Scholar] [CrossRef]
  110. Snyder, S.A.; Whitmore, J.H.; Schneider, I.E.; Becker, D.R. Ecological criteria, participant preferences and location models: A GIS approach toward ATV trail planning. Appl. Geogr. 2008, 28, 248–258. [Google Scholar] [CrossRef]
  111. Skłodowski, J.; Gołos, P. Preferowany typ drzewostanu i czynniki decydujące o atrakcyjności turystycznej drzewostanu w opinii publicznej. Sylwan 2015, 159, 747–756. [Google Scholar]
  112. Wen, C.; Albert, C.; Haaren, C.V. The elderly in green spaces: Exploring requirements and preferences concerning nature-based recreation. Sustain. Cities Soc. 2018, 38, 582–593. [Google Scholar] [CrossRef]
  113. Kelley, H.; van Rensburg, T.M.; Jeserich, N. Determinants of demand for recreational walking trails in Ireland. Tour. Manag. 2016, 52, 173–186. [Google Scholar] [CrossRef]
  114. Byrne, J.; Wolch, J. Nature, race, and parks: Past research and future directions for geographic research. Prog. Hum. Geogr. 2009, 33, 743–765. [Google Scholar] [CrossRef]
  115. Janeczko, E.; Woźnicka, M. Zagospodarowanie rekreacyjne lasów Warszawy w kontekście potrzeb i oczekiwań mieszkańców stolicy. Studia i Materiały CEPL 2009, 23, 131–139. [Google Scholar]
  116. Lindhagen, A. Forest Recreation in Sweden. Four Case Studies Using Quantitative and Qualitative Methods. Master’s Thesis, Swedish University of Agricultural Sciences, Uppsala, Sweden, 1996. [Google Scholar]
  117. Rossi, S.D.; Byrne, J.A.; Pickering, C.M. The role of distance in peri-urban national park use: Who visits them and how far do they travel? Appl. Geogr. 2015, 63, 77–88. [Google Scholar] [CrossRef]
  118. Sławski, M.; Sławska, M. Las jako miejsce wypoczynku i rekreacji—Analiza oczekiwań społecznych na przykładzie gminy Rogów. Studia i Materiały CEPL 2009, 23, 140–150. [Google Scholar]
  119. Tyrvӓinen, L.; Miettinen, A. Property prices and urban forest amenities. J. Environ. Econ. Manag. 2000, 39, 205–223. [Google Scholar] [CrossRef]
  120. Upton, V.; Ryan, M.; O’Donoghue, C.; Dhubhain, A.N. Combining conventional and volunteered geographic information to identity and model forest recreational resources. Appl. Geogr. 2015, 60, 69–76. [Google Scholar] [CrossRef]
  121. Weber, J.; Sultana, S. Why do so few minority people visit national parks? Visitation and the accessibility of “America’s Best Idea”. Ann. Assoc. Am. Geogr. 2013, 103, 437–464. [Google Scholar] [CrossRef]
  122. Cahill, B. Valuing the Benefits of Supplying Forest Recreational Facilities on Irish Forests: A Contingent Behaviour Analysis. Unpublished Master’s Thesis, Department of Economics, National University of Ireland, Galway, Ireland, 2006. [Google Scholar]
  123. Cullinan, J.; Hynes, S.; O’Donoghue, C. Using spatial microsimulation to account for demographic and spatial factors in environmental benefit transfer. Ecol. Econ. 2011, 70, 813–824. [Google Scholar] [CrossRef]
  124. De Vries, S.; Goossen, M. Predicting transgressions of the social capacity of natural areas. In Proceedings of the Monitoring and Management of Visitor Flows in Recreational and Protected Areas, Vienna, Austria, 30 January–2 February 2002; pp. 102–108. [Google Scholar]
  125. Hӧrnsten, L.; Fredman, P. On the distance to recreational forests in Sweden. Landsc. Urban Plan. 2000, 51, 1–10. [Google Scholar] [CrossRef]
  126. Ciesielski, M.; Stereńczak, K. What do we expect from forests? The European view of public demands. J. Environ. Manag. 2018, 209, 139–151. [Google Scholar] [CrossRef] [PubMed]
  127. Xingyou, Z.; Hua, L.; Holt, J.B. Modeling spatial accessibility to parks: A national study. Int. J. Health Geogr. 2011, 10, 31–44. [Google Scholar] [CrossRef]
  128. Hargreaves, G. Largeparks: A designer’s perspective. In Large Parks; Czerniak, J., Harg-Reaves, G., Eds.; Princeton Architectural Press: New York, NY, USA, 2007; pp. 121–173. [Google Scholar]
  129. Hammitt, J.K. QALYs Versus WTP. Risk Anal. 2002, 22, 985–1001. [Google Scholar] [CrossRef]
  130. Huang, S.-C.L. Park user preferences for establishing a sustainable forest park in Taipei, Taiwan. Urban For. Urban Green. 2014, 13, 839–845. [Google Scholar] [CrossRef]
  131. Konijnendijk, C.C. The Forest and the City: The Cultural Landscape of Urban Woodland, 1st ed.; Springer: Berlin, Germany, 2008; ISBN 978-1402083709. [Google Scholar]
  132. Morris, J.; Colombo, S.; Angus, A.; Stacey, K.; Parsons, D.; Brawn, M.; Hanley, N. The value of public rights of way: A choice experiment in Bedfordshire, England. Landsc. Urban Plan. 2009, 93, 83–91. [Google Scholar] [CrossRef]
  133. Wolf, K.L. Business district streetscapes, trees, and consumer response. J. For. 2005, 103, 396–400. [Google Scholar]
  134. Bernath, K.; Roschewitz, A. Recreational benefits of urban forests: Explaining visitors’ willingness to pay in the context of the theory of planned behavior. J. Environ. Manag. 2008, 89, 155–166. [Google Scholar] [CrossRef] [PubMed]
  135. Abildtrup, J.; Olsen, B.S.; Stenger, A. Combining RP and SP data while accounting for large choice sets and travel mode—An application to forest recreation. J. Environ. Econ. Policy 2014, 4, 177–201. [Google Scholar] [CrossRef]
  136. Cervero, R.; Murakami, J. Effects of built environment on vehicle miles traveled: Evidence from 370 US urbanized areas. Environ. Plan. A 2010, 42, 400–418. [Google Scholar] [CrossRef]
  137. Ding, C.; Mishra, S.; Lu, G.; Yang, J.; Liu, C. Influences of built environment characteristics and individual factors on commuting distance: A multilevel mixture hazard modeling approach. Transp. Res. Part D 2017, 51, 314–325. [Google Scholar] [CrossRef]
  138. Manaugh, K.; Miranda-Moreno, L.F.; El-Geneidy, A.M. The effect of neighborhood characteristics, accessibility, home–work location, and demographics on commuting distances. Transportation 2010, 37, 627–646. [Google Scholar] [CrossRef]
  139. McAlister, L.; Pessemier, E. Variety seeking behavior: An interdisciplinary review. J. Consum. Res. 1982, 9, 311–322. [Google Scholar] [CrossRef]
  140. Tversky, A.; Kahneman, D. The framing of decisions and the psychology of choice. Science 1981, 211, 453–458. [Google Scholar] [CrossRef] [PubMed]
  141. Ermagun, A.; Lindsey, G. Differences in Spending by Local Trail Users: Two-Part Model of Expenditures. Transp. Res Rec. 2016, 2598, 58–66. [Google Scholar] [CrossRef]
Figure 1. Location of the study area (City of Seoul). The total area is about 605.21 km2 and the population of the city is 9.8 million. The Han River separates old districts in the north and new districts in the south. Relatively large urban forests are located in both the northern and southern boundary areas, while neighborhood and small urban pocket parks are scattered throughout the city (modified map provided by the City of Seoul).
Sustainability 10 02461 g001
Figure 2. Example of two attributes used in the survey. Some images were provided to enhance respondents’ understanding of the attributes and their levels. * Modified from [36].
Sustainability 10 02461 g002
Table 1. Hypothetical attribute types and levels of urban forests. Six salient attributes were selected from the literature and a preliminary study.
AttributeAttribute Level c
Forest tree typeBroadleaved forest, Mixed forest, (Coniferous forest)
Paving material of trailSoil-type pavement, Wooden deck, (Porous elastic pavement)
TopographyHilly, Flat, Mountainous slope
Walking timeLess than 1 h walk, between 1 and 2 h walk, (more than 2 h walk)
Travel time aLess than 15 min, between 15 and 30 min, between 30 and 60 min, (more than 60 min)
Fund b5000 KRW, 20,000 KRW, 30,000 KRW, (50,000 KRW)
a Time to urban forest from home; b Amount of fund per person (per visit); c Attribute levels in parenthesis indicate the base level.
Table 2. Frequencies of the bid amounts resulting from the preliminary study with college students. About 69.6% of participants preferred to pay one of 5000 KRW (4.62 USD), 10,000 KRW (9.24 USD), 30,000 KRW (27.72 USD), and 50,000 KRW (46.2 USD) for changes in the levels of the attributes.
FWTP a (USD b)FrequencyPercent (%)FWTP a (USD b)FrequencyPercent (%)
0 (0)76.130,000 (27.72) c119.6
5000 (4.62) a1210.450,000 (46.2) c2017.4
8000 (7.39)10.9100,000 (92.4)119.6
10,000 (9.24) c3732.2200,000 (184.8)10.9
15,000 (13.86)32.61,000,000 (924)21.7
20,000 (18.48)108.7
a amount of funds willing to pay; b 10,000 KRW ≈ 9.24 USD; c Bid amount used in the study.
Table 3. Stratified sampling design (quota sampling design). The study areas were grouped into five regions based on the geographical locations. The allocation of sampling size was determined by the population size of the regions. We attempted to evenly distribute the sampling size for age groups and gender groups.
RegionSample Size (%)Age GroupSample Size (%)Sex GroupSample Size (%)
Central region31 (5.2)20s138 (23.0)Male300 (50.0)
East-south region124 (20.7)30s156 (26.0)Female300 (50.0)
East-north region188 (31.3)40s156 (26.0)
West-south region186 (31.0)50s150 (25.0)
West-north region71 (11.8)
Total600 (100) 600 (100) 600 (100)
Table 4. Characteristics of participants. Most participants had graduated from college, and most were office workers. Interestingly, the monthly income of participants was relatively evenly distributed.
VariablesFrequency (%)
Education levelMiddle school: 1 (0.2)High school: 74 (12.3)
College student: 51 (8.5)Above college level: 474 (79.0)
OccupationOffice worker: 255 (42.5)Homemaker: 72 (12.0)
Student: 52 (8.7)Manager: 48 (8.0)
Self-employed: 48 (8.0)Professional: 33 (5.5)
Sales: 23 (3.8)Retired: 21 (3.5)
Service: 18 (3.0)Simple labor: 6 (1.0)
Technician: 5 (0.8)Government employee: 2 (0.3)
Others: 14 (2.3)
Monthly household income * (10,000 KRW)Less than 200: 37 (6.2)200–250: 35 (5.8)
250–300: 42 (7.0)300–350: 56 (9.3)
350–400: 60 (10.0)400–450: 64 (10.7)
450–500: 53 (8.8)500–600: 81 (13.5)
600–700: 56 (9.3)700–800: 46 (7.7)
800–900: 24 (4.0)900–1000: 17 (2.8)
More than 1000: 29 (4.8)
Marriage statusMarried: 335 (55.8)Not married: 249 (41.5)
Divorced/separated: 16 (2.7)
Children **Yes: 74 (21.1)No: 277 (78.9)
SexMale: 300 (50)Female: 300 (50)
Age20–30 years: 138 (23.0)30–40 years: 156 (26.0)
40–50 years: 156 (25.0)50–60 years: 150 (25.0)
n = 600; * 10,000 KRW (Korean Won) ≈ 9.24 USD; ** Excluding 249 not married participants.
Table 5. The estimated conjoint choice model with five salient attributes and attribute levels affecting the urban forest of urban residents. A positive coefficient indicates that participants had a preference for that particular attribute level.
AttributeAttribute LevelCoefficientS.D.p of t
Forest typea. Broadleaved forest0.43610.15580.0051
b. Mixed forest0.33900.15860.0326
c. Coniferous forest (base level)0.0
Paving material of traila. Soil-type pavement0.57650.18490.0018
b. Wooden deck0.50660.16300.0019
c. Porous elastic pavement (base level)0.0
Topographya. Flat0.90910.17960.0000
b. Hilly slope0.78240.16910.0000
c. Mountainous slope (base level)0.0
Walking timea. Less than 1 h−0.03260.15720.8355
b. Between 1 and 2 h0.04190.18680.8226
c. More than 2 h (base level)0.0
Travel timea. Less than 15 min0.68880.17820.0001
b. Between 15 and 30 min0.68240.18820.0003
c. Between 30 and 60 min0.49210.18940.0094
d. More than 60 min (base level)0.0
Amounts of fund-−0.03530.00410.0000
ASC (constant)-−0.00740.27410.9784
LL-value: −539.0109, ρ2 = 0.1823.
Table 6. The additional funds that urban dwellers would be willing to pay to enhance each attribute from the base level. Altering the trail topography resulted in the highest amount of additional funds and altering forest tree types from coniferous forests into mixed forest resulted in the lowest amount of additional fund.
AttributeAttribute LevelFWTP a KRW b (USD c)Computation
Forest tree typea. Broadleaved tree forest12,354 (11.42) ( 0.4361 0.0353 )
b. Mixed forest9603 (8.87) ( 0.3390 0.0353 )
c. Coniferous forest (base level)--
Paving material of trailsa. Soil- type pavement16,331 (15.09) ( 0.5765 0.0353 )
b. Wooden deck14, 351 (13.26) ( 0.5066 0.0353 )
c. Porous elastic pavement (base level)--
Topographya. Flat25,753 (23.8) ( 0.7824 0.0353 )
b. Hilly slope22,164 (20.48) ( 0.9091 0.0353 )
c. Mountainous slope (base level)--
Travel timea. Less than 15 min19,512 (18.03) ( 0.6888 0.0353 )
b. Between 15 and 30 min19,331 (17.86) ( 0.6824 0.0353 )
c. Between 30 and 60 min13,940 (12.88) ( 0.4921 0.0353 )
d. More than 60 min (base level)--
a FWTP = amount of additional funds willingness to pay (one-time payment per person); b Korean Won; c Transformed into USD (10,000 Korean Won ≈ 9.24 USD).
Table 7. The re-estimated conjoint choice model with salient attributes, sociodemographic characteristics, and patterns of use. The attributes of forests and their levels had similar coefficients to those of the estimated model without sociodemographic characteristics and use patterns.
AttributeAttribute LevelCoefficientS.D.p. of t
Forest tree typea. Broadleaved forest0.45300.15730.0040
b. Mixed forest0.38180.16150.0181
c. Coniferous forest (base level)0.0
Paving material of traila. Soil-type pavement0.60460.18850.0013
b. Wooden deck0.51890.16580.0018
c. Porous elastic pavement (base level)0.0
Topographya. Flat0.91220.18190.0000
b. Hilly slope0.80610.17150.0000
c. Mountainous slope (base level)0.0
Walking time aa. Less than 1 h−0.03920.15900.8053
b. Between 1 and 2 h0.02870.18880.8790
c. More than 2 h (base level)0.0
Travel timea. Less than 15 min0.67860.17940.0002
b. Between 15 and 30 min0.69910.18960.0002
c. Between 30 and 60 min0.49850.19080.0090
d. More than 60 min (base level)0.0
Visit frequency aa. Low frequency visitors−0.28820.11730.0140
b. High frequency visitors (base level)0.0
Access modea. Cars0.51410.14140.0003
b. Others (base level)0.0
Sexa. Male0.76520.25350.0025
b. Female (base level)0.0
Income level-0.06180.03920.1146
Age-−0.26060.12900.0434
Fund-−0.03580.00410.0000
ASC (constant)-−0.09750.94550.9187
LL-value: −519.7783, ρ2 = 0.2115; a More than three times per year.

