Study on the Vertical Linkage of Greenhouse Gas Emission Intensity Change of the Animal Husbandry Sector between China and Its Provinces


Abstract
:1. Introduction
2. Materials and Methods
2.1. Estimation of AHGI
2.2. Decomposition of AHGI
2.2.1. Decomposing Process
2.2.2. Calculating Method
2.3. Data Collection and Processing
3. Results and Discussion
3.1. Changes of AHGI in China and Its Provinces
3.2. Analysis of Provincial Contributions to the Reduction of China’s AHGI
3.3. Analysis of Driving Factors’ Contributions to the Reduction of China’s AHGI
3.3.1. AHPE Factor
3.3.2. AHEE Factor
3.3.3. AHES Factor
3.4. Advantages and Limitations of This Study
4. Conclusions
- (1)
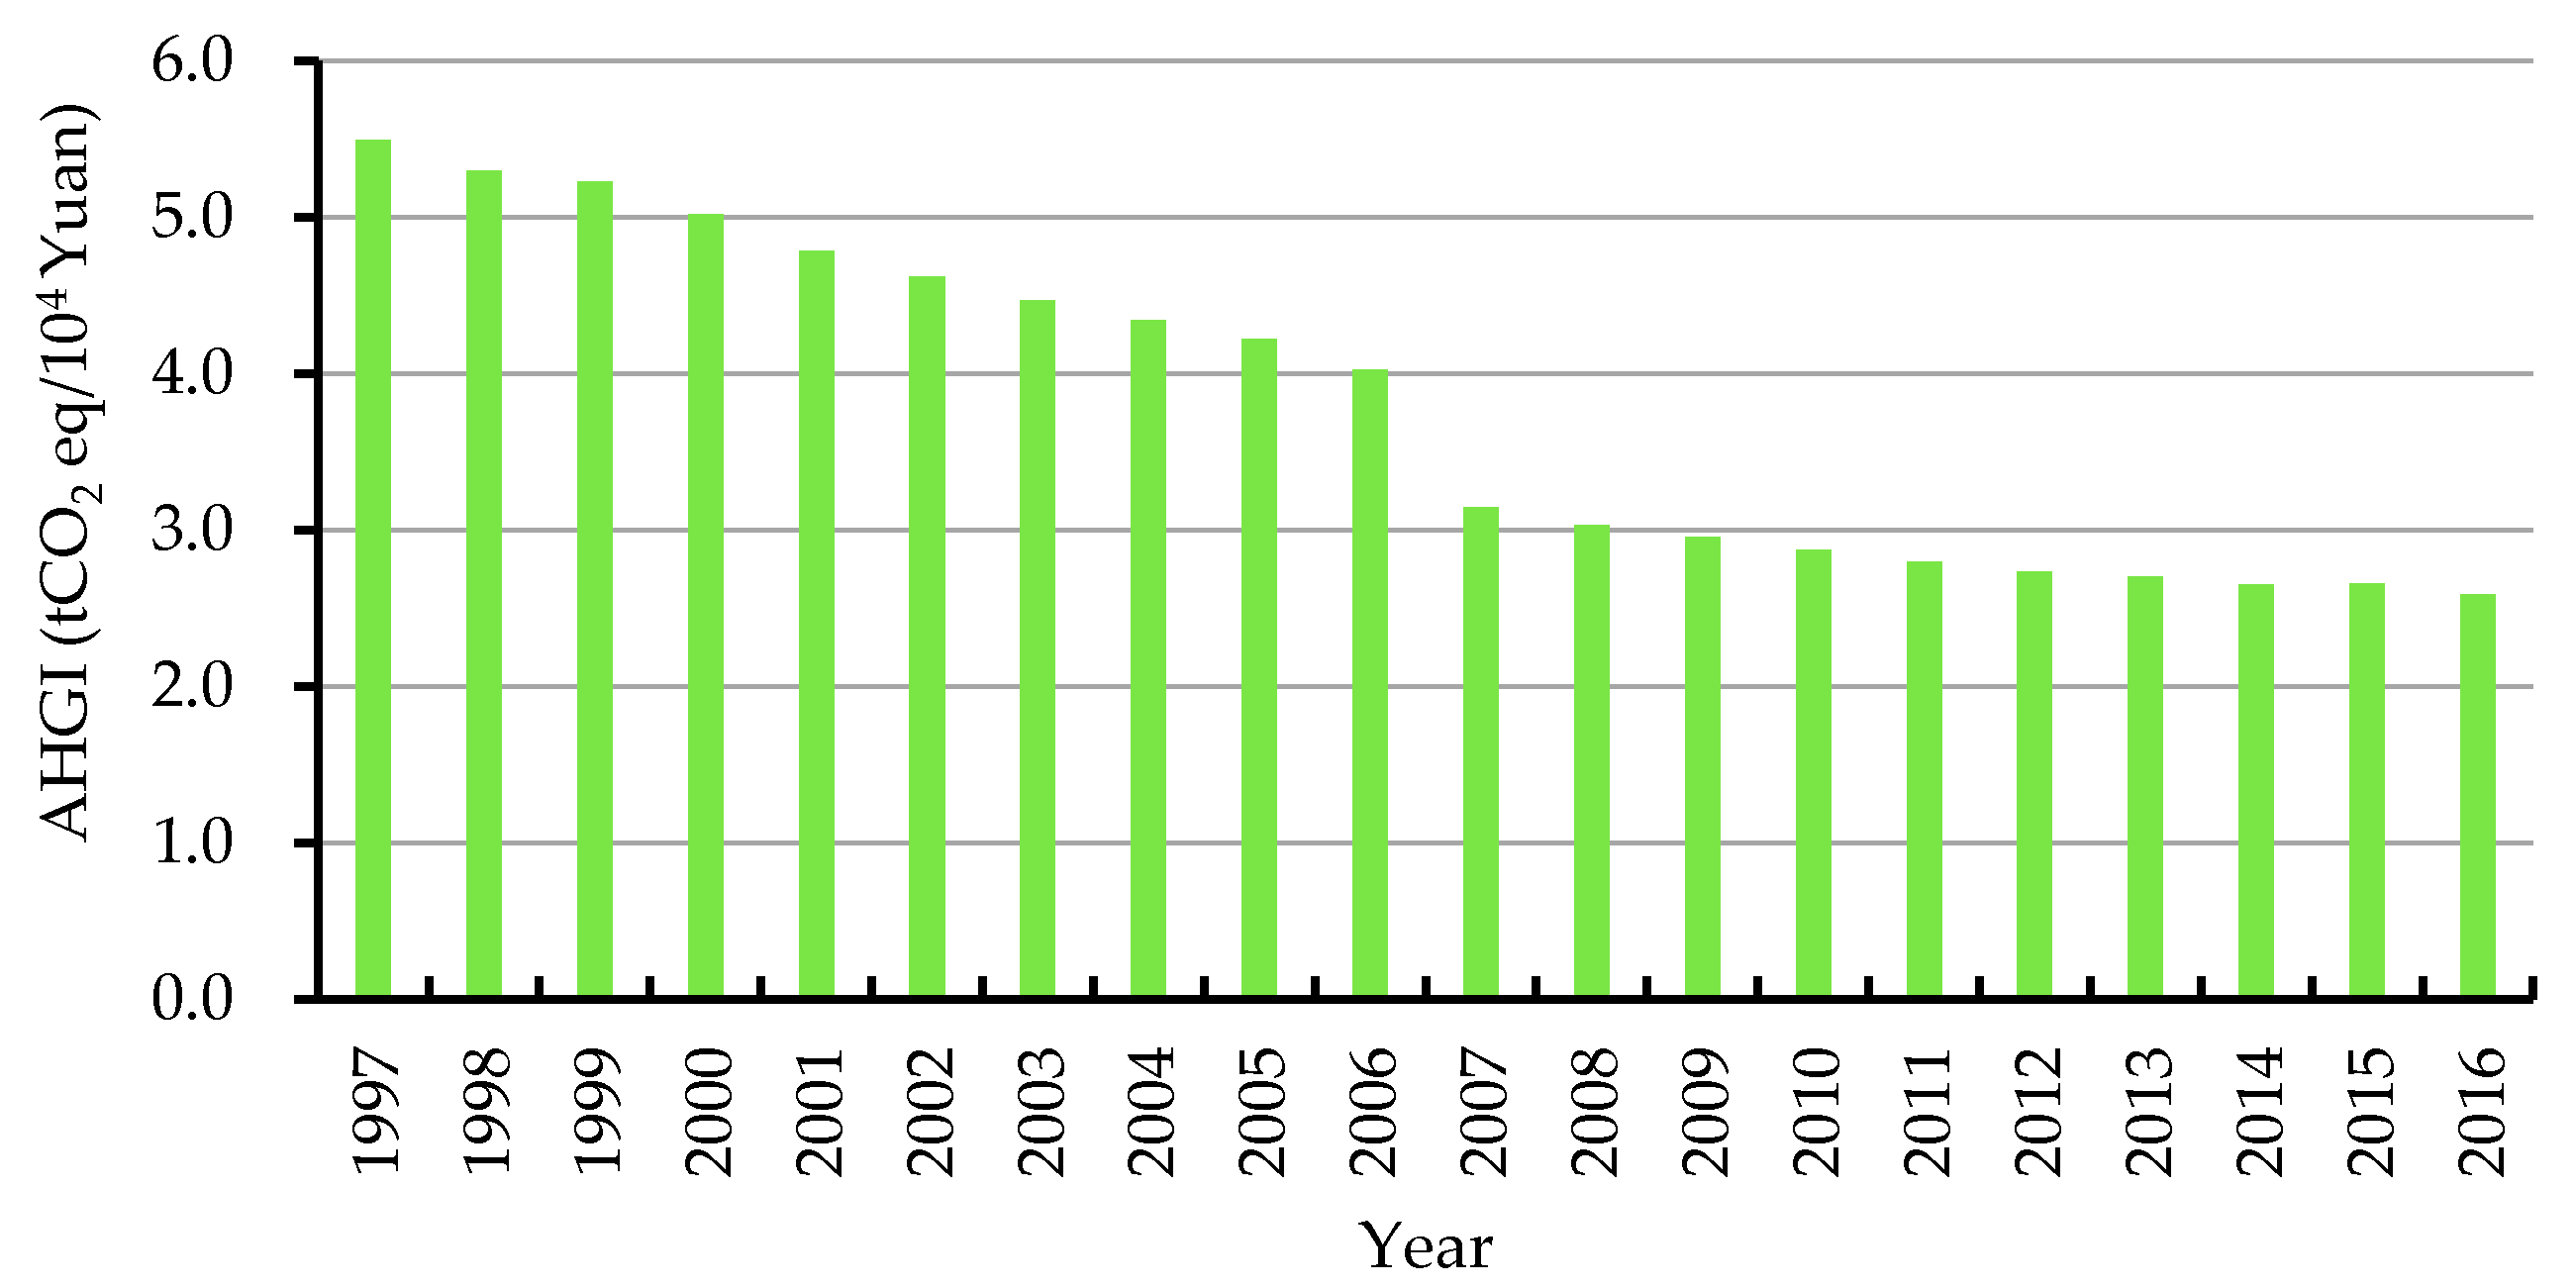
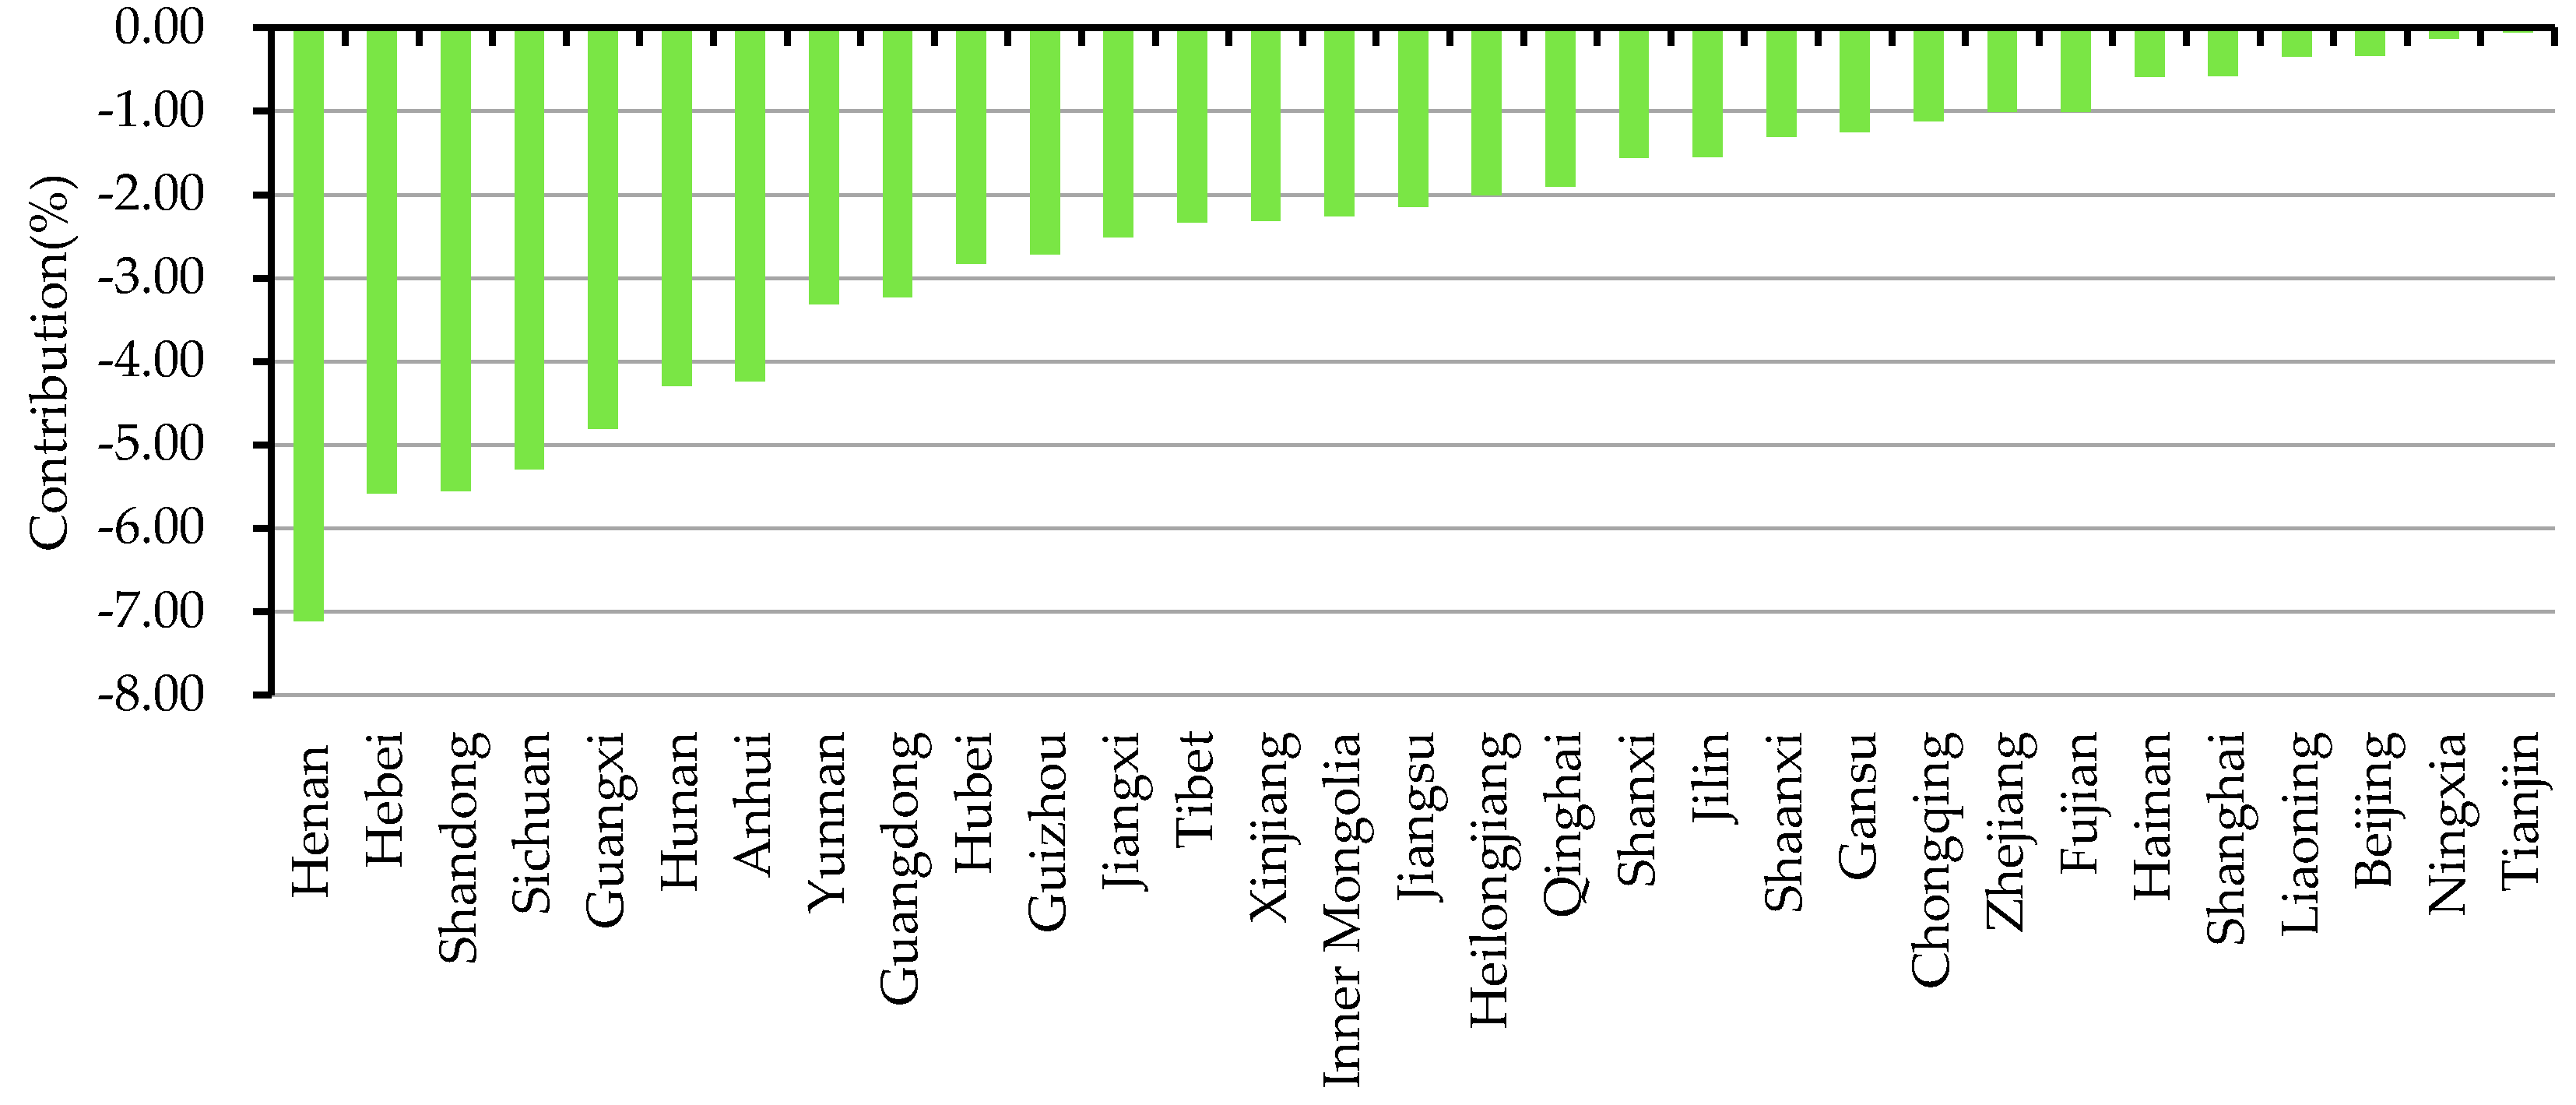
- The AHGI of China decreased from 5.49 tCO2eq/104 yuan in 1997 to 2.59 tCO2eq/104 in 2016, showing a 75.25% reduction. Compared 2016 with 1997, the AHGI in 31 provinces also declined and played a positive role in promoting the reduction of the national AHGI, but there were significant differences among provinces in the extent of contribution. Henan, the largest contributor, contributed to a 7.11% reduction of China’s AHGI, and Tianjin was the smallest contributor (0.06%). The top ten provinces (Henan, Hebei, Shandong, Sichuan, Guangxi, Hunan, Anhui, Yunnan, Guangdong and Hubei) cumulatively contributed to a reduction of 46.22% in China’s AHGI, accounting for 61.42% of the total contributions by 31 provinces; while the bottom ten provinces (Tianjin, Ningxia, Beijing, Liaoning, Shanghai, Hainan, Fujian, Zhejiang, Chongqing and Gansu) cumulatively contributed to a reduction of only 6.45% in China’s AHGI, accounting for 8.57% of total provincial contributions. Overall, there was an inconsistency between the extent of the actual reduction of AHGI in each province and its contributions to the country. China’s progress in reducing AHGI was mainly made by provinces with a large GHG emissions from AH.
- (2)
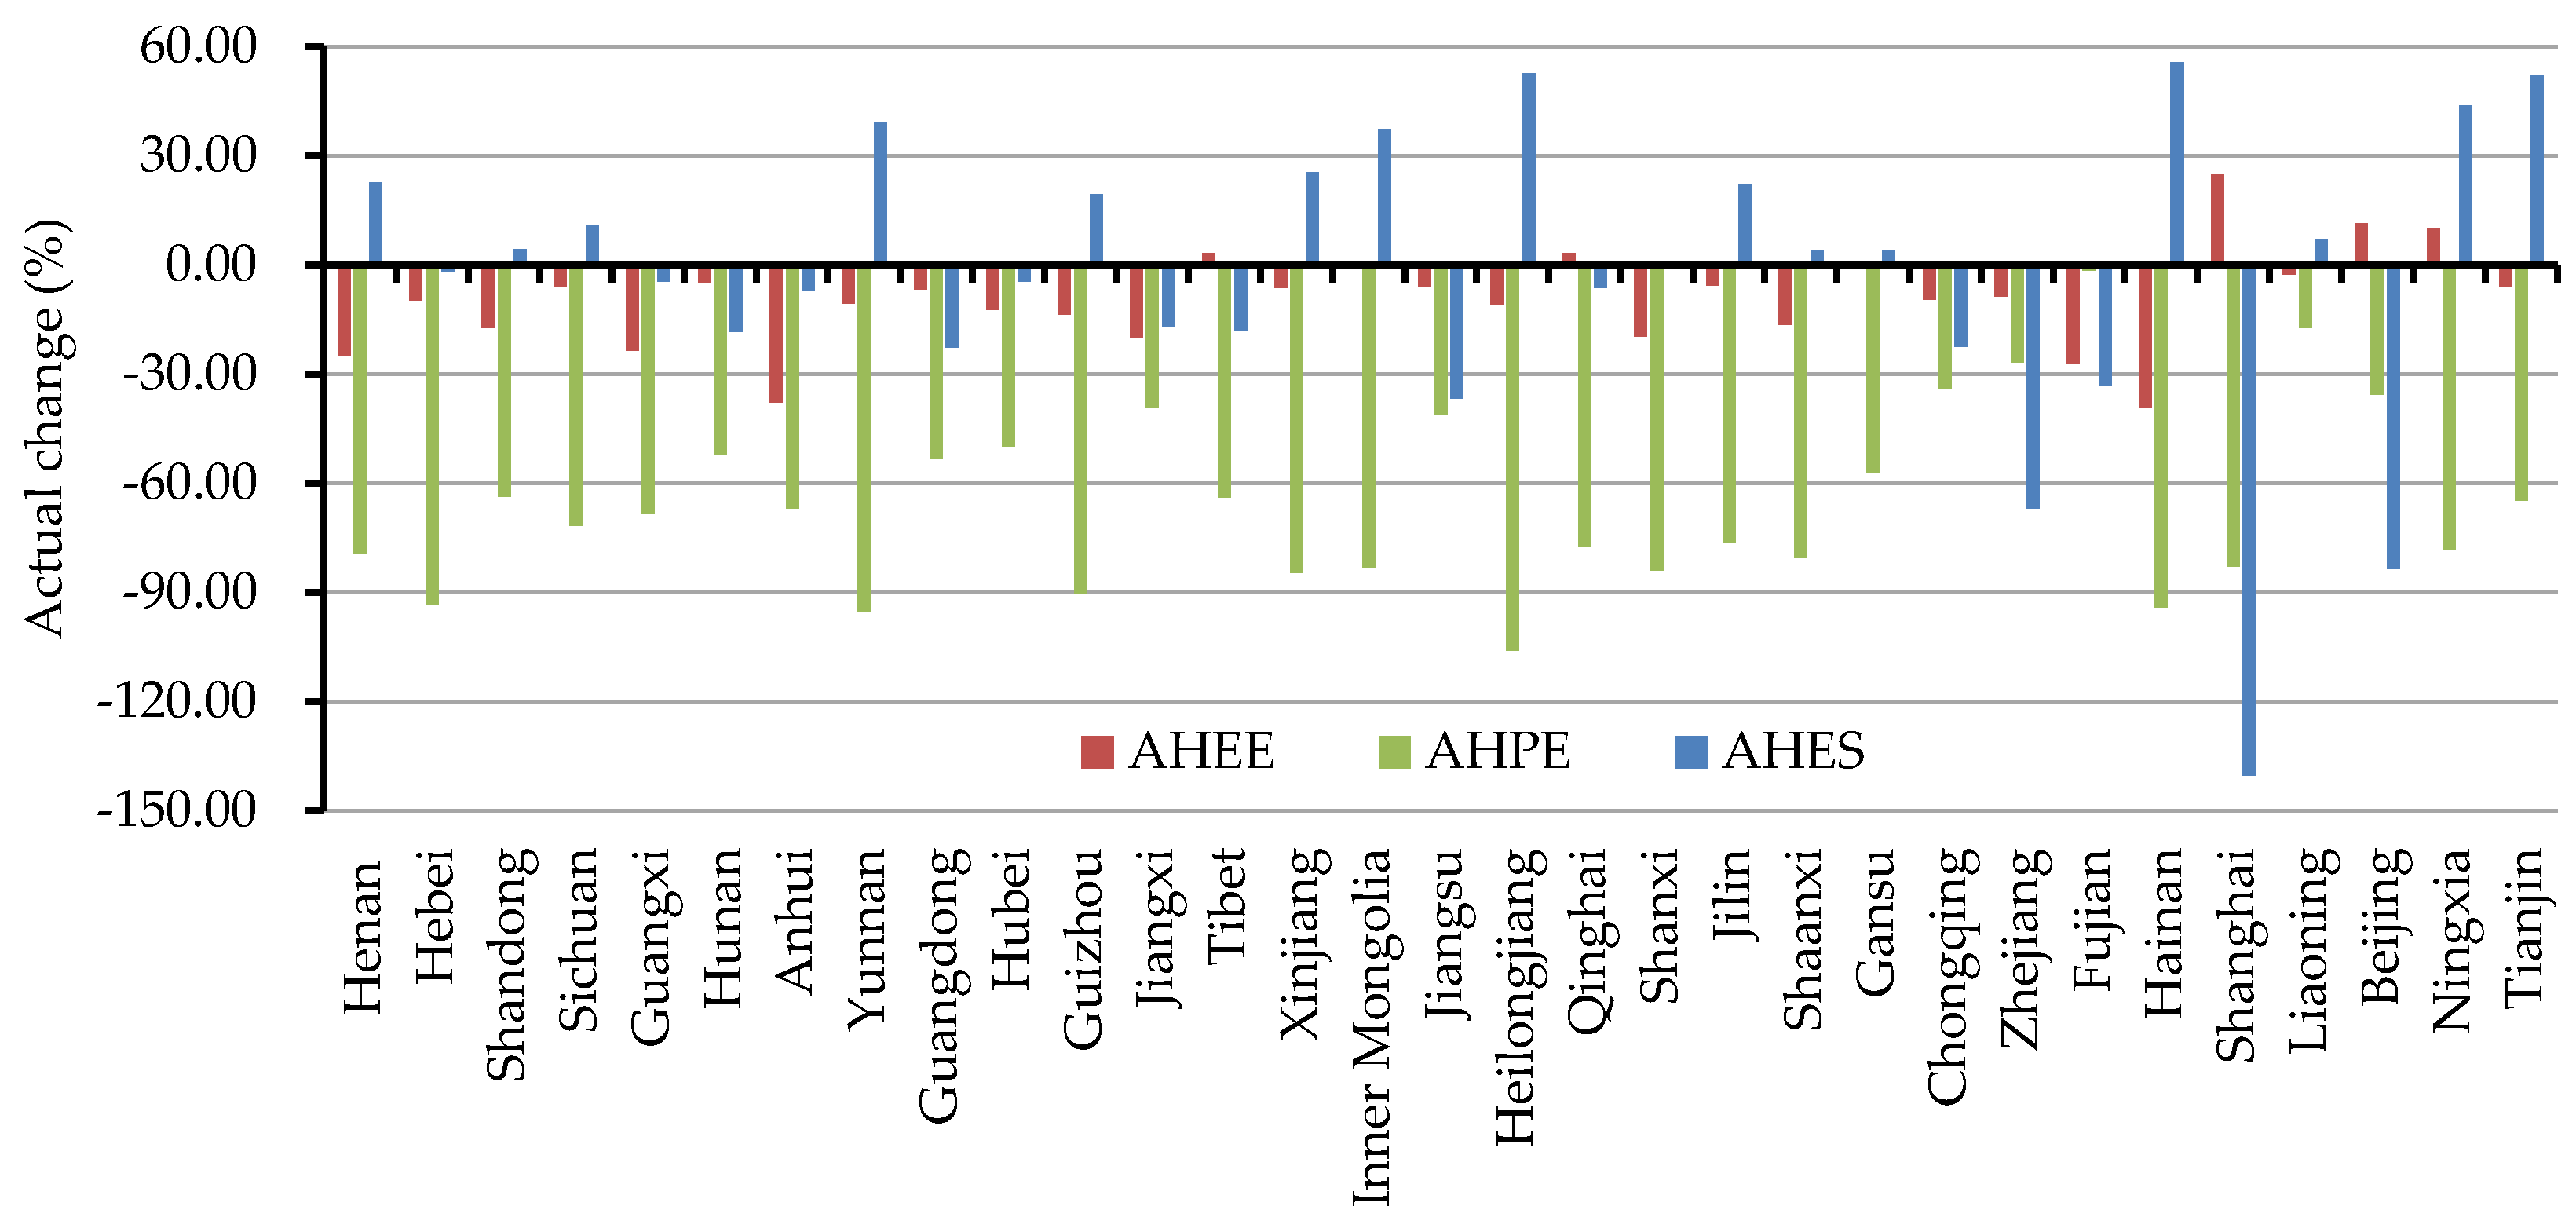
- Three driving factors (environmental efficiency, productive efficiency, and economic share) comprehensively determine the reduction of China’s AHGI through two different contributions of positive promotion and negative inhibition, but the way in which the three driving factors exert their impact and the extent of their contributions vary significantly among provinces. The productive efficiency and environmental efficiency factors in 31 provinces cumulatively contributed to the respective 68.17% and 11.78% reduction of China’s AHGI, while the economic share factors of 31 provinces cumulatively inhibited the 4.70% reduction of China’s AHGI. Overall, the productive efficiency factors are the main driving factors contributing to the reduction of China’s AHGI. The reduction of China’s AHGI during the study period depended more on the substantial increase in the AH’s productive efficiency than on the improvement of AH’s environmental efficiency. The economic share factor was a weight with the nature of a “double-edged sword”, which can decrease or increase the contribution value of each province to the reduction of China’s AHGI. In the future, improving the level of AHEE through GHG emission reduction technology and narrowing the inter-provincial gap of the level of AHPE are two important paths for promoting the reduction of China’s AHGI. In terms of improving the level of AHEE, all provinces need to do this. However this is even more urgent in the seven provinces, including Tibet, Qinghai, Inner Mongolia, Ningxia, Gansu, Beijing and Shanghai. In terms of narrowing the inter-provincial gap of the level of AHPE, the gap is mainly reflected between the frontier grassland pastoral areas in the western and the agricultural areas in Central and Eastern China. The key provinces that need to improve the level of AHPE are located in grassland pastoral areas, including Tibet, Qinghai, Gansu, Xinjiang, Inner Mongolia, Ningxia, Guizhou, Yunnan and Guangxi.
Author Contributions
Funding
Acknowledgments
Conflicts of Interest
Appendix A

| Region | Dairy Cow | Cattle | Buffalo | Horse | Donkey | Mule |
| North China | 7.46 | 2.82 | - | 1.09 | 0.60 | 0.60 |
| Northeast China | 2.23 | 1.02 | - | 1.09 | 0.60 | 0.60 |
| East China | 8.33 | 3.31 | 5.55 | 1.64 | 0.90 | 0.90 |
| Central and Southern China | 8.45 | 4.72 | 8.24 | 1.64 | 0.90 | 0.90 |
| Southwest China | 6.51 | 3.21 | 1.53 | 1.64 | 0.90 | 0.90 |
| Northwest China | 5.93 | 1.86 | - | 1.09 | 0.60 | 0.60 |
| Region | Camel | Sheep | Goat | Pig | Poultry | |
| North China | 1.28 | 0.15 | 0.17 | 3.12 | 0.01 | |
| Northeast China | 1.28 | 0.15 | 0.16 | 1.12 | 0.01 | |
| East China | 1.92 | 0.26 | 0.28 | 5.08 | 0.02 | |
| Central and Southern China | 1.92 | 0.34 | 0.31 | 5.85 | 0.02 | |
| Southwest China | 1.92 | 0.48 | 0.53 | 4.18 | 0.02 | |
| Northwest China | 1.28 | 0.28 | 0.32 | 1.38 | 0.01 |
| Region | Dairy Cow | Cattle | Buffalo | Horse | Donkey | Mule |
| North China | 1.846 | 0.794 | - | 0.330 | 0.188 | 0.188 |
| Northeast China | 1.096 | 0.931 | - | 0.330 | 0.188 | 0.188 |
| East China | 2.065 | 0.846 | 0.875 | 0.330 | 0.188 | 0.188 |
| Central and Southern China | 1.710 | 0.805 | 0.860 | 0.330 | 0.188 | 0.188 |
| Southwest China | 1.884 | 0.691 | 1.197 | 0.330 | 0.188 | 0.188 |
| Northwest China | 1.447 | 0.545 | - | 0.330 | 0.188 | 0.188 |
| Region | Camel | Sheep | Goat | Pig | Poultry | |
| North China | 0.330 | 0.093 | 0.093 | 0.227 | 0.007 | |
| Northeast China | 0.330 | 0.057 | 0.057 | 0.266 | 0.007 | |
| East China | 0.330 | 0.113 | 0.113 | 0.175 | 0.007 | |
| Central and Southern China | 0.330 | 0.106 | 0.106 | 0.157 | 0.007 | |
| Southwest China | 0.330 | 0.064 | 0.064 | 0.159 | 0.007 | |
| Northwest China | 0.330 | 0.074 | 0.074 | 0.195 | 0.007 |
| Item | Descriptions |
|---|---|
| GHG | Greenhouse gas |
| AH | Animal husbandry |
| CI | Carbon intensity |
| LMDI | The logarithmic mean Divisia index |
| AHGI | Greenhouse gas emission intensity of animal husbandry sector (in tCO2 eq/104 yuan) |
| AHGE | The sum of greenhouse gas emissions from animal husbandry sector (in tCO2 eq) |
| AHGDP | Economic output value of animal husbandry sector (104 yuan) |
| AHBS | The input of production factors in the animal husbandry sector (it can be replaced with the breeding scale of livestock by converting to standard cattle units) |
| AHEE | The animal husbandry environmental efficiency (GHG emissions per unit of livestock) |
| AHPE | The animal husbandry productive efficiency (livestock input per unit of AHGDP) |
| AHES | The animal husbandry economic share (the provincial proportion of the AHGDP in the national AHGDP) |
References
- Vandyck, T.; Keramidas, K.; Saveyn, B.; Kitous, A.; Vrontisi, Z. A global stocktake of the Paris pledges: Implications for energy systems and economy. Glob. Environ. Chang. 2016, 41, 46–63. [Google Scholar] [CrossRef]
- Food and Agriculture Organization (FAO). The State of Food and Agriculture Climate Change, Agriculture and Food Security; FAO: Rome, Italy, 2016. [Google Scholar]
- Intergovernmental Panel on Climate Change (IPCC). Clim. Chang. 2014: Synthesis Report. Contribution of Working Groups I, II and III to the Fifth Assessment Report of the Intergovernmental Panel on Climate Change; Core Writing Team, Pachauri, R.K., Meyer, L.A., Eds.; IPCC: Geneva, Switzerland, 2014; 151p.
- Liu, L.-C.; Wu, G. The effects of carbon dioxide, methane and nitrous oxide emission taxes: An empirical study in China. J. Clean. Prod. 2017, 142, 1044–1054. [Google Scholar] [CrossRef]
- National Development and Reform Commission of China (NDRCC). Enhanced Actions on Climate Change: China's Intended Nationally Determined Contributions; NDRCC: Beijing, China, 2015.
- Chen, Y.; Lin, S. Decomposition and allocation of energy-related carbon dioxide emission allowance over provinces of China. Nat. Hazards 2014, 76, 1893–1909. [Google Scholar] [CrossRef]
- Wang, F.; Feng, G.; Wu, L. Regional Coutribution to the Decline of National Carbon Intensity in China’s Economic Growth. Econ. Res. 2013, 8, 143–155. [Google Scholar]
- Wang, K.; Zhang, X.; Wei, Y.-M.; Yu, S. Regional allocation of CO2 emissions allowance over provinces in China by 2020. Energy Policy 2013, 54, 214–229. [Google Scholar] [CrossRef]
- Smith, P.M.B.; Ahammad, H.; Clark, H.; Dong, H.; Elsiddig, E.A.; Haberl, H.; Harper, R.; House, J.; Jafari, M.; Masera, O.; et al. Agriculture, Forestry and Other Land Use (AFOLU). In Climate Change 2014: Mitigation of Climate Change. Contribution of Working Group III to the Fifth Assessment Report of the Intergovernmental Panel on Climate Change; Edenhofer, O., Pichs-Madruga, R., Sokona, Y., Farahani, E., Kadner, S., Seyboth, K., Adler, A., Baum, I., Brunner, S., Eickemeier, P., et al., Eds.; Cambridge University Press: Cambridge, UK; New York, NY, USA, 2014; pp. 811–922. [Google Scholar]
- Smith, P.; Martino, D.; Cai, Z.; Gwary, D.; Janzen, H.; Kumar, P.; McCarl, B.; Ogle, S.; O’Mara, F.; Rice, C.; et al. Greenhouse gas mitigation in agriculture. Philos. Trans. R. Soc. Lond. Ser. B Boil. Sci. 2008, 363, 789–813. [Google Scholar] [CrossRef] [PubMed] [Green Version]
- Caro, D.; Davis, S.J.; Bastianoni, S.; Caldeira, K. Global and regional trends in greenhouse gas emissions from livestock. Clim. Chang. 2014, 126, 203–216. [Google Scholar] [CrossRef] [Green Version]
- Ripple, W.J.; Smith, P.; Haberl, H.; Montzka, S.A.; McAlpine, C.; Boucher, D.H. Ruminants, climate change and climate policy. Nat. Clim. Chang. 2013, 4, 2–5. [Google Scholar] [CrossRef]
- O’Mara, F.P. The significance of livestock as a contributor to global greenhouse gas emissions today and in the near future. Anim. Feed. Sci. Technol. 2011, 166–167, 7–15. [Google Scholar] [CrossRef] [Green Version]
- Reisinger, A.; Clark, H. How much do direct livestock emissions actually contribute to global warming? Glob. Chang. Boil. 2017, 24, 1749–1761. [Google Scholar] [CrossRef] [PubMed]
- Herrero, M.; Henderson, B.; Havlík, P.; Thornton, P.K.; Conant, R.T.; Smith, P.; Wirsenius, S.; Hristov, A.N.; Gerber, P.; Gill, M.; et al. Greenhouse gas mitigation potentials in the livestock sector. Nat. Clim. Chang. 2016, 6, 452–461. [Google Scholar] [CrossRef] [Green Version]
- Havlik, P.; Valin, H.; Herrero, M.; Obersteiner, M.; Schmid, E.; Rufino, M.C.; Mosnier, A.; Thornton, P.K.; Bottcher, H.; Conant, R.T.; et al. Climate change mitigation through livestock system transitions. Proc. Natl. Acad. Sci. USA 2014, 111, 3709–3714. [Google Scholar] [CrossRef] [PubMed] [Green Version]
- Gerber, P.J.S.H.; Henderson, B.; Mottet, A.; Opio, C.; Dijkman, J.; Falcucci, A.; Tempio, G. Tackling Climate Change through Livestock—A Global Assessment of Emissions and Mitigation Opportunities; Food and Agriculture Organization of the United Nations (FAO): Rome, Italy, 2013. [Google Scholar]
- Frank, S.; Beach, R.; Havlík, P.; Valin, H.; Herrero, M.; Mosnier, A.; Hasegawa, T.; Creason, J.; Ragnauth, S.; Obersteiner, M. Structural change as a key component for agricultural non-CO2 mitigation efforts. Nat. Commun. 2018, 9, 1–8. [Google Scholar] [CrossRef] [PubMed]
- National Coordination Committee on Climate Change (NCCC). Second National Communication on Climate Change of The People’s Republic of China; NCCC: Beijing, China, 2012.
- Tilman, D.; Clark, M. Global diets link environmental sustainability and human health. Nature 2014, 515, 518–522. [Google Scholar] [CrossRef] [PubMed]
- Lin, J.; Hu, Y.; Cui, S.; Kang, J.; Xu, L. Carbon footprints of food production in China (1979–2009). J. Clean. Prod. 2015, 90, 97–103. [Google Scholar]
- Hawkins, J.; Ma, C.; Schilizzi, S.; Zhang, F. China’s changing diet and its impacts on greenhouse gas emissions: An index decomposition analysis. Aust. J. Agric. Resour. Econ. 2018, 62, 45–64. [Google Scholar] [CrossRef]
- Popp, A.; Calvin, K.; Fujimori, S.; Havlik, P.; Humpenöder, F.; Stehfest, E.; Bodirsky, B.L.; Dietrich, J.P.; Doelmann, J.C.; Gusti, M.; et al. Land-use futures in the shared socio-economic pathways. Glob. Environ. Chang. 2017, 42, 331–345. [Google Scholar] [CrossRef]
- Li, X.L.; Yuan, Q.H.; Wan, L.Q.; He, F. Perspectives on livestock production systems in China. Rangel. J. 2008, 30, 211. [Google Scholar] [CrossRef]
- Bennetzen, E.H.; Smith, P.; Porter, J.R. Decoupling of greenhouse gas emissions from global agricultural production: 1970–2050. Glob. Chang. Biol. 2016, 22, 763–781. [Google Scholar] [CrossRef] [PubMed]
- Bennetzen, E.H.; Smith, P.; Porter, J.R. Agricultural production and greenhouse gas emissions from world regions—The major trends over 40 years. Glob. Environ. Chang. 2016, 37, 43–55. [Google Scholar] [CrossRef]
- Tichenor, N.E.; Peters, C.J.; Norris, G.A.; Thoma, G.; Griffin, T.S. Life cycle environmental consequences of grass-fed and dairy beef production systems in the Northeastern United States. J. Clean. Prod. 2017, 142, 1619–1628. [Google Scholar] [CrossRef]
- Lesschen, J.P.; van den Berg, M.; Westhoek, H.J.; Witzke, H.P.; Oenema, O. Greenhouse gas emission profiles of European livestock sectors. Anim. Feed. Sci. Technol. 2011, 166–167, 16–28. [Google Scholar] [CrossRef]
- Reckmann, K.; Traulsen, I.; Krieter, J. Life Cycle Assessment of pork production: A data inventory for the case of Germany. Livest. Sci. 2013, 157, 586–596. [Google Scholar] [CrossRef]
- Gollnow, S.; Lundie, S.; Moore, A.D.; McLaren, J.; van Buuren, N.; Stahle, P.; Christie, K.; Thylmann, D.; Rehl, T. Carbon footprint of milk production from dairy cows in Australia. Int. Dairy J. 2014, 37, 31–38. [Google Scholar] [CrossRef]
- Patra, A.K. Accounting methane and nitrous oxide emissions, and carbon footprints of livestock food products in different states of India. J. Clean. Prod. 2017, 162, 678–686. [Google Scholar] [CrossRef]
- Desjardins, R.; Worth, D.; Vergé, X.; Maxime, D.; Dyer, J.; Cerkowniak, D. Carbon Footprint of Beef Cattle. Sustainability 2012, 4, 3279–3301. [Google Scholar] [CrossRef] [Green Version]
- Zhang, W.; Li, K.; Zhou, D.; Zhang, W.; Gao, H. Decomposition of intensity of energy-related CO2 emission in Chinese provinces using the LMDI method. Energy Policy 2016, 92, 369–381. [Google Scholar] [CrossRef]
- Tan, Z.; Li, L.; Wang, J.; Wang, J. Examining the driving forces for improving China’s CO2 emission intensity using the decomposing method. Appl. Energy 2011, 88, 4496–4504. [Google Scholar] [CrossRef]
- Wang, Z.; Zhang, B.; Liu, T. Empirical analysis on the factors influencing national and regional carbon intensity in China. Renew. Sustain. Energy Rev. 2016, 55, 34–42. [Google Scholar] [CrossRef]
- Meng, X.; Cheng, G.; Zhang, J.; Wang, Y.; Zhou, H. Analyze on the spatialtemporal characteristics of GHG estimation of livestock’s by life cycle assessment in China. China Environ. Sci. 2014, 34, 2167–2176. [Google Scholar]
- Yao, C.; Qian, S.; Li, Z.; Liang, L. Provincial animal husbandry carbon emissions in China and temporal-spatial evolution mechanism. Resour. Sci. 2017, 39, 698–712. [Google Scholar]
- Luo, Y.; Long, X.; Wu, C.; Zhang, J. Decoupling CO2 emissions from economic growth in agricultural sector across 30 Chinese provinces from 1997 to 2014. J. Clean. Prod. 2017, 159, 220–228. [Google Scholar] [CrossRef]
- Tian, Y.; Zhang, J.-b.; He, Y.-y. Research on Spatial-Temporal Characteristics and Driving Factor of Agricultural Carbon Emissions in China. J. Integr. Agric. 2014, 13, 1393–1403. [Google Scholar] [CrossRef]
- Xiong, C.; Yang, D.; Xia, F.; Huo, J. Changes in agricultural carbon emissions and factors that influence agricultural carbon emissions based on different stages in Xinjiang, China. Sci. Rep. 2016, 6, 36912. [Google Scholar] [CrossRef] [PubMed] [Green Version]
- Tian, J.; Yang, H.; Xiang, P.; Liu, D.; Li, L. Drivers of agricultural carbon emissions in Hunan Province, China. Environ. Earth Sci. 2016, 75, 1–17. [Google Scholar] [CrossRef]
- Xiong, C.; Yang, D.; Huo, J. Spatial-Temporal Characteristics and LMDI-Based Impact Factor Decomposition of Agricultural Carbon Emissions in Hotan Prefecture, China. Sustainability 2016, 8, 262. [Google Scholar] [CrossRef]
- Yao, C.; Qian, S.; Mao, Y.; Li, Z. Decomposition of impacting factors of animal husbandry carbon emissions change and its spatial differences in China. Trans. Chin. Soc. Agric. Eng. 2017, 33, 10–19. [Google Scholar]
- Zhuang, M.; Gongbuzeren, L.W. Greenhouse gas emission of pastoralism is lower than combined extensive/intensive livestock husbandry: A case study on the Qinghai-Tibet Plateau of China. J. Clean. Prod. 2017, 147, 514–522. [Google Scholar] [CrossRef]
- Luo, T.; Yue, Q.; Yan, M.; Cheng, K.; Pan, G. Carbon footprint of China’s livestock system—A case study of farm survey in Sichuan province, China. J. Clean. Prod. 2015, 102, 136–143. [Google Scholar] [CrossRef]
- Xue, B.; Wang, L.Z.; Yan, T. Methane emission inventories for enteric fermentation and manure management of yak, buffalo and dairy and beef cattle in China from 1988 to 2009. Agric. Ecosyst. Environ. 2014, 195, 202–210. [Google Scholar] [CrossRef]
- Xu, X.; Lan, Y. A comparative study on carbon footprints between plant- and animal-based foods in China. J. Clean. Prod. 2016, 112, 2581–2592. [Google Scholar] [CrossRef]
- Wang, L.-Z.; Xue, B.; Yan, T. Greenhouse gas emissions from pig and poultry production sectors in China from 1960 to 2010. J. Integr. Agric. 2017, 16, 221–228. [Google Scholar] [CrossRef]
- Ang, B.W. LMDI decomposition approach: A guide for implementation. Energy Policy 2015, 86, 233–238. [Google Scholar] [CrossRef]
- National Development and Reform Commission of China (NDRCC). Guidelines for the Development of Low Carbon and Provincial Greenhouse Gas Inventories; NDRCC: Beijing, China, 2013.
- IPCC. IPCC Guidelines for National Greenhouse Gas Inventories Volume 4: Agriculture, Forestry and Other Land Use; IPCC: Geneva, Switzerland, 2006.
- IPCC. Clim. Chang. 2007: Synthesis Report. Contribution of Working Groups I, II and III to the Fourth Assessment Report of the Intergovernmental Panel on Climate Change; Core Writing Team, Pachauri, R.K., Reisinger, A., Eds.; IPCC: Geneva, Switzerland, 2007.
- Wang, G.G.; Wang, M.L.; Yang, C. Characteristics and Mechanism of Animal Husbandry’s Geographical Agglomeration in China. J. Nat. Resour. 2014, 29, 2137–2146. [Google Scholar]
- Thornton, P.K. Livestock production: Recent trends, future prospects. Philos. Trans. R. Soc. B Boil. Sci. 2010, 365, 2853–2867. [Google Scholar] [CrossRef] [PubMed]
- Herrero, M.; Thornton, P.K. Livestock and global change: Emerging issues for sustainable food systems. Proc. Natl. Acad. Sci. USA 2013, 110, 20878–20881. [Google Scholar] [CrossRef] [PubMed] [Green Version]
- Ren, J. Grassland Science; China Agriculture Press: Beijing, China, 1961. [Google Scholar]
- Fu, Q.; Zhu, Y.; Kong, Y.; Sun, J. Spatial analysis and districting of the livestock and poultry breeding in China. J. Geogr. Sci. 2012, 22, 1079–1100. [Google Scholar] [CrossRef]
- Wang, G.; Wang, M.; Wang, J.; Yang, C.; Liu, Y. Characteristics and influencing factors of grass-feeding livestock breeding in China: An economic geographical perspective. J. Geogr. Sci. 2016, 26, 501–512. [Google Scholar] [CrossRef]
- Key, N.; Tallard, G. Mitigating methane emissions from livestock: A global analysis of sectoral policies. Clim. Chang. 2011, 112, 387–414. [Google Scholar] [CrossRef]
- Wang, W.; Koslowski, F.; Nayak, D.R.; Smith, P.; Saetnan, E.; Ju, X.; Guo, L.; Han, G.; de Perthuis, C.; Lin, E.; et al. Greenhouse gas mitigation in Chinese agriculture: Distinguishing technical and economic potentials. Glob. Environ. Chang. 2014, 26, 53–62. [Google Scholar] [CrossRef]


| Livestock | Emission Factor | Livestock | Emission Factor | Livestock | Emission Factor |
|---|---|---|---|---|---|
| Buffalo | 55 | Mule | 10 | Sheep | 5 |
| Dairy cow | 61 | Camel | 46 | Goat | 5 |
| Cattle | 47 | Horse | 18 | Pig | 1 |
| Donkey | 10 |
| Livestock | Parameters | Livestock | Parameters | Livestock | Parameters |
|---|---|---|---|---|---|
| Buffalo | 1.3 | Mule | 1 | Pig | 0.3 |
| Dairy cow | 2.6 | Camel | 1.75 | Poultry | 0.01 |
| Horse | 0.8 | Goat | 0.2 | ||
| Donkey | 0.6 | Sheep | 0.25 |
| Province | The Decomposition Results of Three Driving Factors (%) | Province | The Decomposition Results of Three Driving Factors (%) | ||||||
|---|---|---|---|---|---|---|---|---|---|
| ∆AHEE | ∆AHPE | ∆AHES | Total | ∆AHEE | ∆AHPE | ∆AHES | Total | ||
| China | −11.78 | −68.17 | 4.70 | −75.25 | Jiangsu | −0.15 | −1.05 | −0.94 | −2.15 |
| Henan | −2.17 | −6.93 | 1.99 | −7.11 | Heilongjiang | −0.34 | −3.29 | 1.63 | −2.00 |
| Hebei | −0.52 | −4.96 | −0.09 | −5.58 | Qinghai | 0.07 | −1.82 | −0.15 | −1.90 |
| Shandong | −1.25 | −4.62 | 0.32 | −5.55 | Shanxi | −0.29 | −1.25 | −0.01 | −1.55 |
| Sichuan | −0.47 | −5.67 | 0.85 | −5.29 | Jilin | −0.15 | −1.97 | 0.57 | −1.55 |
| Guangxi | −1.17 | −3.40 | −0.23 | −4.81 | Shaanxi | −0.23 | −1.13 | 0.06 | −1.31 |
| Hunan | −0.27 | −2.96 | −1.05 | −4.29 | Gansu | 0.02 | −1.36 | 0.10 | −1.25 |
| Anhui | −1.43 | −2.54 | −0.27 | −4.24 | Chongqing | −0.16 | −0.58 | −0.38 | −1.12 |
| Yunnan | −0.53 | −4.74 | 1.96 | −3.31 | Zhejiang | −0.08 | −0.26 | −0.66 | −1.01 |
| Guangdong | −0.26 | −2.08 | −0.88 | −3.23 | Fujian | −0.44 | −0.03 | −0.54 | −1.01 |
| Hubei | −0.52 | −2.11 | −0.19 | −2.83 | Hainan | −0.30 | −0.72 | 0.43 | −0.59 |
| Guizhou | −0.44 | −2.90 | 0.63 | −2.71 | Shanghai | 0.07 | −0.24 | −0.41 | −0.58 |
| Jiangxi | −0.66 | −1.29 | −0.56 | −2.51 | Liaoning | −0.07 | −0.47 | 0.19 | −0.35 |
| Tibet | 0.10 | −1.90 | −0.53 | −2.33 | Beijing | 0.04 | −0.11 | −0.27 | −0.34 |
| Xinjiang | −0.22 | −3.00 | 0.91 | −2.31 | Ningxia | 0.06 | −0.44 | 0.25 | −0.14 |
| Inner Mongolia | 0.02 | −4.14 | 1.86 | −2.26 | Tianjin | −0.02 | −0.20 | 0.16 | −0.06 |
© 2018 by the authors. Licensee MDPI, Basel, Switzerland. This article is an open access article distributed under the terms and conditions of the Creative Commons Attribution (CC BY) license (http://creativecommons.org/licenses/by/4.0/).
Share and Cite
Cai, T.; Yang, D.; Zhang, X.; Xia, F.; Wu, R. Study on the Vertical Linkage of Greenhouse Gas Emission Intensity Change of the Animal Husbandry Sector between China and Its Provinces. Sustainability 2018, 10, 2492. https://doi.org/10.3390/su10072492
Cai T, Yang D, Zhang X, Xia F, Wu R. Study on the Vertical Linkage of Greenhouse Gas Emission Intensity Change of the Animal Husbandry Sector between China and Its Provinces. Sustainability. 2018; 10(7):2492. https://doi.org/10.3390/su10072492
Chicago/Turabian StyleCai, Tianyi, Degang Yang, Xinhuan Zhang, Fuqiang Xia, and Rongwei Wu. 2018. "Study on the Vertical Linkage of Greenhouse Gas Emission Intensity Change of the Animal Husbandry Sector between China and Its Provinces" Sustainability 10, no. 7: 2492. https://doi.org/10.3390/su10072492