Article

Combining High Yields and Blast Resistance in Rice (Oryza spp.): A Screening under Upland and Lowland Conditions in Benin

1
Department of Plants and Crops, Faculty of Bioscience Engineering, Ghent University, Valentin Vaerwyckweg 1, 9000 Ghent, Belgium
2
Faculté des Sciences et Techniques de Dassa, Laboratoire de Biotechnologie, Ressources Génétiques et Amélioration des Espèces Animales et Végétales (BIORAVE), Université d’Abomey, Cotonou, Benin
3
AfricaRice Center, 01 B.P. 2031, Cotonou, Benin
4
Faculty of Tropical AgriSciences, Czech University of Life Sciences Prague, Kamycka 129, 165 00 Prague 6–Suchdol, Czech Republic
*
Author to whom correspondence should be addressed.
Sustainability 2018, 10(7), 2500; https://doi.org/10.3390/su10072500
Submission received: 16 June 2018 / Revised: 10 July 2018 / Accepted: 11 July 2018 / Published: 17 July 2018
(This article belongs to the Special Issue Sustainable Crop Production Systems)

Abstract

:
The future security of the supply of rice for food in Africa depends on improving the level of local production to achieve self-sufficiency. In order to cope with the existing gap between production and actual demand, combining a high level of rice blast tolerance and a high-yield potential is necessary. The current study was conducted under upland and lowland conditions in Benin to gain insight into the performance of selected blast-resistant accessions along with some currently grown varieties. This study revealed a high phenotypic variability among these accessions. Furthermore, differences in the performance of these accessions under lowland and upland conditions were observed. Principal component analysis showed their grouping in three clusters. The analysis also demonstrated a high yield potential among the blast-resistant rice accessions whether they were Oryza sativa or O. glaberrima. Furthermore, there was a significant correlation between yield and both spikelet fertility and growth cycle duration. In conclusion, the present study identified promising rice accessions for future breeding. High phenotypic variability in combination with interesting traits can help to develop new resilient varieties. Finally, when the traits correlate with yield, they can be used as markers for an early screening method for identifying promising accessions at an early stage.

1. Introduction

Rice (Oryza spp.) is the most cultivated cereal crop after wheat, and a primary food consumed by millions of people worldwide. Rice provides the bulk of calories and a number of micronutrients (iron, zinc and ß-carotene) for many people in African developing countries [1]. Africa has an abundant supply of natural resources that can support a huge expansion in food, specifically rice production [2]. Indeed, rice can be grown under diverse environments e.g., dryland, rainfed wetland, deepwater and mangrove swamps, and irrigated wetland [2,3]. Africa harvests annually more than 12,503,331 ha of rice to feed many low-income households with limited access to food [4]. However, annual rice production only covers 62% of the actual needs, whereas the demand is growing faster than for any other staple food on the continent [5,6]. To meet the future rice demands, yield increase per unit of land is seen as a key component to achieve self-sufficiency. Improvements in resource management and farm mechanization are also essential for achieving this goal. The conventional selection method of elite rice cultivars for use in breeding hybrids that have better stress tolerance is also an option for increasing production. In addition, the introduction of biotechnology in the development of new breeding methodologies using DNA-based markers facilitates further yield improvement [7].
In Africa, there are two major cultivated rice species, Oryza sativa (L.) and O. glaberrima (Steud.). Knowledge of the phenotypic variability of these two major rice species has potential for germplasm management, conservation and use. A major step in rice breeding was the creation of improved hybrids, based on the most promising germplasm. A prime example of such a hybrid is “NEw RIce for AfriCA” (NERICA), which is derived from crosses between O. sativa and O. glaberrima, both well adapted to African rice-growing environments [8,9,10,11,12]. Their rapid adoption by small-scale rice farmers has significantly contributed to strengthening food security and improved livelihoods in most Sub-Saharan African countries [13,14,15,16,17]. Wang et al. (2015) have recently investigated the relationship between rice blast resistance and plant height, heading date and seed weight [18]. For this purpose, blast disease reactions of rice plants from a core collection were evaluated along with its yield-related components under greenhouse and field conditions. Results showed that shorter plants were more resistant to blast disease. It was found that the rice blast resistance gene Pi-ta was associated with lighter seed weight, whereas the susceptible allele of RM171 and RM6544 were associated with heavier seed weight.
Benin is one of Africa’s developing countries where rice demand is constantly increasing. Approximately 48% of the active population earn their income from farming in Benin, notably from rice cultivation [19]. The land area for rice cultivation is estimated at about 82,351 ha with an average production of 281,428 tons [20] and farmers mainly practice rainfed and irrigated lowland production systems [21,22]. However, rice supply is not increasing fast enough to keep up with significant demands of the rapidly growing population. This obliges Benin to annually import a little less than 400,000 tons of milled rice, corresponding to about 25% of actual needs to meet rice consumption in the country [23]. Benin is thus far from self-sufficient in rice production. Therefore, production has to increase to cope with the needs of the population. Major constraints impair Beninese rice production and sustainability, e.g., climate change, depleted soils and poor mechanization. But, also the lack of well-adapted varieties is a constraint because of abiotic as well as biotic stress that affect production. Participatory field evaluation has been recently conducted by Odjo et al. (2017) [24], reporting that there are very few effective rice varieties coping with biotic and abiotic stressors on farmland. About half of the farmers have ceased cultivation of NERICA varieties to grow other high-yielding varieties which are highly vulnerable to damage by blast disease [25]. Blast disease caused by the fungus Magnaporthe grisea [26] is one of the most widespread and devastating biotic stresses in Benin causing yield reduction of more than 30% [27,28]. The local rice productivity of currently cultivated varieties is hampered dramatically by this disease. It is thus important to continue the search for adaptable and high-yielding varieties to achieve rice self-sufficiency in the country. The 2008 African food crisis led to a high priority being placed upon food insecurity in the continent [29] and pointed out that Africa needs to increase production capacity and reduce rice importation that hampers these efforts. This goal can be achieved if each African country taps into the high rice genetic diversity to introduce a series of high-performing rice varieties suitable for its different ecologies [30].
Regarding the limitation in natural resources (e.g., land, water, labor force, and energy), providing sufficient rice to the growing Beninese population will require the use of locally adapted high-performing varieties. Such varieties with good tolerance to blast disease would be more profitable and marketable worldwide [18]. In order to select new blast-resilient genotypes, field resistance of a set of 350 cultivated rice (Oryza sativa L. and Oryza glaberrima Steud.) accessions has been evaluated. This study has revealed the existence of a large variability in blast resistance [31]. Additionally, a subset of 42 accessions, with variable phenotypes, were designed as a core collection for further evaluation and for future use in breeding programs. Considering the importance of rice production in the country, the present study was undertaken to evaluate the grain production of this selected subset under irrigated upland and lowland field ecologies. This will allow determination of whether these rice accessions have better grain yields than currently cultivated varieties. The study can also provide a wide range of accessions with interesting agronomic characteristics that can form the basis for future breeding programs in Benin. Furthermore, scientific knowledge generated might be ideally used to improve ultimately rice production in Africa.

2. Materials and Methods

2.1. Plant Materials

The germplasm of Oryza spp. included in this study is a subset of 42 rice accessions (5 O. sativa accessions and 37 O. glaberrima) originating from six West African countries (Appendix A Table A1). This subset of rice accessions has been derived from an entire African collection of 350 rice accessions based on geographical origins, pairwise genetic distances (revealed by 77 AFLP markers) and differential reactions to blast disease [31]. Several field blast resistance patterns were observed in this selected germplasm: 26 highly resistant accessions; 9 moderately resistant, 3 moderately susceptible and 4 susceptible.
Seven upland rice (ARICA 4, ARICA 5, CG 14, NERICA 1, NERICA 2, NERICA 4 and Moroberekan) and seven lowland rice (ARICA 1, ARICA 2, ARICA 3, IR 841, NERICAL 14, NERICAL 19 and TOG 5681) accessions which are cultivated by farmers in Benin were included as reference varieties.

2.2. Field Trials for Agronomic Evaluation

Two field experiments were conducted concurrently under upland and lowland conditions in Cotonou (Benin) at AfricaRice’s experimental site during (June 2016–December 2016; 2°21′20 E, 6°26′54 N). Rainfall starts in mid-March and ends (with an average of 1100 to 1200 mm) in early November with a mid-season dry period from mid-July to mid-August.
The experimental design was a randomized complete block design (RCBD) with three replications. Forty-two rice accessions (5 O. sativa and 37 O. glaberrima) and seven controls (ARICA 4, ARICA 5, CG 14, NERICA 1, NERICA 2, NERICA 4 and Moroberekan), serving as reference of cultivated upland rice, were tested. Direct sowing of 121 seeds per accession was done in a plot measuring 2 × 2 m. Planting was done at a spacing of 20 × 20 cm between and within rows.
The lowland field experiment was also performed in a RCBD with three replications. But, only 37 of 42 rice accessions of the subset were tested (because of insufficient seed) along with the seven lowland refence controls (ARICA 1, ARICA 2, ARICA 3, IR 841, NERICAL 14, NERICAL 19 and TOG 5681). Pre-germinated seeds of each accession were transplanted 21 days after sowing into small plots of 1.60 × 1.60 m at a spacing of 20 × 20 cm between and within rows.
A chemical treatment with mancozeb (80 g/15 L) and deltamethrin (Decis®, 40 mL/15 L) was performed to protect the plants for diseases and pests. The plots were weeded regularly to minimize weed infestation. A pre-planting base application of 200 kg ha−1 of NPK (15-15-15) was done followed by a total of 100 kg ha−1 of urea at panicle initiation (35 kg ha−1) and booting stages (65 kg ha−1), respectively.

2.3. Data Collection

The following 15 agronomic traits were evaluated in both field experiments (lowland and upland): total number of tillers (Tillers_Total), number of fertile tillers (Tillers_Fertile), percentage of fertile tillers (%Fertile_Tillers), panicle length (Length_Pan), plant height at maturity (Plant_height), total number of spikelets (Spikelets_TotalNum), number of filled spikelets (Filled_Spikelets), percentage of filled spikelets (%Fertile_Spikelets) number of primary branching (Ram_Iaire), number of secondary branching (Ram_IIaire), ratio secondary branching/primary branching (Ratio_RamIIRamIaire), total number of panicles per square meter (Panicules_Num), number of days to 80% flowering (CSE), number of days to 80% maturity (CSM) and grain yield (Yield). A number of plants in the middle of the inner two rows of each elementary plot were considered for the data collection using the Standard Evaluation System for rice and wild (IRRI, 2007). The list of data collected, and methodology used were presented in Appendix A Table A2. At 80% crop maturity stage, a quadrat of 1 m × 1 m size was measured and all the plants in each quadrate of each plot were harvested to estimate grain production of rice accessions.

2.4. Statistical Analysis

An analysis of variance (ANOVA) was conducted to gain insights into the effect of genotype on several phenotypic traits. Correlations analyses were performed assess the relationship between variables. Principal component analysis (PCA) was used to identify phenotypic traits and use these to identify superior accessions and similarities between accessions. Additionally, principal component regression was adopted to predict the yield based on the linear combinations (PCAs) of the phenotypic traits. A t-test test was performed to compare lowland and upland grain yield characteristics of rice accessions.

3. Results

3.1. Phenotypic Variability for 15 Agronomic Measured Traits

The results of the ANOVA analyses of the 15 agronomic traits evaluated in the lowland and upland ecologies are presented in Table 1. Significant variations in some characteristics were observed between replications for lowland conditions (total number of tillers, number of fertile tillers, plant height at maturity and spikelet fertility) and upland conditions (spikelet fertility). Accessions performances in the lowland significantly differed from the upland for seven traits (Table 2). The data for the percentage of fertile tillers, total number of spikelets, spikelet fertility, panicle secondary branching, days to 80% heading, days to 80% maturity, and grain yield were the major discriminants between lowland and upland ecologies. A correlation matrix (Table 3) was constructed with lowland data, showing that the number of days to 80% flowering was positively and significantly associated with the number of days to 80% maturity (R = 0.94, P = 0.0001) but, negatively associated with spikelet fertility. The total number of spikelets was positively correlated with secondary branching (R = 0.61, P = 0.004). In upland conditions, a positive association was found between grain yield and spikelet fertility (R = 0.57, P = 0.0001) and both were significantly negatively correlated with the number of days to 80% flowering and maturity. Moreover, the secondary branching had a positive correlation with the total number of spikelets (R = 0.69, P = 0.0001) (Table 3).

3.2. Performance Evaluation of 42 Rice Accessions and 7 Reference Varieties for Yield and Yield Components in Upland Conditions

To reduce data dimensions for a better description of the relationships between accessions, PCA was performed using prior seven identified traits that contributed most to the phenotypic variation. The first two principal components explained 68.82% of phenotypic variability within the 42 rice accessions and 7 reference varieties. The trait contribution revealed by both principal components is presented in Table 4. PCA 1 showed a positive association with yield (0.42) and the spikelet fertility (0.47) whereas the number of days to 80% flowering (−0.53) and the number of days to 80% maturity (−0.52) were negatively linked with PC 1.
Panicle secondary branching (0.69) and total number of spikelets (0.69) were positively correlated with PCA 2. A two-dimensional scatter plot involving all the 42 rice accessions and the 7 controls is presented in Figure 1. Three accessions groups were clearly separated with reference to PCA 1 and PCA 2. Cluster 1 included 13 rice accessions (4 O. sativa and 9 O. glaberrima) and all 7 reference controls except CG 14. Cluster 2 included only 8 rice accessions: WAB0015772 (O. sativa), and 7 O. glaberrima accessions (WAB0024116, WAB0002145, WAB0032394, WAB0002093, WAB0024105, WAB0032487 and WAB0032230). Cluster 3 was composed of 21 O. glaberrima rice accessions and the reference control CG 14. The majority of the accessions in cluster 1 were characterized by a short growing cycle and had high grain yields, whereas accessions in cluster 2 were low-yielding and had a long cycle duration. Furthermore, accessions in cluster 1 were characterized by a higher spikelet fertility, total number of spikelets, and secondary panicle branching compared to accessions in cluster 2. Accessions in cluster 3 showed intermediate agronomic performance. Accessions in cluster 2, WAB0032230, WAB0002093, WAB0032394 and WAB0015772 were particularly of a very long growth cycle (146, 151, 170 and 172 days to 80% maturity) and low grain yield (50.62, 98.18, 51.06 and 257.30 t/ha), respectively. Three highly resistant O. glaberrima accessions, namely WAB0002143 and WAB0029182 from cluster 1 and WAB0029194 (cluster 3) out-yielded all the seven reference controls with yields of 540, 573, and 603 t/ha, respectively. Two highly resistant O. sativa accessions, namely WAB0035059 and WAB0035038 from cluster 1 out-yielded all the seven reference controls used in the upland with yields of 669 and 717 t/ha, respectively.

3.3. Performance Evaluation of 37 Rice Accessions and 7 Reference Varieties for Yield and Yield Components in Lowland Conditions

A similar PCA analysis was conducted to examine the relationship between rice accessions in lowland ecology. The number of days to 80% heading, and days to 80% maturity were positively correlated with PCA 1 (0.63), whereas a significant negative correlation was found with spikelet fertility (−0.40). The total number of spikelets (0.62) and panicle secondary branching (0.70) were positively correlated with PCA 2, whereas grain yield (−0.58) and percentage of fertile tillers (−0.74) were negatively correlated with PCA 3 (Table 4).
The total of 37 rice accessions and 7 reference controls was split into three main clusters relatively to the two first principal components (Figure 2). The two principal components (PCA 1 and PCA 2) accounted for 57.64% of the total variation among studied germplasm. The first group, cluster 1 included 7 rice accessions (6 O. glaberrima and 1 O. sativa) and 4 reference controls (ARICA 2, ARICA 3, NERICAL 19 and IR 841). Cluster 2 included 21 rice accessions (three O. sativa and 18 O. glaberrima) and two reference controls (NERICAL 14 and TOG 5681), whereas cluster 3 was composed of 9 O. glaberrima rice accessions and the reference control ARICA 1. Most of rice accessions in cluster 1 produced the highest total number of spikelets and panicle secondary branching, whereas higher spikelet fertility was found in cluster 2. The majority of rice accessions in cluster 3 had a long duration for the number of days to 80% flowering and 80% maturity. Four highly resistant rice accessions to blast, namely WAB0035055 (O. sativa), WAB0019882, WAB0008956, and WAB0015043 (O. glaberrima) out-yielded all the reference controls (569.18, 567.78, 698.90 and 600.05 t/ha, respectively). One highly susceptible O. glaberrima accession (WAB0029342) out-yielded all the reference controls (the modern rice: ARICA 1, ARIC 2, ARICA 3, NERICAL 14, NERICAL 19, the O. sativa IR841 and the O. glaberrima TOG 5681) with a grain yield performance of 644.95 t/ha. Among these, the three O. glaberrima rice accessions (WAB0008956, WAB0029342 and WAB0015043) performed better than all the ones from O. sativa species. A number of eight rice accessions, including WAB0029182 (highly resistant) and WAB0030263 (highly susceptible), matured earlier than all the controls used (less than 108 days). Accession WAB0030263 was found to be the earliest maturating rice of all (94 days).

3.4. Grain Yield Performance of the Rice Accessions in Lowland and Upland Agro-Ecology

Grain yield scores were used as selection index to rank accessions from the most to the least important. In the upland, WAB0035059 showed the highest index followed by WAB0029194 and WAB0029182, while the lowest indexes were observed for WAB0032394, WAB0002093 and WAB0024105. In the lowland, WAB0008956 and WAB0029342 possessed the highest selection indexes, whereas the lowest values were scored in WAB0002136 and WAB0030263 (Table 5). The blast resistant accession, WAB0035055, possessed selection indexes of 4 and 5 in lowland and upland conditions, respectively and might be recommended for farmers’ cultivation in both ecologies. Nearly high similar indexes were observed in a susceptible accession, WAB0008937, that can be used for rice yield breeding in Benin. Accessions, WAB0030263 versus WAB0006684, WAB0015772 versus WAB0029315 and WAB0029323 versus WAB0026176 showed a comparatively equal performance in both environments (marked as circle in Appendix A Figure A1). Cluster analysis based on the principal components enabled the identification of cluster 1 that comprised of the majority of lowland and upland reference controls included. Accessions in cluster 1 had similar characteristics of the controls used and were found to be promising adapted rice to the lowland or upland growing conditions in Benin. There were no upland controls in cluster 2 suggesting low-yielding rice accessions that were not adapted to an upland environment. An ANOVA analysis with a post-hoc Tukey honest significant difference (HSD) test was performed to compare the grain yield and number of days to maturity observed between lowland and upland. Results are presented in Table 5. On the basis of the ranking scores and the significant differences detected in grain yield and cycle duration, 13 and 6 rice accessions performed better in lowland and upland conditions in Benin, respectively. Nineteen rice accessions were relatively stable in both ecologies and might be suggested for farming in Benin.

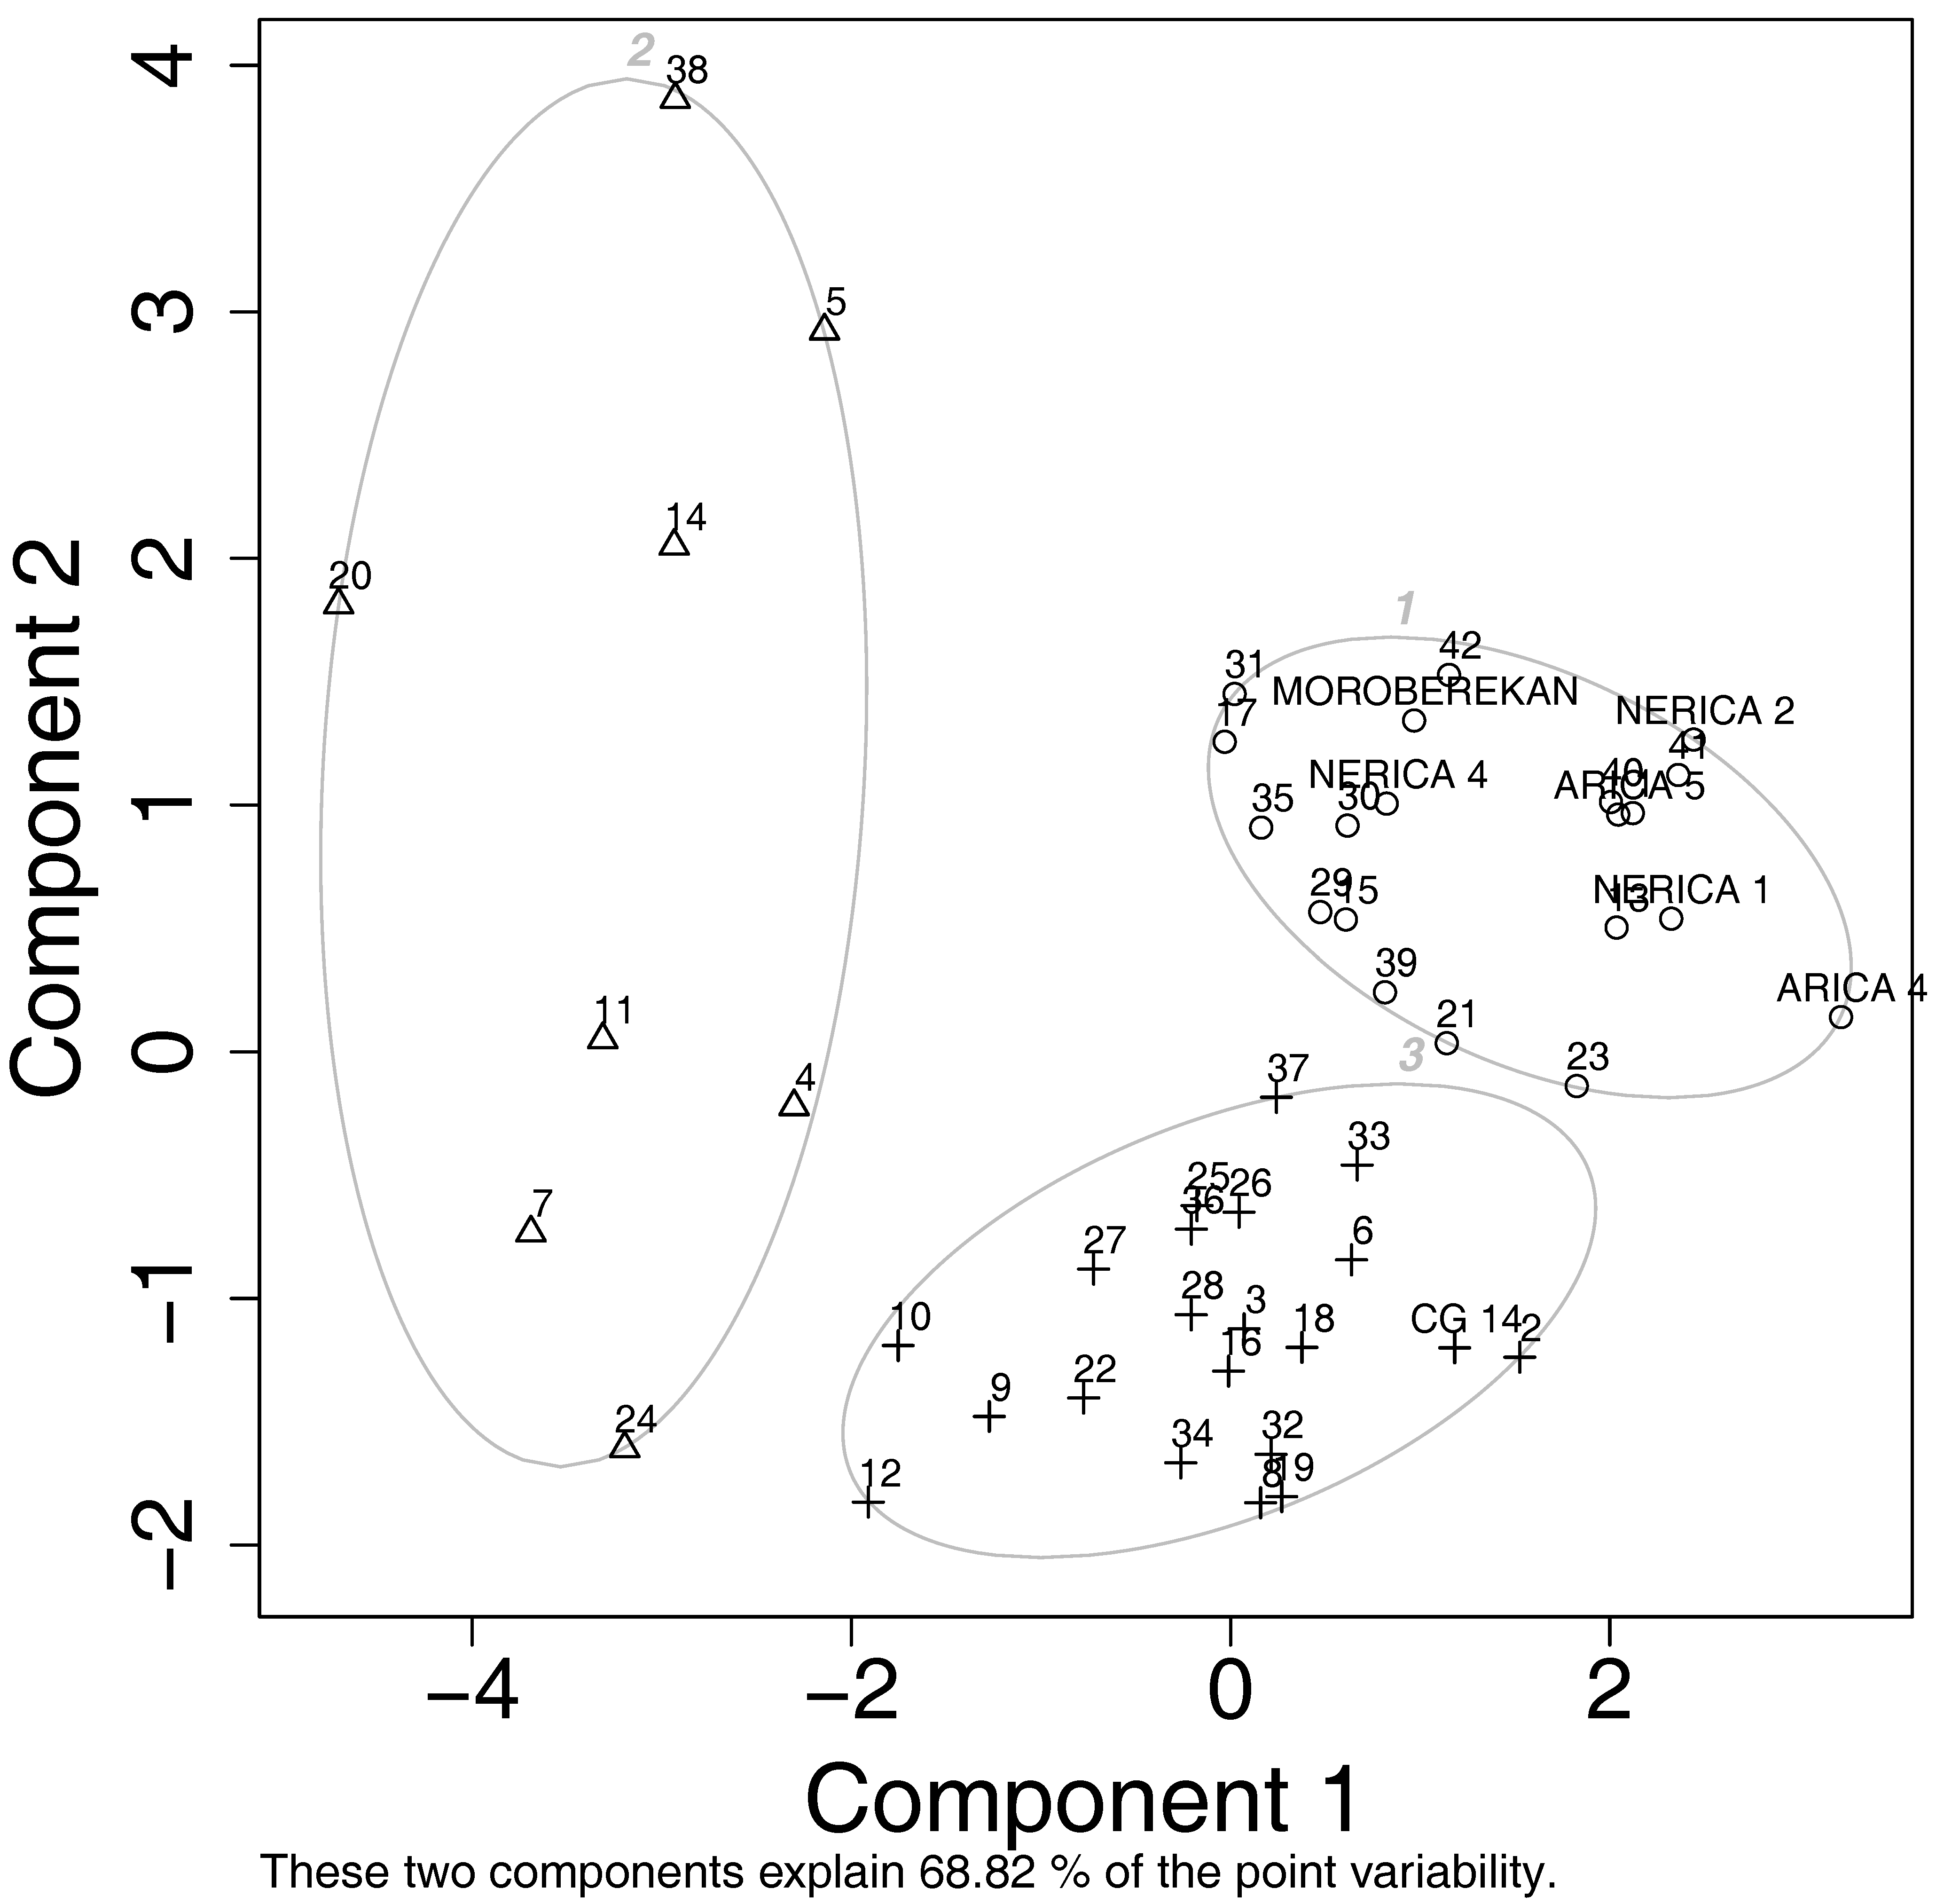
3.5. Relationships of Yield Components with Blast Resistance and Genetic Population Diversity

A correlation analysis was performed to assess the relationship between yield-related traits and blast-resistance patterns. Results revealed that resistant accessions tend to produce a relatively higher number of secondary branching compared to susceptible ones in the lowland (R = 0.52) and the upland (R = 0.44) growing conditions. However, there was no direct association between blast resistance and grain yield in the lowland (R = 0.08) and the upland (R = 0.26) respectively. There was no blast disease incidence because of fungicide application during both field experiments.
The presence of three genetically distinct populations (population 1, population 2 and population 3) was revealed in the current subset germplasm using 20 SSR polymorphic markers [17]. The population genetic structure was significantly correlated with secondary panicle branching (R = 0.67) and primary panicle branching (R = 0.41) of rice accessions in upland growing conditions. Accessions in population 1 produced a significantly higher number of secondary panicle branches than those in population 2 and population 3. Accessions in population 3 produced a significantly higher number of primary panicle branches than those in population 1 and population 2.
In the lowland, we found significant correlations between population genetic structure and the following agronomic traits: total number of tillers (R = 0.41), percentage of fertile tillers (R = 0.45), secondary panicle branching (R = 0.70) and ratio of secondary branching to primary branching (R = 0.73). The majority of accessions in population 2 and population 3 tend to develop a better tiller ability, whereas accessions in population 1 showed a higher number of secondary panicle branching and higher ratio of the secondary branching to primary branching.

4. Discussion

Significant differences were observed between rice accessions for the 15 agronomic traits evaluated under lowland and upland ecologies. This attests to the existence of high genetic variability in the studied rice germplasm [32]. This variability can be exploited for further yield improvement of rice. In fact, the presence of high variable germplasm can help plant breeders to properly select parental lines to use in breeding programs [33].
Furthermore, it was seen that rice accessions responded differently across the three repetitions in the upland for spikelets fertility and in the lowland, for the total number of tillers, number of fertile tillers, plant height and spikelets fertility. Plant height and tillers are in general sensitive to environmental conditions (water level), especially when there is standing water, as experienced during the experiment in the lowland. Although there was no significant difference in grain yield between repetitions, the observed changes in spikelets fertility in both ecologies could be due to bird damage. Rice crop is highly susceptible to bird damage during grain maturation stages (milk to hard-dough stages) [34,35]. The performances of accessions differed significantly for seven agronomic traits between upland and lowland. Both experiments were simultaneously conducted on AfricaRice’s site in similar physico-chemical conditions. This indicates that the significant differences observed between the lowland and the upland might be more attributed to the hydrological conditions [36]. This subset of seven traits identified should thus be given a greater priority for the selection of suitable lowland and upland rice accessions in Benin.
Concerning the relationship between yield and other traits, it was concluded that secondary panicle branching and total number of spikelets were strongly correlated and could have contributed to the grain yield performance of the accessions under lowland conditions. Zhao et al. (2016) have recently identified a SNP locus (G/C) that substantially affects both the total number of spikelets per panicle and the number of primary and secondary branches in some high-yielding japonica rice varieties [37]. According to Ashikari et al. (2005) grain yield is mostly determined by total number of spikelets per panicle [38]. The upland experiment revealed that spikelet fertility and growth cycle duration (the number of days to 80% flowering and 80% maturity) were the most important grain yield contributors. The shorter the cycle duration, the more spikelets were fertile and the higher the grain yield under upland conditions. Mokuwa et al. (2013) have also pointed out a negative relationship between grain yield and number of days to 50% flowering in O. glaberrima and O. sativa accessions [39]. A short rice growing season generally contributes more to stable harvest indexes than a late growing season especially under less favorable conditions [40]. Several authors [39,41,42] have suggested that grain yield and maturity duration are the most important characteristics used by farmers to select varieties. A recent participatory ethnobotanical survey indicated that Beninese farmers give a particular emphasis to high-productive and early-maturing varieties for selecting varieties [24]. Three O. glaberrima rice accessions (WAB0008956, WAB0029342 and WAB0015043) showed a higher grain productivity than O. sativa rice accessions in the lowland. Previous work demonstrated that O. glaberrima is the species mostly adapted to African adverse environmental conditions compared to O. sativa [9,39,43,44,45]. But a significant reduction in grain yield is usually observed in this species due to the grain shattering and susceptibility to lodging [36,45]. The present study demonstrated that some O. glaberrima accessions clustered in cluster 1 (lowland and upland) achieved a good performance for the total number of spikelets and panicle secondary branching, although O. glaberrima is described as generally low compared to that of O. sativa [43].
Long-held assumptions about O. glaberrima agronomic traits need to be reconsidered for a better valorization of this rice species. Better agronomic performance was particularly observed in previously identified blast-resistant rice accessions compared to the varieties currently grown in Benin. This means that in case severe attacks would occur in the field, these accessions would yield better than the commonly used susceptible varieties. In fact, the findings of Yelome et al. (2018) are among the first giving any insight on the resistance/susceptibility of each rice accession across two different environments in Benin. The study clearly demonstrated that rice germplasm exhibiting high blast disease resistance is potentially resistant to all isolates/races of the pathogen prevalent in those two environments [31]. Odjo et al. (2011) reported areas in country where severe blast attacks frequently occur (hotspots) that can be recommended for germplasm evaluation [46]. Higher secondary panicle branching was positively correlated with blast resistance in the lowland (R = 0.27) and the upland (R = 0.19). Association of secondary branching and blast resistance also suggests there are more opportunities for potential rice breeding.
Since blast disease is the most harmful biotic threat to Beninese rice production, the combination of high-yield potential of rice accessions with their resistance to the disease can help minimize yield losses and thus reduce chemical pesticide applications [47,48]. Genetic structure analysis of the 42 selected rice accessions revealed the presence of three genetically distinct populations with a significant level of gene flow between O. sativa and O. glaberrima accessions across the population 1 [49]. Valuable information on the relationship between population structure and agronomic characteristics was highlighted in this paper and can be integrated in breeding for attaining higher yield potentials [50]. It was also shown in this study that nearly all O. glaberrima accessions in population 1 yielded at least 4 tons ha−1 in lowland ecology except WAB0030263. However, WAB0030263 was the most early maturing accession out of the total number of germplasms studied, which is one of the farmers’ preference for rice traits. Gene flow might then strongly contribute to these yield-related traits of the accessions in population 1.

5. Conclusions

This study revealed a high phenotypic variability among the screened rice accessions, which is highly valuable for breeding. The differential performance in upland and lowland conditions for several traits indicates that these traits are substantially influenced by environmental factors. In addition, significant correlations between yield and several phenotypic traits were observed, which are important and can be used as markers for early screening for identifying promising high-yielding varieties. Results of the present study highlight the potential of the identified core selection of the African rice germplasm collection for developing new blast-resilient rice varieties in general and especially for Beninese growing conditions. The genetic relationship between agronomic traits associated with blast resistance and genetic structure shown for these rice accessions will globally help breeders improve rice productivity and especially for Benin. Multi-year trials at multiple locations are required, however, to ensure the performance of the varieties.

Author Contributions

G.H.; P.V.D. and A.D. conceived the idea, obtained funding, and designed the study outline with W.V. and D.S.; O.I.Y. conducted the laboratory and field experiments. O.I.Y. conducted the literature review. O.I.Y., K.A. and S.L. analyzed the data and described the results.

Funding

This research was funded by the Monsanto’s Beachell-Borlaug International Scholars Program (MBBIS) and the Ghent University research funds (BOF).

Acknowledgments

The authors would like to thank technical staff of the Ghent University and the university d’Abomey. Special thanks to the AfricaRice genebank for providing seed and the related information.

Conflicts of Interest

The authors declare that they have no conflict of interest.

Appendix A

Table A1. Information of the subset of 42 African rice accessions tested.
S/NAccessions NumberAccession NameSpecies NameCountry of OriginBlast Resistance Pattern *
1WAB0015772BEN11-126-AO. sativaBeninResistant
2WAB0006684BEN11-45O. sativaBeninResistant
3WAB0035038BEN11-84-AO. sativaBeninResistant
4WAB0035055BEN11-90-AO. sativaBeninResistant
5WAB0035059BEN11-71-AO. sativaBeninResistant
6WAB0029182DION KIVOO. glaberrimaMaliResistant
7WAB0029335ISSABGOO. glaberrimaNigeriaModerately resistant
8WAB0030263MACINA-BO. glaberrimaNigeriaSusceptible
9WAB0023837RAM 100O. glaberrimaMaliResistant
10WAB0024105RAM 131O. glaberrimaMaliResistant
11WAB0024116RAM 154O. glaberrimaMaliResistant
12WAB0029194TIERO OUSSI DIOUBOU KOUNTIO. glaberrimaMaliResistant
13WAB0032487TIOLYO. glaberrimaMaliModerately resistant
14WAB0032298TIRO SI DIOUMDOUO. glaberrimaMaliResistant
15WAB0008589TOG 5380O. glaberrimaNigeriaModerately resistant
16WAB0020477TOG 5392O. glaberrimaNigeriaModerately resistant
17WAB0032397TOG 5439-CO. glaberrimaNigeriaResistant
18WAB0029323TOG 5480O. glaberrimaNigeriaModerately resistant
19WAB0029333TOG 5509O. glaberrimaNigeriaModerately resistant
20WAB0019882TOG 5538O. glaberrimaNigeriaResistant
21WAB0029315TOG 5673O. glaberrimaNigeriaModerately resistant
22WAB0020505TOG 5693O. glaberrimaNigeriaModerately susceptible
23WAB0032497TOG 5786-AO. glaberrimaLiberiaResistant
24WAB0015703TOG 5951O. glaberrimaNigeriaResistant
25WAB0001360TOG 5978O. glaberrimaNigeriaSusceptible
26WAB0029342TOG 6029O. glaberrimaNigeriaSusceptible
27WAB0032230TOG 6142-AO. glaberrimaNigeriaSusceptible
28WAB0008937TOG 6201O. glaberrimaGuineaResistant
29WAB0032848TOG 6228-AO. glaberrimaMaliResistant
30WAB0032550TOG 6804-AO. glaberrimaNigeriaResistant
31WAB0026783TOG 7106O. glaberrimaMaliResistant
32WAB0002093TOG 7183O. glaberrimaMaliModerately resistant
33WAB0002136TOG 7232O. glaberrimaMaliResistant
34WAB0002143TOG 7239O. glaberrimaMaliResistant
35WAB0002145TOG 7243O. glaberrimaMaliModerately susceptible
36WAB0032345TOG 7250-AO. glaberrimaMaliModerately resistant
37WAB0009280TOG 7393O. glaberrimaNigeriaModerately susceptible
38WAB0015043TOS 16746O. glaberrimaIvory CoastResistant
39WAB0026176TOS 6447O. glaberrimaMaliResistant
40WAB0032495TOS 6454-AO. glaberrimaLiberiaResistant
41WAB0008956TOS 6457O. glaberrimaLiberiaResistant
42WAB0032394W 1032O. glaberrimaNigeriaResistant
*: According to Yelome et al. (2018).
Table A2. List of the 15 parameters assessed in the study.
TraitsCodes UsedDescription
Total number of tillers/plantTillers_TotalCounted number of tillers at the maturity stage
Number of fertile tillers/plantTillers_FertileCounted fertile tillers at the maturity stage
Percentage of fertile tillers/plant% Fertile_TillersCalculated in Excel
Panicle lengthLength_PanMeasured from the base of the lowest spikelet to the tip of the latest spikelet on the panicle, excluding awn
Plant height at maturity (cm)Plant_heightMeasured height from the base of the plant to the top of the latest spikelet on the panicle, excluding awn
Total number of spikelets/panicleSpikelets_TotalNumCounted total number of grains in sampled panicles
Number of filled spikelets/panicleFilled_SpikeletsCounted filled grains in sampled panicles
Percentage of filled spikelets% Fertile_Spikelets Calculated in Excel
Number of primary branchingRam_IaireCounted number of primary branches of the panicle
Number of secondary branchingRam_IIaireCounted number of secondary branches of the panicle
Ratio secondary branching/primary branchingRatio_RamIIRamIaireCalculated in Excel
Total number of panicles/m2Panicules_NumCounted the number of panicles per square meter
Number of days to 80% flowering Number of days to 80% flowering (CSE)Recorded the number of days from effective seeding to 80% heading
Number of days to 80% maturityNumber of days to 80% maturity (CSM)Recorded the number of days from effective seeding to 80% maturity
Grain yield (g/36 plants)YieldHarvested a square meter (1 m × 1 m) of each plot
Figure A1. Gran yield/plot of 37 rice accessions evaluated under upland and lowland conditions in Benin.
Sustainability 10 02500 g0a1

References

  1. Dipti, S.S.; Bergman, C.; Indrasari, S.D.; Herath, T.; Hall, R.; Lee, H.; Habibi, F.; Bassinello, P.Z.; Gratero, E.; Ferraz, J.; et al. The potential of rice to offer solutions for malnutrition and chronic diseases. Rice 2012, 5, 16. [Google Scholar] [CrossRef] [PubMed] [Green Version]
  2. Balasubramanian, V.; Sie, M.; Hijmmans, R.J.; Otsuka, K. Increasing rice production in sub-Saharan Africa: Challenges and opportunities. Adv. Agron. 2007, 94, 55–133. [Google Scholar]
  3. Seck, P.A.; Diagne, A.; Mohanty, S.; Wopereis, M.C.S. Crops that feed the world 7: Rice. Food Secur. 2012, 4, 7–24. [Google Scholar] [CrossRef]
  4. FAOSTAT. Food and Agriculture Organisation of the United Nations; FAOSTAT Statistics Database: Rome, Italy. Available online: http://faostat3.fao.org/ (accessed on 26 June 2018).
  5. Seck, P.; Touré, A.; Coulibaly, J.; Diagne, A.; Wopereis, M. Africa’s rice economy before and after the 2008 rice crisis. In Realizing Africa’s Rice Promise; CABI: Wallingford, UK, 2013; 138p. [Google Scholar]
  6. OECD/Food and Agriculture Organization of the United Nations. OECD-FAO Agricultural Outlook 2015; OECD Publishing: Paris, France, 2015. [Google Scholar] [CrossRef]
  7. Edgerton, M.D. Increasing Crop Productivity to Meet Global Needs for Feed, Food, and Fuel. Plant Physiol. 2009, 149, 7–13. [Google Scholar] [CrossRef] [PubMed] [Green Version]
  8. Pham, J.L. Evaluation des Ressources génétiques des riz Cultivés en Afrique par Hybridation intra et Interspecifique. Ph.D. Thesis, Université de Paris XI ORSAY, Paris, France, 1992; 236p. [Google Scholar]
  9. Jones, M.P.; Dingkuhn, M.; Aluko, G.K.; Semon, M. Interspecific Oryza Sativa L. X O. Glaberrima Steud. Progenies in upland rice improvement. Euphytica 1997, 92, 237–246. [Google Scholar] [CrossRef]
  10. Futakuchi, K.; Sié, M. Better exploitation of African rice (Oryza glaberrima Steud.) in varietal development for resource-poor farmers in West and Central Africa. Agric. J. 2009, 4, 96–102. [Google Scholar]
  11. Sié, M.; Ogunbayo, S.A.; Dakouo, D.; Sanou, I.; Dembélé, Y.; N’dri, B.; Dramé, K.N.; Sanni, K.A.; Toulou, B.; Glele, R.K. Evaluation of intra and interspecific rice varieties adapted to valley bottom conditions in Burkina Faso. Afr. J. Plant Sci. 2010, 4, 308–318. [Google Scholar]
  12. Thiémélé, D.; Boisnard, A.; Ndjiondjop, M.; Chéron, S.; Séré, Y.; Aké, S.; Ghesquière, A.; Albar, L. Identification of a second major resistance gene to Rice yellow mottle virus, RYMV2, in the African cultivated rice species, O. glaberrima. Theor. Appl. Genet. 2010, 121, 169–179. [Google Scholar] [CrossRef] [PubMed]
  13. Adegbola, P.Y.; Arouna, A.; Diagne, A. Evaluation de l’impact économique des nouvelles variétés de riz NERICA au Bénin: Une évidence avec les modèles basés sur l’approche “contre factuel”. Paper presented at the First Africa Rice Congress, Dar es Salaam, Tanzania, 31 July–4 August 2006. [Google Scholar]
  14. Rodenburg, J.; Diagne, A.; Oikeh, S.; Futakuchi, K.; Kormawa, P.M.; Semon, M.; Akintayo, I.; Cissé, B.; Sié, M.; Narteh, L.T.; et al. Achievements and impact of NERICA on sustainable rice production in sub-Saharan Africa. Int. Rice Comm. Newslett. 2006, 55, 45–58. Available online: https://www.researchgate.net/profile/Jonne_Rodenburg/publication/313078439_Achievements_and_impact_of_NERICA_on_sustainable_rice_production_in_subSaharan_Africa/links/58b04e0d45851503be97dbbc/Achievements-and-impact-of-NERICA-on-sustainable-rice-production-in-sub-Saharan-Africa.pdf (accessed on 1 July 2018).
  15. Kijima, Y.; Otsuka, K.; Sserunkuuma, D. ‘Assessing the impact of NERICA on income and poverty in central and western Uganda’. Agric. Econ. 2008, 38, 327–337. [Google Scholar] [CrossRef]
  16. Nguezet, P.M.D.; Diagne, A.; Okoruwa, V.O.; Ojehomon, V. Impact of improved rice technology on income and poverty among rice farming household in nigeria: A local average treatment effect (late) approach. Q. J. Int. Agric. 2011, 50, 267–291. [Google Scholar]
  17. Dibba, L.; Zeller, M.; Diagne, A. The impact of new Rice for Africa (NERICA) adoption on household food security and health in the Gambia. Food Secur. 2017, 9, 929–944. [Google Scholar] [CrossRef]
  18. Wang, X.; Jia, M.H.; Ghai, P.; Lee, F.N.; Jia, Y. Genome-wide association of rice blast disease resistance ad yield-related components of rice. MPMI 2015, 28, 1383–1392. [Google Scholar] [CrossRef] [PubMed]
  19. MAEP: Ministere de L’Agriculture, de l’Elevage et de la Peche. Stratégie Nationale Pour le Développement de la Riziculture au Bénin; MAEP: Cotonou, Benin, 2010; 26p, Available online: http://extwprlegs1.fao.org/docs/pdf/ben149179.pdf (accessed on 5 May 2018).
  20. FAOSTAT: Food and Agriculture Organisation of the United Nations. FAOSTAT Statistics Database: Rome, Italy. Available online: http://faostat.fao.org/ (accessed on 2 June 2018).
  21. Adégbola, P.Y.; Singbo, A.G. Impact de L’importation du riz sur la Compétitivité et la Rentabilité de la Production Nationale au Bénin. Communication à L’atelier Régional de L’ADRAO sur le Thème: Politique et Stratégies Pour la Promotion de la Production Rizicole et la Sécurité Alimentaire en Afrique. November 2005. Available online: http://www.brmnbenin.org/base/docs_de_rech/Impact_de_l_importation_du_riz_sur_la_competitivite_et_la_rentabilite_de_la_production_nationale_au_Benin_Adegbola_Benin.pdf (accessed on 2 June 2018).
  22. Diagne, A.; Amovin-Assagba, E.; Koichi, F.; Wopereis, M.C.S. Estimation of cultivated area; number of farming households and yield for major rice-growing environments in Africa. In Realizing Africa’s Rice Promise; Wopereis, M.C.S., Johnson, D.E., Ahmadi, N., Tollens, E., Jalloh, A., Eds.; CAB International: Boston, MA, USA, 2013; pp. 35–45. [Google Scholar]
  23. FAOSTAT Food and Agriculture Organisation of the United Nations. GIEWS—Global Information and Early Warning System; FAOSTAT Statistics Database: Rome, Italy, 2018; Available online: http://www.fao.org/giews/countrybrief/country.jsp?code=BEN (accessed on 16 May 2018).
  24. Odjo, T.C.; Dossou-Aminon, I.; Dansi, A.; Djengue, W. Diversity, Genetic Erosion and Participatory Evaluation of Rice (Oryza sativa L. and Oryza glaberrima Steud.) Varieties in Benin. Int. J. Curr. Res. Biosci. Plant Biol. 2017, 4, 147–164. [Google Scholar] [CrossRef]
  25. Yokouchi, T.; Saito, K. Why did farmers stop cultivating NERICA upland rice varieties in central Benin? Int. J. Agric. Sustain. 2017, 15, 724–734. [Google Scholar] [CrossRef]
  26. Couch, B.C.; Kohn, L.M. A multilocus gene genealogy concordant with host preference indicates segregation of a new species, Magnaporthe oryzae, from M. grisea. Mycologia 2002, 94, 683–693. [Google Scholar] [CrossRef] [PubMed]
  27. Afouda, L.; Gnikpo, S.; Sere, Y.; Gumedzoe, Y. Prevalence des principales maladies sur des variétes de riz cultivees dans le departement de l’alibori au Nord-Benin. J. de la Recherche Scientifique de l’Universite de Lome 2007, 9, 1027–1988. [Google Scholar]
  28. Vodouhe, S.R.; Ojegui, M.; Amadji, F. Impact of blast on rice cultivation in People’s Republic of Benin. In Proceedings of the Symposium on Rice Resistance to Blast, Montpellier, France, 18–21 March 1981; Service de Pathologie Végétale: Montpellier, France, 1981; pp. 27–33. [Google Scholar]
  29. AfricaRice. Lessons from the Rice Crisis: Policies for Food Security in Africa; Africa Rice Center: Cotonou, Benin, 2011. [Google Scholar]
  30. Norman, J.C.; Kebe, B. African Smallholder Farmers: Rice Production and Sustainable Livelihoods; International Rice Commission Newsletter (FAO): Accra, Ghana, 2006. [Google Scholar]
  31. Yelome, O.I.; Audenaert, K.; Landschoot, S.; Dansi, A.; Vanhove, W.; Silue, D.; Van Damme, P.; Haesaert, G. Exploring genetic diversity and disease response of cultivated rice accessions against Pyricularia oryzae under rainfed upland conditions in Benin. Genet. Resour. Crop Evol. 2018, 65, 1615–1624. [Google Scholar] [CrossRef]
  32. Ogunbayo, S.A.; Sie, M.; Odjo, D.K.; Sanni, K.A.; Akinwale, M.G.; Toulou, B.; Shittu, A.; Idehen, E.O.; Popoola, A.R.; Daniel, I.O.; et al. Genetic variation and heritability of yield and related traits in promising rice genotypes (Oryza sativa). J. Plant Breed. Crop Sci. 2014, 6, 153–159. [Google Scholar]
  33. Acquaah, G. Principles of Plant Genetics and Breeding; Blackwell Publishing: Oxford, UK, 2007. [Google Scholar]
  34. Ruelle, P.; Bruggers, R.L. Traditional approaches for protecting cereal crops from birds in Africa. In Vertebrate Pest Conference Proceedings Collection, Proceedings of the Tenth Vertebrate Pest Conference, Monterey, CA, USA, 23–25 February 1982; Marsh, R.E., Ed.; University of California: Nebraska, CA, USA, 1982; pp. 80–86. Available online: https://digitalcommons.unl.edu/cgi/viewcontent.cgi?article=1036&context=vpc10 (accessed on 2 June 2018).
  35. Tréca, B. Les dégâts d’oiseaux d’eau sur les rizières aménagées du delta central du Niger au Mali. J. D’agriculture Traditionnelle et de Botanique Appliquée 1987, 34, 153–170. [Google Scholar] [CrossRef]
  36. Montcho, D.; Futakuchi, K.; Agbangla, C.; Semon, M.; Dieng, I.; Sie, M. Morphological and phenological response of African rice (Oryza glaberrima Steud.) under different hydrological conditions. Asian J. Plant Sci. 2013, 12, 79–86. [Google Scholar] [CrossRef]
  37. Zhao, M.; Sun, J.; Xiao, Z.; Cheng, F.; Xu, H.; Tang, L.; Chen, W.; Xu, Z.; Xu, Q. Variations in DENSE AND ERECT PANICLE 1 (DEP1) contribute to the diversity of the panicle trait in high-yielding japonica rice varieties in northern China. Breed. Sci. 2016, 66, 599–605. [Google Scholar] [CrossRef] [PubMed] [Green Version]
  38. Ashikari, M.; Sakakibara, H.; Lin, S.; Yamamoto, T.; Takashi, T.; Nishimura, A.; Angeles, E.R.; Qian, Q.; Kitano, H.; Matsuoka, M. Cytokinin oxidase regulates rice grain production. Science 2005, 309, 741–745. [Google Scholar] [CrossRef] [PubMed]
  39. Mokuwa, A.; Nuijten, E.; Okry, F.; Teeken, B.; Maat, H.; Richards, P.; Struik, P.C. Robustness and Strategies of Adaptation among Farmer Varieties of African Rice (Oryza glaberrima) and Asian Rice (Oryza sativa) across West Africa. PLoS ONE 2013, 8, e34801. [Google Scholar] [CrossRef] [PubMed]
  40. Lafitte, R.; Torres, R.; Chen, J. Managing drought tress in aerobic (Oryza sativa) rice systems. Philos. J. Crop Sci. 2003, 18, 21. [Google Scholar]
  41. Laborte, A.G.; Paguirigan, N.C.; Moya, P.F.; Nelson, A.; Sparks, A.H.; Gregorio, G.B. Farmers’ Preference for Rice Traits: Insights from Farm Surveys in Central Luzon, Philippines, 1966–2012. PLoS ONE 2015, 10, e0136562. [Google Scholar] [CrossRef] [PubMed]
  42. Richards, P. Coping with Hunger: Hazard and Experiment in an African Rice-Farming System; Allen and Unwin: London, UK, 1986. [Google Scholar]
  43. Sarla, N.; Swamy, B.P.M. Oryza glaberrima: A source for the improvement of Oryza sativa. Curr. Sci. 2005, 89, 955–963. [Google Scholar]
  44. Ndjiondjop, M.N.; Seck, P.A.; Lorieux, M.; Futakuchi, K.; Yao, K.N.; Djedatin, G.; Sow, M.E.; Bocco, R.; Cisse, F.; Fatondji, B. Effect of drought on Oryza glaberrima rice accessions and Oryza glaberrima derived-lines. Asian J. Agric. Res. 2012, 6, 144–157. [Google Scholar] [CrossRef]
  45. Linares, O.F. African rice (Oryza glaberrima): History and future potential. Proc. Natl. Acad. Sci. USA 2002, 99, 16360–16365. [Google Scholar] [CrossRef] [PubMed]
  46. Odjo, T.; Ahohuendo, B.C.; Onasanya, A.; Akator, K.; Séré, Y. Analysis of Magnaporthe oryzae population structure in Benin. Afr. J. Agric. Res. 2011, 6, 6183–6188. [Google Scholar] [CrossRef]
  47. Zhu, M.; Wang, L.; Pan, Q. Identification and characterization of a new blast resistance gene located on rice chromosome 1 through linkage and differential analyses. Phytopathology 2004, 94, 515–519. [Google Scholar] [CrossRef] [PubMed]
  48. Roy-Chowdhury, M.; Jia, Y.; Jackson, A.; Jia, M.H.; Fjellstrom, R.; Cartwright, R.D. Analysis of rice blast resistance gene Pi-z in rice germplasm using pathogenicity assays and DNA markers. Euphytica 2012, 184, 35–47. [Google Scholar] [CrossRef]
  49. Yelome, O.I.; Audenaert, K.; Landschoot, S.; Dansi, A.; Vanhove, W.; Silue, D.; Van Damme, P.; Haesaert, G. Analysis of population structure and genetic diversity reveals gene flow and geographic patterns in cultivated rice (Oryza. sativa & O. glaberrima) in West Africa. Euphytica 2018. submitted. [Google Scholar]
  50. Sie, M.; Sanni, K.; Futakuchi, K.; Manneh, B.; Mande, S.; Vodouhe, R.; Dogbe, S.; Drame, K.; Ogunbayo, A.; Ndjiondjop, M.; et al. Towards a rational use of African rice (Oryza glaberrima Steud.) for breeding in Sub-Saharan Africa. Genes Gen. Genom. 2012, 6, 1–7. [Google Scholar]
Figure 1. Results of principal component analysis (PCA) of data obtained on the seven agronomic traits measured on the 49 rice accessions tested in upland conditions.
Sustainability 10 02500 g001
Figure 2. Results of principal component analysis of data obtained on the seven agronomic traits measured on the 44 rice accessions tested in lowland conditions.
Sustainability 10 02500 g002
Table 1. Mean sum of squares for the effect of “Accession (Access.)”, “Replication (Rep.) and the residuals (Error) for the 15 agronomic traits for the experiments under lowland and upland conditions. ***, ** or * indicate a significant effect of accession and/or replication on a certain trait at a significance level of α = 0.001, α = 0.01 and α = 0.05, respectively.
TraitLowlandUpland
Access.
(df = 48)
Rep.
(df = 2)
Error
(df = 96)
Access
(df = 44)
Rep.
(df = 2)
Error
(df = 88)
Tillers_Total19 ***9.99 *2.8435 ***4.921.85
Tillers_Fertile19 ***9.65 *2.9834 ***3.592.29
%Fertile_Tillers36.45 ***33.9117.0446.194.9333.20
Length_Pan37 ***31.3116.5317 ***1.481.22
Plant_Height444 ***419.70 ***44.39238 ***5.1421.20
Spikelets_TotalNum2180 ***313.1233.82368 ***17.4385.67
Filled_Spikelets1804 ***93.39248.772110 ***262.20143.5
%Fertile_Spikelets49.96 ***77.71 *16.69355.37 ***246.43 **37.45
Ram_Iaire18 ***8.724.858 ***0.150.70
Ram_IIaire197 ***4.8816.38184 ***9.648.15
Ratio_RamIIRamIaire1.88 ***0.140.191.69 ***0.050.05
Panicules_Num34,223 ***8434334831,117 ***503.12141.7
FLW440 ***36.3312.161150 ***9.649.77
MAT475 ***36.1812.20961 ***3.1113.48
Yield42,975 ***16,73011,96262,184 ***81415963
Tillers_Total = Total number of tillers; Tillers_Fertile = Number of fertile tillers; %Fertile_Tillers = Percentage of fertile tillers; Length_Pan = Panicle length; Plant_Height = Plant height at maturity; Spikelets_TotalNum = Total number of spikelets; Filled_Spikelets = Number of filled spikelets; %Fertile_Spikelets = Spikelet fertility; Ram_Iaire = Number of primary branching; Ram_IIaire = Number of secondary branching; Ratio_RamIIRamIaire = Ratio secondary branching/primary branching; FLW = Number of days to 80% flowering; MAT = Number of days to 80% maturity; Yield = Grain yield per square meter.
Table 2. Descriptive statistics (minimum value (Min.), maximum (Max.) value and standard deviation (Std.)) of rice traits under lowland and upland conditions, together with the p-values indicating significance of differences between upland and lowland conditions for a certain trait. p-values marked with ***, ** and * indicate significant differences at α = 0.001, α = 0.01 and α = 0.05, respectively.
TraitLowlandUplandp-Value
Min.Max.Std.Min.Max.SD
Tillers_Total5202.893213.560.4125
Tillers_Fertile5202.883213.560.8075
%Fertile_Tillers61.45100.004.8660.98100.005.970.001 **
Long_Pan15694.8518302.520.8641
Plant_Height7613413.46821359.600.5462
Spikelets_TotalNumber5418529.576219328.900.0001 ***
Filled_Spikelets5117227.513516328.140.1483
%Fertile_Spikelets 72.2198.655.3429.4298.8212.030.0000 ***
Ram_Iaire4293.026161.750.1866
Ram_IIaire1398.702408.130.0039 **
Ratio_RamIIRamIaire0.023.350.860.163.200.770.0518
Panicules_Num105714117.16114590107.910.9754
FLW7513612.636415619.740.0071 **
MAT9415513.108617318.030.0208 *
Yield96783158.0131869159.920.0002 ***
Tillers_Total = Total number of tillers; Tillers_Fertile = Number of fertile tillers; %Fertile_Tillers = Percentage of fertile tillers; Length_Pan = Panicle length; Plant_Height = Plant height at maturity; Spikelets_TotalNum = Total number of spikelets; Filled_Spikelets = Number of filled spikelets; %Fertile_Spikelets = Spikelet fertility; Ram_Iaire = Number of primary branching; Ram_IIaire = Number of secondary branching; Ratio_RamIIRamIaire = Ratio secondary branching/primary branching; FLW = Number of days to 80% flowering; MAT = Number of days to 80% maturity; Yield = Grain yield per square meter.
Table 3. Associations of different yield contributing traits and their direct effect on yield.
Traits%Fertile_TillersSpikelets_TotalNumber%Fertile SpikeletsRam_IIaireFLWMATYield
%Fertile_Tillers 0.01−0.17−0.040.210.19−0.27
Spikelets_TotalNumber0.03 −0.090.69 *0.01−0.010.09
%Fertile Spikelets0.12−0.12 −0.03−0.70 *−0.690.57 *
Ram_IIaire−0.160.61 *−0.17 −0.15−0.100.27
FLW0.160.17−0.41 *−0.23 0.96 *−0.52 *
MAT0.10.12−0.44 *−0.220.94 * −0.49 *
Yield0.170.080.060.24−0.05−0.03
* = Significant at 0.001; correlation estimates in the upland appear above the diagonal and correlation estimates in the lowland appear below the diagonal; %Fertile_Tillers = Percentage of fertile tillers; Spikelets_TotalNum = Total number of spikelets; %Fertile_Spikelets = Spikelet fertility; Ram_IIaire = Number of secondary branching; FLW = Number of days to 80% flowering; MAT = Number of days to 80% maturity; Yield = Grain yield per square meter.
Table 4. Principal component analysis to show the traits correlation across upland and lowland growing conditions.
EcologyUplandLowland
TraitsPCA 1PCA 2PCA 1PCA 2PCA 3
%Fertile_Tillers−0.20 −0.11−0.74 *
Spikelets_TotalNumber 0.69 *0.110.62 *−0.07
%Fertile Spikelets0.47 *0.17−0.40 *−0.22−0.32
Ram_IIaire0.130.69 *−0.130.70 *0.06
FLW−0.53 * 0.63 * −0.08
MAT−0.52 * 0.63 * −0.04
Yield0.42 *0.11 0.26−0.58 *
* = Significant correlation; %Fertile tillers = Percentage of fertile tillers; Spikelets_TotalNum = Total number of spikelets; %Fertile_Spikelets = Spikelet fertility; Ram_IIaire = Number of secondary branching; FLW = Number of days to 80% flowering; MAT = Number of days to 80% maturity; Yield = Grain yield per square meter.
Table 5. Ranking scores, grain yield per square meter and number of days to 80% maturity (MAT) for relative ecological determination among studied rice accessions.
UplandLowland
AccessionsSpeciesGrain YieldMATRankGrain YieldMATRankPresumed Ecology
WAB0015772SATIVA257.35 a*172.33 a30489.26 b140 b14Lowland
WAB0006684SATIVA319.56 a95.33 a25168.46 a99 b35Upland
WAB0035055SATIVA494.39 a126 a5569.18 a107.67 b4BOTH
WAB0035059SATIVA669.49 a124.67 a1498.34 b107.67 b12Upland
WAB0029182GLA573.59 a117.33 a3510.32 a108 b11BOTH
WAB0029335GLA338.57 a132.67 a21474.73 a118.67 b16BOTH
WAB0030263GLA327.22 a103 a23168.28 a94 b36Upland
WAB0023837GLA395.73 a134.67 a13555.75 a125.67 b6BOTH
WAB0024105GLA100.09 a140 a35358.15 b145 a27Lowland
WAB0024116GLA322.16 a157 a24421.12 a135 b25Lowland
WAB0029194GLA603.35 a129.67 a2476.51 a128.33 a15BOTH
WAB0032487GLA190.69 a168.33 a33258.56 a151.67 b34Lowland
WAB0032298GLA371.9 a132 a17343.35 a126 a29BOTH
WAB0008589GLA409.93 a123.67 a12471.15 a117.33 b18BOTH
WAB0020477GLA425.17 a127.33 a9295.3 a120.67 b32Upland
WAB0029323GLA363.39 a137.67 a19427.34 a127.33 a24BOTH
WAB0019882GLA212.5 a135.33 a32567.78 b127 b5Lowland
WAB0029315GLA259.95 a131.33 a29493.8 b122 a13Lowland
WAB0020505GLA269.31 a133.33 a26430.31 a135.67 a21BOTH
WAB0032497GLA469.19 a129.67 a8446.11 a129 a20BOTH
WAB0015703GLA374.68 a115 a16526.31 b112.67 a8Lowland
WAB0001360GLA411.85 a131 a10427.65 a124 b23BOTH
WAB0029342GLA365.09 a132 a18644.95 b135 a2Lowland
WAB0008937GLA491.98 a123.67 a6536.48 a107.67 b7BOTH
WAB0032848GLA268.96 a138.33 a27260.76 a136 a33BOTH
WAB0032550GLA220.5 a125 a31318.77 a120 a31BOTH
WAB0002093GLA98.18 a150.67 a36333 b150 a30Lowland
WAB0002136GLA103.2 a147.33 a34155.56 a143 b37BOTH
WAB0002143GLA540.5 a112.67 a4358.03 b111.33 a28Upland
WAB0002145GLA263.51 a147.33 a28454.26 a140 b19Lowland
WAB0032345GLA333.42 a125.67 a22512.78 a117.33 b9BOTH
WAB0009280GLA348.65 a122.67 a20510.61 b126.5 a10Lowland
WAB0015043GLA410.95 a126.33 a11600.05 a127 a3BOTH
WAB0026176GLA375.64 a125.33 a15429.71 a120.67 a22BOTH
WAB0032495GLA389.67 a127.33 a14413.82 a125.67 a26BOTH
WAB0008956GLA469.41 a132 a7698.9 b124 b1Lowland
WAB0032394GLA51.07 a169.67 a37471.73 b143 b17Lowland
WAB0035038SATIVA717.18134.67----Upland
WAB0029333GLA238.42125.33-----
WAB0032230GLA50.63146-----
WAB0032397GLA346.98129.67-----
WAB0026783GLA270.22152.33-----
MAT = Number of days to 80% maturity; GLA = Oryza glaberrima; SATIVA = O. sativa; BOTH = can be grown in both upland and lowland conditions *: accessions with the same letter are not significantly different.

