Article

Assessment of Circular Economy within Portuguese Organizations

by
Luis Miguel Fonseca
1,*,
José Pedro Domingues
1,2,
Maria Teresa Pereira
1,
Florinda Figueiredo Martins
1 and
Dominik Zimon
3
1
ISEP—P. Porto, School of Engineering and CIDEM R&D, 4249-015 Porto, Portugal
2
Department of Production and Systems, University of Minho, 4710-057 Braga, Portugal
3
Department of Management Systems and Logistics, Rzeszow University of Technology, al. Powstańców Warszawy, 35-959 Rzeszow, Poland
*
Author to whom correspondence should be addressed.
Sustainability 2018, 10(7), 2521; https://doi.org/10.3390/su10072521
Submission received: 15 June 2018 / Revised: 10 July 2018 / Accepted: 13 July 2018 / Published: 19 July 2018

Abstract

:
The move towards a new Circular Economy (CE) economic model has been advocated and supported in Portugal, however, there is limited research on this topic. To address this gap, a quantitative research based on an online survey was carried out among 99 Portuguese organizations, encompassing a wide range of sectors and sizes. The results show that CE is regarded as a strategic and relevant issue for profitability and value creation. Furthermore, the perception that it requires the adoption of new business models in addition to the classical “reduce, reuse and recycle” approach is growing. Moreover, based on the hypotheses raised, results suggest that the level of CE adoption is positively impacted by the status of the EMS (Environmental Management System) certification and the willingness to improve the environmental performance and achieve a sustainable business model. However, CE activities are still relatively modest and a friendlier context (fiscal, legal, organizational, etc.) and the stronger support from supply chain agents and consumers are required. Future research should focus on how to design and shape the transition from a linear to a CE economy and to ascertain if the positive attitude towards CE is materialized in changing the way business is done.

1. Introduction

The need to deal with a range of global issues, such as environmental protection, health improvement and fight against poverty lead the United Nations to propose a set of 17 Sustainable Development Goals that should be addressed by adopting an integrative and indivisible approach to balance the economic, social and environmental dimensions of sustainable development [1]. The world resources are finite and the economic development is generating, on a global scale, increasing consumption levels, contributing to resource scarcity and increased waste generation.
The Circular Economy (CE) economic system aims to conciliate economic and environmental performance, by adopting an innovative approach to address the relationship between business and the environment. Through the implementation of closed loops and regenerative and restorative physical and economic cycles and the combination of maintenance, repair, reusing, refurbishment, remanufacturing and recycling processes, CE aims at leveraging the overall sustainable production and consumption [2,3,4].
The prevailing linear traditional economic model “take-make-consume-disposal” or “extract-produce-use-dump material and energy flow” take for granted that resources are infinite, which is a sustainability problem since it raises economic, environmental and social concerns, as it depletes the resources and pollutes the environment. The resource scarcity fosters higher price value and volatility, which impacts negatively on value creation and capture. Moreover, consumer preferences are changing towards more environmentally friendly products and new sharing versus ownership models emerge [2,3,4].
On the other hand, the CE approach is based on the concept of improved resources management by using by-products and wastage from processes and consumers as a direct or indirect source of inputs for other processes, minimizing resource scarcity and overexploitation [2,3,4]. CE enhances firms’ competitiveness and mitigates risks, without endangering the environment and causing resources scarcity, contributing to a sustainable and enduring economic growth while creating tangible and intangible benefits for companies and their stakeholders [5]. CE is supported by a wide range of scientific areas such as environmental science, process engineering, biology, ecology, sociology, management, economics, territorial and urban planning, regulations [5,6,7,8] and its application covers diverse activity sectors [9].
However, there are several barriers to overcome aiming at a successful adoption of CE, such as the lack of a clear business case, administrative burdens to switch to a circular economy business model, poor support from the supply chain, lack of technical and technological knowledge, shortcomings of the company environmental culture, absence of information and lack of proper government and legislative support [10]. Rizos et al. [10] based on a literature review and on case studies conducted among SMEs concluded that albeit the existence of policies and measures to leverage CE in Europe, several significant barriers remain and additional European and national policies are needed. Winas et al. [11] identified the lack of information exchange, inadequate materials flow and transportation and lack of regulation, incentive(s) and infrastructure required for resource exchange as constraints precluding the success of CE activities. Moreover, the research has focused more on the practical and technical levels of physical flows of materials and energy in production-consumption systems and less on the values, societal structures and cultures that can successfully foster CE [12].
A considerable number of countries and regions, such as the European Union (EU), Germany, the United States, China and Japan developed their own CE plans. The EU considers CE as a primary goal for research and innovation policies at the firm level [13,14] but some tensions and shortcomings related to CE adoption need to be overcome, such as, the implication of increased consumers and organizations responsibility and awareness and the adoption of new consumption patterns, compatible with CE concepts and approaches [8].
Portugal, being a member state of the EU, has an action plan to promote CE [11,15] and research studies report that Portuguese consumers claim to be supportive of CE [16]. However, there is a lack of research concerning the motivations, the knowledge, the adoption and the suggestions to promote CE within Portuguese companies. According to the Portuguese Central Bank (Banco de Portugal), the national public debt is about 130% of GDP (Gross Domestic Product) and the exports account for nearly 80% of imports [17]. The CE concept is applied in Portugal for waste management mainly [11,18] albeit the existence of a few business models that apply reuse concepts (e.g., cork industry). CE may aid Portugal to improve its GDP and reduce the trade deficit, by being less dependent on raw material imports to produce goods while minimizing the risks of price volatility or political instability. It can also lead to job creation in areas such as reuse, repair, remanufacture of products and minimize the negative impacts on the environment of the economic activity and the societal lifestyles.
As previously mentioned, there is a lack of awareness concerning CE among Portuguese companies and this study aims to address this gap, by conducting a quantitative research based on an online survey carried out throughout the first two weeks of May 2018, among 99 Portuguese organizations. The remaining paper is organized as follows: Section 2 is devoted to the literature review and to the identification of the main strategies, motivations, barriers and actions to promote CE. Section 3 describes the research method adopted. The research findings are reported in Section 4. Section 5 proceeds with a systematic discussion of the results. Section 6 provides a brief conclusion of this investigation highlighting its theoretical and practical implications, as well as the shortcomings and potential future research paths.

2. Literature Review

Since authors such as Boulding envisaged in 1996 a “spaceman economy” that would operate by reproducing the initial limited stock of inputs and recycling waste outputs [19], the concept of CE has evolved and a considerable number of scholars, academics, practitioners and policy-makers currently concurs on the need to move towards a new economic model whereby materials and energy from discarded products do not leave the economic system [2,20]. CE is expected to foster the adoption of alternative flow model economic systems (cyclical and regenerative) and positively impact on both the environment and on the economic growth [3,21,22,23,24]. CE entails a new business model based on the close-loops of reuse and refurbishment that can deliver a higher economic and environmental value than those models solely based on recycling and energy recovery [22].
CE is framed on the principles of the 3Rs (reduce, reuse, recycle), the 6Rs (reuse, recycle, redesign, remanufacture, reduce, recover) and the 9Rs (refuse, reduce, reuse, repair, refurbish, remanufacture, repurpose, recycle, recover). Some of the CE definitions are summarized in Table 1. The mainstream research stresses that through the adoption of a CE approach organizations may attain benefits addressing simultaneously and holistically the economic, environmental and social dimensions of Sustainable Development:
  • The increase in recycling and the more efficient resources and renewable energies utilization, resulting in fewer emissions, optimized resources utilization and the minimization of the negative environmental impacts on the global ecosystem [22]);
  • An improvement of business competitive position [25] and social positive outcomes (e.g., jobs creation [26,27]) by maintaining the highest value of materials and products with increased remanufacturing, refurbishment and re-use of products and components in addition to product life extension, product as service, sharing models and change in consumption patterns;
  • In addition to cost savings and value maximization, CE minimizes the risks of the scarcity of virgin materials and price variations which a demand-driven price volatility in raw material markets entails [28].
Masi et al. [24], based on a systematic literature review identified three major clusters of CE definitions, namely “CE as a new label for an existing concept,” “CE as a prescriptive set of existing concepts and practices” and “new definitions that integrate economic, environmental, and social considerations” [24]. These authors, while acknowledging the absence of a comprehensive CE definition, proposed a set of 4 major goals to map the CE definition as a new economic model based on regenerative and restorative cycles aiming at decoupling economic growth from resource depletion and environmental degradation, increasing the overall system resilience and creating and preserving economic, environmental and social value to maximize human well-being [24].
In that regard, the European Environment Agency (EEA) proposes the following characteristics for the CE (Table 2):
The mainstream literature identifies a set of benefits derived from CE adoption, namely: fewer environmental emissions, decrease in resources consumption [22], privileged business competitive position [24] and the minimization of risks [28].
The characteristics of the organizations, such as the type of business, size, activity sector might influence the motivations, knowledge and applicability of CE. As an example, research on the benefits of Environmental Management Systems (EMS) implementation pointed out that the perceived benefits are dependent on the organization size (bigger organizations more accustomed to alignment with business strategy and performance measurement and smaller ones having more flexibility and less formality) [32].
Jonker et al. [33], based on the results collected throughout research with Dutch companies, concluded that those organizations that adopt CE business models have considerably lower raw materials and energy consumption costs and higher recycling and product reuse and repair rates. Additionally, more innovative organizations and those that adopt collaborative business models evidence higher levels of CE adoption. A study from the Ellen MacArthur Foundation, SUN and the McKinsey Centre for Business and Environment estimates that, due to technological and organizational innovations and productivity growth, CE economy would generate 1.8 trillion total benefits in the mobility, food and the built environment sectors, due to savings in resource costs and externalities, such as health impacts from air pollution [34].
The urge for a transition towards CE has been pushed by a significant number of researchers, business practitioners, politicians and international organizations [3,20]. However, to supersede the linear “source, use and waste” economy by a CE model, an integrated approach that focuses on a long-term system change or transition is required [16]. Several factors have been identified as enablers (or barriers) for the successful implementation of CE. The environmental culture of the organization (its managers and employees) favouring the protection of the environment and the adoption of CE is one major dimension to be considered [35]. The cost/benefit assessment of CE requires a long-term perspective and should consider the business and the processes risks and opportunities. Furthermore, the resistance to change from the existing to a novel business model must be overcome [36].
CE also demands a coherent change in consumer behaviour, governmental policies, business practices and in several subsystems, such as energy, logistics and financial subsystems. It can leverage novel business models and new value and supply chains, impacting several business processes such as, design, supply, production, delivery, usage, disposal, collection, sharing, repair, upgrading and remanufacturing, however, significant changes in infrastructure and supply chain management may be required. Additionally, it should be ensured that CE systems perform better than linear ones, for example, by addressing the potential excessive use of transportation and energy, or unattractive working conditions in areas as product recovery [24]. Life cycle analysis can be a very helpful tool to assess overall social, economic and environmental performance of new/proposed solutions.
Resistance to change may arise due to risk aversion, lack of information and knowledge or inaccurate perceptions. The need for the organizations to deal with the appropriate information concerning the CE knowledge and benefits and assign clear responsibilities for CE, has been highlighted in a study based on a survey conducted among 300 European companies. Many firms were unaware of CE and its meaning, however, when given a straightforward definition of CE, most respondents reported that were already making efforts to recycle and repair and identified waste management as a new business opportunity [37]. Issues such as confidentiality, trust and competition also need to be considered to allow the proper sharing of knowledge and product information along the overall companies’ ecosystem, involving co-creation and partnerships amongst the organization suppliers, customers and consumers, through the product life cycle.
The adopting of a CE business model can be more complex and costly to manage and the environmental practices may increase the administrative workload due to more demanding monitoring and reporting activities (including to various authorities, using different supports) of environmental performance data, requiring the involvement of company experts or external consultants [36,38].
From a stakeholder point of view, the adoption of CE requires a collaboration from all parties across the supply chain and is likely to increase the overall supply chain logistical and governance complexity possibly requiring novel approaches of collaboration with other market players [36,39]. The transition towards a CE economy also asks for a change in consumer behaviour and in many cases, there is not a significant demand for green products [40]. A stronger community involvement, public education concerning CE and proper media coverage are critical to support CE initiatives. Moreover, stakeholders should be aware of CE potential economic, environmental and social benefits and barriers. [11].
The implementation of a CE production/business model entails much more than just decreasing waste through recycling [3]. It demands the reduction of raw materials consumption, the design of environmentally friendly products that may easily be recovered and reused (eco-design), a longer product life proper maintenance, the use of recyclables in products and the recovery of raw materials from waste flows [36]. Thus, CE adoption demands for significant changes and investments to modify the existing linear models in domains such as planning, production and supply chain management [36]. It also implies a shift from material intensive business models to business models based on services and enhancing more collaborative partnerships. In the CE literature, some grading options are proposed (the 9 Rs), starting with “refuse” and ending with “recover energy” [39]:
(1)
Refuse: preventing the use of raw materials;
(2)
Reduce: reducing the use of raw materials;
(3)
Reuse: product reuse (second-hand, sharing of products);
(4)
Repair: maintenance and repair;
(5)
Refurbish: refurbishing a product;
(6)
Remanufacture: creating new products from (parts of) old products;
(7)
Repurpose: product reuse for a different purpose;
(8)
Recycle: processing and reuse of materials; and
(9)
Recover energy: incineration of residual flows.
Since the current legal and financial frameworks are deeply rooted in a linear economic view, institutional and legal barriers need to be overcome aiming at the CE success [38]. Additionally, there are some vested interested that must be considered (e.g., increase materials and product sales) and the need to manage an enlarged ecosystem of diverse stakeholders which will require considerable investments in the short term (e.g., additional competencies and knowledge, new contracts, new product and process designs and new equipment) with long-term paybacks [39]. The access to capital is, therefore, a relevant enabler for the CE successful adoption [36,41]. In addition to stakeholders’ support, the existence of proper government policy instruments (economic and regulatory, such as subsidies and tax incentives), supportive CE laws and regulations [38] and training availability, are also needed to contribute to an integrated top-down and bottom-up approach to foster the successful implementation of CE.

3. Materials and Methods

A quantitative research, supported on a survey held online throughout the first 2 weeks of May 2018, was the research method adopted to understand the level of CE application and the motivations, knowledge and ways of promoting CE, within Portuguese organizations. The survey was designed considering the insights collected from a thorough and extensive CE literature review, namely Ghisellini et al. [5], Rizos et al. [10], Fonseca and Domingues [32], Jonker et al. [33] and Lakatos et al. [42]. The research instrument adopted a similar structure from those instruments reported in previous studies [29,32,33] and it was pre-tested with an academic and a practitioner CE expert. Construct reliability was tested and validated with Cronbach Alpha (greater than 0.7).
The survey structure encompassed 4 major group of questions addressing the following main themes:
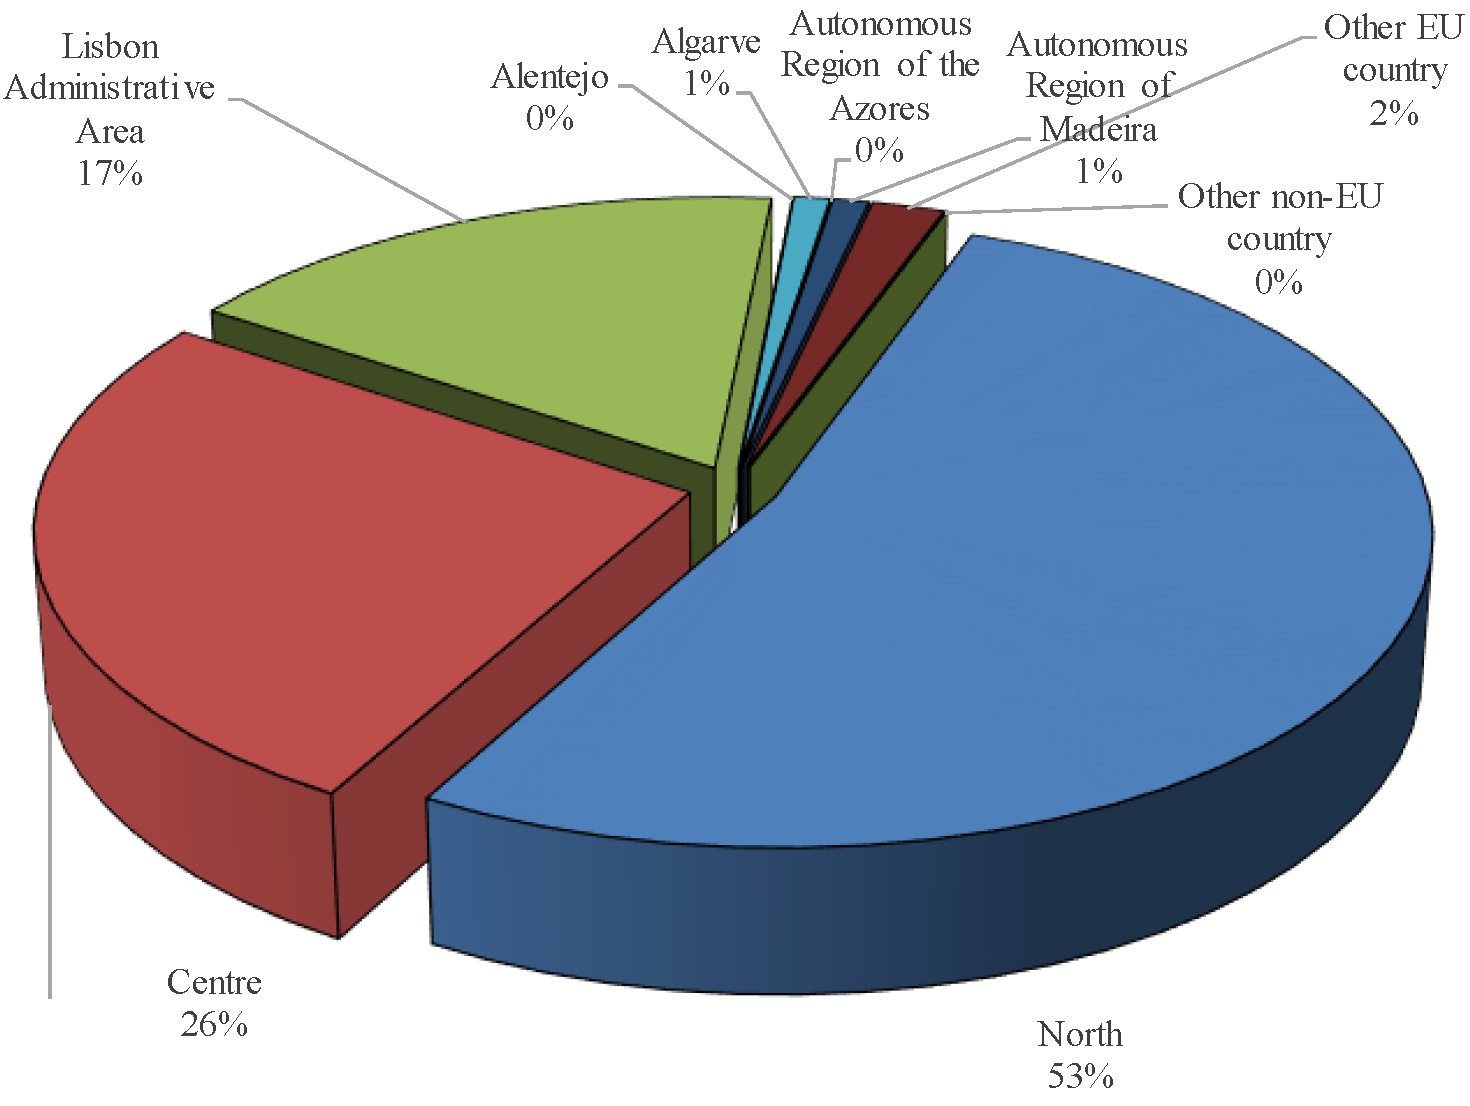
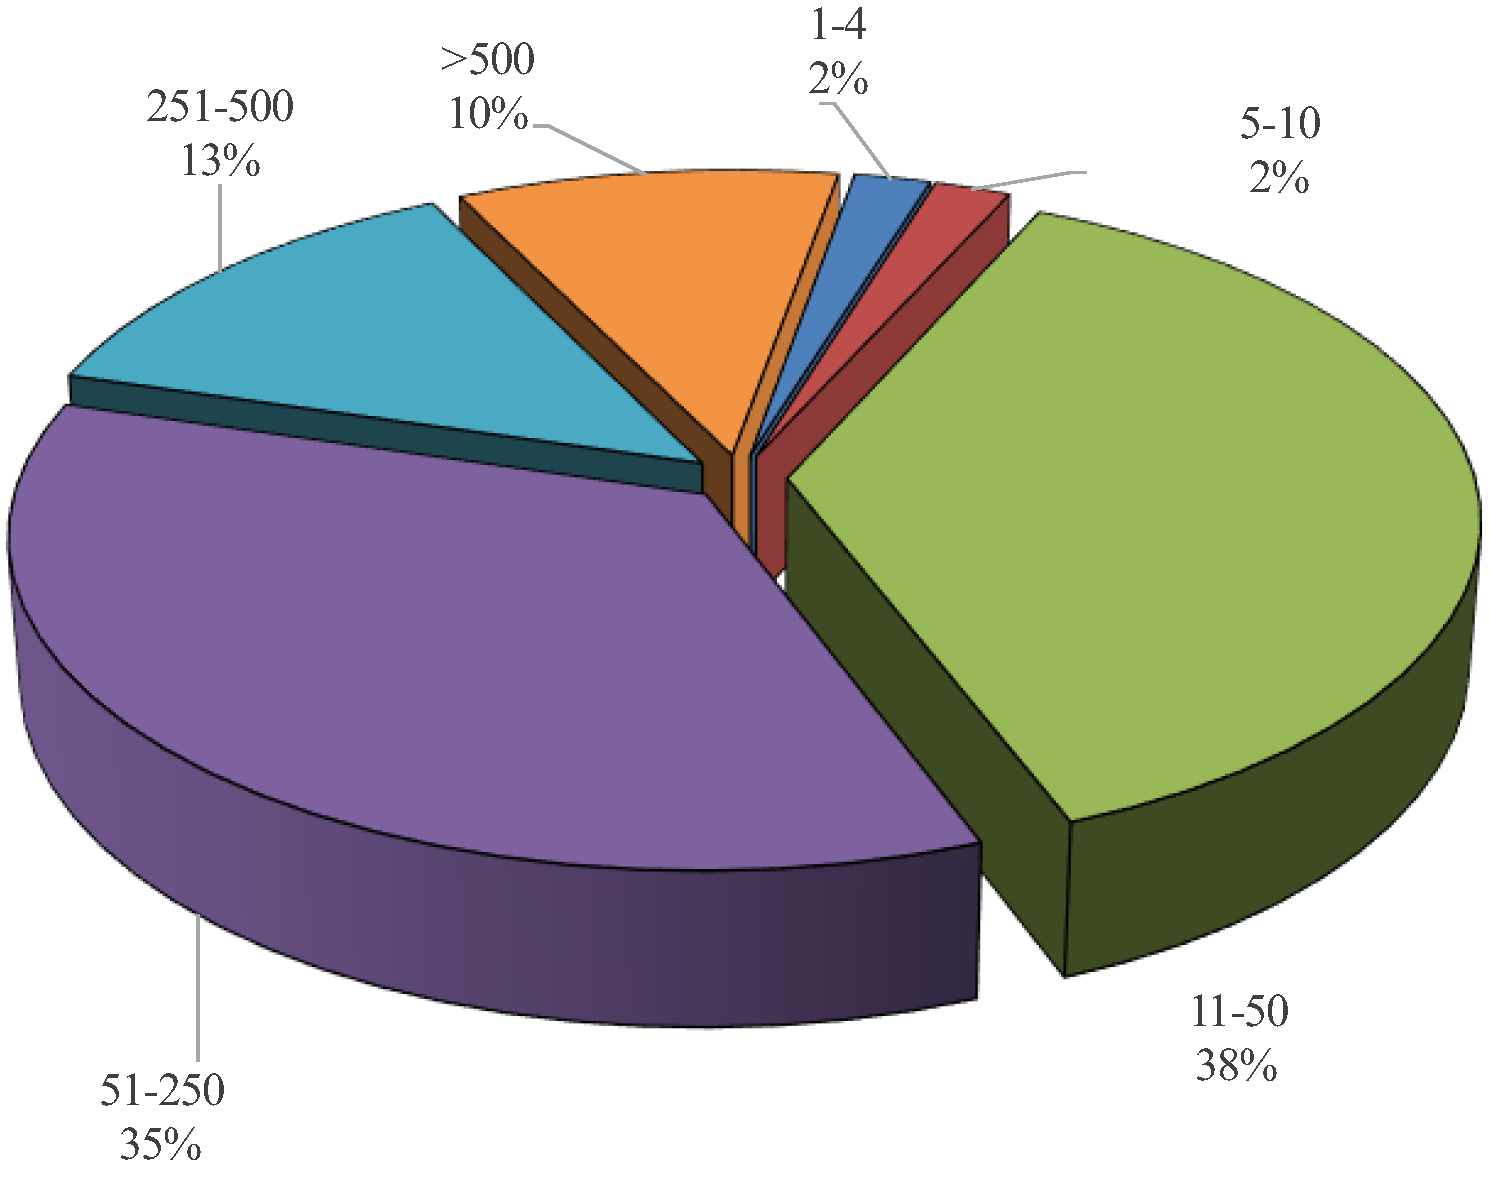
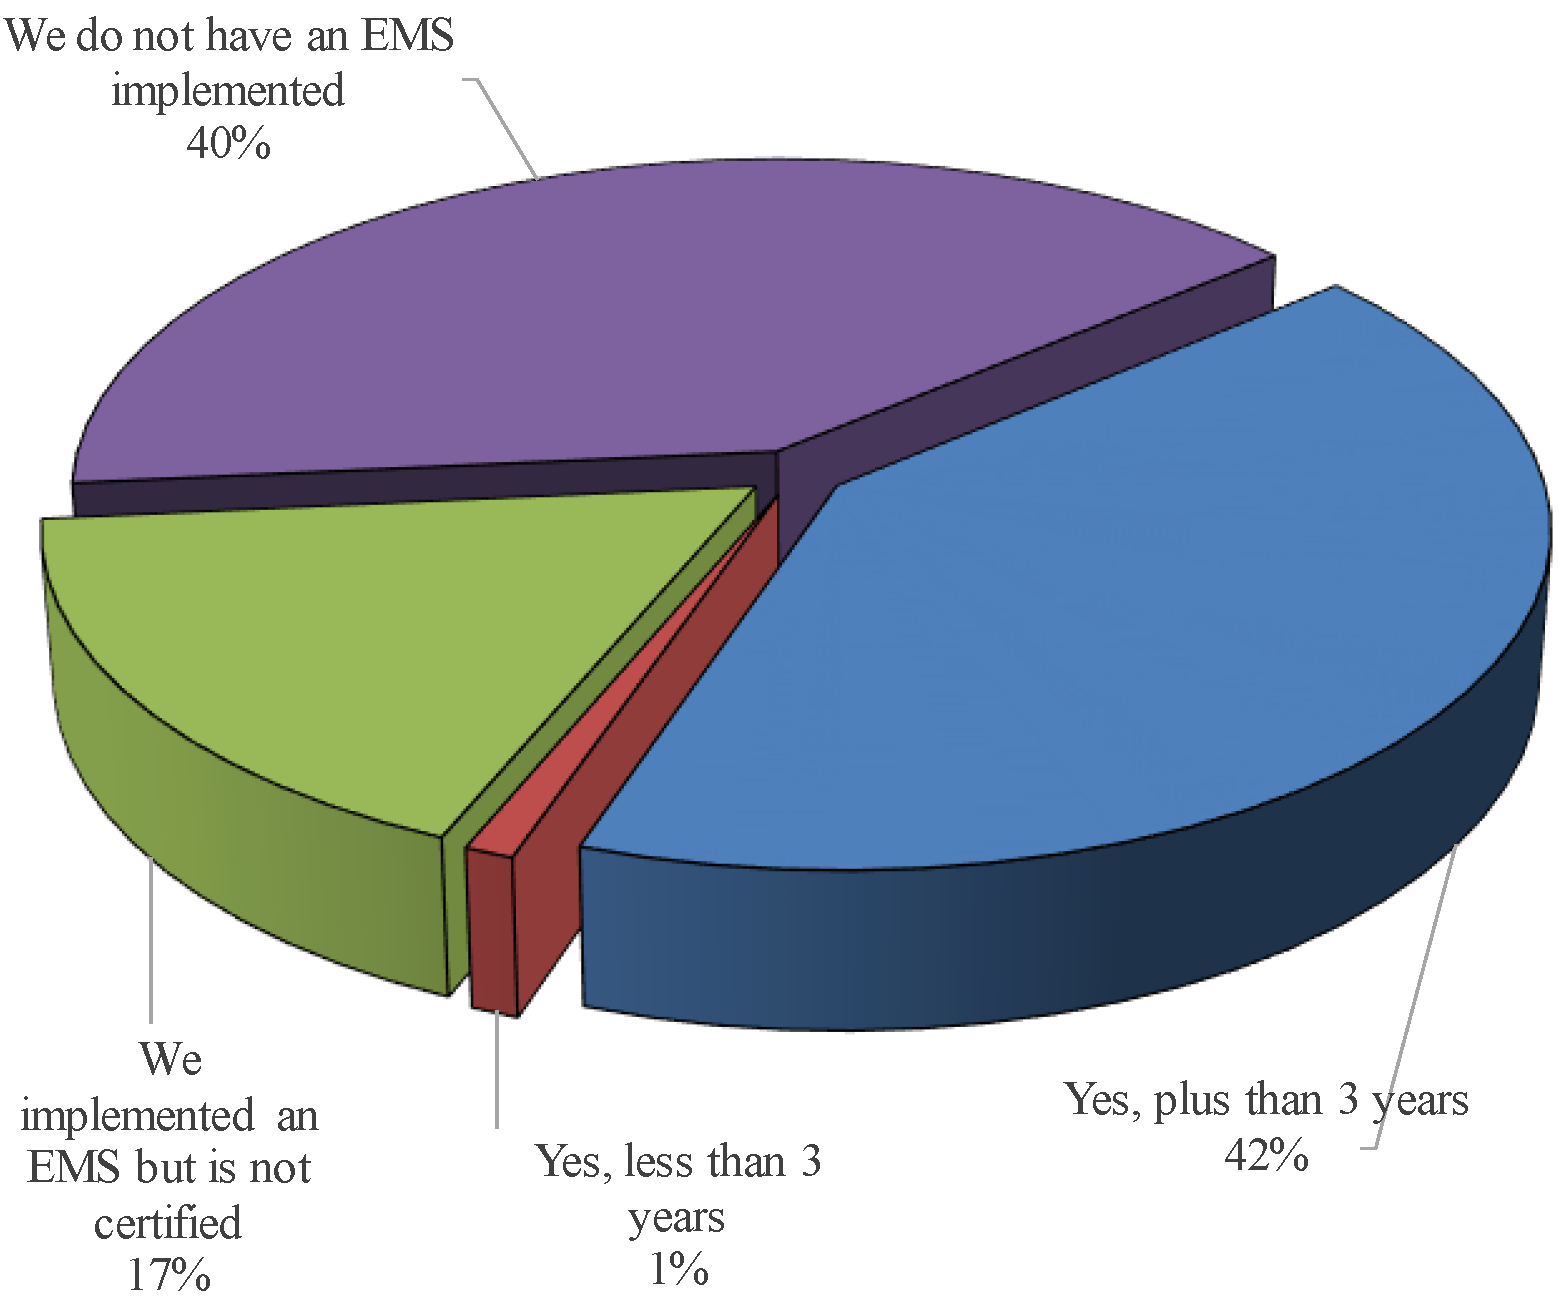
  • Organization characterization: headquarters localization, the market in which the organization operates, activity sector, economic classification code, number of employees and the status of ISO 14001 certification. This section ended with questions to assess with a Likert five-point agreement scale-(1) Never; (2) Rarely; (3) Occasionally/ Sometimes; (4) Most of the times; (5) Always–the level of agreement with the application of 10 possible CE strategies in the organization;
  • Level of motivations for CE (9 items), Level of CE knowledge (5 items) and Level of CE intensity in the organization (7 items); all assessed with a Likert five-point agreement scale–1 (Totally disagree); 2 (Disagree); 3 (Neither agree or disagree); 4 (Agree); (5) Completely agree;
  • Level of CE applicability in the organization (15 items) assessed with a Likert five-point agreement scale–1 (Totally disagree); 2 (Disagree); 3 (Neither agree or disagree); 4 (Agree); (5) Completely agree;
  • Level of agreement with actions to promote CE (10 items) assessed with a Likert five-point agreement scale–1 (Totally disagree); 2 (Disagree); 3 (Neither agree or disagree); 4 (Agree); (5) Completely agree;
  • And lastly the characterization of the respondent organizational role, the number of years involved with the organization and an open question to gather qualitative feedback.
Likert-type scales are often adopted in research and scales using 5 or 7 scale points are the most common [43]. The 5 points scales were adopted to allow comparability with previous research studies on ISO 14001:2015 application [32]. Circa 2000 companies included on a commercial database with the top (export and sales volume) Portuguese commercial entities (and their hierarchies) covering a wide range of sectors were contacted by e-mail. The data were collected anonymously through an automatic online database. The sample comprised a total of 99 organizations and the overall response rate was 5%. The survey results were monitored during the survey period to check for possible non-respondent bias using “wave analysis” [44] and no significant differences were found between early and late respondents. Although these measures aimed to minimize possible bias errors inherent to the survey methodology, it should be acknowledged that such a high non-respondent rate could indicate lack of CE awareness within non-respondents and that the survey results should be consistent with the population of the more CE aware organizations. Nevertheless, this low response rate should be acknowledged as a shortcoming of this study.
The statistical tests and calculations (after ordinal to numerical transformation of the Likert scale type of answers) were performed with IBM Social Sciences Statistical Package (SPSS) v. 22 software. To assess if some variables, measured on an ordinal scale, differed based on other variables (namely those related to the characterization of the company), the following research hypotheses (see Table 3) were raised (based on the results of the literature review and the descriptive statistics) and tested with the non-parametric Kruskal–Wallis one-way analysis of variance statistical test:

4. Results

The results are presented and discussed in this section, starting with the social-demographical characteristics of the sample (Section 4.1), followed by the descriptive statistics (Section 4.2) and ending with presentation and discussion of the statistical tests carried out for the validation of the hypotheses (Section 4.3).

4.1. Social-Demographical Characteristics of the Sample

The survey yielded a total of 99 valid responses (5% response rate) and the more industrialized northern region of Portugal accounted for more than a half of the total responses, with all regions encompassing the sample, as presented in Figure 1.
A great deal of respondent organizations operates in the Business to Business market (82%), followed by Business to Consumer (B2C) with 16%. Consistently with these results, Industry is the main represented activity sector (56%) followed by Services (17%) and Commerce and Construction (both with 6%), with the remaining activity sectors representing the remaining 15%. Concerning the organizations’ size, Small and Medium Enterprises (SMEs) accounted for most of the respondents in accordance with the industrial Portuguese population. The distribution of the organizations (percentage) breakdown by the number of employees is presented in Figure 2.
Relating to the implementation and certification of Environmental Management Systems (ISO 14001) 42% of the respondents hold a certified EMS for more than 3 years, 17% hold an implemented EMS without certification but 40% report not holding an implemented EMS, which is an indicator that there is still considerable work to be done in that regard (Figure 3).
The respondents had considerable experience of the organization, with 84% working there for 10 or more years (Figure 4). Concerning the individual respondents, 23% were Managers/ responsible of the Environment/ Sustainability, followed by 19% CFO (chief financial officer) and 18% CEO/COO (chief executive officer/chief operating officer), which might indicate that the C suite is paying a growing attention to the environment and sustainability (see Figure 5).

4.2. Descriptive Statistics

The surveyed organizations aim to fulfil their customers’ demands in a proactive way, achieving a price/quality compromise and have established collaborative and value-added networks with their partners and customers. They also focus on the efficient usage of energy and the reduction of raw materials and energy, however, the replacement of products by services and the collection and reuse of consumer products is fairly low, as is the case with the development of digital platforms to buy and sell products. Concerning the adoption of water, chemical products and energy closed loops the reported results show an average intensity, with some variation within the respondents.
The overall results for these dimensions are presented in Table 4 and Figure 6.
Concerning the motivations driving organization towards CE adoption, the sampled organizations aim to improve their profitability, environmental performance and environmental value creation. Additionally, they aim to acquire new competencies, access novel markets and consumers and develop a sustainable business model. Results suggest the absence of extensive external pressures to adopt CE and a limited legal and fiscal knowledge concerning CE. The actual application of CE projects in the reported organization is somehow limited. The descriptive statistics for the motivations, the knowledge and the level of application of CE are presented in Table 5 and Figure 7.
The improvement of the productivity and efficiency of the processes and the segregation and valuation of waste are a priority, however, the collection of end-of-life products and the cooperation with suppliers and customers to establish closed loops that maximize the utilization of resources and minimize waste and environmental impacts is not very intense. The results suggest that the reuse of products and parts and the adoption of the life cycle approach are gaining momentum, within the surveyed organization. Table 6 and Figure 8 present the overall descriptive statistics for the application of the CE dimensions.
The respondents consider that tax (fiscal) policy should positively discriminate the organizations that work in the CE, that the Government should take legislative initiatives to support the CE and that Academia should focus on the dissemination and creation of knowledge in the CE. The availability of Government/European Union funding (incentive systems) is also important to finance the CE. One key aspect that is emerging is that the application of the CE “requires the adoption of new business models (based on recycling, reuse, recovery and on eco-design, eco-innovation, the use of “closed” cycles and cooperation throughout the value chain) to be successful”. An increased number of respondents support this view when compared with those that consider the “existing (traditional) business models as sufficient to support CE”. The descriptive statistics for the level of agreement of the actions to support CE are shown in Table 7 and Figure 9.

4.3. Statistical Tests

The Kolmogorov–Smirnov and the Shapiro–Wilk statistical tests were adopted to evaluate the normality of the distribution of the results collected (Table 8) and decide the tests to be carried out for the research questions. The statistical tests show that the results did not have a normal distribution (Sigma ≤ 0.05) and therefore, the Kruskal–Wallis statistical test was adopted to ascertain and validate the statistical hypotheses formulated.
In order to validate the research hypotheses, the following criteria was adopted per dimension:
-
Hypothesis validated (√): at least 2/3 of the items tested validated according to the Kruskal-Wallis test (p-value < 0.05).
-
Hypothesis partially validated: More than 1/3 and less than 2/3 of the items tested validated according to the Kruskal-Wallis test (p-value < 0.05).
-
Hypothesis rejected (⨯): Less than 1/3 of the items tested validated according to the Kruskal-Wallis test (p-value < 0.05).
Table 9 and Table 10 present the results from the Kruskal–Wallis statistical test (Asymptotic Sigma). The results concerning the Dimension 1 (Table 9) suggest that the definition of strategic goals and policies in the organization do not differ according to the market or activity sector in which the organization operates (H1 and H2 rejected). Additionally, based on the statistical test carried out, the results do not statistically differ according to the dimension of the organization (H3 rejected) or according to the organizational role of the respondent (H5 rejected). On the other hand, results suggest that the status and maturity (years) of the EMS certification do impact on the definition of strategic goals and policies in the organization (H4 accepted).
Regarding dimension 2, the level of CE intensity in the organizations seem to be impacted by the willingness of the organizations to improve the environmental performance and create environmental value (H6 accepted), willingness to have a better access to raw materials to prevent its scarcity (H7 accepted), the willingness to have a sustainable business model dimension of the organization (H8 accepted) and the agreement that CE is an integral part of the organizational business model (H9 accepted). On the other hand, the agreement that to apply the CE, it is enough to be supported by the existing business models, reinforcing the reduction of consumption and energy, recycling and recovery (H10) and the agreement that the application of the CE requires the adoption of new business models (based on recycling, reuse, recovery and on eco-design, eco-innovation, the use of “closed” cycles and cooperation along the value chain) to be successful (H11) seem not to impact on the CE intensity in organizations (H10 and H11 rejected).
Table 11 summarizes the validation of the several research hypotheses raised and pertinent to this research.

5. Discussion

This study has enabled us to map the motivations and potential actions to promote CE and the actual level of its application within a sample of 99 Portuguese organizations, from a wide range of activity sectors and with diverse sizes. Although the low response rate collected in a single country advises using some caution to generalize the results, several interesting conclusions can be highlighted.
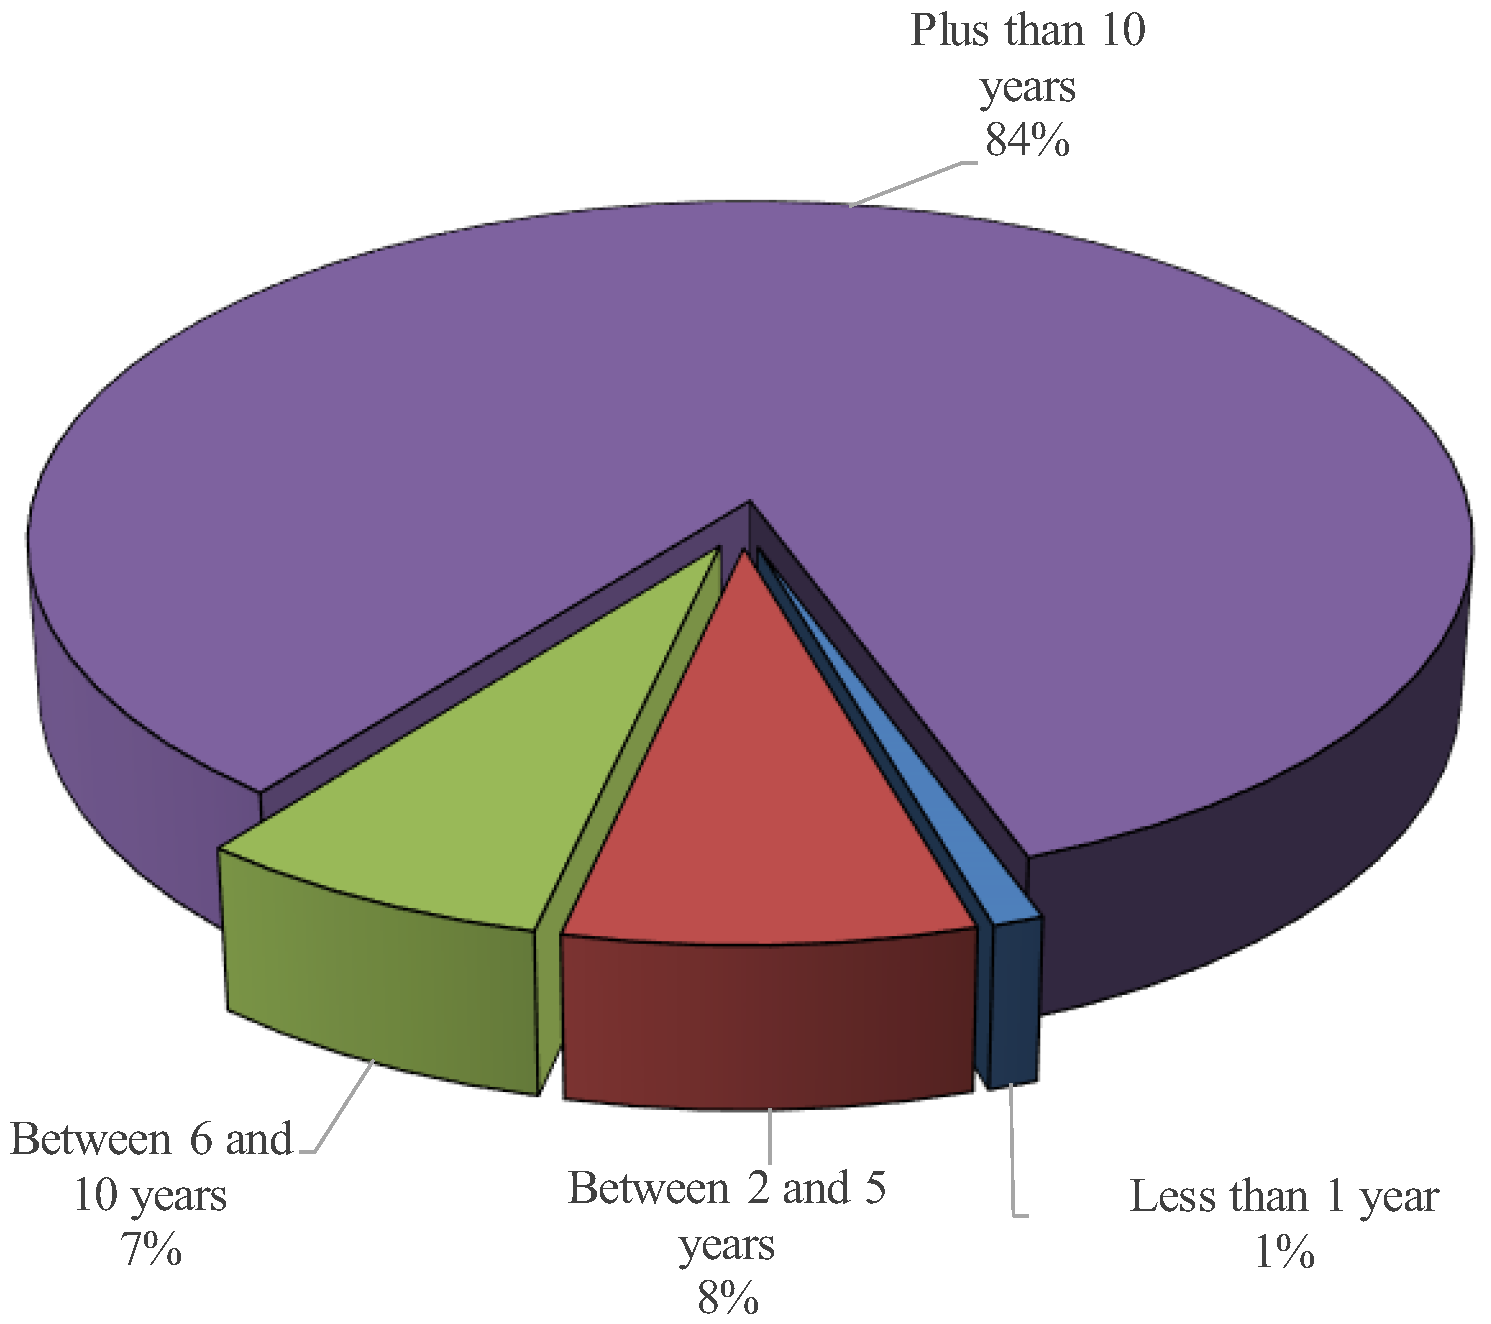
In terms of the function of the individual respondents, they were highly experienced (84% with more than 10 years working experience on their organization) and more than 30% come from the so-called C suite (President, CEO-Chief Executive Officers, COO-Chief Operations Officer). They were followed by 23% of Managers/responsible for the environment/sustainability and 19% Financial Managers (CFO). This is an indication that CE is regarded as a strategic and relevant issue for the organization profitability and value creation, not just a technical one to incrementally improve environmental performance. This is a considerably higher value for Top Managers respondents than those reported in a similar research addressing ISO 14001 EMS implementation [32] and taking into consideration the relevance of the company culture for the success of CE [10,35] it is a prospective indicator of more intense CE application in the future.
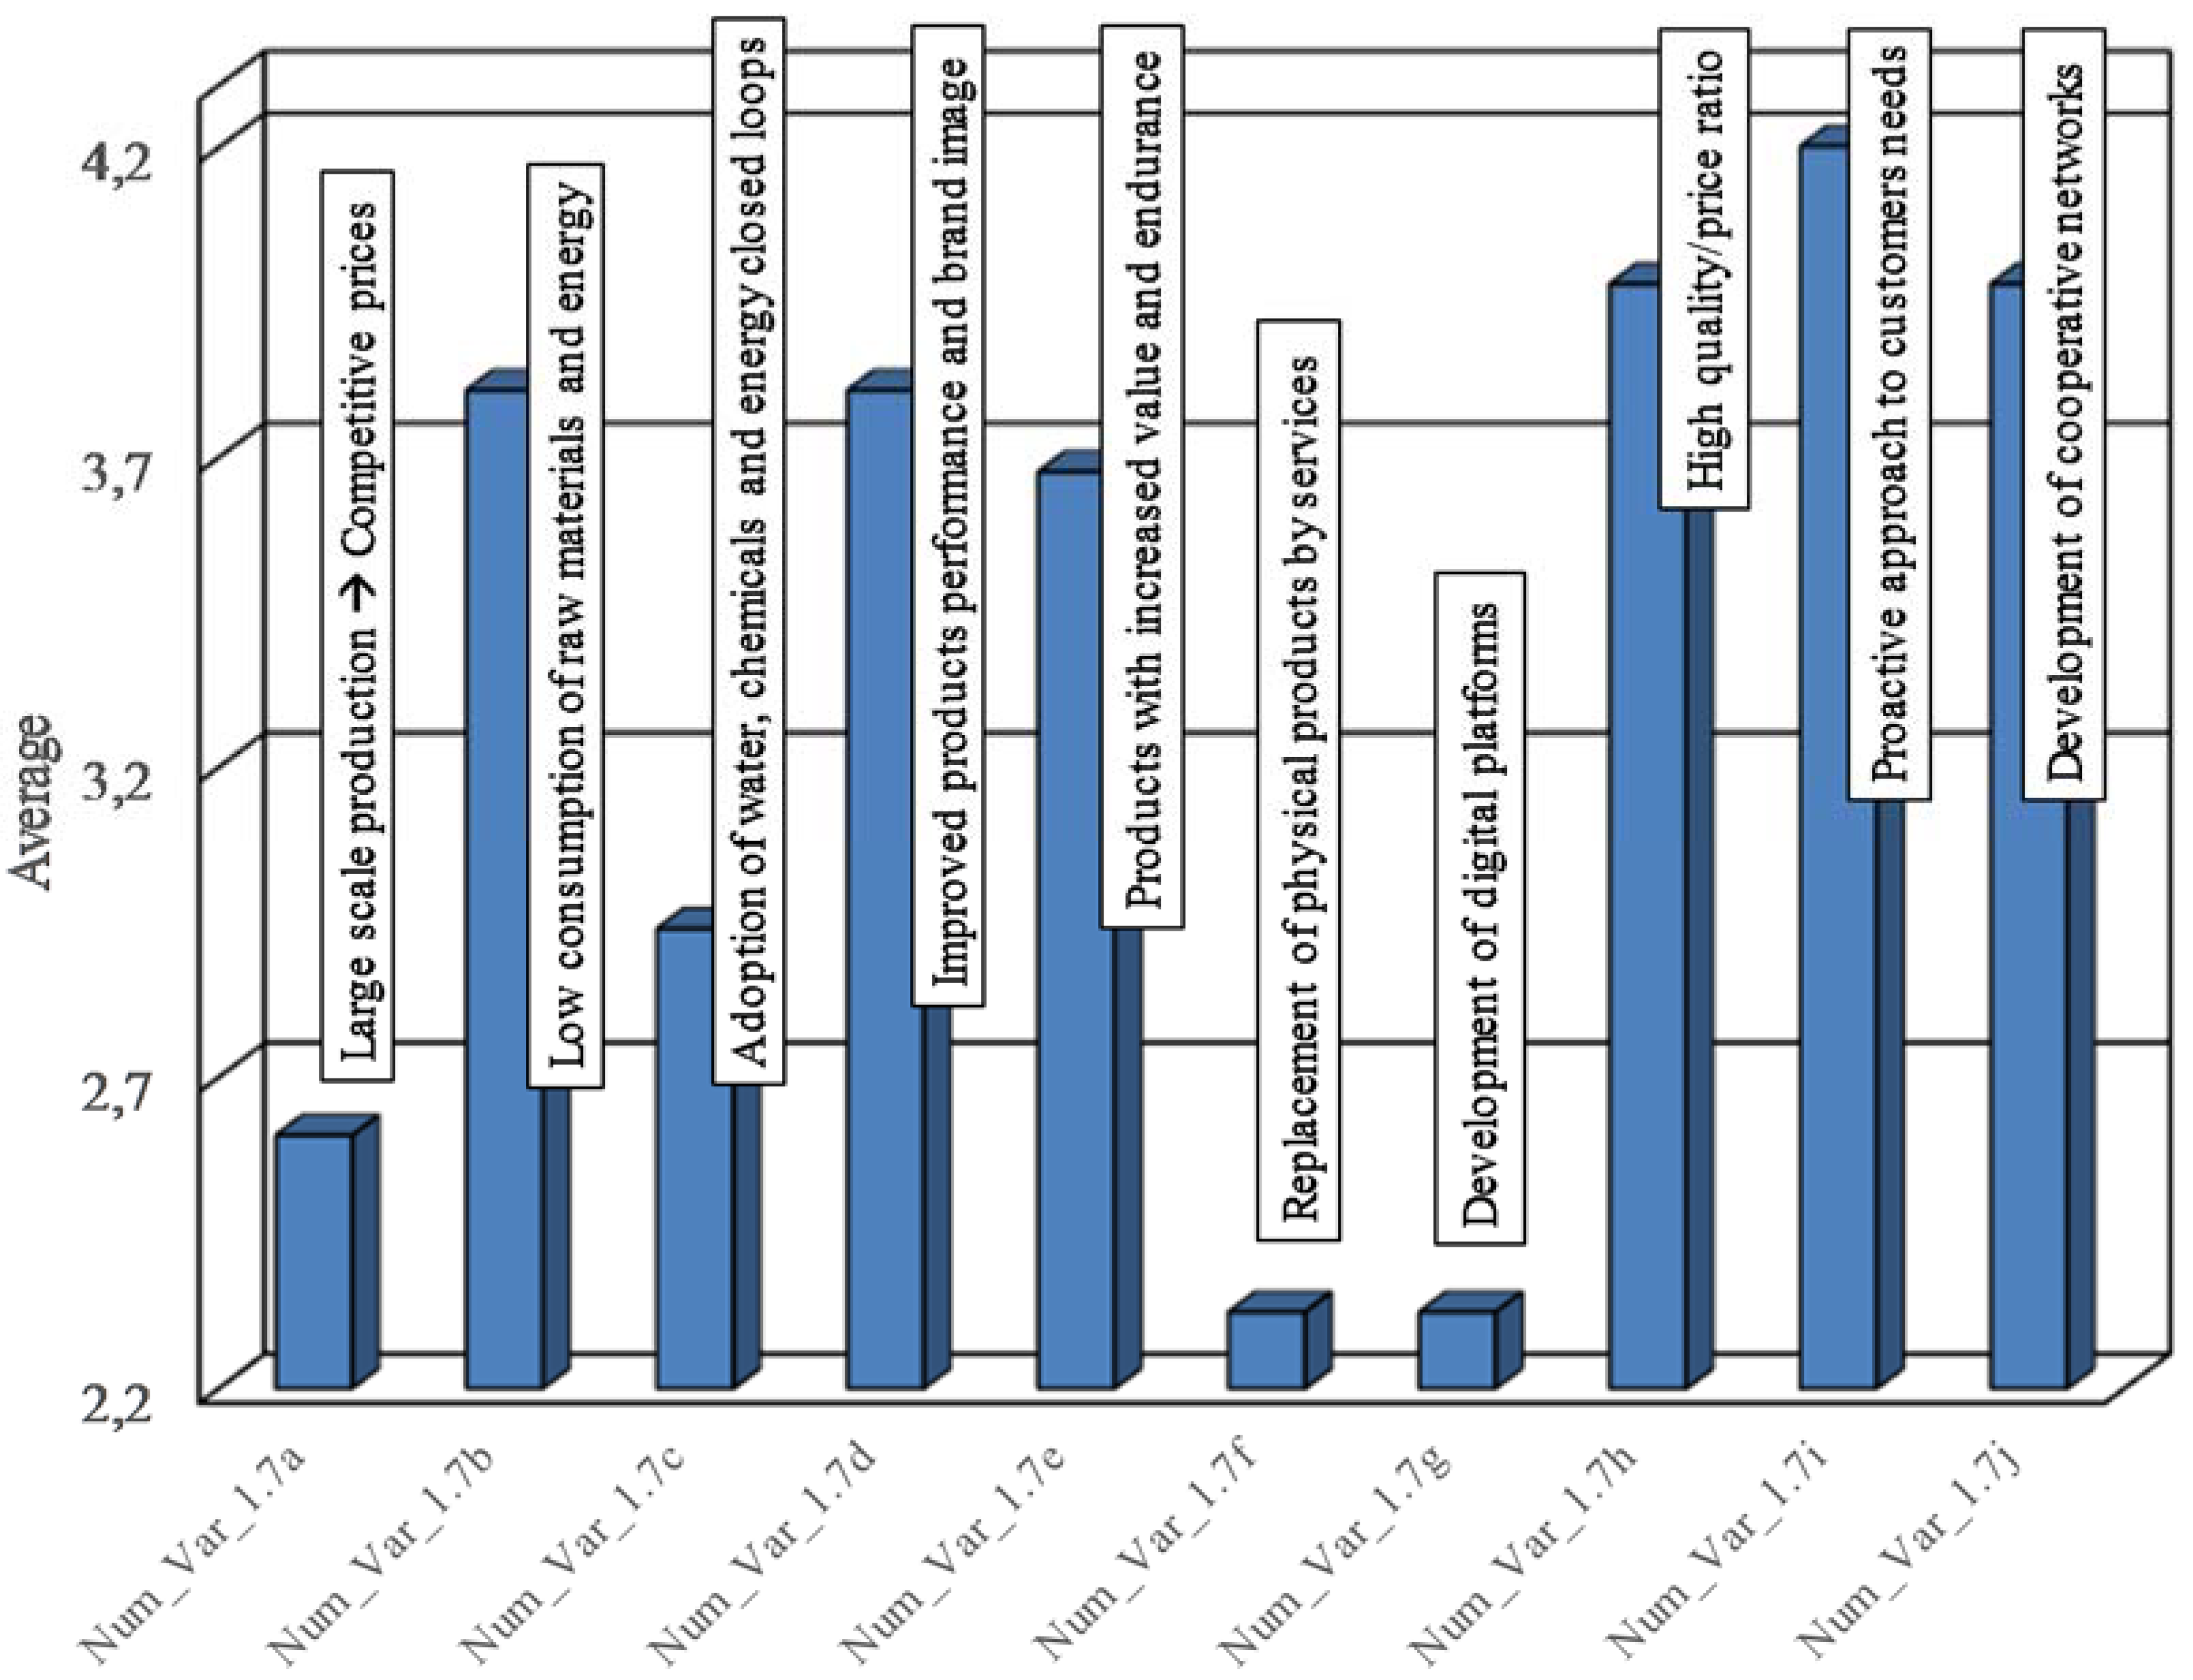
Strategically, the surveyed organizations report to be very customer oriented and to adopt a differentiation or value for money strategy (high quality/price ratio), rather than being low price competitive and volume large-scale producers. This is an option that is consistent with the small size of the organizations and suggests that CE can be aligned with the companies search for innovative and performant processes, products and solutions. The efficient management of energy and the reduction of raw materials consumption is a clear strategic option, as it can output both positive economic (fewer costs) and environmental (lesser impact and pollution) outcomes, which is consistent with the conclusions from previous studies [22,24,28]. However, the adoption of water, chemical products and energy closed loops show medium results (with some variation) and the collection and reuse of products is not very high. The replacement of products by services and the development of digital platforms to sell their products is also low, which might partly explain since most of the organizations are SMEs within the global supply chain and have limited bargaining power and most operate in Business to Business (B2B) market and not in the Business to Consumer (B2C) one. A positive indication is the establishment of collaborative and value-added networks with the organization partners which is a major CE enabler reported in the literature [33,36,39].
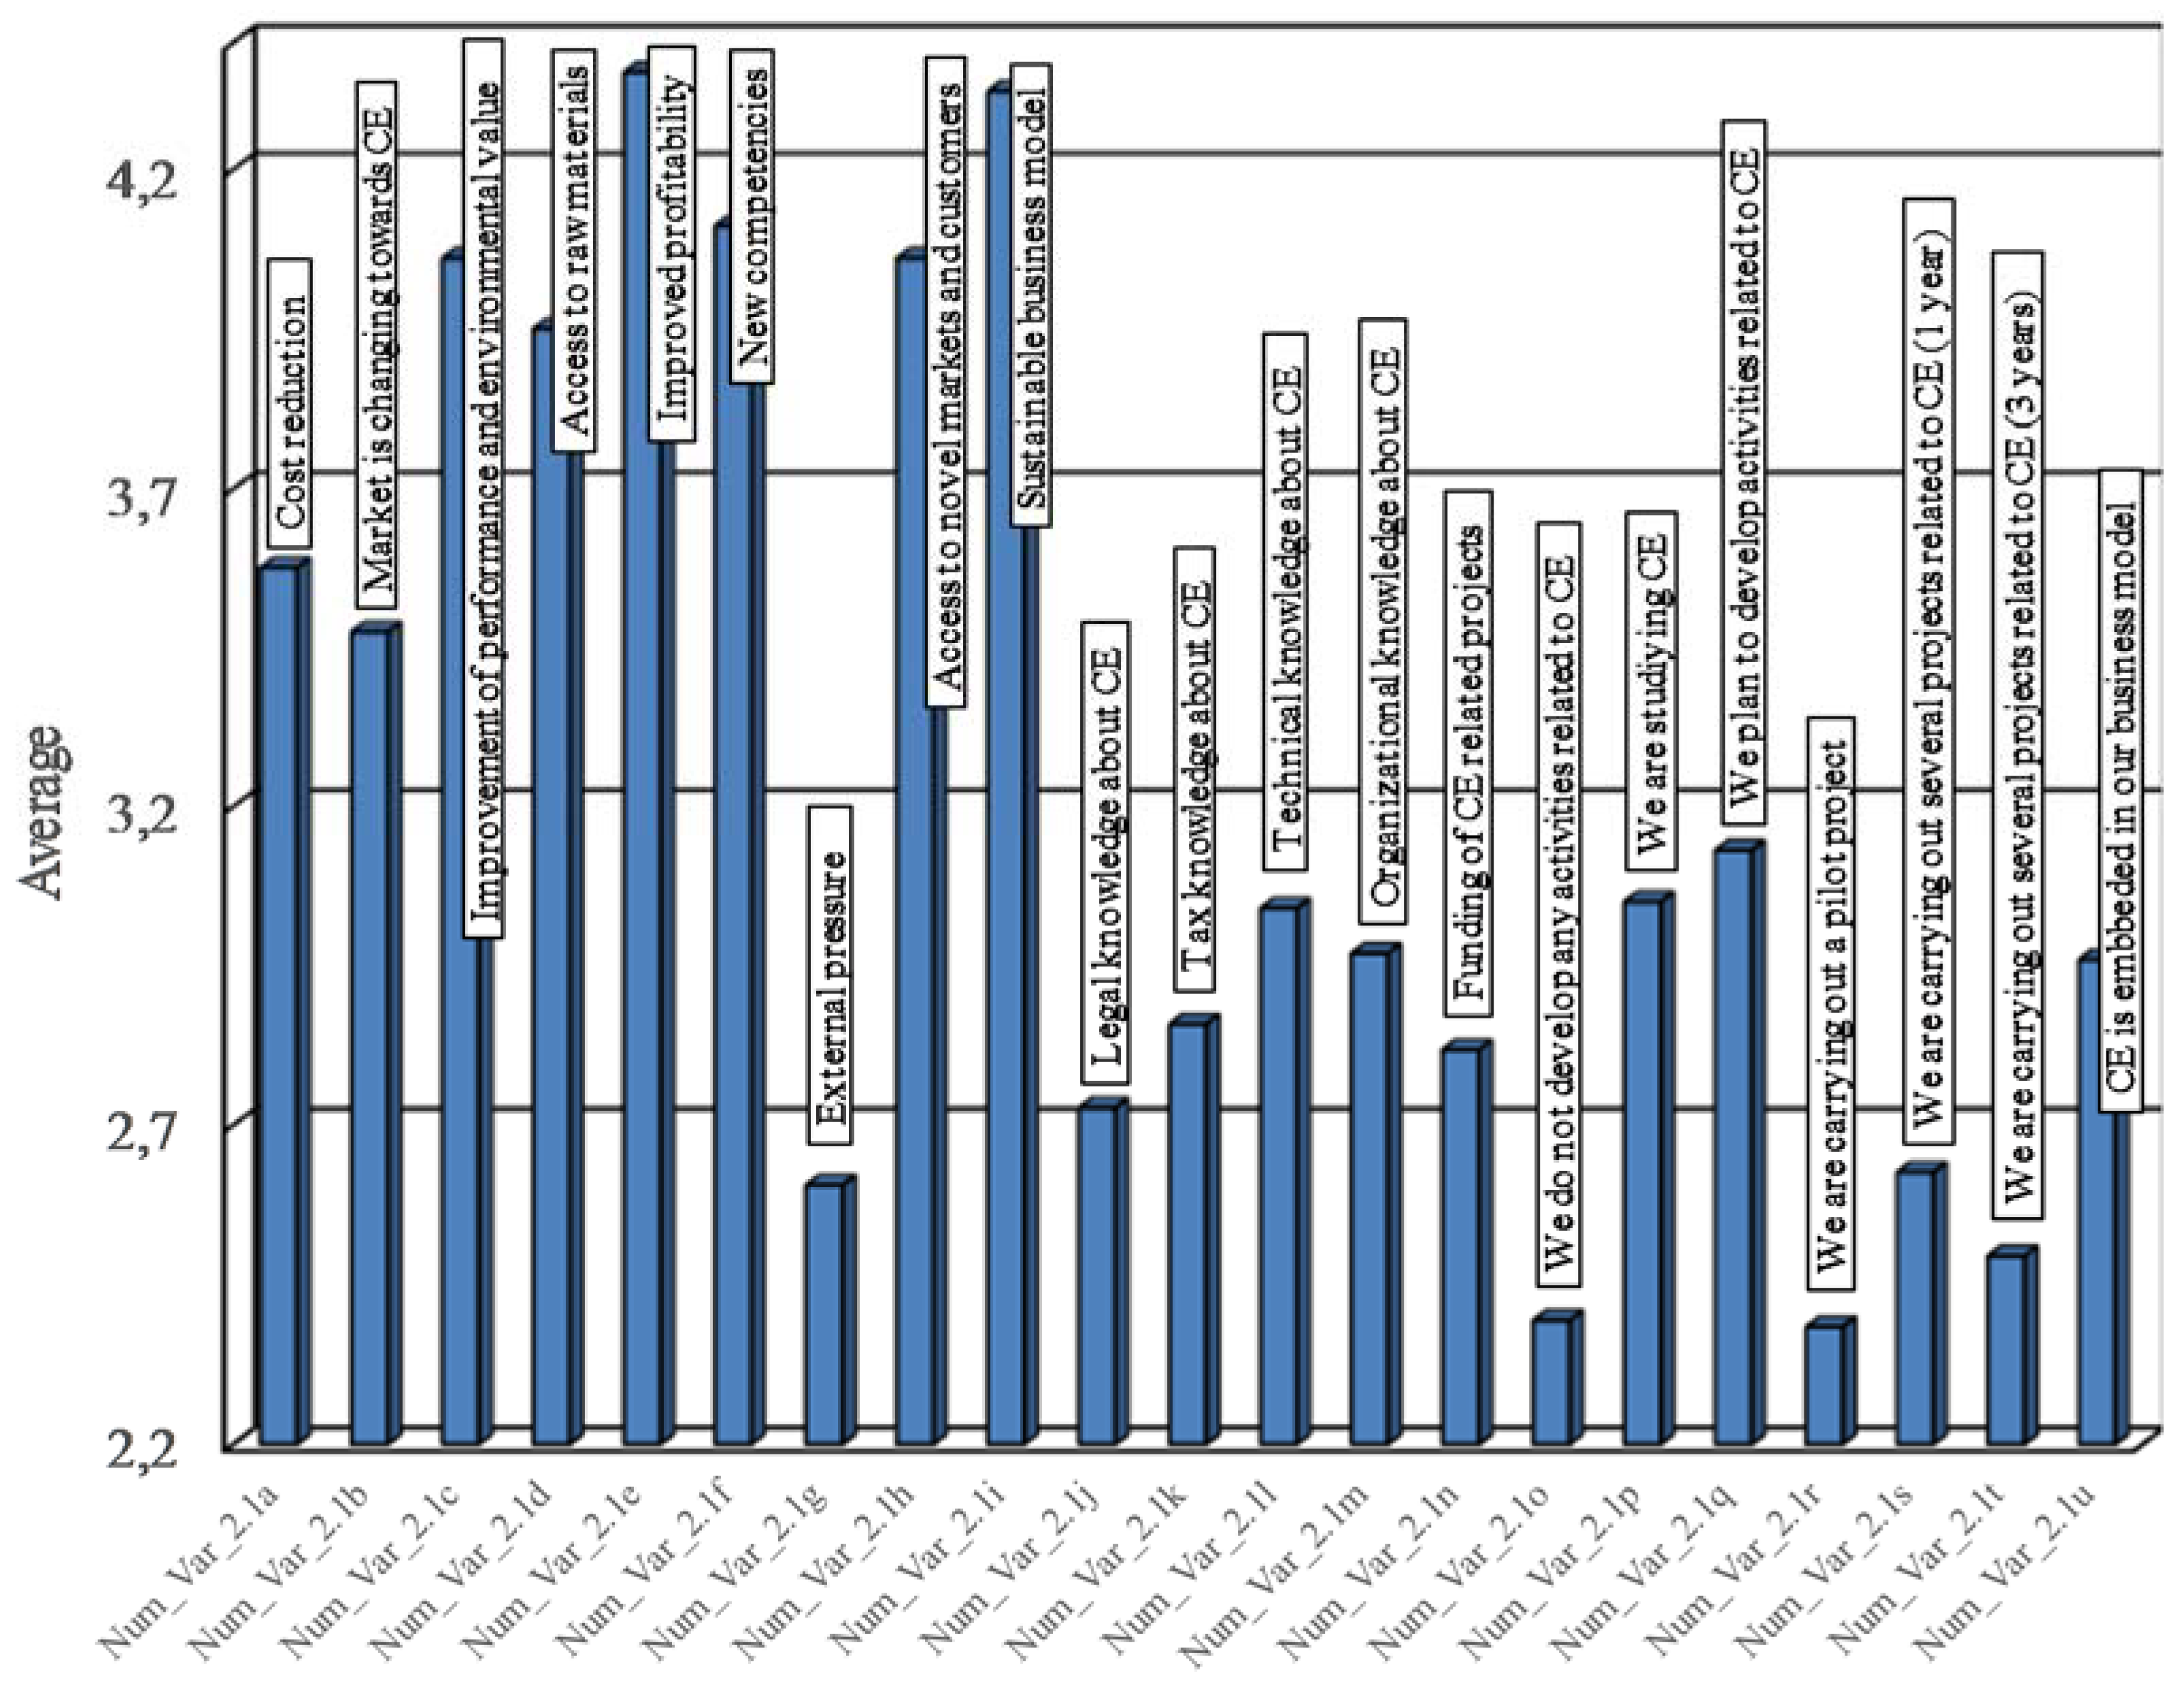
Concerning the motivations for the adoption of CE, there is a strong indication that the surveyed organizations aim at a sustainable business model and to improve both, their profitability and value creation and their environmental performance. They look forward acquiring new competencies and access novel markets and consumers, which is relevant to achieve a sustainable business model and enduring value creation. However, the organizations do not report many external pressures to adopt CE suggesting that supply chain partners and consumers still do not demand for “green suppliers” and “green products,” which has been reported as a major obstacle for CE adoption in previous researches [10,36,39,40] and might indicate a resistance from powerful supply chain actors and consumer preferences, towards CE.
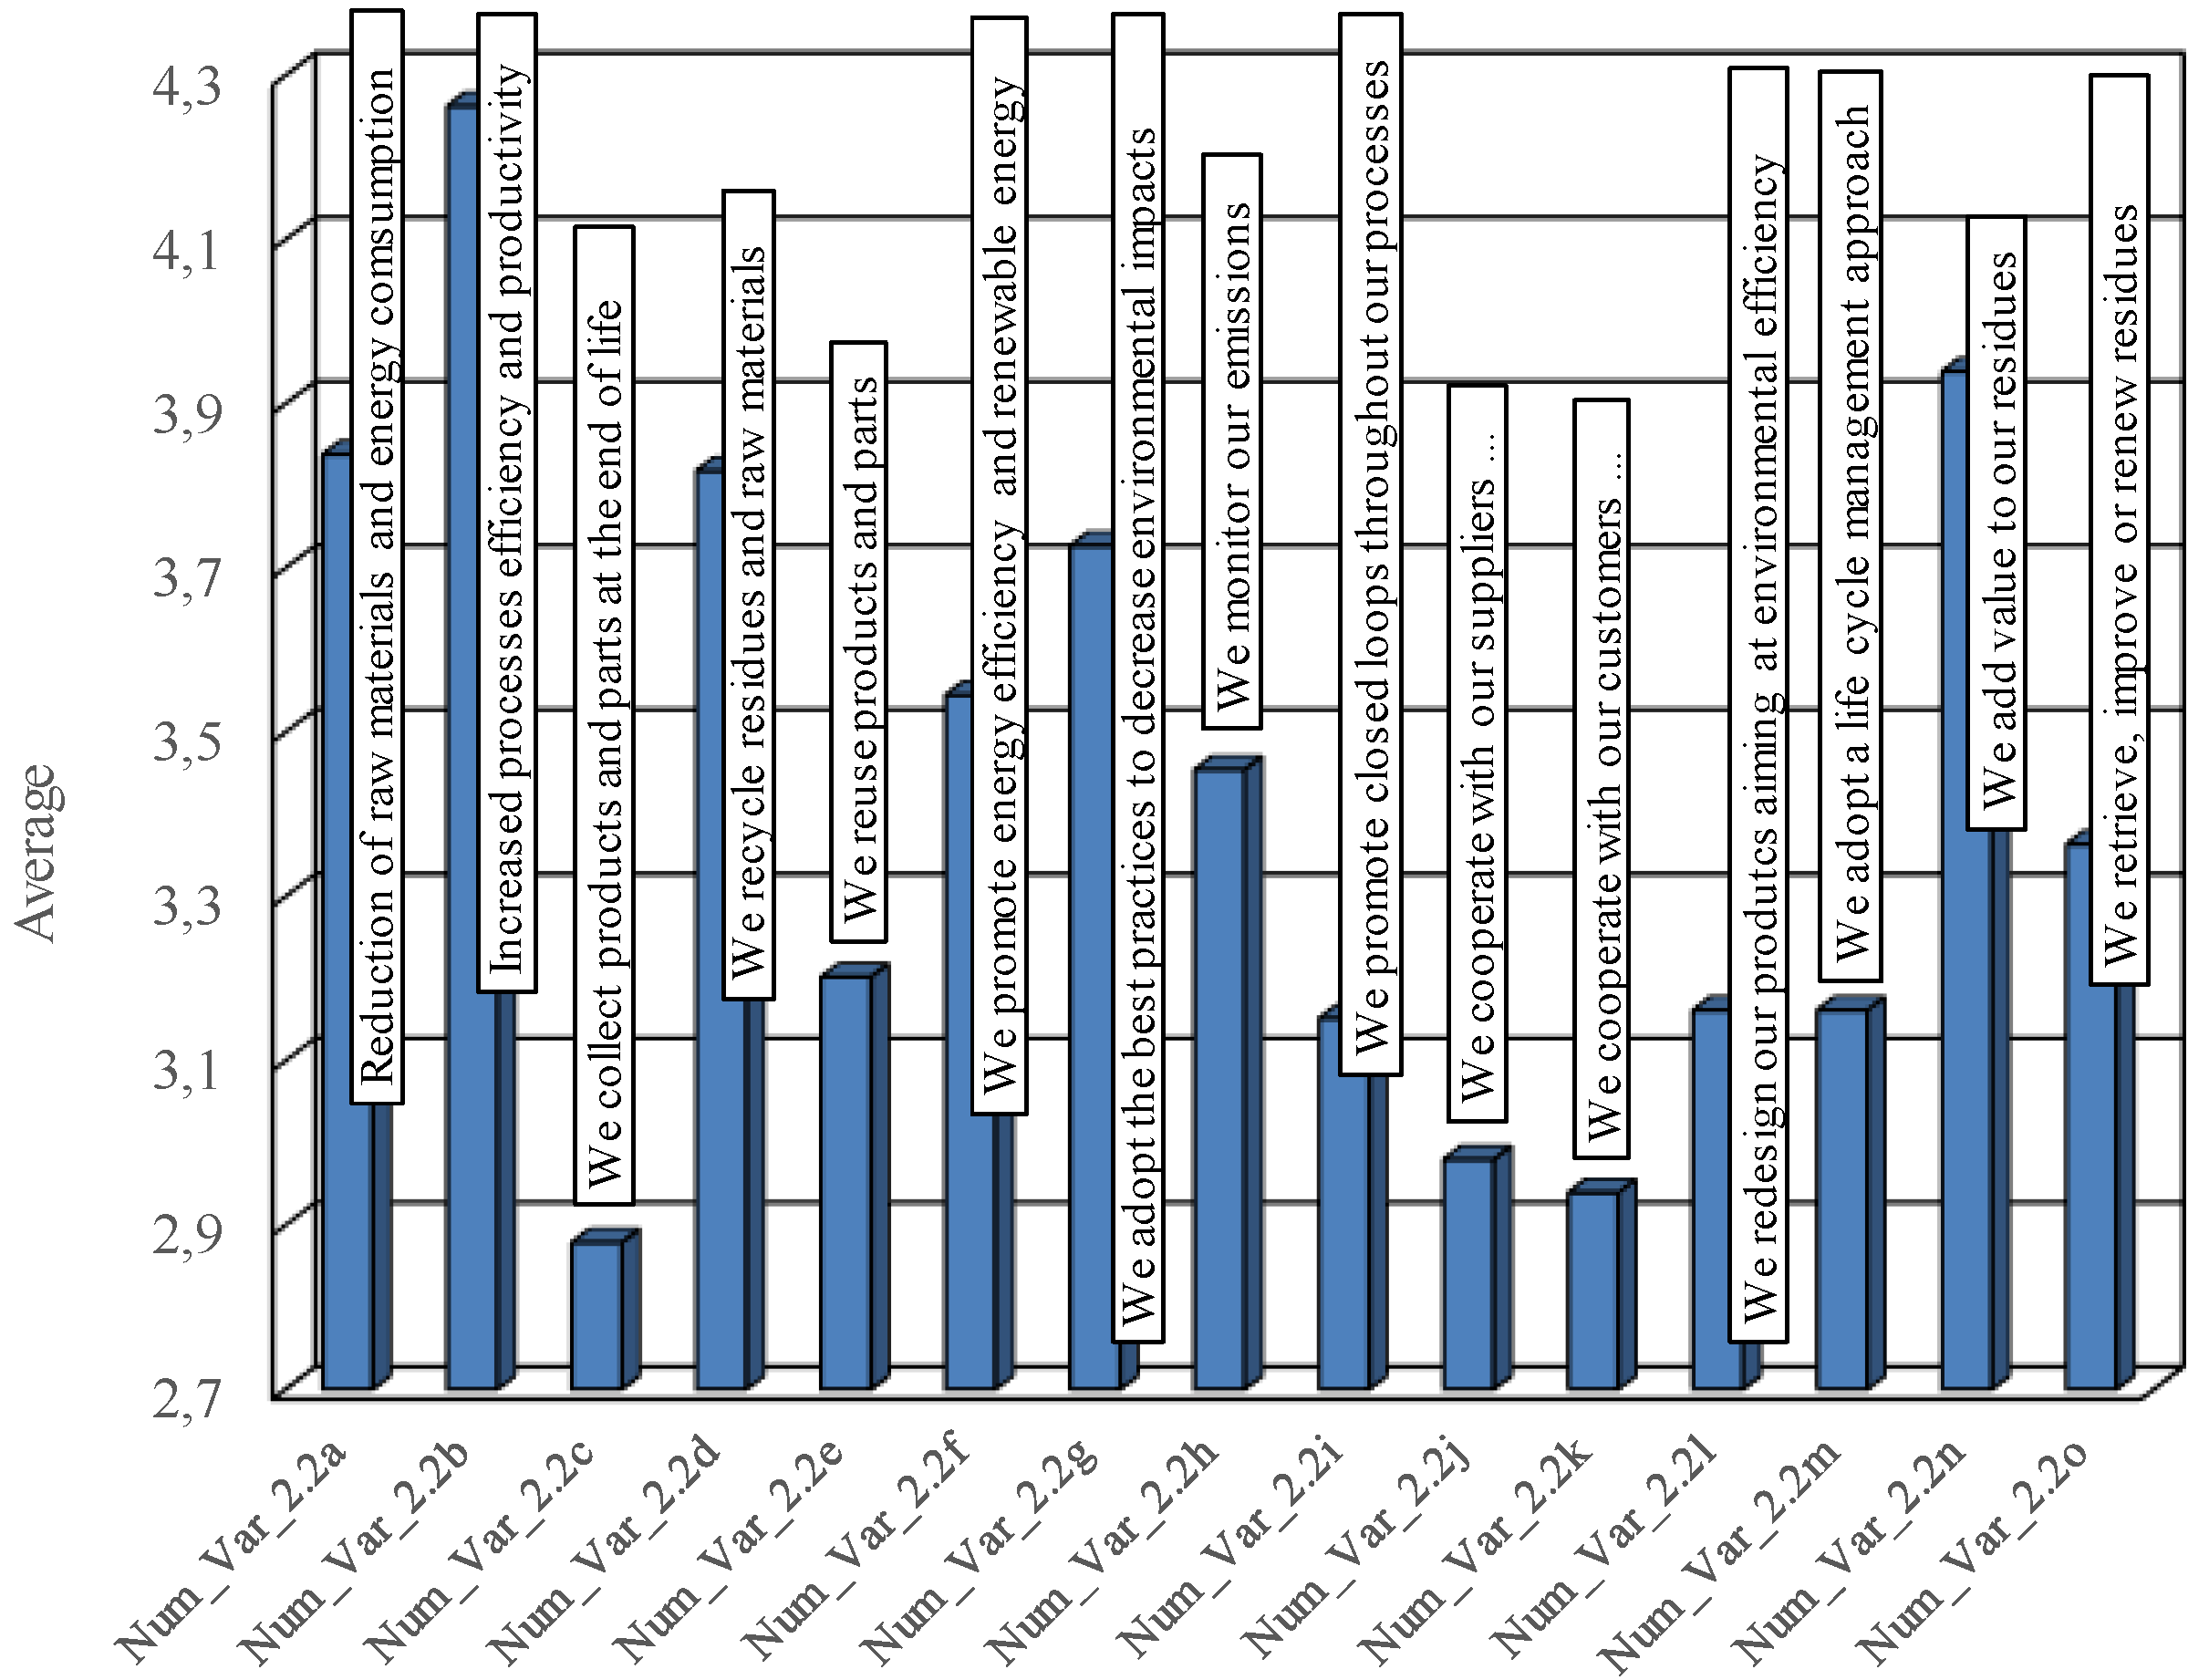
Concerning the level of application of CE in the surveyed organizations, the improvement of the productivity and the efficiency of the organizations’ processes, are the main priorities. The segregation and valuation of waste is a priority, however, the collection of end-of-life products and the cooperation with suppliers and customers to establish closed loops that maximize the utilization of resources and minimize waste and environmental impacts is not very intense. This is an indication that CE might still be perceived as the classic “reduce (increase efficiency in production, or consume less), reuse (by another consumer of discarded product that is still usable for its original function) and recycle (process materials to obtain the same or lower quality)” approach, as reported in previous research [45]. From a more positive perspective, the reutilization of products and parts and the adoption of the life cycle approach are gaining momentum.
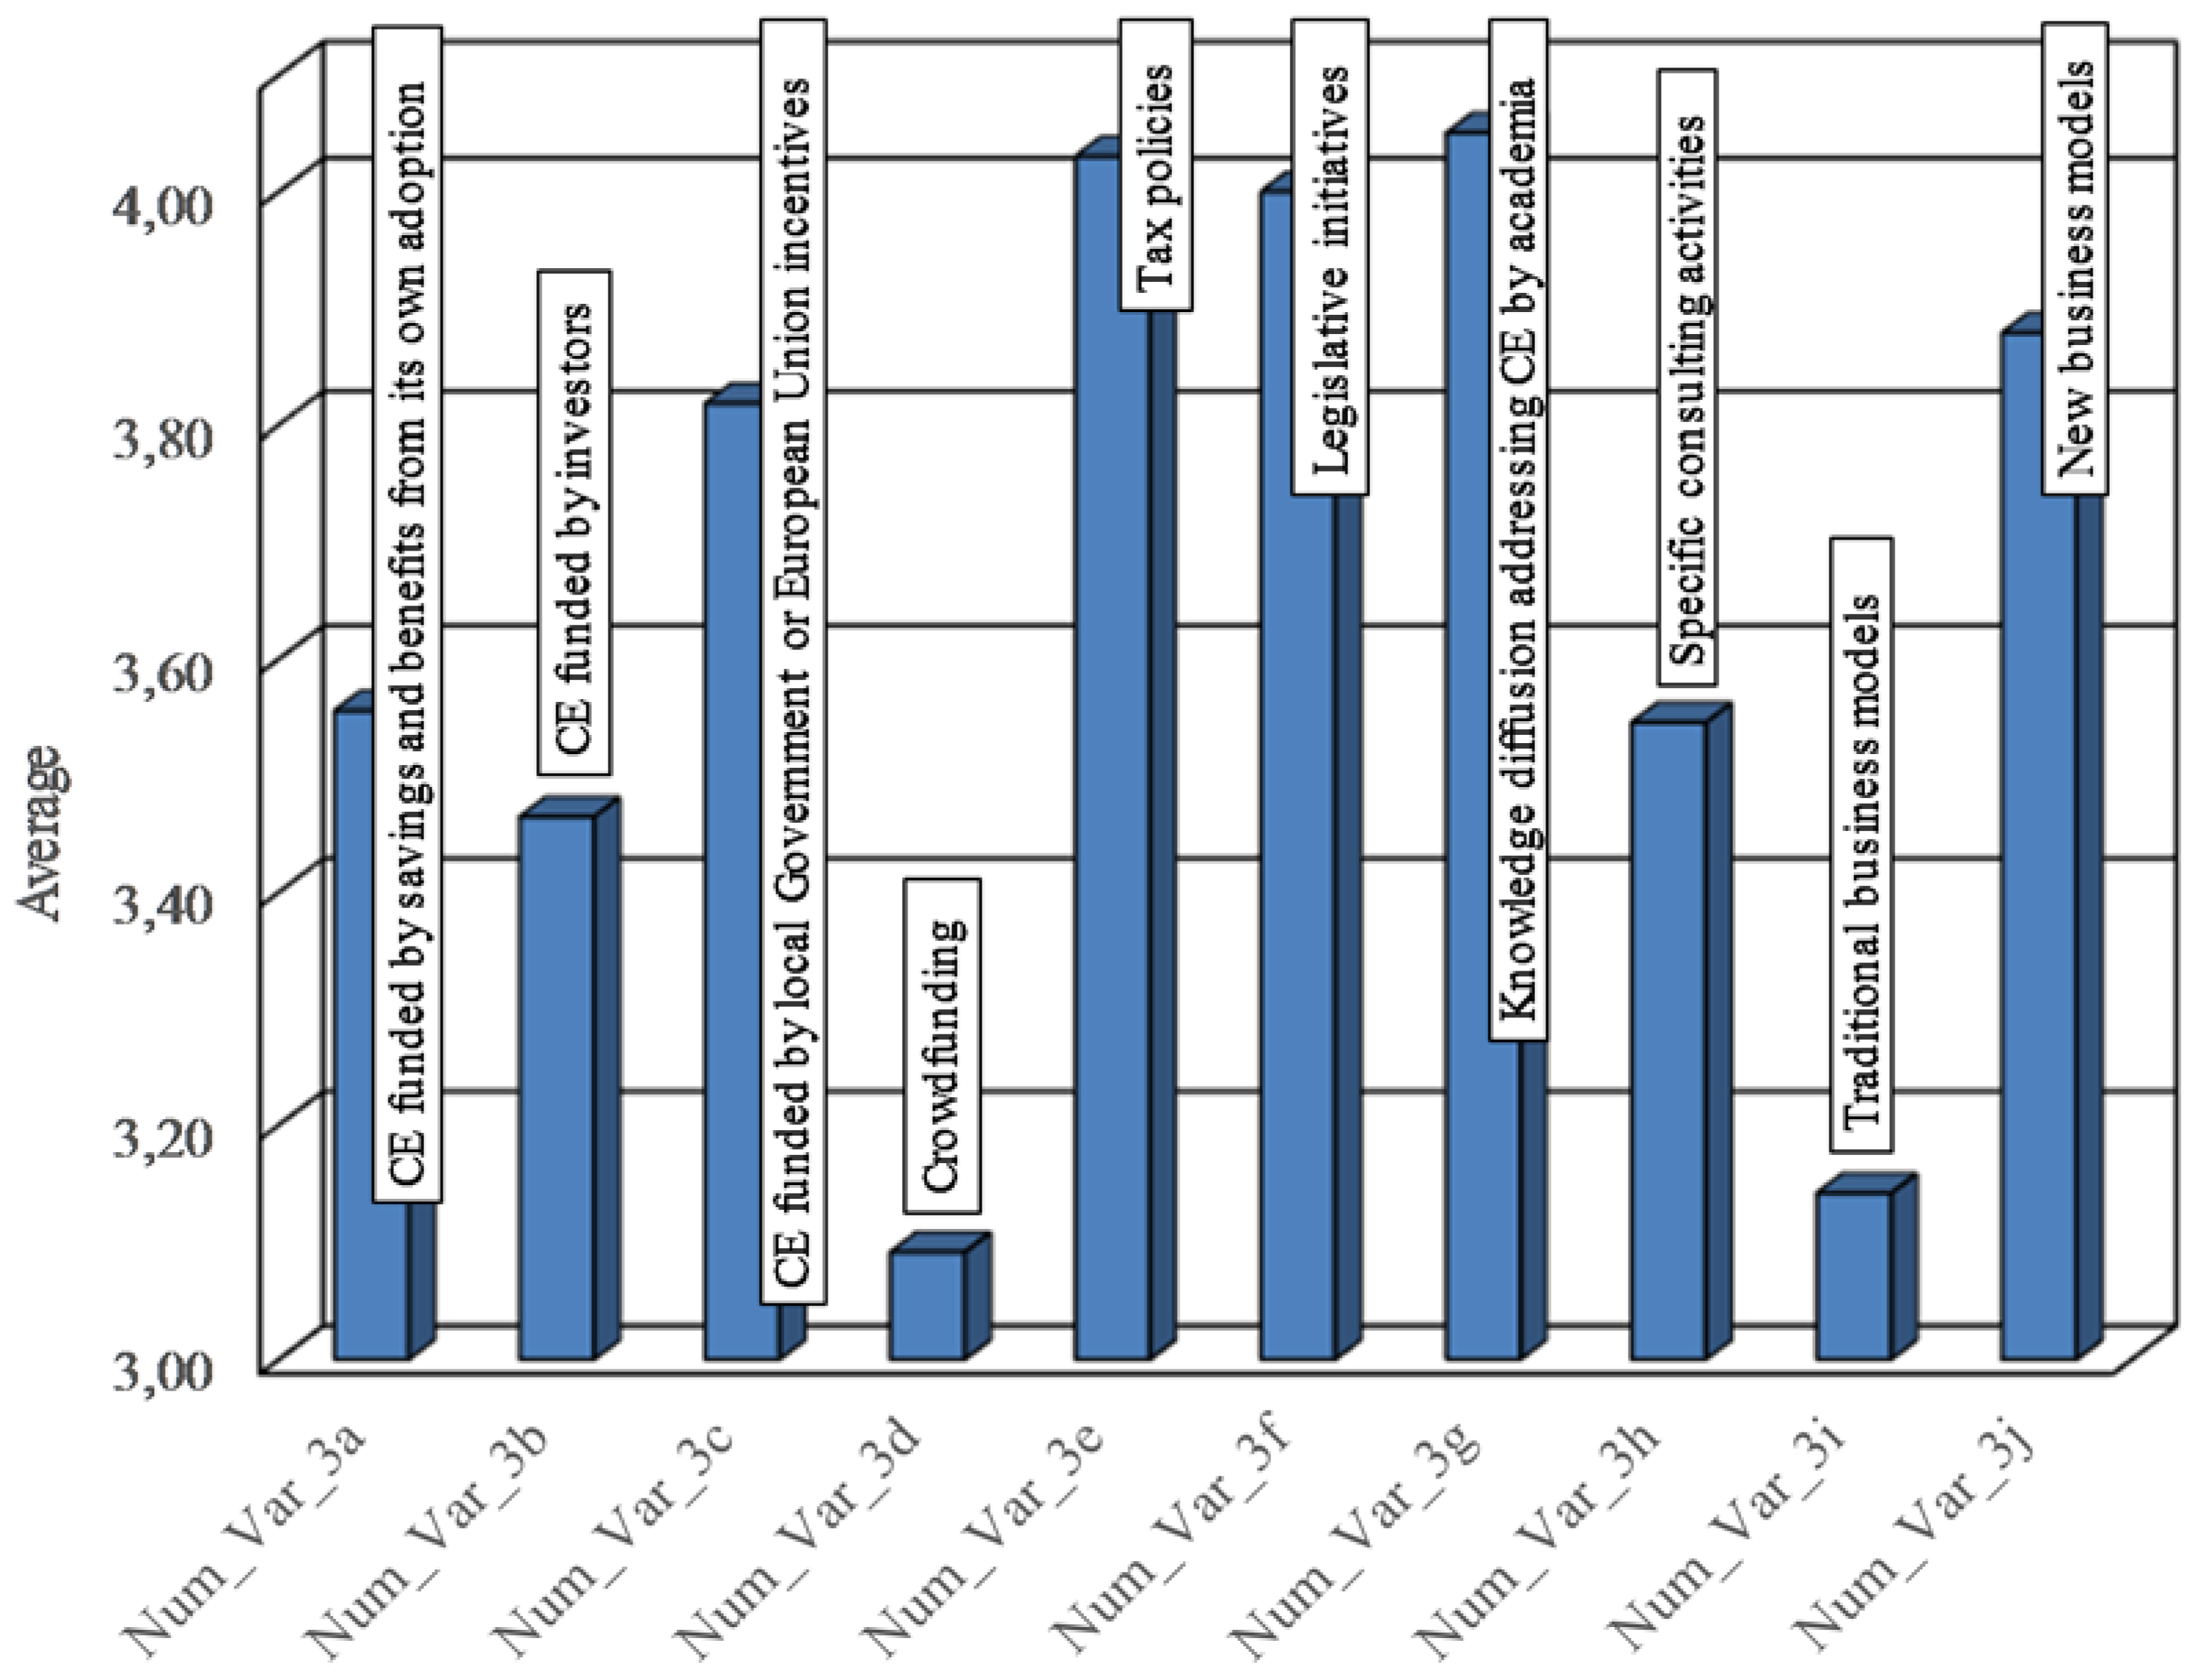
In respect to the actions to promote CE (enablers), the results are aligned with those reported in the literature. There is agreement that the tax (fiscal) policy should positively discriminate the organizations that work in the CE and that the Government should take legislative initiatives to support the CE, as reported in previous studies [11,38]. “Finance engineering” for CE and the availability of Government/European Union funding (incentive systems) is also an important issue for the surveyed companies, which is consistent with previous studies that stressed the importance of funding to finance CE investments [10,36,41]. The level of agreement that the application of the CE “requires the adoption of new business models based on recycling, reuse, recovery, eco-design, and eco-innovation”, is higher than the level of support for considering the “existing (traditional) business models as sufficient to support CE”. This may indicate that the comprehension of CE is improving within Portuguese organizations. And finally, there is an agreement that Academia should focus on the dissemination and creation of knowledge in the CE, which is in line with previous studies that reported the need for a deeper understanding and knowledge on the benefits and application of CE [37].
Concerning the several research questions tested, the results suggest that the more mature EMS ISO 14001 certified organizations adopt different strategic goals and policies. Additionally, organizations aiming at the improvement of the environmental performance and create environmental value, to have a better access to raw materials to prevent its scarcity and to have a sustainable business model, show a higher level of CE intensity. The consideration that CE is an integral part of the organizational business model is also relevant to a higher CE adoption level. These results are consistent with the conclusions of the research of Jonkers et al. [33] with Dutch companies.
In a “nutshell” the concept of CE is supported by Portuguese organizations’ and the results show that CE is regarded as a strategic and relevant issue for their profitability and value creation. The perception that it requires the adoption of new business models in addition to the classical “reduce, reuse and recycle” approach is growing which might be a possible outcome of the EU, Portuguese Government, business and society at large, actions to promote CE [13,15,46,47]. Moreover, the potential for CE may be enhanced through an integrated approach considering other dimensions that impact on the organizational performance such as Quality and Occupational Health and Safety [48]. The results of the hypotheses tests indicate that the EMS certification and related maturity and the willingness to improve the environmental performance and operate through a sustainable business model have significant positive impacts on the level of CE adoption.
The study also shows how companies struggle with the design of the CE in a dominant linear environment and that its activities are still presently relatively modest. It is recognized that CE has the potential to produce new revenue models but organizations claim the need for a friendlier institutional environment (fiscal, legal, organizational, etc.) that helps to promote the CE and the search for increased forms of cooperation. To that aim, possible policy areas could address the increase of reuse, repair and remanufacturing, the promotion of green public procurement and innovation procurement and the development of secondary materials markets [49].

6. Conclusions

After reviewing the literature addressing the strategies, motivations and barriers related to the adoption of CE, a quantitative research encompassing a wide range of sectors and sizes was carried out providing knowledge that can support successful moves towards CE in Portugal.
As an overall conclusion, CE is regarded by the respondents’ organizations as a strategic and relevant issue for profitability and value creation. The support for the adoption of new business models in addition to the classical “reduce, reuse and recycle” approach is growing and the relevance of adopting production systems based on less intensive materials use and promoting materials and products reuse and/or recycling is highlighted. The EMS (Environmental Management System) certification and the strategic choice to improve the environmental performance and achieve a sustainable business model are related with higher levels of CE intensity. Organizations need to address CE with a strategic view, adopt the right business and revenue models and properly monitor its economic, environmental and social performance. However, it should be acknowledged that in highly competitive business environments, it is not easy to challenge the existing paradigms since companies need to be profitable in addition to improving their environmental performance. As reported in the literature, future research should try to identify the specific conditions that make it possible [24].
Considering that CE activities are still relatively modest, a friendlier context (fiscal, legal, organizational, etc.) and additional government actions to promote CE, would be much welcomed. More intense collaboration practices between companies and stronger support from supply chain agents and consumers are also required. Under a CE approach, value creation is no longer about making as many items as possible but about the optimization of the materials through the full product life-cycle and the improvement of the overall economic, environmental and social performance in a balanced, holistic and systemic way.
Although, due to the nature of the data and the sample size, these results did not allow to pursue detailed research on the companies’ sectors and nature related to CE (e.g., public versus private), they are valuable for both policymakers and business actors as they aim to promote and benefit from the adoption of CE business models and practices. As to suggestion for future research, it is not yet clear how the transition from a linear to a circular economy can be shaped and who (market or government) will lead the transformation. It is not evident how companies will address CE issues with internal and external stakeholders (e.g., how are things mutually agreed?), if their CE strategies are aligned with European Union CE policies and the fact that a positive attitude towards CE does not mean that a lot has changed in the business activities. Moreover, CE is not just to increase recycling but a fundamentally different way of organizing the economy based on cooperative networks and the preservation of raw materials, semi-finished products and products, hence, comprehensive knowledge on designing and adopting CE business models is needed, as reported in the literature [50].
Other suggestions for future research are (a) the determination if the organizations have the human competencies and the technology level to successfully adopt CE (e.g., technologies related to capacity to design, reuse, etc.); (b) the evaluation of the input and output flows of the companies to determine the potentials to optimize material, water and energy consumption (internally and in collaboration with other companies); (c) the assessment if the property ownership of the companies (e.g., family versus non-family owned) makes a difference for companies to respond to stakeholder and society demands by implementing new environmental policies or regulations, such as CE [51]; (d) the investigation of the level of consumers support to buy remanufactured or used products and how they see issues like lack of ownership. The research into the organizational aspects of the CE and the replication of this investigation in other countries (such as Poland and Slovakia) are avenues to pursue.

Author Contributions

The manuscript was written by L.M.F. and J.P.D. Both authors contributed to the study design and the results interpretation. M.T.P., F.F.M. and D.Z. revised the overall manuscript and all authors approved the final version.

Funding

This research received no external funding.

Acknowledgments

Authors would like to thank all the respondents’ organizations for their participation and the support from CIDEM, R&D unit. CIDEM R&D unit is funded by the FCT—Portuguese Foundation for the Development of Science and Technology, Ministry of Science, Technology and Higher Education, under the Project UID/EMS/0615/2016. Pedro Domingues benefited from financial support through the FCT post-doc research grant No. SFRH/BPD/103322/2014. This research is framed within the scope of Project “PME Sustentável–Projeto nº16129” funded by Portugal 2020 and FEDER.

Conflicts of Interest

The authors declare no conflict of interest.

References

  1. UN. Transforming Our World: The 2030 Agenda for Sustainable Development; United Nations General Assembly: New York, NY, USA, 2015; Available online: http://www.un.org/ga/search/view_doc.asp?symbol¼A/RES/70/1&Lang¼E (accessed on 20 May 2017).
  2. Pearce, D.W.; Turner, R.K. Economics of Natural Resources and the Environment; John Hopkins University Press: Baltimore, ML, USA; Elsevier: New York, NY, USA, 1990. [Google Scholar]
  3. Ellen MacArthur Foundation. Towards the Circular Economy. Economic and Business Rationale for an Accelerated Transition; Ellen MacArthur Foundation: Cowes, UK, 2012. [Google Scholar]
  4. Ellen Macarthur Foundation. Towards the Circular Economy, Vol. 3: Accelerating the Scale-Up across Global Supply Chains; Ellen Macarthur Foundation: Cowes, UK, 2014. [Google Scholar]
  5. Ghisellini, P.; Cialani, C.; Ulgiati, S. A review on circular economy: The expected transition to a balanced interplay of environmental and economic systems. J. Clean. Prod. 2016, 114, 11–32. [Google Scholar] [CrossRef]
  6. Lieder, M.; Rashid, A. Towards circular economy implementation: A comprehensive review in context of manufacturing industry. J. Clean. Prod. 2016, 115, 36–51. [Google Scholar] [CrossRef]
  7. Sauvé, S.; Bernard, S.; Sloan, P. Environmental sciences, sustainable development and circular economy: Alternative concepts for trans-disciplinary research. Environ. Dev. 2016, 17, 48–56. [Google Scholar] [CrossRef]
  8. Murray, A.; Skene, K.; Haynes, K. The Circular Economy: An Interdisciplinary Exploration of the Concept and Application in a Global Context. J. Bus. Ethics 2017, 140, 369–380. [Google Scholar] [CrossRef]
  9. Bruce, A.; Lyall, C.; Tait, J.; Williams, R. Interdisciplinary integration in Europe: The case of the Fifth Framework programme. Futures 2004, 36, 457–470. [Google Scholar] [CrossRef]
  10. Rizos, V.; Behrens, A.; van der Gaast, W.; Hofman, E.; Ioannou, A.; Kafyeke, T.; Flamos, A.; Rinaldi, R.; Papadelis, S.; Hirschnitz-Garbers, M.; et al. Implementation of Circular Economy Business Models by Small and Medium-Sized Enterprises (SMEs): Barriers and Enablers. Sustainability 2016, 8, 1212. [Google Scholar] [CrossRef]
  11. Winans, K.; Kendall, A.; Deng, H. The history and current applications of the circular economy concept. Renew. Sustain. Energy Rev. 2017, 68, 825–833. [Google Scholar] [CrossRef]
  12. Korhonen, J.; Nuur, C.; Feldmann, A.; Birkie, S.E. Circular economy as an essentially contested concept. J. Clean. Prod. 2018, 175, 544–552. [Google Scholar] [CrossRef]
  13. European Commission. Closing the Loop: An EU Action Plan for the Circular Economy; Communication from the Commission to the European Parliament, the Council, the European Economic and Social Committee and the Committee of the Regions: Brussels, Belgium, 2015. [Google Scholar]
  14. Circular Economy in Europe. Developing the Knowledge Base; European Environmental Agency: Copenhagen, Danmark, 2016. [Google Scholar]
  15. Portuguese Government. Plano de Ação para a Economia Circular. Governo de Portugal. 2015. Available online: https://www.portugal.gov.pt/download-ficheiros/ficheiro.aspx?v=71fc795e-90a7-48ab-acd8-e49cbbb83d1f/ace (accessed on 19 November 2017).
  16. Fonseca, L.M.; Domingues, J.P. Adoption of Circular Economy concepts and practices by Portuguese Citizens and Companies. Proc. Int. Conf. Bus. Excell. 2017, 12, 374–385. [Google Scholar] [CrossRef]
  17. Banco de Portugal (Portuguese Central Bank) Statistics. Available online: https://www.bportugal.pt/page/estatisticas (accessed on 20 May 2018).
  18. Agência Portuguesa do Ambiente (Portuguese Environmental Agency). Available online: https://www.apambiente.pt/index.php?ref=16&subref=84&sub2ref=108 (accessed on 20 May 2018).
  19. Boulding, K. The Economics of the Coming Spaceship Earth. In Environmental Quality in a Growing Economy; Jarrett, H., Ed.; Johns Hopkins University Press: Baltimore, MD, USA, 1966; pp. 3–14. [Google Scholar]
  20. Towards a Circular Economy: A Zero Waste Programme for Europe; COM (European Commission): Brussels, Belgium, 2014.
  21. Lehmann, M.; Leeuw, B.; Fehr, E.; Wong, A. Circular Economy. Improving the Management of Natural Resources; Swiss Academies of Arts and Sciences: Bern, Switzerland, 2014. [Google Scholar]
  22. EEA (European Environment Agency). Circular Economy in Europe—Developing the Knowledge Base; EEA: Copenhagen, Denmark, 2016. [Google Scholar]
  23. Geissdoerfer, M.; Savaget, P.; Bocken, N.M.P.; Hultink, E.J. The circular economy—A new sustainability paradigm? J. Clean. Prod. 2017, 143, 757–768. [Google Scholar] [CrossRef]
  24. Masi, D.; Day, S.; Godsell, J. Supply Chain Configurations in the Circular Economy: A Systematic Literature Review. Sustainability 2017, 9, 1602. [Google Scholar] [CrossRef]
  25. Ellen MacArthur Foundation. Delivering the Circular Economy. A Toolkit for Policymakers; Ellen MacArthur Foundation: Cowes, UK, 2015. [Google Scholar]
  26. Morgan, J.; Mitchell, P. Employment and the Circular Economy. Job Creation in a More Resource Efficient Britain; Green Alliance: London, UK, 2015. [Google Scholar]
  27. Bastein, T.; Roelofs, E.; Rietveld, E.; Hoogendoorn, A. Opportunities for a Circular Economy in The Netherlands; TNO: Delft, The Netherlands, 2013. [Google Scholar]
  28. Rizos, V.; Tuokko, K.; Behrens, A. The Circular Economy: A Review of Definitions, Processes and Impacts; Technical Report; Ecological Institute: Berlin, Germany, 2017. [Google Scholar]
  29. Yuan, Z.; Bi, J.; Moriguichi, Y. The circular economy: A new development strategy in China. J. Ind. Ecol. 2006, 10, 4–8. [Google Scholar] [CrossRef]
  30. Chen, J.Z. Material flow and circular economy. Syst. Res. Behav. Sci. 2009, 26, 269–278. [Google Scholar] [CrossRef]
  31. Zink, T.; Geyer, R. Circular economy rebound. J. Ind. Ecol. 2017, 21, 593–602. [Google Scholar] [CrossRef]
  32. Fonseca, L.M.; Domingues, J.P. Exploratory Research of ISO 14001:2015 Transition among Portuguese Organizations. Sustainability 2018, 10, 781. [Google Scholar] [CrossRef]
  33. Jonker, J.; Stegeman, H.; Faber, N.; Rothman, I. Resultaten van het Landelijke Onderzoek 2016–2017 naar Business Modell Envoor de Circulaire Economie. 2017. Available online: https://www.circulairebusinessmodellen.nl/publicaties/ (accessed on 19 November 2017).
  34. Ellen MacArthur Foundation; SUN; McKinsey Center for Business and Environment. Growth within: A Circular Economy Vision for a Competitive Europe; Ellen MacArthur Foundation: Cowes, UK, 2015. [Google Scholar]
  35. Liu, Y.; Bai, Y. An exploration of firms’ awareness and behavior of developing circular economy: An empirical research in China. Resour. Conserv. Recycl. 2014, 87, 145–152. [Google Scholar] [CrossRef]
  36. Kok, L.; Wurpel, G.; Ten Wolde, E. Unleashing the Power of the Circular Economy; IMSA Amsterdam: Amsterdam, The Netherlands, 2013. [Google Scholar]
  37. FUSION. Fusion Observatory Report: February 2014—The Circular Economy and Europe’s Small and Medium Sized Businesses; BSK-CiC: Chatham, UK, 2014. [Google Scholar]
  38. Calogirou, C.; Sørensen, S.Y.; Larsen, P.B.; Alexopoulou, S. SMEs and the Environment in the European Union; European Commission: Brussels, Belgium, 2010. [Google Scholar]
  39. Van Buren, N.; Demmers, M.; van der Heijden, R.; Witlox, F. Towards a Circular Economy: The Role of Dutch Logistics Industries and Governments. Sustainability 2016, 8, 647. [Google Scholar] [CrossRef]
  40. Wycherley, I. Greening supply chains: The case of the body shop international. Bus. Strateg. Environ. 1999, 8, 120–127. [Google Scholar] [CrossRef]
  41. Trianni, A.; Cango, E. Dealing with barriers to energy efficiency and SMEs: Some empirical evidences. Energy 2012, 37, 494–504. [Google Scholar] [CrossRef]
  42. Lakatos, E.S.; Dan, V.; Cioca, L.I.; Bacali, L.; Ciobanuet, A.M. How Supportive Are Romanian Consumers of the Circular Economy Concept: A Survey. Sustainability 2016, 8, 789. [Google Scholar] [CrossRef]
  43. Hartley, J. Some thoughts on Likert-type scales. Int. J. Clin. Health Psychol. 2013, 13, 83–86. [Google Scholar] [CrossRef]
  44. Armstrong, J.S.; Overton, T.S. Estimating Nonresponse Bias in Mail Surveys. J. Mark. 1977, 14, 396–402. [Google Scholar] [CrossRef]
  45. Kirchherr, J.; Reike, D.; Hekkert, M. Conceptualizing the circular economy: An analysis of 114 definitions. Resour. Conserv. Recycl. 2017, 221–232. [Google Scholar] [CrossRef]
  46. Business Council for Sustainable Development (BCSD)—Working Group for Circular Economy and Industrial Symbiosis. Available online: https://www.bcsdportugal.org/grupos-trabalho/ec (accessed on 20 May 2017).
  47. Green Projects Awards-Innovation and Circular Economy Category. Available online: http://gpa.pt/categorias-gpa/ (accessed on 20 May 2017).
  48. Domingues, J.P.T.; Sampaio, P.; Arezes, P.M. Integrated management systems assessment: A maturity model proposal. J. Clean. Prod. 2016, 124, 164–174. [Google Scholar] [CrossRef]
  49. Milios, L. Advancing to a Circular Economy: Three essential ingredients for a comprehensive policy mix. Sustain. Sci. 2018, 13, 861–878. [Google Scholar] [CrossRef]
  50. Lewandowski, M. Designing the business models for circular economy-towards the conceptual framework. Sustainability 2016, 81, 43. [Google Scholar] [CrossRef]
  51. Núñez-Cacho, P.; Molina-Moreno, V.; Corpas-Iglesias, F.A.; Cortés-García, F.J. Family Businesses Transitioning to a Circular Economy Model: The Case of “Mercadona”. Sustainability 2018, 10, 538. [Google Scholar] [CrossRef]
Figure 1. Administrative area of the organization headquarters-(G 1.1.1).
Sustainability 10 02521 g001
Figure 2. Dimension of the organization (N° of employees–G 1.5).
Sustainability 10 02521 g002
Figure 3. Status and maturity of the Environmental Management System-EMS (G 1.6).
Sustainability 10 02521 g003
Figure 4. Experience of the respondent in the organization-Breakdown by number of years (G 4.2).
Sustainability 10 02521 g004
Figure 5. Organizational role of the respondent in % (G 4.1).
Sustainability 10 02521 g005
Figure 6. Level of strategy applicability (G 1.7a to G 1.7j), with variables transformed from Ordinal (G) to Numerical Variables (Num_Var).
Sustainability 10 02521 g006
Figure 7. Level of Motivations for CE (G 2.1a to G 2.1i), CE Knowledge (G 2.1j to G 2.1m) and CE applicability in the organization (G 2.1n to G 2.1u), after variables transformed from Ordinal (G) to Numerical Variables (Num_Var).
Sustainability 10 02521 g007
Figure 8. Level of CE intensity on the organization (G 2.2a to G 2.2o) after transformation from Ordinal (G) to Numerical Variables (Num-Var).
Sustainability 10 02521 g008
Figure 9. Level of agreement with actions to promote CE (G 3a to G 3j) after variables transformation from Ordinal (G) to Numerical (Num_Var).
Sustainability 10 02521 g009
Table 1. Summary of CE definitions.
AuthorDefinition
Ellen MacArthur Foundation, 2012, 2014 and 2015 [3,4,25]CE is “an industrial system that is restorative or regenerative by intention and design. It replaces the ‘end-of-life’ concept with restoration, shifts towards the use of renewable energy, eliminates the use of toxic chemicals, which impair reuse and aims for the elimination of waste through the superior design of materials, products, systems, and, within this, business models”. The overall objective is to “enable effective flows of materials, energy, labour and information so that natural and social capital can be rebuilt”.
European Environmental Agency, 2016 [22]“CE provides opportunities to create well-being, growth and jobs while reducing environmental pressures. The concept can, in principle, be applied to all kinds of natural resources, including biotic and abiotic materials, water and land’’ [13].
Morgan and Mitchell, 2015 [26]CE is “an alternative to a traditional linear economy (make, use, dispose) in which we keep resources in use for as long as possible, extracting the maximum value from them whilst in use, then recovering and reusing products and materials”.
Sauvé et al., 2016 [7]CE refers to the “production and consumption of goods through closed-loop material flows that internalize environmental externalities linked to virgin resource extraction and the generation of waste (including pollution)”.
Ghisellini et al., 2016 [5]“CE involves the radical reshaping of all processes across the life cycle of products conducted by innovative actors and has the potential to not only achieve material or energy recovery but also to improve the entire living and economic model.”
Yuan et al., 2006 [29]“Although there is no commonly accepted definition of CE so far, the core of CE is the circular (closed) flow of materials and the use of raw materials and energy through multiple phases.”
Chen, 2009 [30]“To solve the contradiction of limited resources and the increased consuming desire of human being[s] and to make use of natural resources rationally to achieve sustainable development, the circular economic development mode follows the pattern of ecological circulation and is based on the recycling of material resources.”
Murray et al., 2017 [8]“The Circular Economy is an economic model wherein planning, resourcing, procurement, production and reprocessing are designed and managed, as both process and output, to maximize ecosystem functioning and human well-being.”
Zink and Geyer, 2017 [31]“The core of the circular economy refers to three activities: reuse at the product level (such as ‘repair’ or ‘refurbishment’); reuse at the component level (e.g., ‘remanufacturing’); and reuse at the material level (‘recycling’).”
Korhonen et al., 2018 [12]“CE is a sustainable development initiative with the objective of reducing the societal production-consumption systems’ linear material and energy throughput flows by applying materials cycles, renewable and cascade-type energy flows to the linear system. CE promotes high-value material cycles alongside more traditional recycling and develops systems approaches to the cooperation of producers, consumers and other societal actors in sustainable development work”.
Table 2. Key characteristics of a CE (EEA, 2016) [22].
CE CategoryKey Characteristics
1: Less input and use of natural resources.
  • Minimized and optimized exploitation of raw materials, delivering more value from fewer materials;
  • Reduced import dependence on natural resources;
  • Efficient usage of all-natural resources;
  • Minimized overall energy and water usage.
2: Increased share of renewable and recyclable resources and energy.
  • Non-renewable resources replaced by renewable resources within sustainable levels of supply;
  • Increased share of recyclable and recycled materials that can replace the use of virgin materials;
  • Closure of material loops;
  • Sustainably sourced raw materials.
3: Reduced emissions.
  • Reduced emissions throughout the material cycle by consumption of less raw material and sustainable sourcing.
  • Less pollution through clean material cycles.
4: Fewer material losses/residuals.
  • Build-up of wastage minimized.
  • Incineration and landfill limited to a minimum.
5: Keeping the value of products, components and materials in the economy.
  • Extended product lifetime keeping the value of products in use.
  • Reuse of components.
Table 3. Hypotheses summary.
DimensionHypothesisHypothesis Number
Dimension 1—Organizational goals and strategies:
The definition of strategic goals and policies in the organization (G 2.1c, G 2.1d, G 2.1i, G 2.1u, G 3i and G 3j, see Table 4, Table 5, Table 6 and Table 7 for the variables descriptions) differ according to the …
The definition of strategic goals and policies in the organization differ according to the market in which the organization operatesHypothesis 1 (H1)
The definition of strategic goals and policies in the organization differ according to the activity sector where the organization operatesHypothesis 2 (H2)
The definition of strategic goals and policies in the organization differ according to the dimension of the organization (N° of employees)Hypothesis 3 (H3)
The definition of strategic goals and policies in the organization differ according to the status and maturity (years) of the EMS certificationHypothesis 4 (H4)
The definition of strategic goals and policies in the organization differ according to the organizational role of the respondentHypothesis 5 (H5)
Dimension 2— level of CE intensity:
Research Statement: The level of CE intensity in the organizations (G 2.2a to G 2.2o, see Table 5 for the description of variables) differ according to the …
The level of CE intensity in the organizations differ according to the willingness to improve the environmental performance and create environmental value (G 2.1c)Hypothesis 6 (H6)
The level of CE intensity in the organizations differ according to the willingness to have a better access to raw materials to prevent its scarcity activity sector where the organization operates (G 2.1d).Hypothesis 7 (H7)
The level of CE intensity in the organizations differ according to the willingness to have a sustainable business model dimension of the organization (G 2.1i)Hypothesis 8 (H8)
The level of CE intensity in the organizations differ according to the agreement that CE is an integral part of the organizational business model (G 2.1u)Hypothesis 9 (H9)
The level of CE intensity in the organizations differ according to the agreement that to apply the CE, it is enough to use the existing business models, reinforcing the reduction of consumption and energy, recycling and recovery (G 3i)Hypothesis 10 (H10)
The level of CE intensity in the organizations differ according to the agreement that the application of the CE requires the adoption of new business models (based on recycling, reuse, recovery and on eco-design, eco-innovation, the use of “closed” cycles and cooperation along the value chain) to be successful (G. 3j)Hypothesis 11 (H11)
Table 4. Level of strategy applicability (G 1.7a to G 1.7j).
VariableDescriptionMeanStandard Deviation
G 1.7aWe are a large scale (volume) producer to be competitive with low price2.611.12
G 1.7bWe focus on the efficient use and reduction of raw materials and energy consumption3.810.97
G 1.7cWe adopt water, chemical products and energy closed loops2.941.14
G 1.7dWe have a product performance and branding competitive advantage3.810.90
G 1.7eWe design products with a long-life utilization (increased value and endurance)3.681.05
G 1.7fWe replaced products by services and we support the collection and reuse of used consumer products2.321.17
G 1.7gWe developed digital platforms to buy and sell products2.321.23
G 1.7hWe achieved a price/quality compromise3.980.65
G 1.7iWe fulfil our customers demand in a proactive way4.200.61
G 1.7jWe established collaborative and value-added networks with our partners and customers3.980.78
Table 5. Level of Motivations for CE (G 2.1a to G 2.1i), CE Knowledge (G 2.1j to G 2.1n) and CE applicability in the organization (G 2.1n to G 2.1u).
VariableDescriptionMeanStandard Deviation
G 2.1aCircular Economy (CE) helps us to reduce costs3.580.88
G 2.1bThe market is changing towards CE and we want to seize that opportunity3.470.86
G 2.1cWe want to improve our environmental performance and create environmental value4.060.70
G 2.1dWe want to have a better access to raw materials to prevent its scarcity3.950.77
G 2.1eWe want to improve our profitability4.350.63
G 2.1fWe want to acquire new competencies4.110.74
G 2.1gWe have external pressures to adopt CE2.611.09
G 2.1hWe want to have access to novel markets and consumers4.060.83
G 2.1iWe want to have a sustainable business model4.320.65
G 2.1jWe have the necessary legal (juridical) knowledge concerning CE2.731.00
G 2.1kWe have the necessary fiscal (tax) knowledge concerning CE2.860.99
G 2.1lWe have the necessary technical knowledge concerning CE3.040.95
G 2.1mWe have the necessary organizational knowledge concerning CE2.970.95
G 2.1nWe know how to finance ourselves (funding) for the CE2.820.95
G 2.1oWe do not develop any activities related to the CE2.391.12
G. 2.1pWe are studying the CE and pondering what to do3.051.11
G 2.1qWe plan to develop activities related to the CE3.131.04
G 2.1rWe are carrying out a pilot project in the CE2.381.16
G 2.1sWe are carrying out projects related to the CE for at least 1 year2.631.17
G 2.1tWe are carrying out projects related to the CE for at least 3 years2.491.18
G 2.1uThe CE is embedded in our business model2.961.05
Table 6. Level of CE intensity on the organization (G 2.2a to G 2.2o).
VariableDescriptionMeanStandard Deviation
G 2.2aWe work on the reduction of raw materials and energy consumption3.840.90
G 2.2bWe promote the improvement of the productivity and efficiency of our processes4.260.63
G 2.2cWe collect end-of-life products and parts2.881.38
G 2.2dWe recycle waste (residues) and raw materials3.821.05
G 2.2eWe reuse (used) products and parts3.201.10
G 2.2fWe promote energy efficiency and the use of renewable energy3.551.02
G 2.2gWe adopt the best technologies and practices to reduce the environmental impacts of our processes and products3.730.95
G 2.2hWe monitor our emissions, set targets and implement actions to achieve them3.451.23
G 2.2iOur processes use closed loops, eliminating leaks and waste and minimizing the need for more raw materials and energy3.151.06
G 2.2jWe cooperate with our suppliers to establish closed loops that maximize the utilization of resources and minimize waste and environmental impacts2.981.08
G 2.2kWe cooperate with our customers to establish closed loops that maximize resource utilization and minimize waste and environmental impacts2.941.03
G 2.2lWe redesign our products aiming at environmental efficiency and increased durability3.161.06
G 2.2mWe adopt the lifecycle management approach3.161.09
G 2.2nWe segregate and value our waste (residues)3.940.95
G 2.2oWe retrieve (recover), improve, or renew used materials, products, or parts (residues)3.361.07
Table 7. Level of agreement with actions to promote CE (G 3a to G 3j).
VariableDescriptionMeanStandard Deviation
G 3aThe Circular Economy (CE) can be financed through the organizations’ own savings and benefits with their application3.560.66
G 3bThe funding (support) from investors is very important to finance the CE3.460.72
G 3cThe Government/European Union funding (incentive systems) are very important to finance the CE3.820.71
G 3dCrowdfunding is very important to finance the CE3.090..4
G 3eTax (fiscal) policy should positively discriminate the organizations that work in the CE4.030.69
G 3fThe Government should take legislative initiatives to support the CE4.000.73
G 3gAcademia should focus on the dissemination and creation of knowledge in the CE4.050.64
G 3hSpecialized Ce consultancy CE is needed3.550.64
G 3iTo apply the CE, it is enough to use existing (traditional) business models, reinforcing the reduction of consumption and energy, recycling and recovery3.140.78
G 3jThe application of the CE requires the adoption of new business models (based on recycling, reuse, recovery and on eco-design, eco-innovation, the use of “closed” cycles and cooperation along the value chain) to be successful3.880.73
Table 8. Normality tests (Kolmogorov–Smirnov and Shapiro–Wilk).
Kolmogorov-Smirnov aShapiro-Wilk
Statisticdf bSigmaStatisticdfSigma
Num_Var_1.7a0.193990.0000.904990.000
Num_Var_1.7b0.2250.872
Num_Var_1.7c0.1780.917
Num_Var_1.7d0.3320.818
Num_Var_1.7e0.2980.848
Num_Var_1.7f0.2450.868
Num_Var_1.7g0.2300.857
Num_Var_1.7h0.3100.799
Num_Var_1.7i0.3280.762
Num_Var_1.7j0.3180.806
Num_Var_2.1a0.2200.875
Num_Var_2.1b0.2450.853
Num_Var_2.1c0.2730.816
Num_Var_2.1d0.3240.783
Num_Var_2.1e0.2890.746
Num_Var_2.1f0.2590.821
Num_Var_2.1g0.1770.907
Num_Var_2.1h0.3090.794
Num_Var_2.1i0.2760.764
Num_Var_2.1j0.2240.903
Num_Var_2.1k0.2340.903
Num_Var_2.1l0.2540.887
Num_Var_2.1m0.2200.903
Num_Var_2.1n0.2530.881
Num_Var_2.1o0.1720.888
Num_Var_2.1p0.1890.905
Num_Var_2.1q0.2070.902
Num_Var_2.1r0.1770.884
Num_Var_2.1s0.1890.907
Num_Var_2.1t0.2080.895
Num_Var_2.1u0.2020.913
Num_Var_3a0.2960.806
Num_Var_3b0.2570.828
Num_Var_3c0.3090.824
Num_Var_3d0.2960.845
Num_Var_3e0.2810.816
Num_Var_3f0.2580.828
Num_Var_3g0.2990.787
Num_Var_3h0.2850.797
Num_Var_3i0.2790.861
Num_Var_3j0.2320.804
a Lilliefors Significance Correction; b Degrees of freedom.
Table 9. Chi-Square statistic and Asym. Sig. (Kruskal-Wallis test)-Dimension 1.
Num_Var (Grouping Variable)
1.21.31.51.64.1
StatisticAsym. Sig.StatisticAsym. Sig.StatisticAsym. Sig.StatisticAsym. Sig.StatisticAsym. Sig.
Num_Var (Tested variable)2.1c0.0380.98112.6000.55810.6670.058 *21.079 0.000 ***15.20.125
2.1d0.2110.90027.1990.018 **6.2880.2794.4470.21714.6380.146
2.1i0.8920.60614.5660.4085.290.38210.1140.018 **27.3340.002 **
2.1u1.0210.60014.4400.41714.2770.014 **14.0410.003 **7.9730.631
3i7.0310.030 **13.5160.4863.5830.6110.4430.9317.4840.679
3j0.1050.94920.5950.1128.8530.1159.9180.019 **16.0330.099 *
* Statistical significant at 0.1 level; ** Statistical significant at 0.05 level; *** Statistical significant at all levels.
Table 10. Chi-Square statistic and Asym. Sig. (Kruskal-Wallis test)-Dimension 2.
Num_Var (Grouping Variable)
2.1c2.1d2.1i2.1u3i3j
StatisticAsym. Sig.StatisticAsym. Sig.StatisticAsym. Sig.StatisticAsym. Sig.StatisticAsym. Sig.StatisticAsym. Sig.
Num_Var (Tested variable)2.2a20.8560.000 ***30.9890.000 ***14.6490.002 **14.3580.006 **2.6680.6155.550.062 *
2.2b30.890.000 ***36.8930.000 ***25.1710.000 ***19.5350.001 **2.3270.67611.2560.004 **
2.2c6.260.1003.6420.4576.4330.092 *13.2950.010 **1.7640.7793.2210.200
2.2d7.9890.046 **17.5640.002 **12.2620.007 **9.9770.041 **2.4390.6561.3130.519
2.2e9.3570.025 **17.4470.002 **5.5280.13712.7490.013 **3.110.5401.8320.400
2.2f14.0340.003 **13.330.010 **8.7360.033 **7.6490.1055.2010.26711.7610.003 **
2.2g20.5670.000 ***21.5880.000 ***14.4870.002 **25.2490.000 ***2.5120.6438.2060.017 **
2.2h25.4730.000 ***15.6580.004 **14.9880.002 **14.9450.005 **6.3170.1776.8310.033 **
2.2i14.9220.002 **20.9590.000 ***8.8510.031 **29.7150.000 ***3.9110.4180.9180.632
2.2j9.8790.020 **18.4210.001 **6.8590.077 *20.7810.000 ***4.4660.3470.1090.947
2.2k7.710.052 *9.0810.059 *6.6190.085 *19.7790.001 **5.1360.2740.3690.832
2.2l19.0790.000 ***17.9770.001 **14.1730.003 **14.2720.006 **0.2450.9935.7730.056 *
2.2m13.3390.004 **17.5820.001 **13.660.003 **18.0910.001 **0.8230.9353.1680.205
2.2n15.0140.002 **19.9310.001 **20.3020.000 ***16.2680.003 **3.9510.4137.1350.028 **
2.2o8.4030.038 *16.930.002 **11.2720.010 **13.3540.010 **4.4940.3430.9270.629
* Statistical significant at 0.1 level; ** Statistical significant at 0.05 level; *** Statistical significant at all levels.
Table 11. Validity of the research hypotheses.
DimensionResearch HypothesesValidityComment
Organizational goals and strategies: G 2.1c; G 2.1d; G 2.1i; G 2.1u, G 3i and G 3j H1…market in which the organization operates.
H2…activity sector where the organization operates.
H3…dimension of the organization (N° of employees).
H4…status of EMS certification.
H5…organizational role of the respondent.
Level of CE intensity (G 2.2a to G 2.2o) H6…willingness to improve the environmental performance and create environmental value (G 2.1.c).
H7…willingness to have a better access to raw materials to prevent its scarcity activity sector where the organization operates (G 2.1.d).
H8…willingness to have a sustainable business model dimension of the organization (G 2.1.i).
H9…the agreement that CE is an integral part of the organizational business model (G 2.1.u).
H10…the agreement that to apply the CE, it is enough to use the existing business models, reinforcing the reduction of consumption and energy, recycling and recovery (G 3.i).
H11…the agreement that the application of the CE requires the adoption of new business models (based on recycling, reuse, recovery and on eco-design, eco-innovation, the adoption of “closed” cycles and cooperation along the value chain) to be successful (G. 3.j).

