Higher Education Input, Technological Innovation, and Economic Growth in China


1
School of Economics, Fudan University, Shanghai 200433, China
2
School of Finance, Shanghai University of Finance and Economics, Shanghai 200433, China
*
Author to whom correspondence should be addressed.
Sustainability 2018, 10(8), 2615; https://doi.org/10.3390/su10082615
Submission received: 27 May 2018
/
Revised: 19 July 2018
/
Accepted: 23 July 2018
/
Published: 25 July 2018
(This article belongs to the Special Issue Economics of Education and Sustainable Development)
Abstract
:Based on the theoretical analysis of the relationship between China’s higher education input, technological innovation, and economic growth, this paper chooses the 1997–2015 sample data of China, and uses a vector auto regression (VAR) model to test the relationship between the three. The results show that educational input, technological innovation, and economic growth form an interaction mechanism featuring dynamic circulation. Higher education input and technological innovation are two important factors influencing economic growth. In the meantime, higher education input is an important source and driving force of technological innovation, and technological innovation will further promote economic growth. However, technological innovation has a delayed positive effect on economic growth, so higher education input demands a long-term view and thinking for quick success, and instant benefits should be avoided.
1. Introduction
For a long time, the study of the relationship between education input and economic growth is an enduring topic in theoretical circles, often with new thoughts being gained when it is discussed. The classical economic theory holds that a country’s economic growth depends mainly on capital growth, labor growth, human capital growth, and technological progress, and higher education is an important way to increase human capital. It is considered that higher education and economic development mutually influence and reinforce each other. On the one hand, higher education promotes technological innovation by improving the quality of workers, and, thus, effectively boosts economic growth. On the other hand, economic growth is the material basis and condition for education development. Economic growth can also drive the development of higher education with an increased social demand and expanded human capital. Lewis, an American economist who won the Nobel Prize in Economics, concluded that “education -based knowledge growth” is one of the three main causes of economic growth. The vector auto regressive method (VAR) provides an effective method for us to study the dynamic relationship between the three from an empirical point of view. Through the simultaneous form of multiple equations, the method regresses the lagged variable in all endogenous variables of the model to avoid the instability of a structural equation caused by the complexity of economic theory. It shows a strong applicability in the process of economic prediction and analysis.
However, in China, although there is relevant research on the relationship between education input, technological innovation, and economic growth, the research fails to provide a good answer to these questions: How does education input, especially higher education input, promote economic growth through technological innovation? How does economic growth support higher education development? Is the relationship between the three a direct or indirect mutual reinforcing relationship? How much is the degree of relevance between them? What is the mechanism of action between the three? Unfortunately, most of the relevant studies remain at the level of qualitative analysis, there are few empirical studies, and the theoretical support is insufficient, thereby reducing the reliability of the conclusions.
In this paper, higher education input, technological innovation, and economic growth are put into the same theoretical analysis framework. Based on the theoretical analysis of the relationship between the three, the relevant data in China is selected to construct the VAR model. The two-way causal relationship between higher education input, technological innovation, and economic growth is tested by Grainger. The impact of higher education input and technological innovation on economic growth is analyzed by the impulse response. Then, the contribution of higher education input and technological progress to economic growth is analyzed by a variance decomposition.
Therefore, it is of theoretical and practical significance to study this problem and initially give an answer to the interaction between higher education input, technological innovation, and economic growth in the context of China’s strategic shift from a manufacturing country to an innovation country.
The main differences between this paper and the existing research are as follows: (1) The view is unique. This paper analyzes the economic growth from the perspective of higher education and technological innovation; (2) it tries to explore the relationship between higher education, technological innovation, and economic growth and memory mechanism from the theory; and (3) it verifies the relationship between higher education, technological innovation, and economic growth by using actual data in China.
The following research contents include: The second part is a literature review and the literature is about the influence of education; the third part is a theoretical analysis, and it clarifies the relationship between higher education, technological innovation, and economic growth; the fourth part mainly studies the research method, variables, and data, and introduces the VAR model, the basis of the variable selection and data source; the fifth part analyzes the test results and conducts an in-depth analysis of the test results through the VAR model test; and the sixth part is the conclusion and suggestions. It proposes the corresponding policies and suggestions based on the summary.
2. Literature Review
Foreign scholars had an earlier start on research of the relationship between education and economic growth. There is abundant relevant research, but a clear controversy exists on whether education promotes economic growth.
Schultz (1956) [1] found that education played an important role in the growth of American agricultural production after the war, and then put forward the theory of human capital. Denison (1996) [2] estimated the contribution of education to US economic growth using the growth accounting method, finding that the contribution rate of education expenditure to national income growth was 13.7% during the period of 1929–1982. Lucas (1988) [3] established an endogenous growth model that illustrates the mechanism of education action on economic growth, and he believed that people should be encouraged to invest in education and learning to gain more human capital to promote sustained economic growth. On this basis, that human capital input affects technological progress and has a long-term effect on economic growth has been demonstrated in many endogenous growth models. For instance, Glomm and Ravikumar (1998) [4] and Blankenau and Simpson (2004) [5] expounded the internal operation mechanism of government education expenditure, human capital, and economic growth from the public education investment point of view. Barro (1991) [6] demonstrated that the economic growth of 98 countries between 1960 and 1985 was highly dependent on the initial level of human capital, which was measured by the enrollment rate and GNP per capita. Mankiw et al. (1992) [7] further extended the Solow model by introducing human capital, with education as the standard, into the model and found a significant contribution of human capital to economic growth. Gylfason and Zoega (2003) [8] found that education promotes economic growth not only by raising human capital, but also by raising material capital and social capital. Blankenau and Simpson (2004) [5] established an endogenous model of human capital-driven economic growth. Studies have shown that the impact of public education spending on economic growth is nonmonical within a certain range, depending on government investment and construction, expenditure levels, tax structures, and technological production parameters. Research by Hanushek and Woessmann (2012) [9] based on organization for economic co-operation and development (OECD) panel data shows that education can significantly contribute to economic growth. Studies by Barro and Lee (2013) [10] based on the panel data of 146 countries suggests that education plays a significant role in promoting economic growth.
Crespo Cuaresma, Doppelhofer, and Feldkircher (2014) [11] used a Bayesian model averaging (BMA) to find robust determinants of economic growth between 1995 and 2005 in a new data set of 255 European regions. They found that income convergence between countries is dominated by the catching-up of regions in new member states in Central and Eastern Europe, whereas convergence within countries is driven by regions in old European Union member states. Regions containing capital cities are growing faster, particularly in Central and Eastern European countries, as do regions with a large share of workers with a higher education. The results are robust when allowing for spatial spillovers among European regions. Pustovrh and Jaklic (2014) [12] argued that innovation policy research can benefit from utilizing new research methods as they might lead to different policy recommendations. They demonstrated this by using a set-theoretic fuzzy-set qualitative comparative analysis (fsQCA) method to analyze the data on innovation policies in the European Union (EU). It shows that the use of correlation-based statistical methods is not appropriate for the evaluation of innovation policies due to their causally complex nature that correlational statistical methods cannot unravel. This paper demonstrates this by focusing on the special importance of linkages among actors and innovation commercialization through entrepreneurship, and the notion that they represent a necessary condition for innovation success. Results confirm that the single factor of linkages and entrepreneurship is the necessary condition for innovation success, thus, emphasizing the importance of an open innovation framework for innovation policy-making. Results also show three combinations of sufficient conditions (but no single factor) lead to innovation success. They confirm the causal complexity of innovation policy and confirm that using different research methods leads to different policy recommendations.
Ferreira and Dionísio (2016) [13] analyzed the relation between the level of innovation and the economic effects and applied a fuzzy-set qualitative comparative analysis to study the relation between six conditions and two different outcomes. The data came from the Union Innovation Scoreboard. The study found that research systems, linkages and entrepreneurship, and intellectual assets are necessary conditions for the outcomes of a high level of innovation and positive economic effects. The main sufficient condition for both outcomes is a good research system. Ferreira and Dionísio (2016) [14] used a crisp-set qualitative comparative analysis of data from European Union countries to establish which conditions could be considered necessary and sufficient to make these countries converge. Based on six different conditions (GDP, secondary education, life expectancy, fertility rate, government consumption, and inflation rate), this study found that the main conditions affecting convergence are the government consumption ratio (lower levels will increase convergence), education levels, and life expectancy (both with a positive influence on convergence). The first two conditions show quite interesting results: In fact, a reduction of government expenditure and budget constraints are an open debate; and the European Union’s aim to become a more competitive economy can only be attained with higher levels of education.
Walheer (2016) [15] extended the previous approach by considering a multi-sector setting. This setting allows the proposal of a more realistic and complete country-level analysis, while keeping the same advantages as previous methodology offer. Walheer also tackled the criticism of less reliable data at the sector level than at the country level by showing how the multi-sector approach can easily be adapted. They applied it to OECD countries in the period of 1995 to 2008. The results confirmed the non-neutrality of technological change. It was also found that capital accumulation plays the biggest role in the increase of output-labor productivity, while technological change and human capital accumulation also play an important role, but it is twice as small as capital accumulation. Barro’s (2016) [16] research showed that China cannot deviate forever from the global historical experience, and the per capita growth rate is likely to fall soon from around 8% per year to a range of 3–4%. China can be viewed as a middle-income convergence-success story, and China’s transition from a middle- to upper-income status should not be hindered by a middle-income trap, which seems not to exist.
In contrast, Benhabib and Spiegel (1994) [17] argued that human capital, as measured by workers’ years of education, cannot effectively explain an increase in per capita output. Brauninger and Vidal (1999) [18] found that, on the one hand, education spending improves average skills of individuals, thus, contributing to economic growth, but, on the other hand, education spending crowds out the accumulation of material capital, and weakens the effect of learning by doing, which is not conducive to growth. Bils and Klenow (1996) [19] argued that, in any case, the positive correlation between education and output growth cannot indicate that education affects economic growth. On the contrary, education and output growth may be promoted by the total factor growth, which is neglected by us in this study. Coincidentally, Pritchett (2000) [20] has also proved that the length of education time as a variable has little effect in explaining cross-border economic growth. Temple (1999) [21] argued that human capital cannot explain its significant relationship with growth very well due to the presence of many outsiders. Horii et al. (2008) [22] proved that a higher level of education improves personal income, but its long-term effect on economic growth is not so clear. Blankenau et al. (2007) [23] argued that, based on panel data from 23 developed countries and 57 developing countries, education spending has a strong catalytic effect on the economic growth of developed countries, but has no significant impact on the economic growth of developing countries.
In China, study on education input, technological innovation, and economic growth has also attracted scholars’ attention. According to the principle of knowledge spillover, Huang Yanping (2013) [24] used a metrological regression model to analyze different effects of education at different levels on China’s economic growth, and argued that both higher education and primary education promote economic growth, and, in the present stage, primary education plays a better role than higher education in economic growth. Second, education expenditure’s effect on GDP is a long-term accumulation process because the Chinese government’s education spending is at a low level, and its positive effect on economic growth has not yet been shown. Tang Weibing et al. (2014) [25] pointed out that the foreign capital imitation effect and technology spillover are beneficial to improvement in the intensification of economic growth, and that technological innovation is negatively correlated with the intensification level of economic growth owing to the ability of digestion and absorption, technical gap, and so on. Moreover, the role of technological innovation and economic growth is unclear depending on specific samples. Li Miaomiao et al. (2015) [26] found that there is a long-term equilibrium co-ordination between technological innovation and economic growth, with China’s technological innovation as the direct cause of economic growth. Empirical studies by Wang Shuqiao et al. (2015) [27] showed that there is a long-term equilibrium relationship between technological innovation, higher education input, and economic growth. In the second order of the time lag, technological innovation and higher education input are the Granger reasons for economic growth, with both positively promoting economic growth in the long term, and technological innovation being the driving force of economic growth. However, there is a certain lag.
To sum up, the impact of education input and technological innovation on economic growth is still controversial. Although there are also Chinese scholars’ empirical tests of the relationship between the three, to clarify the relationship between them, appropriate theoretical support is lacking. To this end, this paper incorporates education input, technological innovation, and economic growth into the same theoretical framework, tests the correlation between them based on the theoretical analysis of the interaction mechanisms of the three, and then explores the dynamic evolution mechanism and interaction between the three.
3. Theoretical Analysis
The interaction between educational input, technological innovation, and economic growth can be analyzed from the following three levels.
3.1. The Relationship Between Education Input and Technological Innovation
Technological innovation is the driving force of social and economic development, while education is an important way for knowledge precipitation and accumulation in technological innovation. The first step is to improve the quality of personnel through education input, gradually increasing the accumulation of human capital, and, thus, promoting technological innovation and progress (Figure 1).
3.2. The Relationship Between Technological Innovation and Economic Growth
Although neoclassical economics recognizes the role of technological innovation in economic growth, it treats the endogenous variable of technological innovation as an exogenous variable, fails to distinguish the source of technological progress, and exaggerates the promoting role of technological innovation in economic growth. The new economic growth theory holds that technological innovation is mainly affected by factors, such as human resource accumulation and human resource level, and establishes different analysis models according to the depth and breadth of analysis. As economic growth theory has gone through a long period of development, it has many genres and analysis methods. However, it has currently reached a consensus on the understanding that technological innovation is the core driving force of economic growth. Technological innovation and economic growth interact as both cause and effect, mutually promote and contain each other, and also form a two-in-one relationship. That is, technological innovation and economic growth are intertwined, the two synchronously change in the same direction, and such a relationship shows the promoting role of technological innovation in economic growth. First, the process of achieving technological innovation is to achieve economic growth, and technological innovation is not a means, but a purpose to promote economic and social development. Second, technological innovation and economic growth come one after the other, technological innovation is reflected in the results of economic activity, and technological innovation must be demonstrated by economic growth. Finally, there is a correspondence between technological innovation and economic growth. Different stages of technological development correspond to corresponding stages of economic development, and different levels of economic development in developed countries and developing countries are the result of technological innovation at different stages.
3.3. Interaction Between Education Input, Technological Innovation, and Economic Growth
It can be known from the above analysis that education input and economic growth are not in a simple causal relationship, education input will not directly lead to economic growth, but will ultimately affect economic growth through the accumulation of human capital and technological innovation, and the affecting process is a dynamic circulation. Therefore, the relationship between educational input, technological innovation, and economic growth is relatively complex. For the sake of a more intuitive effect, Figure 2 is used to illustrate the relationship between the three.
It can be seen from Figure 2 that, first, the accumulation of human capital can be increased through education input. Secondly, human capital accumulation, to a certain extent, will bring technological innovation and progress. Furthermore, technological innovation and technological progress will further promote economic growth. Finally, economic growth makes more education input possible. A further increase in education input will begin a new round of circulation, promoting technological innovation once again through the accumulation of human capital, and, thus, promoting economic growth. This is a spiral escalating, self-strengthening process. In this circulation, although education input is not directly related to economic growth, because of the accumulation of human capital and technological innovation, economic growth will eventually be promoted. At the same time, economic growth can create conditions for education input, which shows that economic growth means a direct and positive support for education input. Thus, education input, technological innovation, and economic growth form an interaction mechanism, featuring dynamic circulation.
4. Methodology, Variables, and Data
4.1. Methodology
Vector auto-regression (VAR) is a typical used econometric model, which was created by Christopher Sims in 1980 (Christopher, S., 1980) [28]. In the economic system, each endogenous variable is considered as a function of the entire system, and the endogenous variable’s hysteretic value is used to construct a model by VAR, forecasting the time-series system among them, and analyzes the dynamic impact caused by random disturbance on the variable system to explain various economic impacts on the formulation of economic variables (Tiemei, G., 2009) [29]. It is a generalization of AR model, which has been widely used currently.
Vector auto-regression (VAR) is a model based on the statistical properties of data; it constructs the model by considering every endogenous variable in the system as a function of the hysteresis value of all endogenous variables in the system, and then generalizes the univariate autoregressive model to a “vector” autoregressive model composed of multivariate time series variables. VAR is one of the easiest models to deal with regarding the analysis and prediction of multiple relative economic indexes, and, under certain conditions, is formulated by the models of multivariate Moving Average Model (MA) and Auto-Regressive and Moving Average Model (ARMA). It has drawn increasing attention from business administrators in recent years, hence, the VAR model was chosen as the subject to study in this paper.
The basic mathematical expressions for the VAR (p) model are:
where is the column vector of the k-dimensional endogenous variable, is the column vector of the d-dimensional exogenous variable, p is the lag intervals for the endogenous, T is the number of samples, dimension matrix and dimension matrix η are the coefficient matrixes to be estimated, and is the K-dimensional perturbed column vector. The above expression can also be expanded as follows:
Compared with ordinary simultaneous equations, the VAR model deals with all variables as endogenous variables, reducing the uncertainty in the simultaneous equation model due to subjective error and eliminating the prediction of endogenous variables in the process of establishing common simultaneous equations. In addition, VAR also embodies its unique superiority in the following aspects: (1) It is relatively easy to estimate parameters; (2) the model has a wide range of applications, since the VAR model is not based on financial economics theory, it can, to a large extent, have other explanatory variables be added to it; and (3) the advantages of forecasting as the predicted results of a small and reasonably set VAR model are usually better than that of a larger, structured simultaneous system, especially for short-term predictions. This is because AR models can often avoid the effects of constraints imposed to ensure the identifiable nature of structural models. While, on the other hand, it only describes the interaction between variables in the lagging period and their current period, and neglects the structural relationship between them, affecting the accuracy of the study to some extent due to the structural relationship between relative economic variables hidden in the random perturbation term. However, it does have an advantage in its forecasting
4.2. Variables and Data
The paper focuses on the relationship among higher education investment, technological innovation, and economic growth, employing an empirical study on their causal relationship as well as the dynamic influence among them. The quantity of patent authorizations and patent applications are the most common two indexes to reflect the technical innovation level. Because the patent authorization quantity is influenced by human factors, such as government organization, the number of patent applications authorized is selected as the proxy variable to measure technological innovation. While the proxy indexes for economic growth and higher education input will be expressed by using the current measured GDP and the national financial education funds, respectively.
Based on the comprehensive consideration of the above factors, data from 1991 to 2016 are selected as the sample for this study. They come from the corresponding year of such books as the “China Statistical Almanac”, “Chinese Education Fund Statistics Yearbook”, and “Chinese Education Statistics Almanac”, and are studied empirically on the basis of unifying solutions to the annual growth rate of the variable, with the symbols of GDP, Budget, and Patent to represent the current annual growth rate of the GDP, the annual growth rate of national fiscal education funds, and the annual growth rate of patent application authorizations, respectively.
The variation trend of the above variables is expressed in Figure 3.
From the analysis of Figure 3, we can simply see that over the years from 1998 to 2008 the annual growth rate of the GDP, as measured by the current price, is rising, with some fluctuations. In the meantime, the national financial education fund growth rate also appears to be increasing, but there is a slight uplift in the fluctuation range of the growth rate of the patent application quantity. It is noteworthy that the annual growth rate of the GDP, the growth rate of the national financial education fund, and the growth rate of patent application authorizations have shown the same fluctuation trend, while in a downward trend since 2009.
5. Analysis of Test Results
5.1. Variable Unit Root Test
Time series were employed for the paper’s empirical test, which must be checked prior to the model establishment and analysis to avoid pseudo regression between variables. If the sequence is stable or is a stationary sequence, that is, the same order single integer sequence, that can be acquired after the same difference operation, then the subsequent modeling analysis begins. In this paper, we used the common unit root test method, Augment Dickey-Fuller (ADF), to test the time series and implemented this with the operation of the Eviews7.2 software. The results are shown in Table 1.
Based on the ADF unit root test, we found that the sequence of this empirical test under the 10% confidence level satisfies the single integer serial or the first order serial. As per the requirements for series stability, the original sequence or the first order difference sequence can all be used to formulate the Vector Autoregression (VAR model.
5.2. Estimation of VAR Model
To study the interaction among higher education investment, technological innovation (progress), and economic growth, and further decomposition of the impact of various factors, as well as the changes in the short-term and long-term influences, we used the first-order difference of the annual growth rate of the GDP as well as the authorized number of patent applications and the original value of the national financial education funding growth rate as endogenous variables to construct the three-factor VAR model, with the parameters estimated by the Eviews7.2. software. The consequences are as follows:
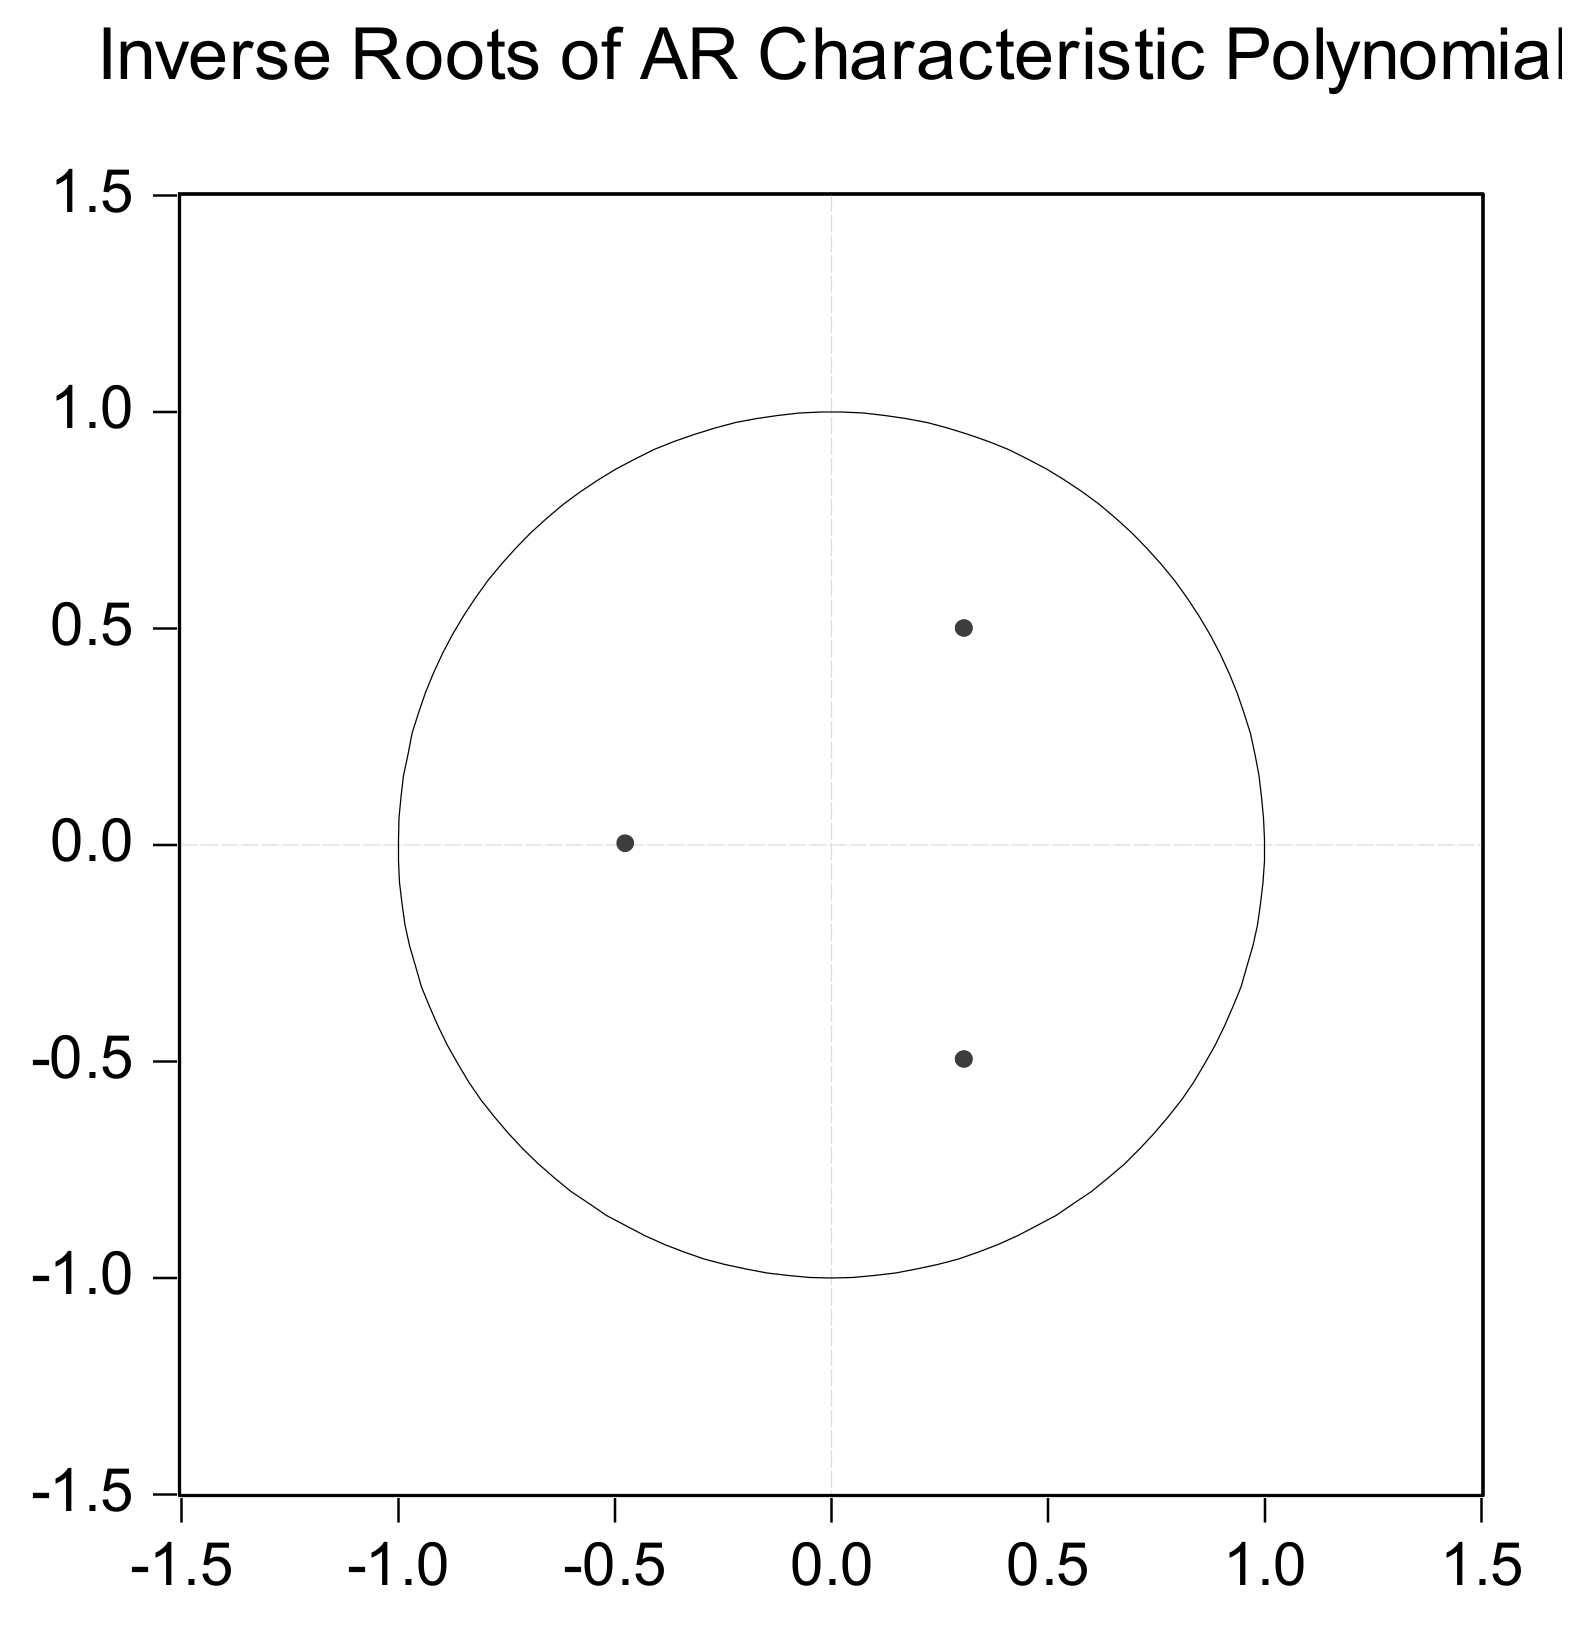
Since the VAR model establishes a dynamic system and does not make a strict distinction between the dependent variable and the independent variable, we do not focus on the significance of the unilateral process. However, the estimated results still show that the equations in the model have good significance (see Table 2). The results of the stationary test of the VAR model show that all the characteristic roots of the model are in the unit circle (Figure 4), so the model is a stationary VAR model. Combining the internal relationship of the economic system, the VAR model we selected is a model with a lag order of 1. Therefore, we can further analyze the relationship between variables based on the VAR model.
5.3. Granger Causality Test
The Granger causality test is a statistical explanation of the relationship between variables, which is essentially a test of whether a variable’s lag variable can be introduced into other variables’ equations. We have used the stationary sequence to establish the VAR model, and verified its stability. Considering this, we also carried out the Granger causality test to distinguish between endogenous variables and exogenous variables. The results are shown in Table 3.
The Granger causality test of the VAR model we set up shows that the first-order difference of the annual growth rate of the patent application authorizations and the annual growth rate of the national financial education fund are the Granger causes of the first-order difference of the GDP annual growth rate, and, in turn, the first-order difference of the GDP annual growth rate is also the Granger reason of the annual growth rate of the patent application authorizations and the change of the yearly growth rate of the national financial education funds. The results of the Granger causality test supported our analysis theoretically. Meanwhile, the significance of the causal relationship between variables also supported categorizing the three variables as endogenous variables to establish the VAR model. Considering this, we believe that this research has some value in its analysis.
5.4. Impulse Response Function and Variance Decomposition
The results of the stationary test of the VAR model show that all characteristic roots of the model are in the unit circle (Figure 4). That is why it is a stationary VAR model, and, simultaneously, the Granger causality test verifies that the first-order difference of the annual growth rate of the patent application authorizations and the annual growth rate of the national fiscal education funds are the Granger reasons for the alteration of the annual growth rate of the GDP. Therefore, considering this, the paper proceeds with the implementation of the impulse response and variance decomposition in the effect of the first-order difference of the annual growth rate of patent applications and the annual growth rate of the national fiscal education funds.
Based on establishing the VAR model, we use the impulse response function (Impulse Response Function, IRF) to analyze the feedback of the first order difference value of the annual GDP growth rate on one unit when the perturbation term of an endogenous variable is added to different dimensions.
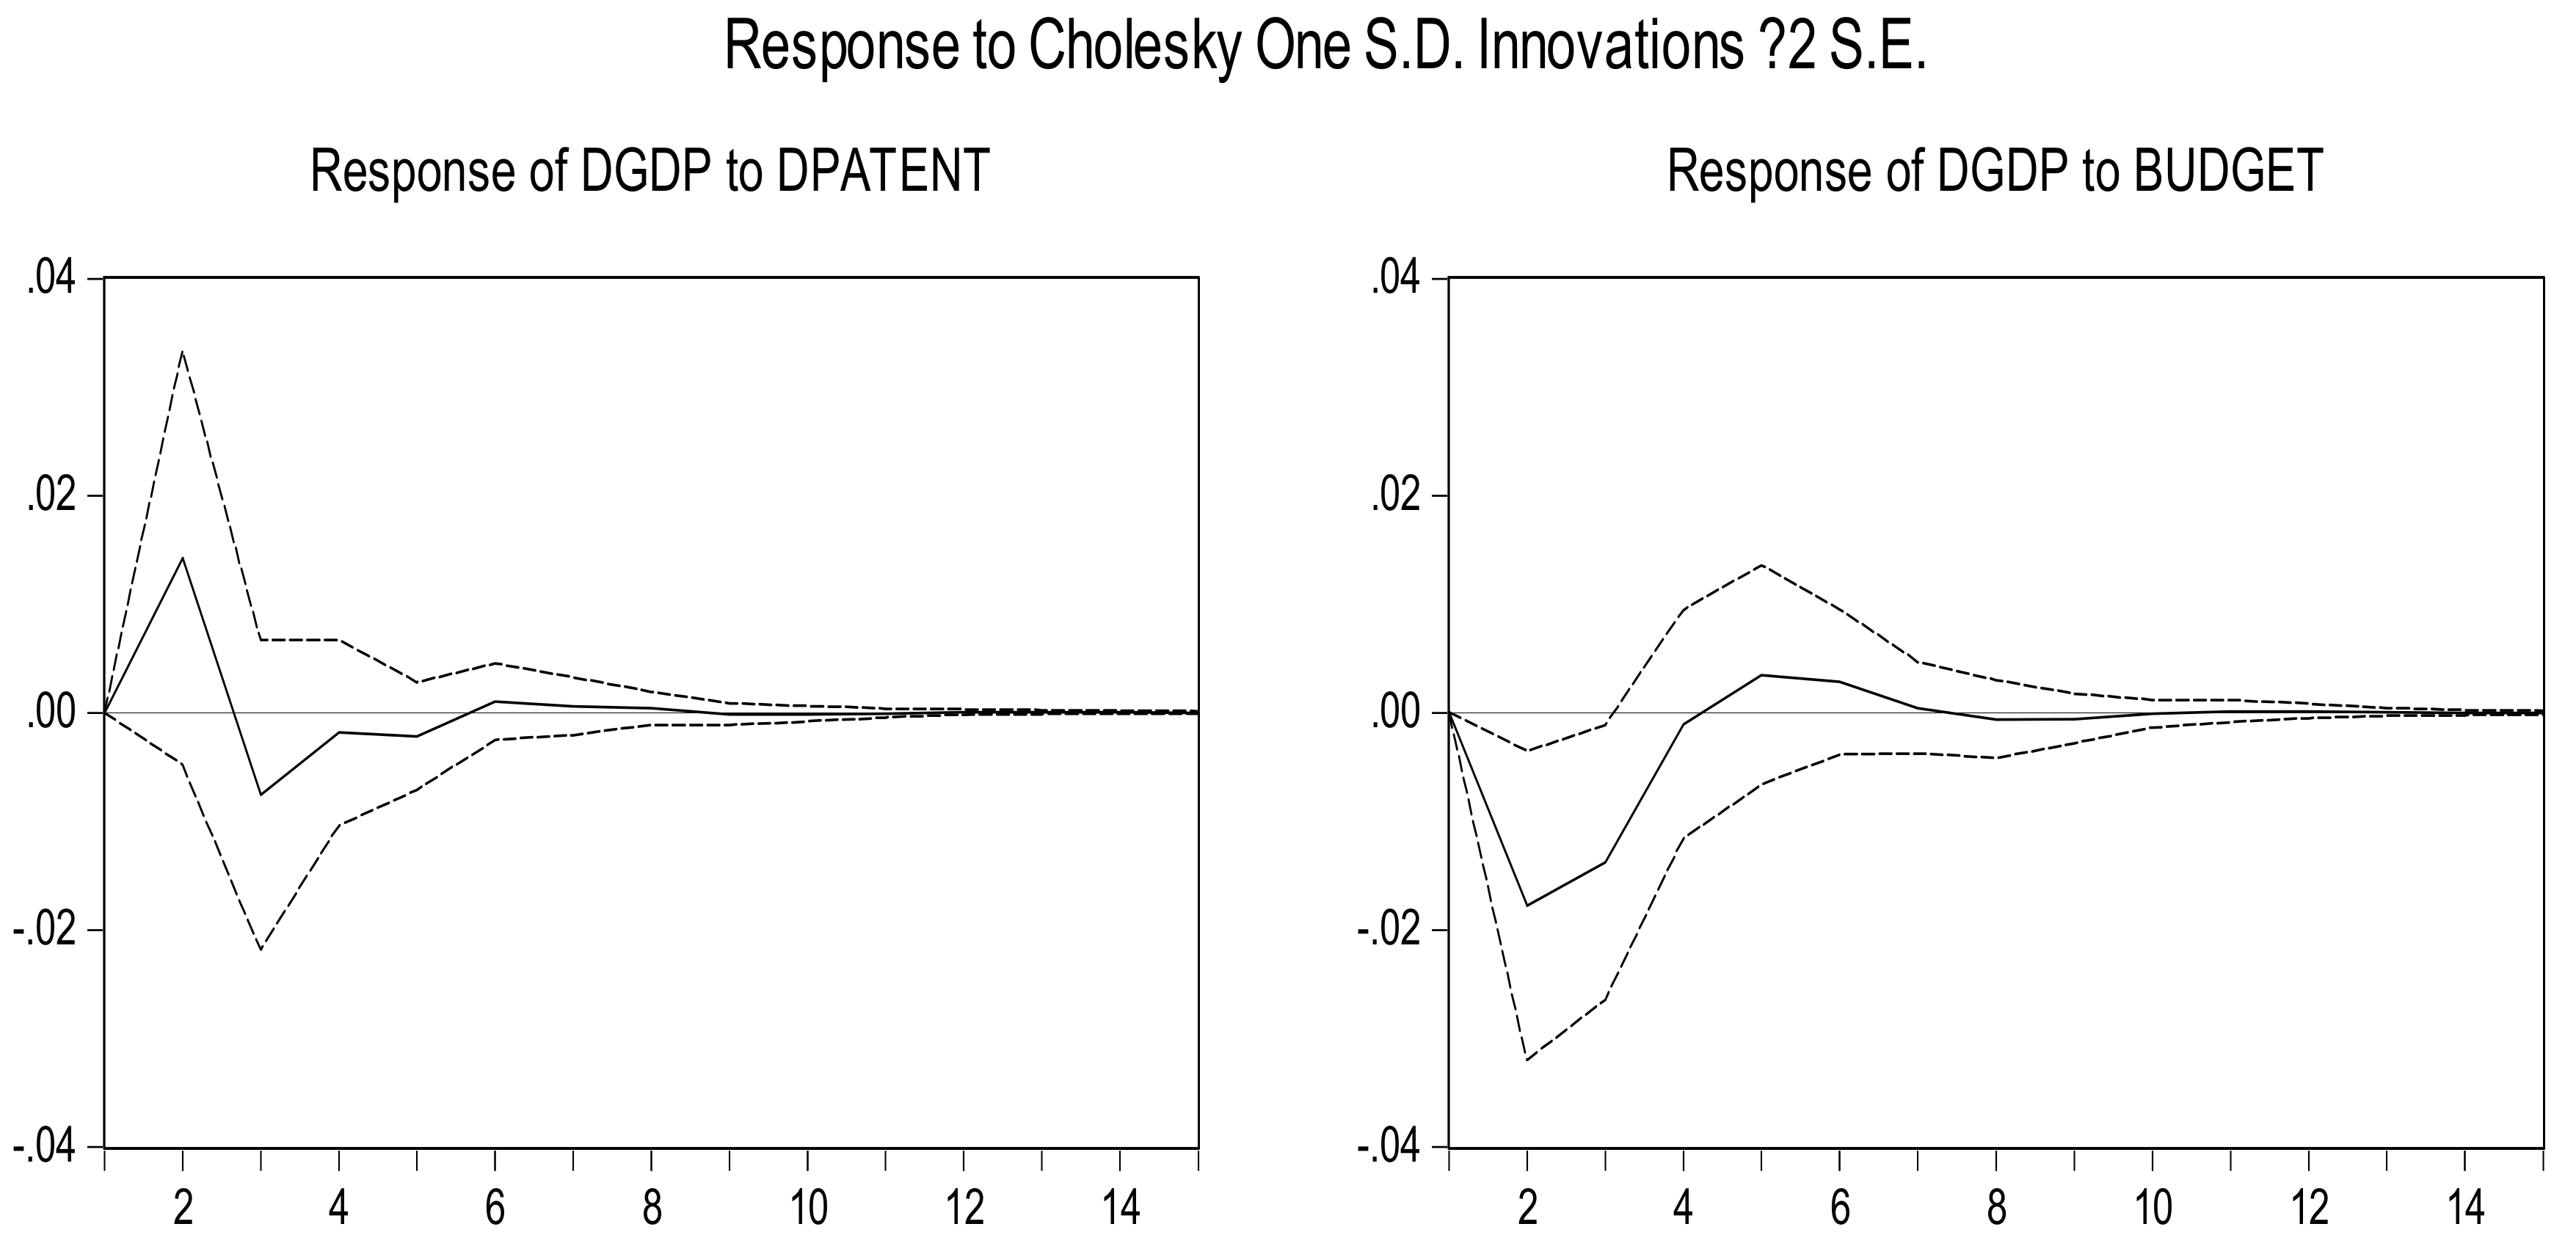
Figure 5 reflects the effect of a positive impulse reacting to the first-order difference in the annual growth rate of patent applications and the annual growth rate of funding for higher education on the influence of the first-order difference of the annual growth rate of the GDP at different time dimensions. From the perspective of impact time, the growth rate of patent application authorizations and the annual growth rate of national financial education funds have a more obvious medium and long-term effect on economic growth, and the influence can last for about eight periods.
From the angle of influence, patent applications and national fiscal education funds tend to fluctuate in their growth rate, in which the growth of patent application authorizations leads to a direct increase of the GDP growth rate, and produces a positive cumulative effect in the medium and long term. Expanding of the national financial education funds generally needs to be transformed by technology to trigger GDP growth, while the growth of patent application authorizations has a more direct impact on the growth rate of the GDP. We have verified that the change in the growth rate of national financial education funds is the Granger reason for the variation in the number of patent applications. As seen from the impulse map, the increase of the national financial education funds’ growth rate imposed a positive effect on GDP growth after the fourth period.
To further the analysis of the contribution of each structural impact to the growth rate of the GDP, and the evaluation of the importance of each impact at different time dimensions, we used the method of variance decomposition to decompose the contribution of the annual growth rate of patent applications and the annual growth rate of higher education funds to the GDP growth rate.
Considering the results of the variance decomposition, as shown in Table 4, there is an evident inertia reaction to the GDP growth rate caused by its own innovation, or the innovation from the growth rate of patent applications the national financial education funds. At the beginning of the ninth period, the GDP growth rate remains at a stable level, with the strongest effect from its own innovation, which is kept at 74% or above. The effect of innovation from the change in the number of patent applications is close to 9%; while in the state’s financial education fund it is close to 17%. In summary, out of the two factors that we examined, the change in the national financial education funds’ growth rate has a stronger influence on the GDP growth rate.
6. Discussion
(1) How does education input, especially higher education input, promote economic growth through technological innovation? Technical innovation is the power source of social and economic development, and education is an importance approach to technical innovation, knowledge precipitation, and accumulation. Therefore, education input, especially higher education input, improves personnel quality, increases the accumulation of human capital gradually, and, thereby, promotes technical innovation and progress. Furthermore, the kernel variable technology, which determines economic growth, has innovation and progress, which inevitably accelerates economic growth. Meanwhile, different technical development phases correspond to corresponding economic development phases. Different economic development levels of developed countries and developing countries are the result of technical innovation at different stages. Thus, education input, especially higher education input, accelerates economic growth through technical innovation.
(2) How does economic growth support higher education development? This can be analyzed from two aspects for the influence of economic growth on the development of higher education. Firstly, economic growth provides a material basis for the coordinated development of education. To a certain extent, education refers to the activities that form through the basic form of human capital investment, and are cultivated and trained for the ability of labor according to a plan. From this point of view, the investment and operation of education can be regarded as an input and output process of an industry. From the perspective of the main body of the burden, educational cost can be divided into two parts: Social cost and personal cost. The expansion of higher education requires an increase in the related inputs. For the sake of the coordinated development of education, it is essential to ensure long-term and sustained educational input, which must be based on sustained and stable economic growth. Secondly, economic growth has a restrictive and guiding role in educational development. The level of economic development determines the scale, content, organization form, teaching methods, and educational means of education, which also determines the quality of labor and the quality of education and training of qualified personnel. Fundamentally, as an activity to cultivate people, education is an important part of social development, whose development is ultimately restricted by the level of economic development. The level of economic development determines not only the quantity of education investment, but also the supply of educational investment, which will inevitably require the scale and speed of education at all levels to match the scale and speed of economic development, and to be coordinated in quantity.
(3) Is the relationship between the three a direct or indirect mutual reinforcing relationship? Education input and economic growth is not a simple causal relationship. Education input does not cause economic growth directly. Instead, it conducts economic growth through the accumulation of human capital and technical innovation. Moreover, the conductive process is a dynamic cyclic process. In the circulation, although education input and economic growth do not have a direct relationship, they promote economic growth ultimately through the conduction of human capital accumulation and technical innovation. At the same time, economic growth can also create conditions for education input, which shows that economic growth has a direct and positive supporting effect on education input. As a result, there is a dynamic and periodic interactive mechanism among the three.
(4) How much is the degree of relevance between them? From the Grainger causality, scientific and technological progress and education input are the causes of economic growth. Conversely, economic growth will also lead to scientific and technological progress and educational input. From the impulse response, investment in science and technology and education has obvious long-term effects on economic growth, while the effects can last for about eight phases. Furthermore, from the direction of the influence, the impact of scientific and technological progress and educational input on economic growth shows a trend of repeated fluctuations. Among them, scientific and technological progress directly stimulates economic growth in the short term and has a positive, cumulative effect in the medium and long term. After the fourth phase, higher education investment has a positive impact on the economic growth rate. From the degree of contribution, economic growth is affected by its own innovation, technological progress, and new input into education, which has an obvious inertia and is stable at the beginning of the ninth phase. From a comprehensive view, the progress of science and technology has a stronger impact on economic growth.
(5) What is the mechanism of action between the three? Education input, technical innovation, and economic growth have a direct or indirect interactive relationship. Education input can increase the accumulation of human capital. The accumulation of human capital, to a certain extent, will result in technical innovation and progress. Furthermore, technical innovation and progress also promotes economic growth. Then, economic growth has more possibilities for education input. If we increase education input further, they will enter a new cycle. Moreover, it promotes technical innovation through the accumulation of human capital and, thereby, accelerates economic growth. Thus, it is a helical and self-reinforcing process. Technical innovation and economic growth not only have the relationship of reciprocal causation, which promotes and restricts each other, but also have a two-in-one relationship, which means technical innovation and economic growth are intertwined. The two synchronously change in the same direction. The relationship manifests the role of technical innovation in promoting economic growth.
7. Conclusions
Through the above analysis, the following basic conclusions can be obtained.
Higher education input and technology are two factors that affect economic growth. The test results show that indicators representing higher education spending and indicators of technological innovation are continuing, influencing factors of economic growth fluctuations, either in the short or long term, and both have made contributions that cannot be ignored. It is noteworthy that the impact of superposition of higher education input and technological innovation has a certain long-term nature, which does not diminish over time, but has increased to some extent, which is in line with our theoretical analysis that higher education input and technological transformation and innovation go through a process of accumulation, transfer, and transformation to ultimately affect economic growth. As seen from the direct relationship, increases in higher education input is a driving force for technological innovation, and technological innovation is a factor for economic growth. As seen from the analysis of the impulse response results, primary technological innovation provides a cumulative positive effect on economic growth, which slowly decays over time and has a strong long-term nature that corresponds with the general rule of the gradual elimination of introduced new technology.
Education input and economic growth are not in a simple causal relationship, and education input will not directly lead to economic growth, but will ultimately affect economic growth through the accumulation of human capital and technological innovation, and the affecting process is a dynamic, self-reinforcing, circular process. Higher education input is an important source of technological innovation, and the positive effect of technological innovation on economic growth can only be shown over a long time. Therefore, higher education input demands a long term view and thinking for quick success, and instant benefits should be avoided.
Author Contributions
G.Z. performed the theory analysis and contributed to drafting this manuscript. S.L. conceived and empirical analysis. The authors share equal contribution.
Funding
The research is supported by the National Natural Science Foundation of China (No. 71573050; No. 71573170), the Shanghai Social Science Fund (No. 2015BJB003).
Acknowledgments
The authors would like to thank the anonymous reviewers and editors for commenting upon this paper.
Conflicts of Interest
The authors declare no conflict of interest.
References
- Schultz, T.W. Agriculture and the Application of Knowledge, A Look to the Future; W. K. Kellogg Foundation: Battle Creek, MI, USA, 1956; pp. 54–78. [Google Scholar]
- Denison, E.F. The Sources of Economic Growth in the United States and the Alternatives before US; Committee for Economic Development: New York, NY, USA, 1996. [Google Scholar]
- Lucas, R. On the mechanics of economic development. J. Monetary Econ. 1988, 22, 3–42. [Google Scholar] [CrossRef]
- Glomm, G.; Ravikumar, B. Flat-Rate Taxes, Government Spending on Education and Growth. Rev. Econ. Dyn. 1998, 1, 306–325. [Google Scholar] [CrossRef]
- Blankenau, W.F.; Simpson, N.B. Public education expenditures and growth. J. Dev. Econ. 2004, 73, 583–605. [Google Scholar] [CrossRef]
- Barro, R.J. Economic Growth in a Cross-Section of Countries. Q. J. Econ. 1991, 2, 407–443. [Google Scholar] [CrossRef]
- Mankiw, N.G.; Romer, D.; Weil, D. A Contribution to the Empirics of Economic Growth. Q. J. Econ. 1992, 107, 407–438. [Google Scholar] [CrossRef]
- Gylfason, T.; Zoega, G. Education, Social Equality and Economic Growth: A View of the Landscape. Econ. Stud. 2003, 4, 557–579. [Google Scholar] [CrossRef]
- Hanushek, E.A.; Woessmann, L. Do Better Schools Lead to More Growth? Cognitive Skills, Economic Outcomes, and Causation. J. Econ. Growth 2012, 17, 267–321. [Google Scholar] [CrossRef]
- Barro, R.J.; Lee, J.W. A New Data Set of Educational Attainment in the World, 1950–2010. J. Dev. Econ. 2013, 104, 184–198. [Google Scholar] [CrossRef]
- Cuaresma, J.; Doppeihofer, G.; Feldkircher, M. The Determinants of Economic Growth in European Regions. Reg. Stud. 2014, 1, 44–67. [Google Scholar] [CrossRef] [Green Version]
- Pustovrh, A.; Jaklic, M. National innovation policies in the EU: A fuzzy-set analysis. Econ. Bus. Rev. 2014, 1, 39–62. [Google Scholar]
- Ferreira, P.; Dionísio, A. What are the conditions for good innovation results? A fuzzy-set approach for European Union. J. Bus. Res. 2016, 11, 5369–5400. [Google Scholar] [CrossRef]
- Ferreira, P.; Dionísio, A. GDP growth and convergence determinants in the European Union: A crisp-set analysis. Rev. Econ. Persp. 2016, 4, 279–296. [Google Scholar] [CrossRef]
- Walheer, B. Growth and convergence of the OECD countries: A multi-sector production-frontier approach. Eur. J. Oper. Res. 2016, 2, 665–675. [Google Scholar] [CrossRef]
- Barro, R.J. Economic Growth and Convergence, Applied to China. China World Econ. 2016, 5, 5–19. [Google Scholar] [CrossRef]
- Benhabib, J.; Spiegel, M.M. The Role of Human Capital in Economic Development: Evidence from Aggregate Cross-Country Data. J. Monetary Econ. 1994, 34, 143–173. [Google Scholar] [CrossRef]
- Brauninger, M.; Vidal, J.P. Private versus Public Financing of Education and Endogenous Growth. J. Popul. Econ. 1999, 13, 387–401. [Google Scholar] [CrossRef]
- Bils, M.; Klenow, P.J. Does Schooling Cause Growth or the Other Way Around? NBER Work. Pap. 1998, 5, 1160–1183. [Google Scholar]
- Pritchett, L. Where Has All the Education Gone? World Bank, Policy Research Working Paper No. 1581. December 2000. Available online: https://sites.hks.harvard.edu/fs/lpritch/Education%20-%20docs/ED%20-%20Econ%20Growth,%20impact/where%20has%20all%20the%20education%20gone.pdf (accessed on 24 July 2018).
- Temple, J. The New Growth Evidence. J. Econ. Lit. 1999, 1, 112–156. [Google Scholar] [CrossRef]
- Horii, R.; Kitagawa, A.; Futagami, K. Availability of higher education and long-term economic growth. Jpn. Econ. Rev. 2008, 2, 156–177. [Google Scholar] [CrossRef]
- Blankenau, W.F.; Simpson, N.B.; Tomljanovich, M. Public Education Expenditures, Taxation and Growth: Linking Data to Theory. Am. Econ. Rev. 2007, 97, 393–397. [Google Scholar] [CrossRef]
- Huang, Y.; Liu, Y.; Wu, Y.; Li, W. Economic Growth and Regional Inequality in China: Effects of Different Levels of Education. Econ. Res. J. 2013, 4, 94–105. (In Chinese) [Google Scholar]
- Tang, W.; Fu, Y.; Wang, Z. Technology Innovation, Technology Introduction and Transformation of Economic Growth Pattern. Econ. Res. J. 2014, 7, 31–43. [Google Scholar]
- Li, M.; Xiao, H.; Zhao, S. Study on the Relationship among the Financial Development, Technological Innovation and Economic Growth: Based on China’s Provincial Panel Data. Chin. J. Manag. Sci. 2015, 2, 162–169. [Google Scholar]
- Wang, S.; Wang, H.; Yin, J. Educational Investment and Technological Innovation and Economic Growth. Educ. Res. Mon. 2015, 5, 14–19. [Google Scholar]
- Sims, C.A. Macroeconomics and Reality. Econometrica 1980, 1, 1–48. [Google Scholar] [CrossRef]
- Tiemei, G. Econometric Analysis Methods and Modeling—Eviews Application and Examples; Tsinghua University Press: Beijing, China, 2009; p. 269. [Google Scholar]
Figure 1.
The relationship between education input and technological innovation.

Figure 2.
Interaction mechanisms between educational input, technological innovation, and economic growth.
Figure 2.
Interaction mechanisms between educational input, technological innovation, and economic growth.

Figure 3.
Vibration trend of variables.

Figure 4.
VAR stability test.

Figure 5.
Economic growth response function caused by the impact of the quantity of patent application (Left) and the funding for higher education (Right).
Figure 5.
Economic growth response function caused by the impact of the quantity of patent application (Left) and the funding for higher education (Right).


Table 1.
Augment Dickey-Fuller (ADF) Variable unit root test results.
| Variable | Test Form (I,T,P) | ADF Test Value (t Statistics) | Probability | Test Results (the Data Showed Significant at 5%) | Test Results (the Data Showed Significant at 10%) |
|---|---|---|---|---|---|
| (I,N,0) | −2.335673 | 0.0046 | Stable | Stable | |
| (I,N,0) | −4.266645 | 0.0503 | Unstable | Stable | |
| (I,N,2) | −2.127141 | 0.0644 | Unstable | Stable | |
| (I,N,1) | −4.258338 | 0.0004 | Stable | Stable | |
| (I,N,1) | −4.440905 | 0.0003 | Stable | Stable | |
| (I,N,1) | −4.181977 | 0.0000 | Stable | Stable |
Note: (1) I and T in the teaching and research form represent the constant term and the trend term, N means that the test equation does not have the term, and p represents the lag order determined by the AIC (Akaike Info criterion); (2) ∆ represents a first-order difference calculation for a variable.
Table 2.
Vector auto-regression (VAR) Variables statistical characteristics and model significance.
| 0.02392 | 0.18030 | 0.03007 | 0.12455 | 0.401332 | |
| [2.15027] | [1.71957] | [2.26145] | [−2.69744] | ||
| 0.15488 | 1.16736 | 0.19471 | 0.80640 | 0.358301 | |
| [0.03250] | [−1.91926] | [−3.08070] | [−0.16921] | ||
| 0.03423 | 0.25803 | 0.04304 | 0.17824 | 0.454796 | |
| [2.87985] | [2.47129] | [−0.39295] | [2.45284] |
Note: The first row is the standard deviation of the estimating coefficient. The square brackets ([ ]) contain the statistics of the estimating coefficient.
Table 3.
Vector auto-regression (VAR) Granger causality test results.
| Equation | Primary Hypothesis | Degree of Freedom | P Value | Testing Results | |
|---|---|---|---|---|---|
| dPatent cannot Granger cause DGDP | 5.114158 | 1 | 0.0237 | Reject ** | |
| Budget cannot Granger cause DGDP | 7.276193 | 1 | 0.0070 | Reject ** | |
| , both cannot Granger cause | 12.26413 | 2 | 0.0022 | Reject ** | |
| cannot Granger cause | 3.683571 | 1 | 0.0550 | Reject * | |
| Budget cannot Granger cause | 0.028634 | 1 | 0.8656 | Accept | |
| , both cannot Granger cause | 3.875851 | 2 | 0.1440 | Accept | |
| cannot Granger cause | 6.107287 | 1 | 0.0135 | Reject ** | |
| cannot Granger cause | 0.154413 | 1 | 0.6944 | Accept | |
| , both cannot Granger cause | 7.632743 | 2 | 0.0220 | Accept |
NOTE: ** means to reject the original hypothesis at 5% confidence, * to reject the original hypothesis at 10% confidence level.
Table 4.
dGDP variance decomposition.
| Variable | Period | |||
|---|---|---|---|---|
| 1 | 100.0000 | 0.0000 | 0.0000 | |
| 3 | 74.40299 | 8.685590 | 16.51024 | |
| 5 | 74.70537 | 8.615701 | 16.67893 | |
| 7 | 74.61637 | 8.586434 | 16.79719 | |
| 9 | 74.59861 | 8.588031 | 16.81336 | |
| 13 | 74.59897 | 8.587961 | 16.81307 | |
| 17 | 74.59895 | 8.587963 | 16.81308 | |
| 20 | 74.59895 | 8.587963 | 16.81308 |
© 2018 by the authors. Licensee MDPI, Basel, Switzerland. This article is an open access article distributed under the terms and conditions of the Creative Commons Attribution (CC BY) license (http://creativecommons.org/licenses/by/4.0/).
Share and Cite
MDPI and ACS Style
Zhou, G.; Luo, S. Higher Education Input, Technological Innovation, and Economic Growth in China. Sustainability 2018, 10, 2615. https://doi.org/10.3390/su10082615
AMA Style
Zhou G, Luo S. Higher Education Input, Technological Innovation, and Economic Growth in China. Sustainability. 2018; 10(8):2615. https://doi.org/10.3390/su10082615
Chicago/Turabian StyleZhou, Guangyou, and Sumei Luo. 2018. "Higher Education Input, Technological Innovation, and Economic Growth in China" Sustainability 10, no. 8: 2615. https://doi.org/10.3390/su10082615
Note that from the first issue of 2016, this journal uses article numbers instead of page numbers. See further details here.