The Relationship between Unbilled Accounts Receivable and Financial Performance of Construction Contractors


1
Department of Civil and Environment Engineering, Seoul National University, 1 Gwanak-Ro, Gwanak-Ku, Seoul 08826, Korea
2
The Institute of Construction and Environmental Engineering (ICEE), 1 Gwanak-Ro, Gwanak-Ku, Seoul 08826, Korea
3
Korea Research Institute for Construction Policy, 13F Specialty Con. Bldg., 15 Boramae-ro 5-gil, Dongjak-gu, Seoul 07071, Korea
4
Department of Building, National University of Singapore, 4 Architecture Drive, Singapore 117566, Singapore
*
Author to whom correspondence should be addressed.
Sustainability 2018, 10(8), 2679; https://doi.org/10.3390/su10082679
Submission received: 17 June 2018
/
Revised: 23 July 2018
/
Accepted: 25 July 2018
/
Published: 31 July 2018
(This article belongs to the Special Issue Sustainable Construction, Development and Management in the Built Environment)
Abstract
:Operating profit is one of the most important measures in financial statements to evaluate a organizational performance. In the construction industry, however, the profit has a possibility to be misestimated as a loss and can be included in Unbilled Accounts Receivable (UAR) and shown as a profit; this is due to the uncertainty of predicting a total construction cost and project progress on which the calculation of profit is based. UAR results from the different perceptions regarding project progress between clients and contractors and can include costs related to loss that cannot be acknowledged as a progress. Therefore, UAR can be a significant clue to understanding estimation errors of a contractor’s financial performance data. This study investigated the possibility of estimation error of contractors’ operating profit by analyzing the relationship between UAR and other relevant financial performance measures. The accounting data of 41 Korean major contractors was collected and analyzed based on the correlation analysis. The results of this study implies that the profit of construction companies has the possibility to contain estimation errors, causing a significant variance in the process of adjusting the evaluation errors at the end of projects, which can cause unexpected losses to investors. In addition, this study found that the UAR containing estimation errors could be different depending on market in which contractors operate; therefore, when dealing with contractors’ financial performance data, it is necessary to discern whether their profit data contains distortion and, in the case that errors are included, appropriate data preprocessing should be conducted for more reliable and sustainable construction investment and project management.
1. Introduction
In the accounting of construction companies, the perception of revenue is based on the principle of accrual accounting, which states that revenues and expenses are recognized when services and products are completed—even in the absence of a cash transaction [1,2], as the time when contractors perform construction activities and the time of the price related to those activities, are not always coincided [3,4]. In accrual accounting, it is appropriate to take into account the organization’s performance during a specific period [2,5]. However, in many cases, overall construction project durations are longer than the accounting period; therefore, it is difficult to measure the performance of contractors’ production activities using the accrual accounting if it is based on the completed contract method, in which revenue is recognized when construction projects are completed [6]. Therefore, a contractor’s revenue and profit are generally perceived—based not on the completion of construction projects but on a percentage of completion (POC) [7].
However, even in this case, there is a difficulty to reflect a contractor’s performance accurately and in a timely manner due to the ambiguity in the definition of project progress, on which the calculation of the revenue and profit is based [8]. This ambiguity results from the various types of construction project activities whose progress cannot be measured using a single consistent criterion [9,10] and it is also related to the uncertainty in the estimation of the total construction cost for calculating the project progress [8,11,12]. Thus, the accounting of construction companies utilizing the POC method have a possibility that losses incurred during construction projects are not reflected in their financial performance in a timely manner, and are instead, included as profits. In this case, those who utilize the financial data of construction companies can make poor decisions based on the wrong information provided.
Unbilled accounts receivable (UAR) can arise from a difference in the perception of project progress between contractors, who claim construction costs corresponding to tasks undertaken, and construction project owners, who should pay those costs to the contractors based on a project contract [5]. Therefore, in the case that the costs are incurred due to construction failures (i.e., losses) that have no impact on construction progress and are not paid by clients, these costs remain in the UAR as these costs are incurred and cannot be invoiced to owners [13]. If these loss-related costs are not reflected in calculating an estimated total construction cost and adjust a POC, it can be shown as profit that contractors obtain. For this reason, UAR is important in determining the estimation errors in contractors’ financial performance [14]. Nevertheless, relatively few studies have focused on UAR and the possibility of erroneous estimation in contractors’ financial performance.
As such, this research examines the estimation errors in contractors’ financial performance by analyzing the relationship between UAR and various performance measures in contractors’ financial statement. To do this, first, a review of the literature regarding the progress calculation and payment methods used in construction projects is provided, in order to examine the possibility that losses can be included in UAR and shown as profits in contractors’ accounting and to establish the hypotheses on the relationship between UAR and financial performance measures. Second, the paper outlines analysis variables used to test the hypotheses and the data related to those variables that were collected from contractors’ financial statements. Finally, the findings from the statistical analyses carried out during the hypotheses testing are presented and the characteristics of financial performance in the accounting of construction companies are examined.
2. Preliminary Study
2.1. Unbilled Accounts Receivable in Construction Contractor Accounting
Large-scale construction projects take a relatively long time to complete, compared to products or services of other industries [15]. Therefore, if a contractor’s revenue and profit are recognized based on the completed contract method (CC), it becomes difficult to evaluate the construction organization’s performance in a continuous manner [16,17]. Therefore, a construction organization’s profits are calculated according to the percentage-of-completion (POC) method, which means the degree to which a construction project has been completed [16,17,18].
However, owners’ and contractors’ perspectives may not align in terms of how to evaluate the progress of construction projects [6]. Taking a contractor’s point of view, to be paid for construction works as soon as possible is an advantageous way to manage their finances [19]. On the other hand, taking the perspective of an owner, whose purpose is focused on managing their contractors to obtain facilities that meet their requirements, it is better to pay after they get a solid outcome or to pay in a way that maximizes the performance of construction projects [19]. Such a perspective on payment causes a difference in time when owners assent a project progress rate.
In the case where the amount of revenue that a contractor perceives based on the POC is in excess of the payment amount according to the owner’s contract, the difference is included as a UAR, which is defined in the International Accounting Standards 11 (IAS 11) Construction Contracts [9] as the gross amount due from customers for contract work. If, however, the amount of revenue evaluated by a contractor is less than the amount payable by the owner, the difference is referred to as an “overbilled accounts receivable”—defined in the IAS 11 [20] as the gross amount due to customers for contract work. As UAR is defined as the difference between the amount of a contractor’s earned revenue (ER) and owner’s payment (OP) according to the contract, as illustrated in Equation (1), the UAR is determined depending on the payment method and the POC method:
2.1.1. Payment Method in Construction Projects
The payment method of construction projects can be divided into two typical methods: a periodic payment method and a milestone payment method [19,21]. A periodic payment is a method of calculating the amount of construction work for a specific period and paying periodically (mainly by month). This method is advantageous for the construction company in managing their cash flow [19,22]; however, it is difficult to calculate the amount to be paid to the construction company using this method [21,23]. A stage and milestone payment is a method of paying a predetermined amount according to the completion of the main events (stage and milestone), determined under agreement between an owner and a contractor [23]. In addition to these two payment methods, the payment method can be modified and combined depending on the circumstances of the construction project. Generally, the later the payment time point is postponed, the larger the amount of UAR is sustained during the construction project [6]. On the other hand, if there is little disagreement between an owner and contractor regarding progress, or if the contractor receives advanced payments, the UAR decrease or overbilled receivables occur.
2.1.2. Percentage-of-Completion
In the IAS 11, the POC calculation methods are categorized into two groups: a cost-based method and a value-based method. One of the representative cost-based methods is a cost-to-cost method, which defines the POC as the proportion of an actual construction cost in an estimated overall construction cost [24]. The examples of value-based methods mentioned in the IAS 11 [20] are a value-added method and a unit-completed method. In the value-added method, the POC is regarded as the proportion of the value of construction works completed to date in relation to the total value of the contracted construction works. The unit-completed method is a method of comparing the total quantity of construction and the work-in-progress to date by using a physical unit, such as the quantity of material and the area and capacity of a facility [25].
As the UAR is an amount that has not been agreed upon between a contractor and an owner, it is distinguished from the accounts receivables, which is agreed on but not paid. In addition, as UAR does not result from a delay or the inability of an owner to pay, they are included in revenue and profits in the accounting system. UAR is fair and can take place during construction projects in a variety of ways depending on the project situation; they generally converge to zero at the end of construction when the project is completed as planned, without problems [6,17,26].
2.2. Causes of Abnormal Profit Recognition
As mentioned previously, if a construction project is performed as planned without any change, the amount of the unbilled accounts receivable becomes zero at the end of the project, where the owner’s and contractor’s perception of progress is the same [6]. However, when an unexpected loss occurs during a construction project, the loss can be included in UAR and shown as a profit through a UAR if the losses are not reflected in the calculation of an estimated total construction cost. This leads to the amount of the losses included in a profit being transferred to a loss at the completion of a construction project.
Under the POC method, a contractor’s earned revenue (ER) is calculated as the product of the POC and the contract price (CP), as shown in Equation (2). In addition, the contractor’s earned operation profit (EP) can be obtained using the proportion of planned profit in the (CP); that is, the EP is calculated from the product of the ER and the planned profit rate that comes from the proportion of the estimated overall construction cost (EOPC) and the CP (Equation (3)) [27]. Therefore, the EP has a proportional relationship with the ER and increases as the POC increases:
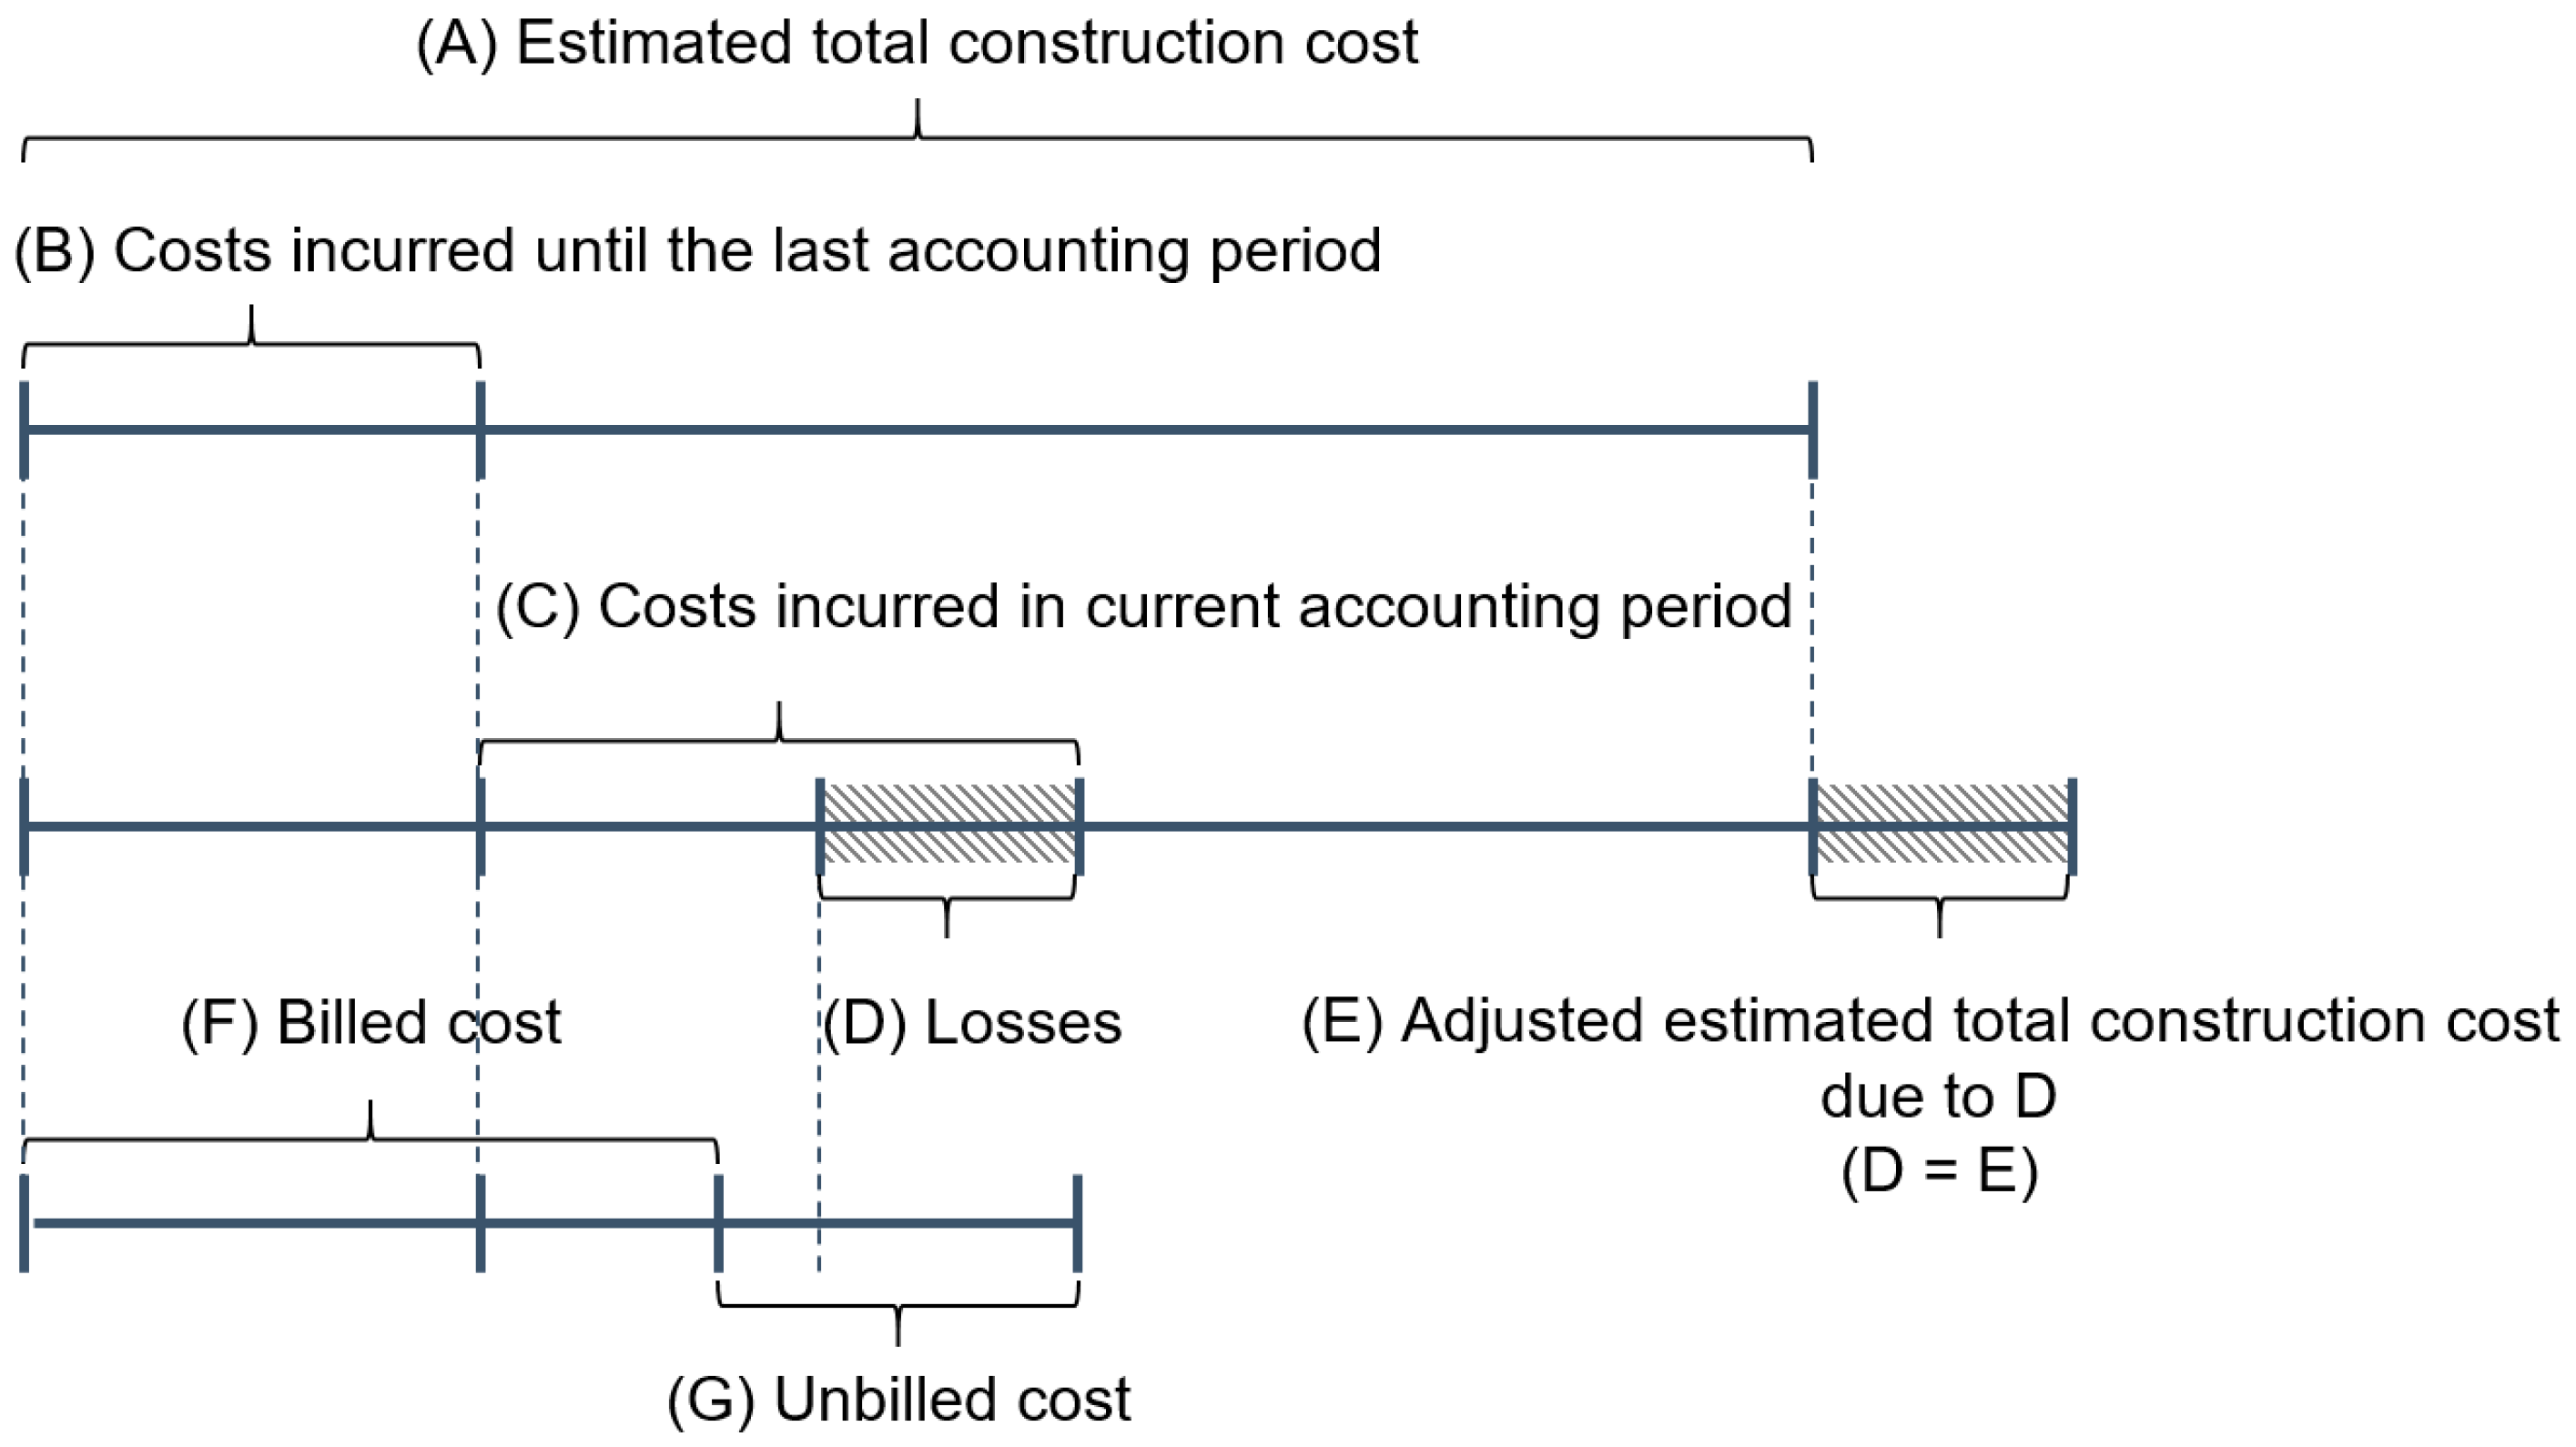
Assuming that a loss that does not have any impact on the progress of a construction project, as illustrated in Figure 1, the amount of the loss is included as a UAR, because the loss is included in construction costs. Theoretically, when such losses occur, the profit for that period should be calculated based on the newly adjusted the profit rate because the estimated overall construction cost should increase as much as the loss and the profit rate should decrease with this change (Equation (3)). However, in many cases it is difficult to promptly change the estimated overall construction cost due to the difficulty of loss recognitions in a timely manner.
As construction projects involve various types of uncertainties, a variability exists in the performance of construction works even if repetitive works of the same type are carried out [25,28]. The estimated total construction cost is calculated by contractor based on a contractor’s work performance that is the most likely or the average [29]. In this case, it would be undesirable to adjust the estimated total construction cost according to short-term variations of costs in individual work performances in the early stages of the project, because those changes may be part of the variability and can be balanced by other changes [30,31,32]. However, unlike the initial plan, if losses in construction works continue to increase, an adjustment of the estimated total construction cost should be considered. However, there is no clear criteria for project managers to recognize losses. It makes project managers difficult to estimate a total project cost in a prompt manner [25,33]. In addition, there are invisible factors, the losses of which are difficult to be calculated quantitatively until the end of a construction project. One representative example is the liquidated damage that has to be paid by contractors if they cannot complete their construction project within the term of construction contract [25,29]; however, it is difficult for contractors to estimate the cost of schedule delays incurred to date during constructions even though they can have a significant impact on a contractor’s profit in the form of liquidated damages [34,35]. If the adjustment of the overall project cost is delayed or inappropriate, the losses incurred during that period are recognized as revenue without the adjustment of the estimated total construction cost, and the losses are misrecognized as profit based on the unadjusted profit rate, and recorded in contractors’ financial statement. Moreover, the estimated total construction cost can be intentionally underestimated or overestimated based on a contractor’s strategies and perceptions of risk [36,37,38]. As shown in Figure 2, the POC may increase significantly if the estimated total construction cost is estimated to be low and the contractor’s profit changes accordingly.
However, to determine the total project cost is underestimated or overestimated, it is necessary to obtain the various types of activity-level information related to the cost and schedule of construction projects. However, it is not easy for external investors and even stakeholders other than the contractor to acquire the relevant information [39,40]. Consequently, even if the estimated overall construction cost is determined on the basis of the arbitrary judgment of the contractors, it is difficult for external organizations to perceive and figure out this. In addition, the accounts related to a contractor’s revenue, profit, and UAR show the sum of the financial results of multiple construction projects undertaken during different periods, which makes it even more difficult to determine whether the profits of individual construction projects have been evaluated properly.
3. Research Hypotheses
As noted, there is the possibility that the profit generated by carrying out construction projects may be evaluated incorrectly due to the systematic problems of calculating the profit based on the construction progress and total project cost. This can provide inaccurate information and data to those who analyze a contractor’s performance using its financial statement. Therefore, it is important to demonstrate the possibility that the profit can contain errors using the financial data and to investigate the characteristics of the distortion.
First, this study analyzes the relationship between a contractor’s financial performance and UAR, which is the only account able to include the estimation errors. As mentioned above, the UAR results from the difference in owner’s and contractor’s perception of project progress; however, it is also possible that they contain improperly evaluated profits. For example, in the case that the amount of UAR is zero (i.e., when there is no difference in a project progress between a contractor and a client), it is less likely that UAR and profits will include losses in the accounting process. Conversely, the UAR may simply be caused due to a difference in perception or due to the inclusion of unexpected losses that cannot be admitted as project progress by the owners. Moreover, in this case, the amount of the misestimated profit may be bigger than the actual profit. Therefore, by analyzing the relationship between UAR and various types of performance measure in a contractor’s financial statement, it would be possible to induce whether the profit of contractors contains the estimation errors.
In addition, the amount of the UAR can vary depending on contractors’ market strategies. The amount of the UAR is affected by a contract method regarding payment [9], which can be different according to the construction type, project location, and practice and law regarding contracts. As these factors can have a relationship with construction markets (i.e., construction project type and region), there is the possibility that UAR will relate to what market the contractor’s revenue and profit are generated; in other words, what type of market strategies contractor’s business is implementing, for example focusing on domestic markets compared to international markets. If there is a significant relationship between the UAR and a contractor’s market strategy, then understanding the relationship can provide meaningful insights into the characteristics of the distortion of contractors’ financial performance. Accordingly, this study attempts to identify the relationship between contractors’ amount of profit and UAR.
More specifically, this study set two hypotheses as follows.
Hypothesis 1 (H1.)
An operating profit in construction contractors’ financial statement can contains estimation errors though UAR including losses.
Hypothesis 2 (H2.)
An unbilled accounts receivable in construction contractors’ financial statement varies depending on what type of construction markets contractors focused on.
4. Research Methods and Data Collection
Analysis Design and Methodology
In order to verify the two hypotheses, this study developed research models and analyzed them utilizing construction companies’ financial data. As the first step of the analyses, this study investigated a correlation between UAR and contractors’ financial performance. If UAR is attributed to only a difference in recognition of the project’s progress, the amounts recorded in the account will be paid to a contractor as the construction project progresses; therefore, there will be no relationship between UAR and financial performance. On the other hand, if losses account for a large proportion of the UAR there may be a relationship between UAR and financial performance, since any loss can directly affect profits.
For the analysis, this study used two types of financial performance measures related to the business activities of enterprises: operating profit and cash flow from operating activities. Operating profit is a measure of the performance of recognized business activities over a specific time period, whereas cash flow from operating activities refers to the total amount of cash that a company has acquired through business activities during that period [41]. Because cash flow from operating activities is based on the cash transaction, it is difficult to accurately determine contractors’ performance using the cash flow [42,43]; however, the amount of the cash flow is difficult to include estimation errors [42]. Therefore, using the mean value of the long-term data of those two measures —even though it is difficult to consider the occurrence of short-term events that have an impact on performance—this study evaluates contractors’ operating performance relatively reliably.
The study then analyzed a correlation between the level of UAR and the variability of financial performance measures in order to determine whether losses have been appropriately evaluated to estimate profits. If a contractor’s losses are included in a large proportion of their UAR and these losses are not immediately reflected in their profits, significant changes can be made in the process of correcting a not-reflected loss as a loss. To confirm this, this study analyzed the variability of two financial performance measures: operating profit and cash flow from operating activities. Operating profit may include misrecognized losses and can change in value as this is adjusted. However, the cash flow from operating activities is cash-based and has a less possibility to include misrecognized profit. Therefore, even if there is a misrecognized profit, the variability of the cash flow will not be related to the UAR.
Finally, this study analyzed the relationship between contractors’ UAR and their market strategies. The market in which construction companies conduct construction projects can be classified according to various criteria, such as location, type, stage, and scale of the construction project [44,45]. In this study, a correlation analysis was conducted focusing on two factors—region and project type—which are expected to be directly related to the different perceptions of owners and contractors regarding project progress, which can affect UAR.
In this study, a correlation analysis was mainly performed to figure out the relationship between UAR and financial performance measure. The main purpose of this research is to find an evidence for losses abnormally included in profit through UAR rather than to develop a model that can estimate UAR accurately as other types of statistical methods (e.g., regression analysis and structural equation model) do. In addition, multivariate analysis methods cannot calculate the relationship between dependent and each independent variable accurately if multicollinearity exists between independent variables [46]. Therefore, in this study, correlation analysis can be considered more suitable to examine the relationship of individual financial variables measured in a quantitative manner based on the accounting methods.
5. Research Variables
5.1. Average Unbilled Accounts Receivable (AUAR)
In order to directly compare the size of UAR held by various contractors whose financial scales are different, this study used the proportion value of the annual UAR of the i-th year divided by the annual revenue (AR) of the same year, defining the average of those values during the data collection period (N) as the level of the UAR held by the contractor. The equation of AUAR is as follows:
5.2. Average Financial Performance
To analyze a contractor’s financial performance, this study used two types of data: (1) annual operating profit (OP) and (2) annual cash flows from operating activities (CF). Similar to UAR, the size of these two measures are not directly comparable due to their different finance scales. Therefore, this study used the proportion of financial performance variables, OP and CF, divided by the revenue (AR) at the same period (the i-th year) and defined the average value of each measures during the data collection period (N) as the contractor’s financial performance level. The following equations (Equations (5) and (6)) show the calculation methods for the average operation profit (AOP) and the average cash flow (ACF), respectively.
5.3. The Volatility of a Contractor’s Financial Performance
In addition, in order to measure the volatility of a contractor’s financial performance, namely annual operating profit (OP) and annual cash flows from operating activities (CF), the standard deviation of the annual change and the size of the annual maximum change of those values were used. The standard deviation (SDOP) and maximum change (SDMC) of OP are defined in Equations (7) and (8), respectively, and Equations (9) and (10) shows the standard deviation (SDCF) and maximum change (MCCF) of CF.
5.4. Contractors’ Market Strategies
To analyze the relationship between contractors’ market strategies and their UAR, this study utilized the data on the composition ratio of revenue by region and construction project type. Laws and customs related to construction contracts that affect construction vary by region and country. However, most contractors’ financial statements do not show the amount or its ratio to total revenue by country. Rather, these are often categorized by region, such as North America, Europe and Asia; however, these regional classifications are also different for each company. Therefore, the region of market is divided into two groups: the domestic market and overseas market. In addition, the company’s market strategy by construction type is categorized into three groups: (1) infrastructure construction; (2) building construction and (3) power and industrial plant construction. Similar to Average Unbilled Accounts Receivable (AUAR) in Equation (4). The annual revenue (RI) of each abovementioned item (k) was divided by annual total revenue (AR) of the same year (the i-th year) to calculate the average value (AMS) during the data collection period (N). The equation is as follows:
6. Data Collection
The data used for analysis were collected from annual financial statements of Korean contractors. The revenue and profits of smaller construction companies that undertake a single construction project are likely to be affected by external market conditions and order volumes. Therefore, in order to select companies that can maintain a relatively stable financial status regardless of other internal and external influences, data were collected from the top 50 contractors in the Evaluation System of the Contractor’s Construction Capacity (ESCCC) [47]. The ESCCC, based on Framework Act on the Construction Industry of South Korea, evaluates Korean contractors annually based on company performance, financial status, construction technical ability, and credibility.
Financial data from 2010 to 2015 were collected from these companies because the introduction of the data collection period was from 2010 to 2015. This period is when the International Financial Reporting Standards (IFRS) were introduced and when UAR was included in financial statements in Korea. Among the above-mentioned contractors, those companies that did not disclose their financial statements, including their UAR, or that recorded impaired capital during the analysis period, were excluded from the data. As a result, 41 data samples with the 11 measurement variables explained above were calculated from the non-consolidated annual financial statements of 41 contractors, as outlined in Table 1.
7. Results and Discussions
7.1. Analysis 1: Relationship between Unbilled Accounts Receivable and Financial Performance Measures
Using the collected data, the correlation analyses were performed to examine the relationship between the size of UAR and the financial performance measures. As the results in Table 2 show, first, the average operating profit (AOP) and UAR shows moderately strong negative correlation (r = −0.443), which means that the average operating profit (AOP) tends to be lower for companies that maintain high levels of UAR. As aforementioned, UAR is caused by two different factors: (1) the difference in perception of the progress rate and (2) the occurrence of losses that cannot be invoiced. If the UAR were generated by only the project progress perception gap, it would be difficult to explain a correlation between the profit (AOP) and UAR. On the other hand, in the case where the UAR includes a high proportion of losses, even if those losses are recognized as profit in the short term, they will be adjusted in the long term. Therefore, the higher the proportion of losses included in UAR, the less the AOP, which is long them average profit of construction companies, and the stronger the correlation between them. Thus, the extent of a negative correlation between UAR and AOP implies the extent to which contractors’ UARs includes losses.
In addition, the analysis result shows that the cash flow from operating activities (ACF) has a negative correlation with UAR, even though the correlation is less strong (r = −0.357) than the average operating profit (AOP). Even if a company’s profitability is high, short-term cash flow may not be high depending on the situation. However, if the cash flow shows a low value in the long term, this mean that the company’s profitability is poor. Similar to the relationship between the UAR and AOP, if the UAR is caused not only by the difference in perceptions regarding project progress but also by losses that cannot be claimed from owners, the ratio of the long-term average value of the cash flow from operating activities (ACF) will be low, because the UAR of the contractors will contain losses. Therefore, the extent of the negative correlation between UAR and ACF can be considered as a proportion of the UAR is due to losses incurred in construction projects.
In the analysis of the relationship between the size of UAR and the standard deviation of the operating profit (SDOP), signifying the volatility of the operating profits, the result shows a weak positive correlation between them (r = 0.359). As shown in the first two analyses, a large proportion of UAR can be considered as losses. If the loss incurred is adjusted without a delay as a result of re-evaluating the overall project cost—in other words, if no loss is misestimated as a profit in the accounts—there is no correlation between the volatility of the annual operating profit and the size of the UAR. However, in the opposite case, the losses can have a large impact on the operating profit on the process of recalculate losses included in profits at the end of the construction project. Thus, the positive correlation between UAR and the variation of annual operating profit can be considered as an evidence that the losses included in the UAR is not reflected immediately in the operating profit, resulting in a significant volatility in the contractor’s profits. Not only is the standard deviation positively correlated with the size of the UAR, so is the maximum change of the annual operating profit (MCOP), which confirms the above claim even though its correlation coefficient and p-value is not as significant as the SDOP (r = 0.280 and p = −0.034). In the same manner as the SDOP, this correlation also implies that an error exists when evaluating a contractor’s operating performance when using the annual or shorter operating profit data.
On the other hand, in the analyses of the correlation of the level of UAR with the standard deviation and maximum change of the cash flow, the p-value was 0.115 and 0.095 respectively and, consequently, their correlations were not established. Cash flow from operating activities is calculated on the basis of cash actually paid by customers, unlike operating profits. Thus, cash flow has the disadvantage of not being able to reflect all of a contractor’s operating performance for a certain period of time; however, it has the advantage that it is difficult for the operating performance to be distorted. This means that there is no adjustment of profit due to misrecognizing losses. As a result, regardless of whether a UAR is generated by a loss or the difference in perceptions of project progress, it is difficult to find a logical basis for a significant correlation between the size of UAR and the cash flow from operating activities. Therefore, the results of this analysis can be considered reasonable, and support the validity of the aforementioned claims that contractors’ operating profits can be distorted and cause a variability.
In summary, the first hypothesis (H1) that UAR can be related to the losses included in the profit of construction companies was confirmed by analyzing the correlation between six financial performance measures of contractors and UAR. These results show that the UAR of the 41 Korean contractors include losses and that the volatility of operating profits was related partially to their abnormally estimated profit. Thus, when a short-term financial performance of construction contractors is analyzed utilizing annual or quarterly operating profits, in the case that the six financial performance measures show a correlation with UAR as shown in the analysis above, the possibility that the operating profits are overestimated or underestimated should be considered.
7.2. Analysis 2: Relationship between Unbilled Accounts Receivable and Market Strategy Measures
Next, a correlation analysis was conducted to determine the relationship between UAR and contractors’ market strategies (AMS). In this study, the correlation between UAR and revenue in oversea market was not calculated separately, because the proportion of oversea market revenue in total revenue is proportional to that of domestic market revenue. The results are shown in Table 3. First, the proportion of revenue from domestic construction projects to total construction revenue has a moderate correlation with UAR (r = −0.507). Therefore, the construction companies that carry out their project mostly in their domestic market have a small amount of UAR relatively. In other words, the UAR of contractors could be high if they concentrate their business on oversea markets. Therefore, the operating profit of domestic market-oriented construction companies has a less possibility that losses are included in the operating profit.
This can be attributed to the difference in institutional regulations or customs depending on the country regarding the payment of construction costs. However, from the results of the analysis of the correlation between the long-term levels of the two financial measures, the UAR and revenue, it is difficult to examine the extent to which the UAR generated in a particular market come from losses or the difference in perception of the project progress. Therefore, when the analysis was conducted utilizing financial performance data of a construction contractor whose market strategies focus on a specific sector, it is necessary to carry out a thorough quantitative analysis of the losses included in the UAR as conducted in the Analysis 1, or determine whether the contractor has evaluated their profits in a proper way.
In addition, the proportions of revenue from building and infrastructure construction projects show a moderate (r = −0.476) and weak (r = −0.312) correlation respectively, which means that their values increases as the UAVs appears to decrease; however, the proportion of revenue from plant construction projects did not show a correlation with the UAR (r = 0.219, p = 0.101). These results imply that in the case of building and infrastructure construction projects, the UAR tends to be small and has a less possibility to include losses relatively. On the other hand, in the case of plant and industrial construction projects, the size of UAR is various depending on the contractor or the construction project.
To sum up, a series of the data analyses confirmed the second hypothesis (H2), that contractors’ market strategies in terms of region and project type can be related to UAR. However, using the study data, it was not possible to confirm whether UAR, which either increased or decreased by focusing on a specific region or project type, have a significant association with losses. Therefore, the relationship between UAR and financial performance measures identified in the above analyses may not be universally applicable to contractor groups targeting specific markets. Thus, when analyzing a construction contractor’s financial performance, it will be necessary to assess whether the performance data is related to their UAR.
8. Conclusions
This study has identified the causes of the estimation errors of financial performance data, in the accounting of construction companies and, based on financial data, examined whether these estimation errors are actually occurring and how they relate to contractors’ operating activities and strategies. First, the literature review identified that losses could be included in UAR, which are generated by a difference in owners’ and contractors’ perceptions of project progress, and that these losses may not be reflected in contractors’ profits due to the difficulty in predicting the total project cost. The financial data of 41 Korean contractors were collected and analyzed, finding that for the Korean contractors, the UAR could have a relationship with the size and variation of the operating profit margin ratio. Through these results, it was inferred that losses could be included in UAR and then shown as profits. Finally, it was found that UAR can have a relationship with a contractor’s market strategy, which implies that the relationship between the UAR and financial performance measures may change depending on what market the contractor is focused on.
This study has the following contributions and limitations. This study revealed that there is the possibility that contractors’ financial performance data contains evaluation errors. The results of this study, however, do not mean that the financial performance of all contractors is distorted, because the analysis was conducted using financial data from contractors of a specific country and for a specific period. As mentioned above, the size of the UAR can change depending on the market and the contractor’s market strategy. Therefore, when the financial performance of construction companies is evaluated, it will be necessary to analyze the UAR and its relationship with the financial data analyzed in this study.
In addition, the method of analyzing the relationship between UAR and the size and variability of financial performance measures can be used as a way to deduce whether the financial performance data includes misrecognized losses. However, the analysis method used in this study does not directly calculate the size of estimation errors using the data on the losses and estimated total project costs of each construction project. Therefore, in order to provide more reliable data to those who utilize construction companies’ financial performance data, an accounting method that can efficiently provide project-level data is necessary.
Author Contributions
M.J. designed and conducted this research and wrote the paper. S.Y. collected the analysis data and relevant materials. S.C. initiated and designed this research and I.Y. and B.-G.H. provided theoretical and practical ideas and reviewed the paper.
Funding
This research was supported by a grant (16CTAP-C114956-01) from Technology Advancement Research Program (TARP) funded by Ministry of Land, Infrastructure and Transport of Korean government and by Basic Science Research Program through the National Research Foundation (NRF) of Korea funded by the Ministry of Education (2017R1D1A1B03035856).
Conflicts of Interest
The authors declare no conflict of interest.
References
- Bergeron, H.E. Primer for financial management of small consulting firms. J. Manag. Eng. 1994, 10, 28–34. [Google Scholar] [CrossRef]
- Magee, G.L. Financial management primer for new project managers. J. Manag. Eng. 1996, 12, 62–67. [Google Scholar] [CrossRef]
- Dechow, P.M. Accounting earnings and cash flows as measures of firm performance: The role of accounting accruals. J. Account. Econ. 1994, 18, 3–42. [Google Scholar] [CrossRef]
- Robinson, T.R.; Henry, E.; Pirie, W.L.; Broihahn, M.A. International Financial Statement Analysis; John Wiley & Sons: Hoboken, NJ, USA, 2015. [Google Scholar]
- Birnberg, H.G. Communicating the Company’s Operating Performance Data. J. Manag. Eng. 1985, 1, 12–19. [Google Scholar] [CrossRef]
- Jensen, D.A.; Craig, J.W. The impact of TAMRA’88 on US construction accounting practices. Constr. Manag. Econ. 1998, 16, 303–313. [Google Scholar] [CrossRef]
- Halpin, D.W.; Senior, B.A. Financial Management and Accounting Fundamentals for Construction; John Wiley & Sons: Hoboken, NJ, USA, 2009. [Google Scholar]
- Comiskey, E.E.; Mulford, C.W. Contract Reporting and Analysis: Some Guidance for Lenders. Commer. Lend. Rev. 1998, 14, 30–47. [Google Scholar]
- Eldin, N.N. Measurement of work progress: Quantitative technique. J. Constr. Eng. Manag. 1989, 115, 462–474. [Google Scholar] [CrossRef]
- Jung, M.; Ko, S.; Chi, S. A progress measurement framework for large-scale urban construction projects. KSCE J. Civ. Eng. 2018, 22, 2188–2194. [Google Scholar] [CrossRef]
- Acebes, F.; Pajares, J.; Galán, J.M.; López-Paredes, A. A new approach for project control under uncertainty. Going back to the basics. Int. J. Proj. Manag. 2014, 32, 423–434. [Google Scholar] [CrossRef]
- Odeck, J. Cost overruns in road construction—What are their sizes and determinants? Transp. Policy 2004, 11, 43–53. [Google Scholar] [CrossRef]
- Loughmiller, J.; Klintworth, G. Building a business. Nat. Biotechnol. 2011, 29, 307. [Google Scholar]
- Taylor, D.H.; Hensey, M. Financial issues in engineering management: Interview. J. Manag. Eng. 1990, 6, 157–161. [Google Scholar] [CrossRef]
- Calegari, M.J. The effect of tax accounting rules on capital structure and discretionary accruals. J. Account. Econ. 2000, 30, 1–31. [Google Scholar] [CrossRef]
- Russell, J.S. Underwriting process for construction contract bonds. J. Manag. Eng. 1992, 8, 63–80. [Google Scholar] [CrossRef]
- Peterson, S.J. Construction Accounting and Financial Management; Pearson Education: Upper Saddle River, NJ, USA, 2005. [Google Scholar]
- Clough, R.H.; Sears, G.A.; Sears, S.K.; Segner, R.O.; Rounds, J.L. Construction Contracting: A Practical Guide to Company Management; John Wiley & Sons: Hoboken, NJ, USA, 2015. [Google Scholar]
- Dayanand, N.; Padman, R. Project contracts and payment schedules: The client’s problem. Manag. Sci. 2001, 47, 1654–1667. [Google Scholar] [CrossRef]
- International Accounting Standards Board (IASB). IAS 11 Construction Contracts. 2009. Available online: http://www.ifrs.org/issued-standards/list-of-standards/ias-11-construction-contracts/#about (accessed on 10 June 2018).
- Pettigrew, R. Payment under Construction Contracts Legislation; Thomas Telford Ltd.: London, UK, 2005. [Google Scholar]
- Kelly, E.S.; Haskins, S.; Reiter, P.D. Implementing a DBO project. J. Am. Water Works Assoc. 1998, 90, 34–46. [Google Scholar] [CrossRef]
- Sherif, E.; Kaka, A. Factors influencing the selection of payment systems in construction projects. In Proceedings of the 19th Annual Association of Researchers in Construction Management (ARCOM) Conference, Putney, VT, USA, 3–5 September 2003; Volume 1, pp. 63–70. [Google Scholar]
- Trotman, K.T.; Zimmer, I.R. Revenue recognition in the construction industry: An experimental study. Abacus 1986, 22, 136–147. [Google Scholar] [CrossRef]
- Forbes, L.H.; Ahmed, S.M. Modern Construction: Lean Project Delivery and Integrated Practices; CRC Press: Boca Raton, FL, USA, 2010. [Google Scholar]
- Bohusova, H.; Nerudova, D. US GAAP and IFRS convergence in the area of revenue recognition. Econ. Manag. 2009, 14, 12–19. [Google Scholar]
- Herwitz, D.R. Accounting for long-term construction contracts: A lawyer’s approach. Harv. Law Rev. 1957, 70, 449–478. [Google Scholar] [CrossRef]
- Jung, M.; Park, M.; Lee, H.; Kim, H. Weather-Delay Simulation Model Based on Vertical Weather Profile for High-Rise Building Construction. J. Constr. Eng. Manag. 2016, 142, 04016007. [Google Scholar] [CrossRef]
- Chan, S.L.; Park, M. Project cost estimation using principal component regression. Constr. Manag. Econ. 2005, 23, 295–304. [Google Scholar] [CrossRef]
- Carr, R.I. Cost-estimating principles. J. Constr. Eng. Manag. 1989, 115, 545–551. [Google Scholar] [CrossRef]
- Almarri, K.; Blackwell, P. Improving risk sharing and investment appraisal for PPP procurement success in large green projects. Procedia Soc. Behav. Sci. 2004, 119, 847–856. [Google Scholar] [CrossRef]
- Doloi, H.K. Understanding stakeholders’ perspective of cost estimation in project management. Int. J. Proj. Manag. 2011, 29, 622–636. [Google Scholar] [CrossRef]
- Ahuja, V.; Thiruvengadam, V. Project scheduling and monitoring: Current research status. Constr. Innov. 2004, 4, 19–31. [Google Scholar] [CrossRef]
- Irfan, M.; Khurshid, M.B.; Anastasopoulos, P.; Labi, S.; Moavenzadeh, F. Planning-stage estimation of highway project duration on the basis of anticipated project cost, project type, and contract type. Int. J. Proj. Manag. 2011, 29, 78–92. [Google Scholar] [CrossRef]
- Blanc-Brude, F.; Makovsek, D. Construction Risk in Infrastructure Project Finance; EDHEC Risk Institute: Singapore, 2013. [Google Scholar]
- Gunduz, M.; Önder, O. Corruption and internal fraud in the Turkish construction industry. Sci. Eng. Ethics 2013, 19, 505–528. [Google Scholar] [CrossRef] [PubMed]
- Ahiaga-Dagbui, D.D.; Smith, S.D. Rethinking construction cost overruns: Cognition, learning and estimation. J. Financ. Manag. Prop. Constr. 2014, 19, 38–54. [Google Scholar] [CrossRef]
- Lara, J.M.G.; Osma, B.G.; Penalva, F. Accounting conservatism and firm investment efficiency. J. Account. Econ. 2016, 61, 221–238. [Google Scholar] [CrossRef] [Green Version]
- Beach, R.; Webster, M.; Campbell, K.M. An evaluation of partnership development in the construction industry. Int. J. Proj. Manag. 2005, 23, 611–621. [Google Scholar] [CrossRef] [Green Version]
- Van Leeuwen, J.P.; Fridqvist, S. An information model for collaboration in the construction Industry. Comput. Ind. 2006, 57, 809–816. [Google Scholar] [CrossRef]
- Arthur, N.; Chuang, G.C. IAS 7 Alternative Methods of Disclosing Cash Flow from Operations: Evidence on the Usefulness of Direct Method Cash Flow Disclosures; The University of Sydney: Sydney, Australia, 2006. [Google Scholar]
- Lang, M.; Raedy, J.S.; Yetman, M.H. How representative are firms that are cross-listed in the United States? An analysis of accounting quality. J. Account. Res. 2003, 41, 363–386. [Google Scholar] [CrossRef]
- Givoly, D.; Hayn, C.K.; Katz, S.P. Does public ownership of equity improve earnings quality? Account. Rev. 2010, 85, 195–225. [Google Scholar] [CrossRef]
- Drew, D.; Skitmore, M.; Lo, H.P. The effect of client and type and size of construction work on a contractor’s bidding strategy. Build. Environ. 2001, 36, 393–406. [Google Scholar] [CrossRef] [Green Version]
- Ofori, G. Frameworks for analysing international construction. Constr. Manag. Econ. 2003, 21, 379–391. [Google Scholar] [CrossRef]
- Montgomery, D.C.; Peck, E.A.; Vining, G.G. Introduction to Linear Regression Analysis; John Wiley & Sons: Hoboken, NJ, USA, 2012. [Google Scholar]
- Ministry of Land, Transport and Maritime Affairs (MLTMA). Framework Act on the Construction Industry, Ministry of Government Legislation of Korea. 2010. Available online: http://www.moleg.go.kr/english/korLawEng;jsessionid=Q9j5zCeft3Yrl5nW1NGHS81eBin1bQ2DRYqsjspNfiW8HLIlZa6QYh13Z4spPH8b?pstSeq=52559&pageIndex=6y (accessed on 10 June 2018).
Figure 1.
The relationship among cost, loss, and billed and unbilled cost.

Figure 2.
Comparison of percentage of completion (POC) according to estimation of overall project cost.
Figure 2.
Comparison of percentage of completion (POC) according to estimation of overall project cost.


Table 1.
Demography of collected data.
| Research Variables | Min | Mean | Max |
|---|---|---|---|
| Revenue (AMSs) | |||
| by Region | |||
| 1. Domestic Market | 25.8% | 82.6% | 100.0% |
| by Project Type | 25.8% | 82.6% | 100.0% |
| 2. Infrastructure | 0.0% | 26.2% | 63.8% |
| 3. Building and Residence | 0.0% | 53.1% | 100.0% |
| 4. Plant and Industrial Facility | 0.0% | 20.7% | 100.0% |
| Operating Profit | |||
| 5. Average (AOP) | −19.8% | −0.4% | 12.1% |
| 6. Standard Deviation (SDOP) | 0.4% | 7.7% | 25.3% |
| 7. Maximum Change (MCOP) | 0.0% | 7.7% | 32.1% |
| Cash Flow from Operating Activities | |||
| 8. Average (ACF) | −13.4% | 2.7% | 45.3% |
| 9. Standard Deviation (SDCF) | 0.9% | 14.4% | 86.4% |
| 10. Maximum Change (MCCF) | 0.0% | 13.0% | 48.2% |
| Unbilled Account Receivable | |||
| 11. Average (AUAR) | 0.4% | 15.1% | 36.0% |
Table 2.
Results of correlation analysis between Unbilled Accounts Receivable (UAR) and financial performance measures.
Table 2.
Results of correlation analysis between Unbilled Accounts Receivable (UAR) and financial performance measures.
| Variables | Statistics | |
|---|---|---|
| Pearson’s R | p-Value | |
| Operating Profit | ||
| 1. Average (AOP) | −0.443 | 0.001 |
| 2. Standard Deviation (SDOP) | 0.359 | 0.008 |
| 3. Maximum Change (MCOP) | 0.280 | 0.034 |
| Cash Flow from Operating Activities | ||
| 4. Average (ACF) | −0.357 | 0.008 |
| 5. Standard Deviation (SDCF) | 0.191 | 0.115 |
| 6. Maximum Change (MCCF) | 0.212 | 0.095 |
Table 3.
Results of correlation analysis between UAR and market strategy measures.
| Variables | Statistics | |
|---|---|---|
| Pearson’s R | p-Value | |
| by region | ||
| 1. Domestic | −0.507 | 0.001 |
| by construction type | ||
| 2. Infrastructure | −0.476 | 0.001 |
| 3. Building and residence | −0.312 | 0.037 |
| 4. Plant and industrial facility | 0.219 | 0.101 |
© 2018 by the authors. Licensee MDPI, Basel, Switzerland. This article is an open access article distributed under the terms and conditions of the Creative Commons Attribution (CC BY) license (http://creativecommons.org/licenses/by/4.0/).
Share and Cite
MDPI and ACS Style
Jung, M.; You, S.; Chi, S.; Yu, I.; Hwang, B.-G. The Relationship between Unbilled Accounts Receivable and Financial Performance of Construction Contractors. Sustainability 2018, 10, 2679. https://doi.org/10.3390/su10082679
AMA Style
Jung M, You S, Chi S, Yu I, Hwang B-G. The Relationship between Unbilled Accounts Receivable and Financial Performance of Construction Contractors. Sustainability. 2018; 10(8):2679. https://doi.org/10.3390/su10082679
Chicago/Turabian StyleJung, Minhyuk, Shira You, Seokho Chi, Ilhan Yu, and Bon-Gang Hwang. 2018. "The Relationship between Unbilled Accounts Receivable and Financial Performance of Construction Contractors" Sustainability 10, no. 8: 2679. https://doi.org/10.3390/su10082679
Note that from the first issue of 2016, this journal uses article numbers instead of page numbers. See further details here.