Geographical Assessment of Low-Carbon Transportation Modes: A Case Study from a Commuter University


Department of Geography, Environment, and Sustainability, University of North Carolina at Greensboro, Greensboro, NC 27412, USA
*
Author to whom correspondence should be addressed.
Sustainability 2018, 10(8), 2696; https://doi.org/10.3390/su10082696
Submission received: 30 May 2018
/
Revised: 4 July 2018
/
Accepted: 30 July 2018
/
Published: 1 August 2018
(This article belongs to the Special Issue Sustainable Smart Cities and Smart Villages Research: Rethinking Security, Safety, Well-being and Happiness)
Abstract
:This case study examines the geographic variation in students’ low-carbon transportation (LCT) modes to a commuter university campus. Three major goals are accomplished from this research: (1) identifying commuting zones for the bicycling, walking, and transit mode choice for UNCG students; (2) understanding whether the real vs. perception of space can be predictive to mode choice; and (3) understanding the relative importance of demographic, psychological, and logistic factors on students’ mode choice, using a suite of variables developed in multiple fields. Our analyses support the assertion that various physical, demographic, and psychological dimensions influence LCT mode choice. While the presence of sidewalks is conducive to walking, the distance, either perceived or actual, within 1.61 km from UNCG is the most important factor for walking mode share. The bicycling commute is not associated with either the distance or presence of bicycle lanes, while transit ridership most likely increases if students live >8 km from the UNCG campus with the nearest bus stop within 1 km from home. Given the limited bicycle lanes in Greensboro, students who commute to campus by bicycle are resilient to unfavorable bicycle conditions by sharing the road with cars and adjusting their travel routes. Our findings also concur with previous studies showing that bicycle commuters are disproportionately represented by self-identified whites while bus riders are disproportionately comprised of self-identified non-whites. Our analyses support Greensboro’s current planning and policy emphasis on low-carbon travel behaviors via equitable and safe transit-oriented multi-modal infrastructures, and suggest that UNCG should utilize its influence to advocate and further facilitate these ongoing efforts.
Keywords:
low-carbon transportation; walk; bike; transit; built-environment; perceptions; UNCG; Greensboro; North Carolina1. Introduction
This case study intends to understand spatial variation of students’ low-carbon transport (LCT) modes to a commuter university. The LCT such as walking, bicycling, and transit had always been popular in the university and college campuses around the United States despite the domination of automobile-oriented transportation since post-World War II [1]. The LCT has been, however, receiving renewed attention in higher education campuses since the beginning of 21st century [2,3,4] as a mechanism to reverse CO2 emissions from auto-dominated commuting [5,6,7]. Automobile transportation dependents on fossil fuels is the primary sources of CO2 emissions and is growing at faster rate than any other energy sector in the United States [8] mainly due to the unlimited desire for personal mobility [9]. As part of the reversion process, a descent investment in LCT infrastructures has been ongoing not only in American college and university campuses, but almost in every urban areas of the United States [5,10,11,12,13].
Understanding university students’ commuting behaviors is steadily growing as well [14,15]. University communities that are built by incorporating LCT infrastructures, housing affordability and mixed land-uses promotes travel benefits including lower automotive drivers [16] and higher LCT users [7,14,17]. These studies, however, warned that the successful implementation of low-carbon transport transition requires the careful consideration of the specific contextual factors such as socio-cultural features of the examined campus and the corresponding urban built-environment and transport network [18,19]. Given the fact that the passenger transport must needs to be decarbonized sooner than later to reverse greenhouse gas emissions (GHG) [20] from university campuses, further research is warranted for a deeper understanding of students’ commuting behaviors.
There is, yet, a lack of research in examining students’ low-carbon mode choice in a commuter university campus [21], especially by using knowledge learned from different disciplines [22]. Commuter universities are different in many aspects, such as they may have a diverse range of student population, including traditional (recent high school graduates to age 24) and non-traditional (25 years or older), holding full-time or part-time jobs, and or may even raise a family. Each of the demographic groups has preferred transportation modes resulting in complex travel patterns. These students are also part of the transportation system and urban structure that may have inadequate infrastructure for using alternative modes (e.g., [23]). Students in commuter campuses tend to have lower share of bicycle and walking commuters to campus than universities located in college towns [14]. Hence, our case study intends to contribute in the literature by combining a suite of variables relating to students’ commute collected at University of North Carolina at Greensboro (UNCG) campus. The campus adopted a sustainability policy and Climate Action Plan to achieve zero net GHG emission goal by AD 2050, part of the American college and university campuses (ACUPCC) sustainable initiative [24,25]. The results of this research can be directly beneficial to strengthen policy and implementation of strategies aiming at promoting low-carbon transportation behavior at this university or any similar kind of places even after an individual owns a car.
2. Conceptual Framework
The research related to LCT has focused on two main issues: (1) barriers that prevent students from utilizing LCT as a commuting option; and (2) policies and improvements of organizations that can be used to mitigate these barriers.
2.1. Barriers Preventing People from LCT
2.1.1. Physical Environments and Practical Issues
A better infrastructure for walking and bicycling is associated with increase in such transportation modes [26,27]. Many university campuses in the United States are trying to expand infrastructures for LCT, yet they are not completely adequate for walking and bicycling to campus [14,17]. Cities where universities are located lack in such infrastructures [23,27] and, hence, impeding connectivity in the walking and bicycling networks [4,28]. Higher pedestrian and cyclist fatality rates in the U.S. remain serious concerns for mode switching from car to LCT [12]. Crashes taking place on campus peripheries tend to be more serious [29]. That said, there is also argument that students can select neighborhoods with built-environment conducive to biking and walking if they prefer such transportation modes [14]. Other studies suggest that typical decision of individual mode choice is based on other relating activities for the entire day [30]. For instance, a student may decide to drive to campus if she/he is carrying stuff that are heavy or going to another destinations (e.g., work, child care) not served by other transportation [14].
2.1.2. Distance, Time, and Space: Real vs. Perceived
The distance from living place to university is the primary factor influencing on walking and bicycling to campus (e.g., [15,17,31,32]), but the optimum distance for such transportation mode choices for university students are less understood. Shannon et al. [31] confirmed based on an Australian university campus that the proportion of students utilizing bicycling and walking for trips within one-kilometer of campus were twice that of students living more than one-kilometer from campus. Walking drastically declined beyond one kilometer from the campus and few students bicycled beyond eight-kilometer from campus. Based on two urban universities in Spain, Chillon et al. [32] determined the distance thresholds for walking and bicycling: 2.6 km and 5.1 km, respectively. In contrast, Zhou [14] did not find any correlation between commute distance and students’ biking in University of California–Los Angeles, USA. Distance between home and the transit stop, usually less than a kilometer is also associated with transit use [33]. Individual’s time constraints is another significant barrier for students’ choice of LCT to campus [4], regardless of distance.
Recent research on general adults suggests a mismatch between measured (actual) and self-reported (perceived) distance to activities [34]. Relatively little research of this sort has been conducted among university students. Research examining the role of perceptions in travel behavior found that not only actual distance, but also people’s perceived distance has an impact on walking and bicycling [35,36]. Use of bicycle as commute mode increases if people think they live ‘near enough’ [37,38]. Similarly, perception of car as a necessity to save travel time results in the increased car use [38,39,40]. That said approximately two-thirds of the population in Amsterdam, The Netherlands would consider riding public transport if the perception of travel time for public transportation was accurate [41]. The amount of ‘near enough’ or ‘too far’ in distance varies significantly and the perceived distance seems to be a stronger deterrent in the adoption of bicycle transportation than the actual distance [42,43]. Clearly, resistance to travel by walking or bicycle increases disproportionately with distance and time—either perceived or actual—due to the physical effort these modes require.
Individuals’ perception of distance and lack of time not only affect LCT travel behavior, the perceptions on the safety in their neighborhoods can be also a deciding factor for potential alternative mode shares [23,44]. Traffic patterns, themselves, can affect the perception of an area and mode choices [45]. Local areas congested by traffic and excessive parking create a more negative perception of the neighborhood among residents as either walkable or bicycleable [28]. Perceptions are difficult to quantify accurately, but there is a direct connection between how an area is perceived and residents’ willingness to engage in walking and bicycling [12,38]. Individuals are more likely to perceive the area as bikeable if there are high numbers of cycle commuters in an area [17,46].
2.2. Policies and Interventions to Mitigate LCT Barriers
Significant policies such as high-density built-environment around and within commuter shade areas [47] of a campus with well-connected and wide sidewalks and bicycle environments have been discussed [7,45]. To some extent these policies are implemented, yet there is limited success in changing university students’ mode choice, particularly in increasing bicycling commute [4]. Some studies (e.g., [37]) suggest that monetary incentives, not availability of facilities, is more significant in encouraging bicycling. For instance, Zhou [14] found that specific services such as affordable housing and proximity to a bus line are incentives for students’ alternative mode choices. Since availability and affordability of parking spaces encourages car use, strategies for reducing parking spaces are discussed, including raising parking prices to a point when affordability can be an issue for students [15,48]. This program is criticized for being ineffective to higher income students and the possible long-term impact on students’ enrollment, especially in commuter campuses [40].
Significant interventions approaches are also discussed [12,17] such as free transit systems in changing students’ automotive travel habits. Students at the University of Giessen in Germany were provided prepaid bus tickets as an intervention method to alter students’ habitual travel for a longitudinal analysis [49]. This study found that prepaid bus tickets increased positive perception about transit and, hence, concluded that habitual car users may switch to alternative modes by implementing appropriate interventions. However, others argue that earlier travel habits continue if circumstances do not change substantially [50] and, therefore, removing barriers is more effective than promoting the benefits of modal change from automobiles [14,31].
2.3. Sociodemographics, Psychological, and Environmental Perceptions
Socio-economic characteristics, such as age, race, gender, income, home and car ownerships also have an impact on university students’ commute mode choice [7,51] and their magnitude can be larger than urban built-environment characteristics [40]. Studies, however, reports that today’s university students are less likely to own a car and more likely have positive attitudes towards using alternative LCT modes [16,52,53,54]. Gender makes a large difference in cycle commuters, as female university students more likely to avoid this mode [7,15]. Additional transportation research conducted by social psychologists shown that car use habits, perceived mobility needs, and pro-environmental behaviors affect university students’ mode choice [45,49]. LCT commuting is often determined by an individuals’ desire to receive health and environmental benefits from such modes, especially for longer distance travel [55], and this choice is independent of car ownership [31,56].
2.4. Summary
While previous research from various disciplines made significant contributions in understanding the complexity of low-carbon transportation modes choice, there is a lack of integrative approaches for understanding this topic [57]. At the same time it is essential to examine this topic from a spatial context such as built-environments and sociodemographic characteristics of corresponding campus for the successful transition of low-carbon transport. The conceptual framework of this case-study is, thus, based on variables identified in various disciplines and local context (Figure 1).
3. Study Site, Data, and Methodology
3.1. Study Site
The UNCG, the third largest campus of the UNC system, has mandated to be carbon neutral by AD 2050 [24] and is selected for our study site. It is an urban campus located approximately one mile SW of downtown Greensboro, NC (Figure 2) and is known as largest commuter campus (215-acre campus) in the Piedmont Triad Area. During the academic year 2016–2017, the campus has more than 19,922 students and 2500 faculty and staff [58]. The undergraduate students represent a diverse group of populations; over 40% of students are from underserved populations, and many are first-generation students and hold full-time or part-time jobs.
The campus has been recognized a as one of the best bike-friendly university campuses in the United States [59]. These recognitions confirm that the campus is well-connected with bicycle and walking networks, as well as with the local public transit system, the Greensboro Transit Authority (GTA) (Figure 2). A number of alternative transportation modes, such as LimeBike bicycle-sharing program carpooling, car-sharing, emergency ride-home programs, zip car rental program, and priority parking for low-emissions vehicles are available. Greensboro, where the university is located, is a fast-growing city that is anticipating its future transportation needs with a transit-oriented (TOD) multi-modal transportation network to promote transit, bicycling, and walking as alternative modes of transportation for the residents [60]. Despite having an active bicycle advocacy group in Greensboro, it has a limited bicycle network [61], sidewalks, and transit service.
3.2. Data and Procedures
A web-based survey was designed to collect data for this case study. The human-subject approval for this survey was obtained from the UNCG office of the Institutional Review Board (IRB). Undergraduate students were targeted to collect data since this group commutes more than graduate students. Survey participants were invited through emails, which were collected from the University Registrar’s Office. Participation in the survey was voluntary. The students were asked to provide their current residential address or the names of the nearest intersecting street to respect a certain level of privacy. They were also asked to provide their age, race/ethnicity, income including their parents’ income, employment status, car ownership or access to car, mode of transportation to campus, and housing information (rental or student ownership). Additionally, a series of questions were asked regarding individual perceptions and attitudes on transit facilities, bicycling, and walking to campus, and environmental beliefs using a five-point Likert scale.
A total of 2274 students participated in the survey, but not everyone answered all the questions. Records with missing values are excluded wherever it is appropriate for the analysis. Digital representation of the Guilford County street network, bus routes and stops, sidewalks, and bicycle routes were obtained by contacting the city of Greensboro GIS department. A bike accident location shape file was collected from the Greensboro Department of Transportation (GDOT) [62]. Survey participants who provided their home addresses are geocoded to capture the spatial/geographic features of each student’s location. A total of 700 (about 98% of sample size who provided their addresses) addresses were geocoded correctly. Of 700 samples, 570 addresses are within the city of Greensboro, the home of the UNCG (Figure 2). The variables that represent the spatial characteristics or physical built-environment at students’ home locations are interpolated at a raster grid (with 100 m × 100 m cells). These variables are: population density, length of sidewalk and bicycle lane, and network distance from students’ home locations to bus stops and to campus. The calculated values are then assigned to each student record. For the purpose of this research, the city limits constrict the study site to designate the probable extent of transit, bicycle, and walking transportation. The public transportation, such as GTA or Heat bus, do not provide services outside the city limits. Similarly, there are no designated bicycle routes outside Greensboro, nor a single sidewalk outside Greensboro connected to the campus.
The city of Greensboro was then divided into five transportation zones based on factors such as network distance, access to bus routes, and bus stops (Figure 3). Zone 1 represents less than 1.61 km or 1 m from UNCG, zone 2 represents more than 1.62 km to less than 3.33 km from UNCG, zone 3 represents 3.34 km to less than 8.0 km distance from UNCG + less than 1 km from the nearest bus stop, Zone 4 represents distance more than 8 km from UNCG + less than 1 km from the nearest bus stop, and zone 5 represents distances more than 8 km from UNCG + more than 1 km from the nearest bus stop. Student populations are then aggregated by these five zones and all these calculations are performed in ArcGIS 10.00 Network Analyst (ESRI, Redlands, CA, USA).
Additionally, Walk Score and Bike Score at each student’s location were collected from the website https://www.walkscore.com/ to capture additional walkable and bikeable potentials at students’ home locations. A number of studies used Walk Score and Bike Scores for studying the relationship between walkability and walking [63] and bikeability and bicycling behavior in urban areas [64]. The Walk Score website also offers transit score as measurement of transit accessibility at a location, but Transit score data for Greensboro area is not available for each student’s location. Therefore, we did not include transit score in our analysis. Both Walk and bike Scores range from 0 to 100, where 0 means no walkability and bikeability; whereas, 100 means highest possible walkability and bikeability an area can have. Accessibility and street connectivity from an origin to number of destinations or amenities (e.g., public transport, restaurants, shopping, parks/green spaces, and schools) are taken into consideration for calculating both walk and bike scores. The Walk Score index is calculated based on the connectivity and distance to destinations. The maximum points are allocated in an address if destinations are within a 5-min of walk or within 0.25 m and no points are allocated if destinations are outside 30-min walk. Similarly, in addition to street connectivity to destinations, bike infrastructures such as bike lanes, trails, hills/topography, and the number of bike commuters are taken into consideration for calculating Bike Score. Variables that are selected for the analysis are presented in Table 1.
4. Results
4.1. Socio-Demographic Characteristics of Participating Students
A total of 570 survey participants, who live within the study area (see Figure 3), are majority full-time, traditional—age below 25 years old, female, and non-Hispanic white students (Table 2), which are good representations of UNCG student populations. While many respondents live on or near campus, the geographic distribution of students’ residential location is dispersed: 23.9% of students are living in zone 1 (less than 1.61 km or 1 m from UNCG campus), another 13% lived in zone 2 (more than 1.62 to less than 3.33 km from the UNCG campus). Therefore, only about 37% student live within less than 3.33 km distance from the campus (Figure 3 and Table 2). Another 23.5% live in zone 3, which range distance between 3.34 km to 8.0 km from the campus. Students (39.6%) who live beyond 8.0 km distance from the campus (zones 4 and 5), only 12.8% has access to a bus stop less than 1 km distance from their home.
It is not a surprising that the majority of students (78.2%) reported owning at least one car—a statistic that represents American car culture well. Of 515 students who reported their own income, 70% of them have less than $25,000 annual income. Only 32% student body reported their parents’ income and, of them, 58% student body came from households whose parents make less than $50,000, which is well representative of socio-demographic characteristics of UNCG students’ body. Of 87% students reported their dominant/primary mode of transportation to campus, 19.4% walked, while 5.5% biked to campus regularly. Another 5.9% students used transit and other form of transit predominantly. Approximately 64% identified their predominant transportation mode as single-passenger vehicle while 5.5% reported carpooling (Table 2).
4.2. Distance and Modal Splits
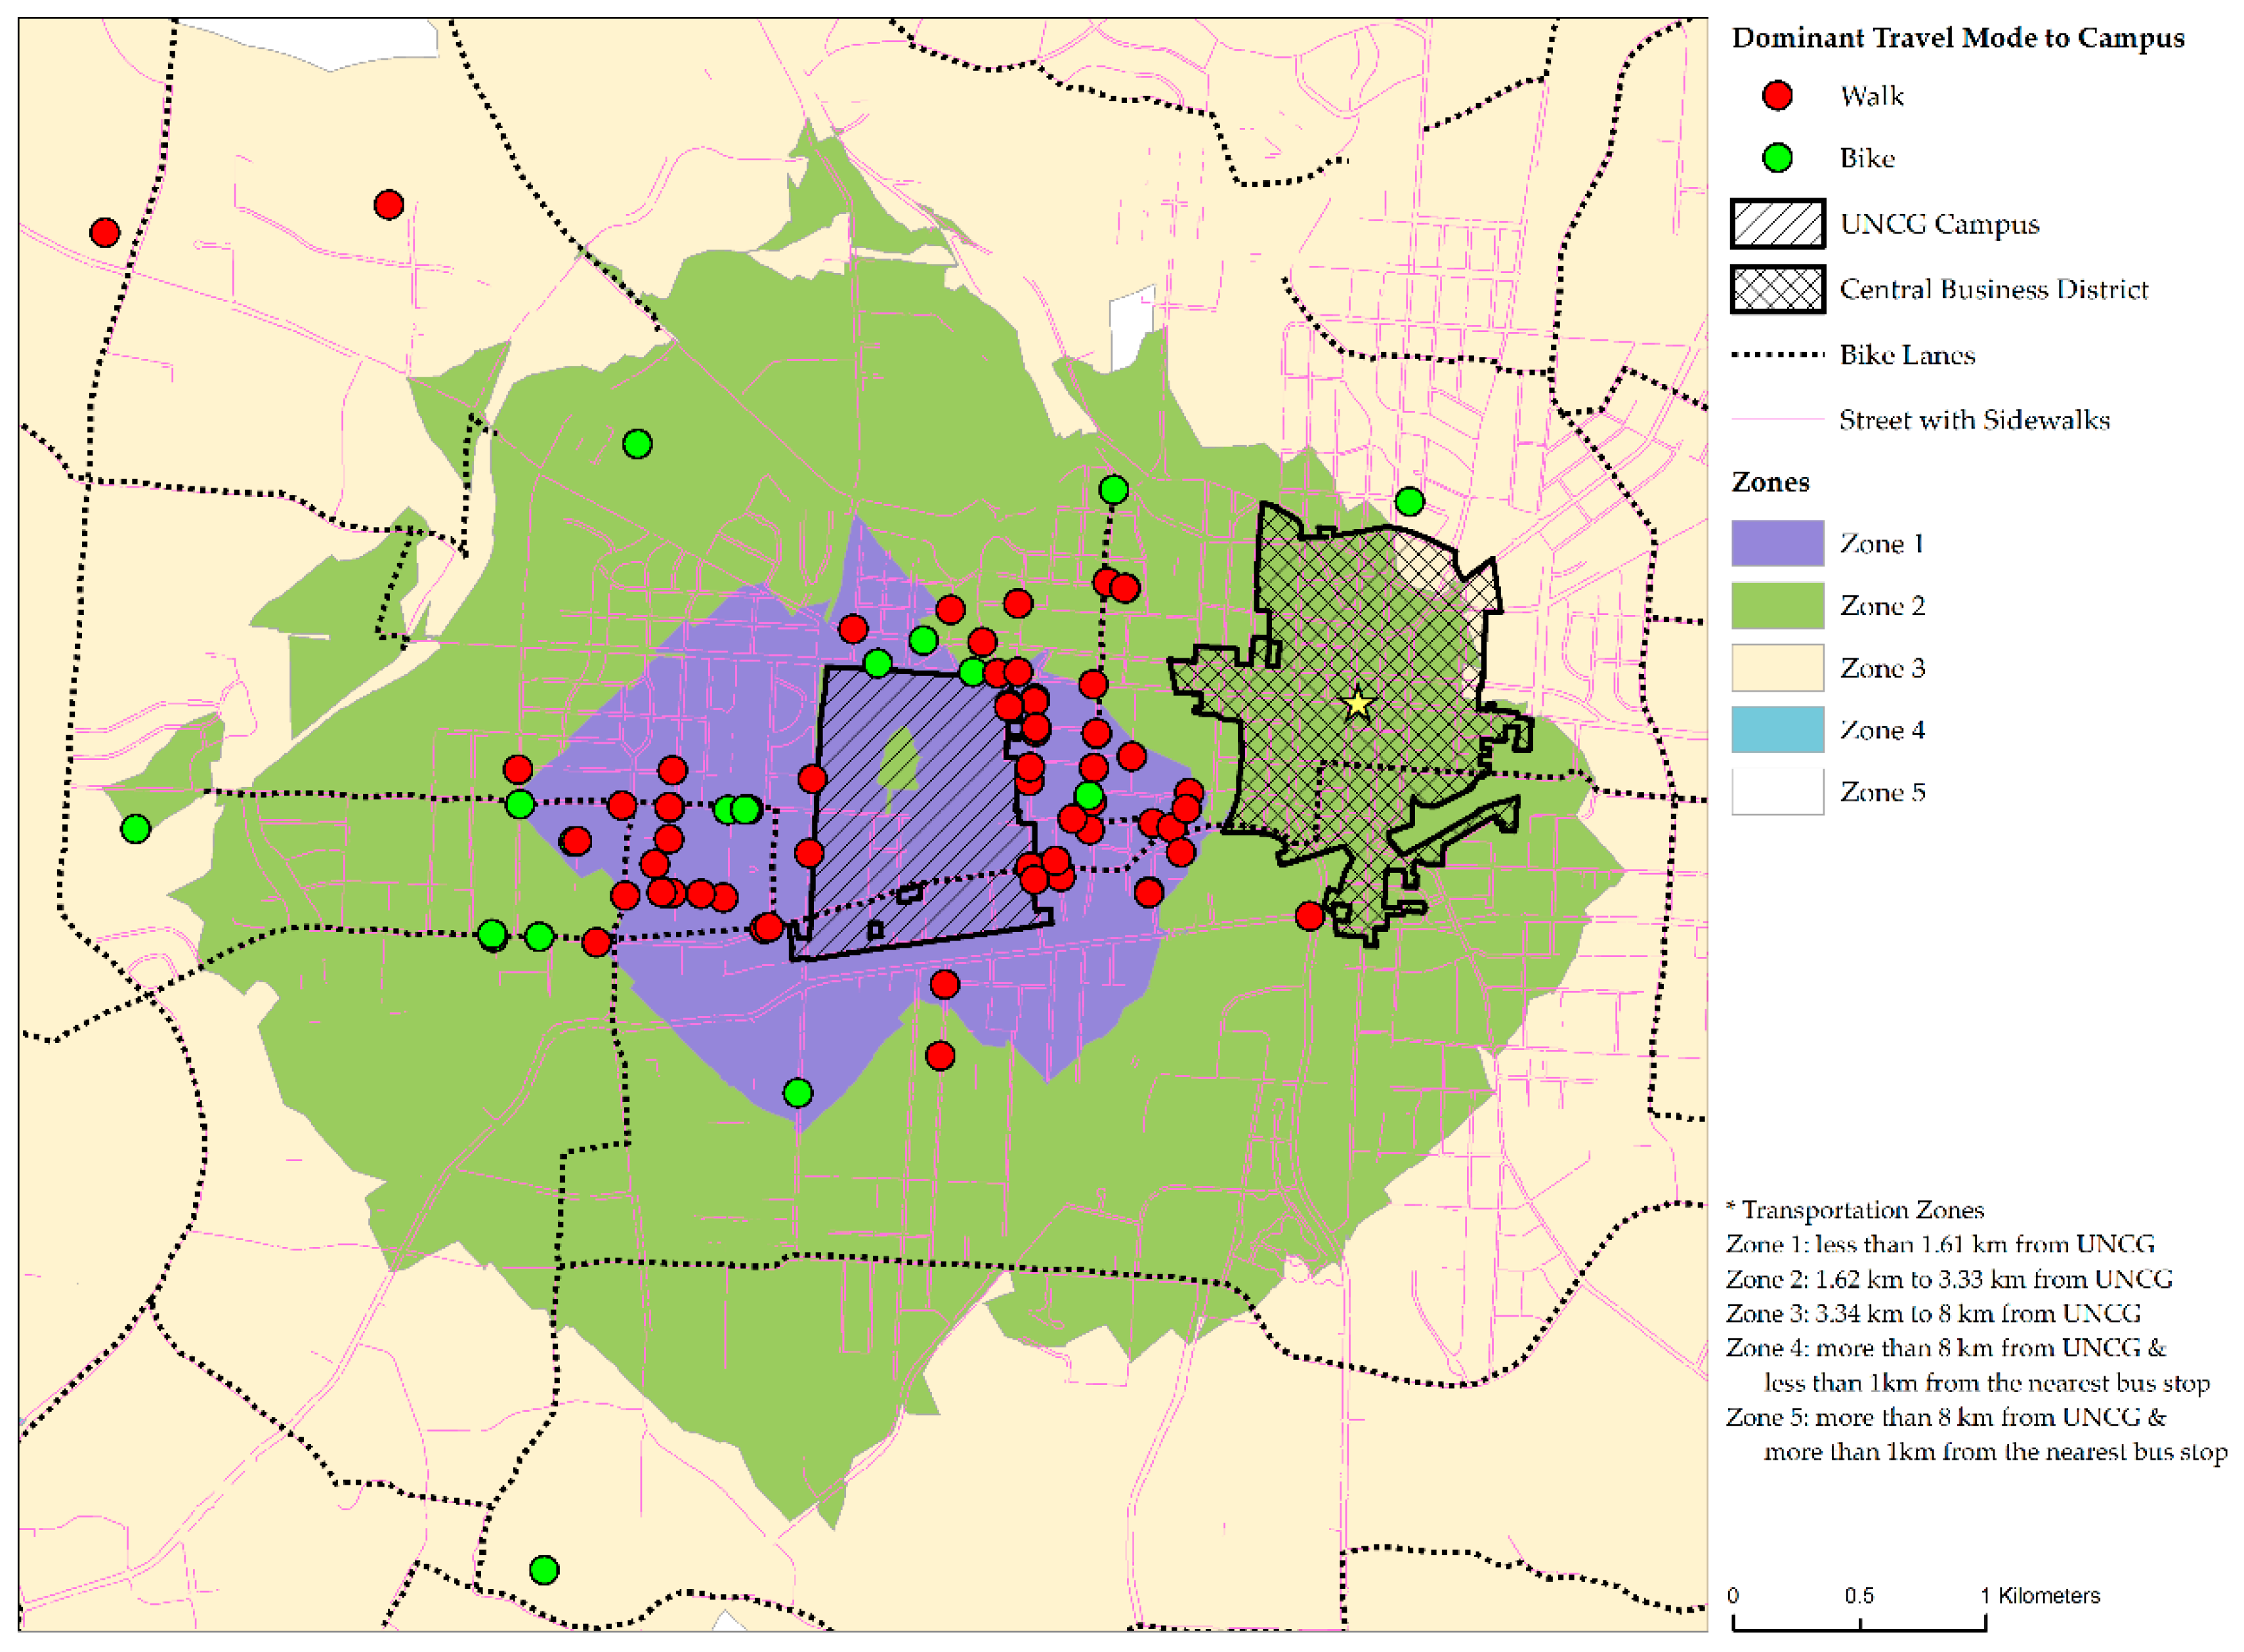
Figure 4 shows the proportion of modal split by network zones. Modal split differences by zones are statistically significant with a chi-square value of 224 and p ≤ 0.001. Walking is the dominant transportation mode in Zone 1 (1.61 km or 1 m from campus) (Figure 5), about 60% of all modes, while car driving makes about 25% of all modal choices in this zone. The walking mode share drastically declines in zone 2 (Figure 5)—only 22% of commuters in this zone walk to campus, while driving alone makes up more than 50% of the modal share in this zone. The walking mode share continues to decline in zone 3 and becomes non-existent in zone 4, the proportion of the walking mode share slightly increased in zone 5, which is surprising to us. Bicycling comprises about 10% of the modal share both in zones 1 and 2 (Figure 4 and Figure 5), but its share continues to decline in zones 3 and 4, and then slightly increases in zone 5.
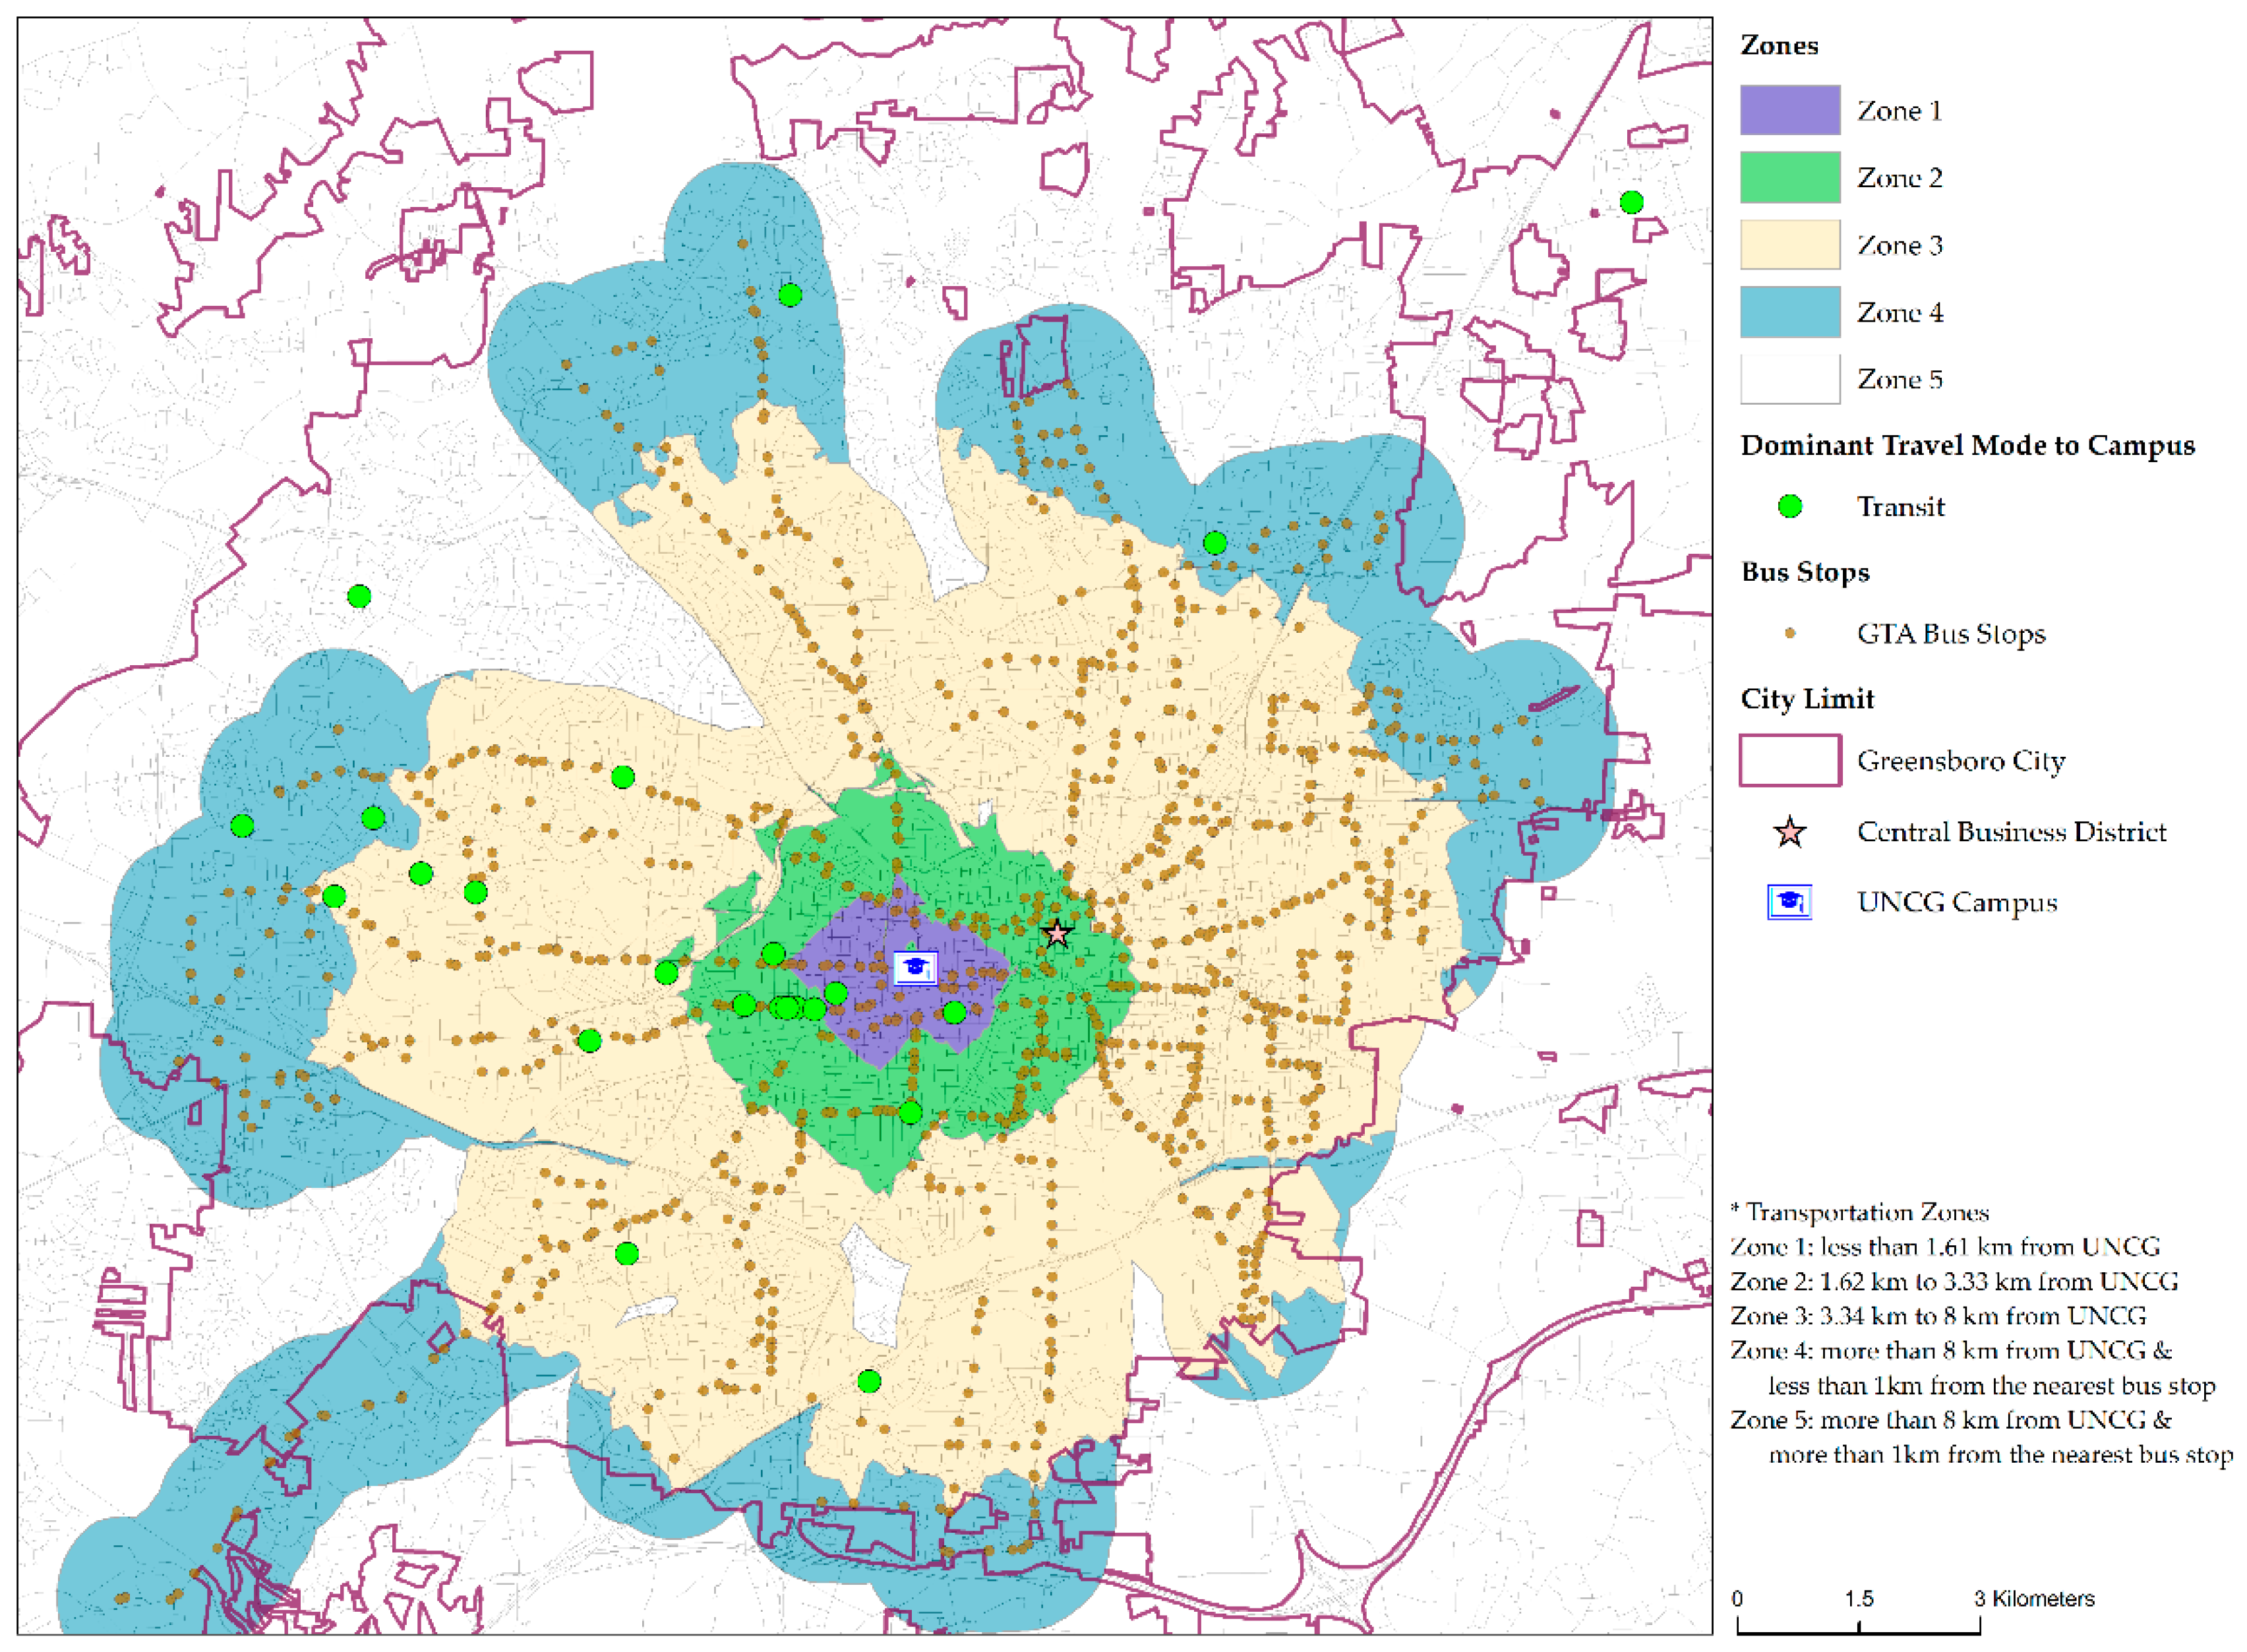
While the proportion of the transit mode share is low in zone 1, the largest modal share by transit is found in zone 2, about 12% of all modes. It slightly goes down in zones 3 and 4, and then drastically goes down in zone 5 (Figure 4 and Figure 6). Many places in zone 5 have limited transit access to students within a kilometer from bus stops (Figure 6). A small percentage of the modal share by carpool (about 2–5%) is found in all zones, but carpools do not seem to take-off slightly until zone 3, which makes up about 10% of the modal share in this zone and the highest of all zones. Given the American car culture, it is not surprising that cars steadily make up the dominant mode share, somewhere between 75% and 85%, for zones 3, 4, and 5 (Figure 4).
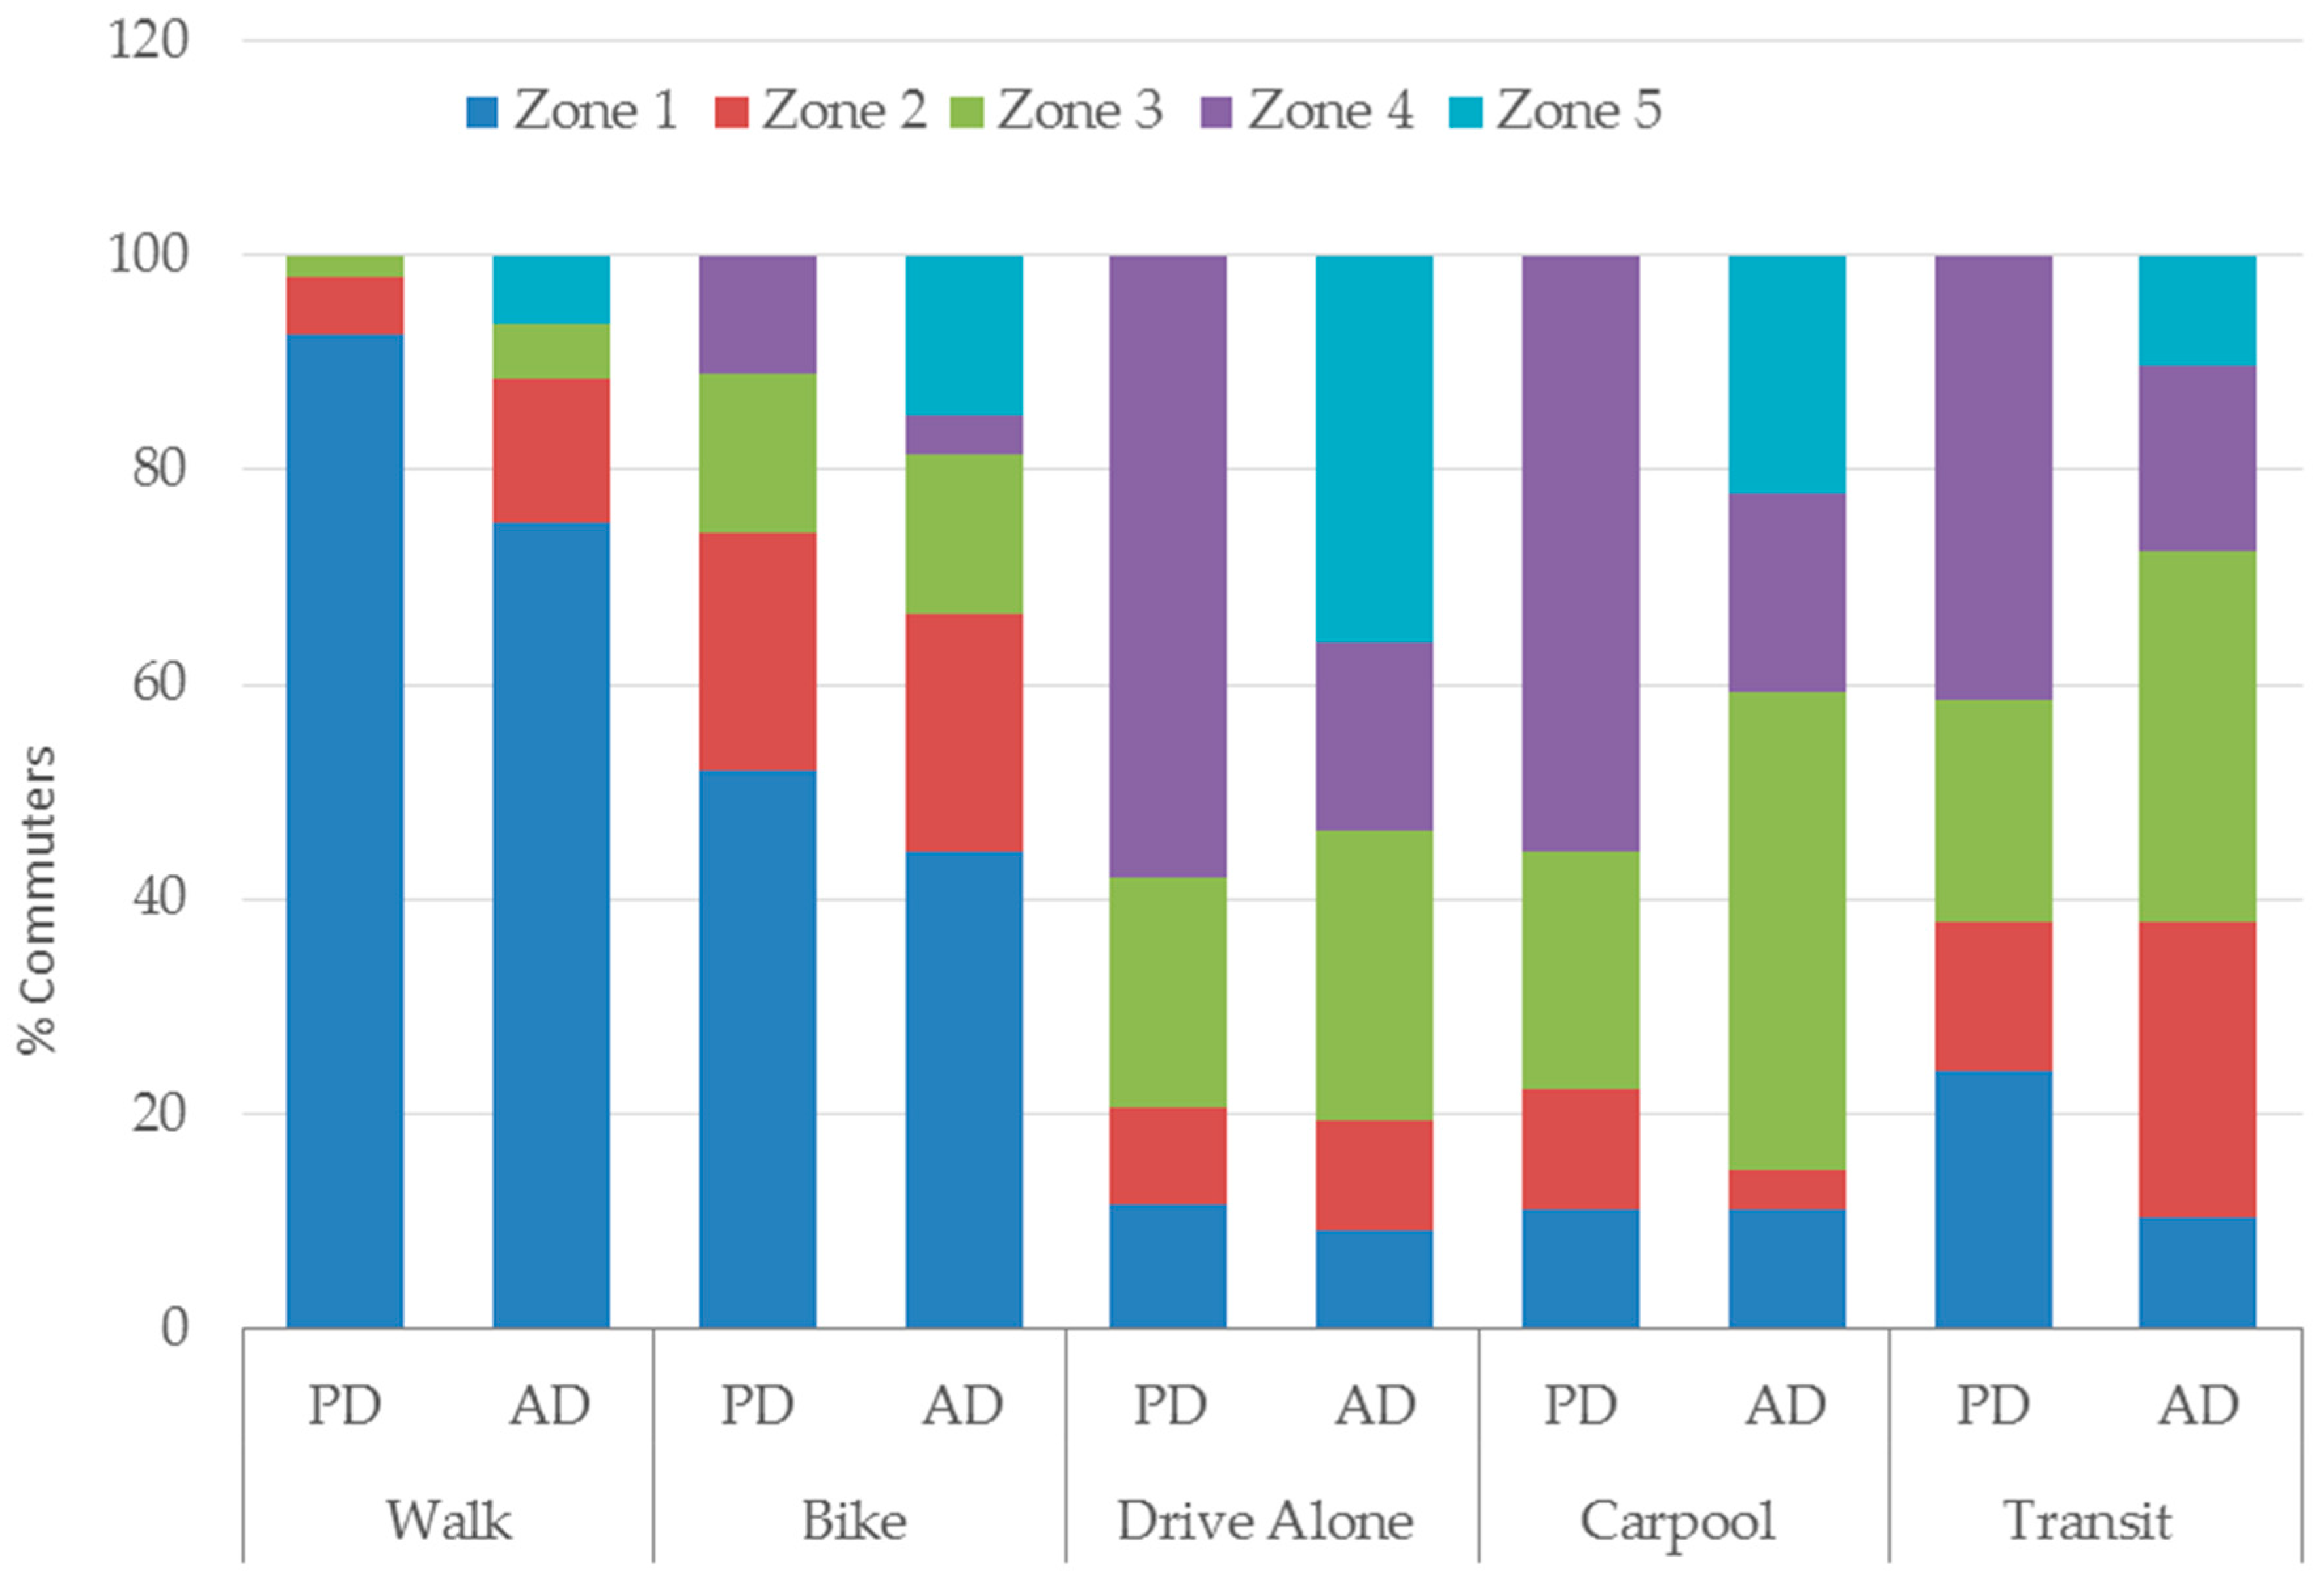
4.3. Modal Choice by Actual vs. Perceived Distance
Figure 7 shows proportion of each mode choice based on individuals’ actual distance (AD) vs. perceptive distance (PD) to identify whether perceptive distance makes any difference on mode choice. The AD is calculated using the network distance and PD is measured based on students’ selected answers in a survey questionnaire on how far from campus they live. All the differences in the mode of transportation and zones are statistically significant with a chi-square value of 210 and p = 0.001 (results are not shown in table). Of all regular walking commuters (19.4% students), 75% live within AD zone 1 and only 14% live within AD zone 2 (Figure 7), which are consistent with what Shannon et al. [31] have found among Australian university students. The perceptive distance (PD) seems to have different outcomes on walkers. The proportion of walking commuter is higher if students thought they lived within 1.61 km, or 1 mile, from campus compared to the actual distance, 92.7% vs. 75%, respectively. In contrast, none identified themselves as walking commuters if students thought they lived beyond 8 km, or 5 miles, from campus, whereas 6.3% of the walking commuters, in fact, lived at this distance in zones 4 and 5 (Figure 7).
Of the small percentage of survey participants who use bicycles as the primary mode of transportation to campus (5.5%), 44% live within AD zone 1, followed by 22% in AD zone 2, and then it gradually declines in AD zone 3 (15%) and slightly rises again in AD zone 5 (19%) (Figure 7). In contrast, self-identified bike commuters are substantially higher (about 8% more) if students thought they lived in PD zone 1. Similarly, fewer students identified themselves as bicycle commuters (11% vs. 19%) if they perceived that they lived beyond 8 km (PD zone 4) from the UNCG campus (AD zones 4 and 5). While a majority of walking and bicycle commuters lived within AD zones 1 and 2, within 3.3 km from UNCG campus, 98% of all walkers and 74% of all bicycle riders perceived that they lived within 3.3 km from campus. In reality, 89% of all walkers and 66% bicycle riders actually lived within these zones (Figure 7).
Of all transit users (about 6%), the proportion of transit riders (about 10%) is lowest in AD zone 1, but it rises in AD zones 2 and 3. The largest percentage of transit users (35%) are found in AD zone 3 (Figure 6 and Figure 7). Transit users continue to decline in AD zones 4 and 5, 17% and 10%, respectively. In contrast, transit commuters are substantially higher if students thought they lived beyond 8 km (PD zone 4) from campus than the real distance, 41% vs. 27%, respectively. Similarly, of all carpool commuters (5.5%), a majority (44.4%) of all carpoolers live in the AD zone 3 (Figure 7), but only 22% carpoolers thought they lived in this zone. While only 41% carpoolers lived in AD zones 4 and 5, which is 8 km from the campus, 53% of carpoolers thought they lived beyond this distance. Similarly, the proportion of driving alone is substantially higher if students thought they lived beyond 8 km from campus. Clearly, there are mismatches in modal shares between perceptive and objective distances as the perception of closeness in distance increases the motivation of using walk and bike modes. The perception of higher distance increases the car, carpool, and transit uses to the UNCG campus.
4.4. Barriers for LCT
In order to assess the major perceived (or real) barriers on the pedestrian and bicycling networks for those students who were not walking or bicycling to campus, the survey included such questions. The participants are allowed to choose more than one reason. A total of 353 participants responded to this question and the results are shown in Figure 8. The most cited reasoning for not walking or biking to campus is “I have too many things to carry”, followed by “too busy to walk”. The first answer is consistent with the logistic concept as resistance to travel by walking or bicycling increases disproportionately if there are too many things to carry due to insufficiency of those modes or the inconvenience that they create. The later selection is consistent with the “law of constant travel time” which demonstrates that commuters always try to minimize travel time and will change modes in order to save time (e.g., [65]). Individual’s perceptions about their environment are the second largest reasoning for discouragement of low-carbon mode choices, such as concern about the speed and the number of cars on the street, the lack of sidewalks, concern about the safety of intersections/street crossings, and not enough lights at night.
The following question was also posed to non-LCT commuters: “What would motivate you to ride a bike?” Few responded to this question, and of those the majority respondents said that living closer to campus would be a major factor in their transportation choice. Others listed either separate bike paths from the street as a component, or bike paths along the street. Only one person expressed that he/she would never switch modes. Survey participants were also asked the reasons for not using transit. Very few students participated in this question, but most of them viewed transit as unreliable and unsafe. While one student stated, “[the] bus is not dependable to get me to class on the hour or on the half hour”, another stated “public transportation is bad and I am busy and can’t wait for [the] bus. PART bus does not run late enough for evening classes”. Concern over the safety of the transit service is mostly associated with students for nightly classes. “I work late nights on campus and I didn’t feel safe waiting around for public transportation to pick me up” and “I drive to my night class because I do not like to walk back to my apartment in the dark, not enough street lights and it doesn’t feel as safe as it does in the day time” are examples of students’ responses. Clearly, our data supports that reliability in transit service would motivate students to use transit more. Since 40% of those surveyed responded live at least 8 km from campus (see Table 2), it is safe to say that the majority of students would be more than willing to use LCT if they find it safe and practical (e.g., run on time) for their use.
4.5. Predictive Modeling
A binary logistic regression model is estimated for each mode of LCT: walking, bicycling and transit. Binary logistic regression is well suited for this analysis since this research is interested in identifying risk factors by odd ratios (OR) for each travel, yes vs. no, while controlling for all other explanatory variables in the logistic model. Public transit is included in LCT under the assumption that the user will have to walk or bicycle at both ends of the journey to reach the public transport “nodes” or stops [31]. At the same time transit produces significantly lower CO2 emissions than cars [66]. While carpooling represents more energy savings than solo-driving, both models are important for understanding the barriers of LCT and, hence, carpooling and solo-auto commuter models are also estimated. The forward conditional method for logistic regression is performed using IBM SPSS 25 developed by SPSS Inc. located in Chicago, IL, United States. The best models with statistically significant explanatory variables (at α ≤ 0.05) for each commute mode is shown in Table 3. While perceived zones have more explanatory power than real network distance (results are not shown in this paper), we used real distance for logistic purpose since locational variables, such as distance from the bus stops, sidewalk length and ratio, and bicycle length and ratio variables are associated with real distance, not with perceived distance.
4.5.1. Walk
The walk model is correctly able to predict a 69% variation of walk commutes to UNCG (Table 3). The odds ratio of NetZone1 vs. all other zones are 8.491, meaning that the odds of walking commuters increases by 749% with each percent increase of additional students in zone 1, which is within 1.61 km form the UNCG campus,. An increase in sidewalk ratio at students’ home location increases the odds of walking to campus, too. The most importantly, the odds of walking increase 633% if students are habitual walkers for their transportation needs. Similarly, the odds of walking increase by 322% if neighborhoods are self-selected by the students for convenient access to the campus. Interestingly, a higher distance from a bus stop to the home location increases the odds of walking to campus. In contrast, the odds of walking to the campus decrease if students have too many things to carry and if they perceived street crossing was unsafe. Similarly, student’s car ownership decreases the odds of using such mode.
4.5.2. Bicycle
The bicycle model explains a 32% variation in bicycle mode choice, which is lower than the walk model (Table 3). This may be due to the small bicycle riders’ sample (n = 27) in the data. White and more physically active students are more likely to engage in bicycling to campus. For example, an individual who self-identified as white is seven times more likely to bike to campus, while student’s car ownership decreases the odds of using such mode 81%. The odds of bicycle commute increase almost five times if students like to be physically active, while the odds of bicycling decrease 77% if a student perceives a car would be faster to commute to UNCG than riding a bicycle. It is no surprise that the odds of bicycling also decreases 91% if an individual has many things to carry.
4.5.3. Transit
The transit model is correctly able to predict a 22% variation of transit commutes to UNCG (Table 3). Given the fewer transit riders in the sample (n = 23) (Figure 6), such low predictability of the model is not unusual. Individuals living in zone 4, which is >8 km from UNCG + <1 km from the nearest bus stop, are 3.35 times more likely to ride transit to campus than students living in any other zones. In contrast, the odds of riding transit decrease 73% if anyone chose their transport mode based on the perception that car would be faster. Similarly, car ownership decreases the likelihood of transit commuting. Self-identified white individuals are also less likely to ride transit than any other racial/ethnic groups.
4.5.4. Carpool
The carpool model explains a 12% variation in mode choice, which may be due to the lower (n = 27) sample size (Table 4). Individuals living in zone 3, which is between >3.2 km and ≤8 km from the UNCG + <1 km from the nearest bus stop, and zone 4, distance >8 km from UNCG + <1 km from the nearest bus stop, have greater odds (4 and 3.37 times, respectively) to carpool than living in any other zones. While a higher distance from the bus stop increases the odds of carpooling, car ownership decreases the odds of carpooling.
4.5.5. Solo-Driver
The solo automobile commuters’ model is correctly able to predict a 58% variation of mode choice to UNCG. The two most influential variables that increase the odds of the solo-auto mode choice are car ownership and individuals having many things to carry (15 and four times, respectively). Similarly, individuals living in zone 5, at a distance >8 km from UNCG + >1 km from the nearest bus stop, and those who perceive car as a faster mode choice are three times more likely to be solo-driver. In contrast, individuals living in zone 1, want to live close to campus, and walking for transportation decrease the odds of solo-driving.
5. Discussion and Conclusions
This case study examines geographic variation of students’ low-carbon transportation (LCT) choice to a commuter campus by integrating a suite of variables developed in multiple disciplines. The LCT mode shares are impacted by various physical, demographic, and psychological dimensions. First, while physical environments are the most important factors for walk and transit commute, bicycle commute is not dependent on such factors. Distance (1.61 km from campus) either perceived or real is the most important factor for walk commuter, while transit ridership is most likely increases if students live >8 km from UNCG campus with nearest bus stop within 1 km from home. Sidewalk ratio, as well as the increase in distance from bus stops, increase the odds for walking. The later factors suggest that students rather walk to campus if distance between home and bus stops are more than 1 km. In contrast, bike score or bike lanes do not have significant impact on bicycle commuters, nor the distance from the campus. This is consistent with Zhou’s [14] finding suggesting no correlation between commute distance and students’ biking to UC–Los Angeles. Given the limited bicycle lanes in Greensboro, this is no surprising. Students who commute to campus by bicycle are resilient to unfavorable bicycle condition by sharing the road with car and adjusting their travel routes [56,67]. Solo-auto driver most likely increases 15 times in commuter zone 5, where no bus service is available and the area is outside 8 km from campus, while less likely decreases in zone 1. Clearly, the relationship between the built-environment and solo-driving and built-environment and walking have opposite effects.
Second, while socio-demography has no significant impact on walk mode choice, bicycle commuting is heavily impacted by such factors. Self-identified white students are 200% more likely to ride a bike and 75% less likely to take transit to campus. Car ownership has a negative impact on both bicycle and transit mode shares, but not for the walking mode choice since walking is heavily dependent on the 1.61 km distance threshold. While race does not make any difference on solo driving commuters, car ownership increases the greatest likelihood of such commuters that include carpooling. Our findings are in line with past studies that identified cycle commuters are more likely white middle class [68], and bus riders are low-income non-whites in the USA [54,69].
Third, psychological factors, such as perceptions, motives, habits, beliefs and attitudes have a significant impact on LCT. While we could not include perceptive zones in our models for logistic purposes, our cross-tabulation analysis and walking model (not presented in the Results section) with perceived zones show that students walk greater distances if they perceive that they live within 1.61 km from campus. Our research finds that not only the actual distance, but also people’s perceived distance has an impact on walking and bicycling [36,38,42]. While safety concerns about street crossing decrease the odds of walkers, there is no significant impact on such a perception of space for bicyclers. Habit is an important factor for mode choice. For example, having a walking habit increases the likelihood of walking. Students who are habitual walkers for meeting transportation needs are more likely commute to campus by walking. In contrast, the decision to cycle every day is affected by the direct benefit factor [55]. For example, our findings suggest that bicycle commuters are motivated heavily by their willingness to remain physically active or the joy of riding it [56]. The odds of both bicycle and transit commuters decrease if individuals have to carry many things and the perception about a car as a necessity for faster mobility needs increase.
Fourth, while this research does not compare transportation modal shares between university towns vs. commuter urban universities, underrepresentation of cycle and transit commuters in the study sample might be an indication of lower share of bicycle and transit commuters at UNCG. Additionally, given the distance from campus is the most important factor for the share of LCT mode, which is consistent with earlier mode-choice research, it is not unlikely that a commuter university like UNCG will have a lower level of LCT. Most importantly, this research supports that perceived space and faster mobility necessity are more influential than actual distance and mobility needs [31,39,70]. Similarly, this research supports the self-selection hypothesis, which demonstrates that students can locate closer to campus if they prefer to LCT mode.
Fifth, given that the majority of our participants are female, and the small sample size for bicycle and transit users, our models have some limitations in this study. Some important variables did not enter in the models due to their insignificant relationships with LCT, but we think this is because of the small sample size. Therefore, they are worthy of discussion. For example, unlike past studies (e.g., [15,71]), our analysis did not give an indication that being female, or more bicycle and pedestrian accidents are associated with lower level of LCT mode shares. A higher population density seems to make slightly positive differences in the walk mode, but shows negative association with the bicycle mode. These variables should be considered seriously for further study with larger sample sizes because of their direction of relationships in our analysis. Similarly, pro-environmental behaviors seem to slightly positively affect the LCT mode. Further, this research did not collect data for students’ year at college (e.g., sophomore, freshman, senior. etc.). We think the length of time students have been in college affects their familiarity with the area, as well as the degree to which they have been exposed to diverse social, political, and environmental ideals, which may impact the mode choice. Our research also did not have data about the time of students’ classes, or destinations after classes. These variables should be considered seriously for further study.
Finally, although this analysis has limitations, the results presented here have important implications for commuter campuses, like UNCG or non-student communities. While energy-saving technologies, such as electric or hybrid cars, can play an important role in transitioning to low-carbon transport, it may not be realistic to expect to address the challenge of CO2 emissions rapidly enough with this technology [72]. Alternative-fuel vehicles (AFVs) are already established in the market, but refueling infrastructure for these types of vehicles is still in its initial stage in most places and has limited consumer acceptance [73]. Even though a new AAA survey finds 20% of Americans thinks their next vehicle will be an electric car, most Americans cannot afford a new car [74]. While zero emission car development technology may be environmentally beneficial, at the same time it may contradict transport equity due to the issue of affordability [75]. We also acknowledge that it is not realistic to change travel behavior rapidly to reduce car usage in the United States, but college campuses have populations that are acceptable to the idea of LCT. Therefore, commuter universities can greatly increase the use of LCT on their campuses and in their surrounding communities. Investment in LCT will not will decrease the CO2 emissions, it will also decrease the socio-spatial inequalities associated with automobile and increase public health benefits, such as a reduction in mortality and morbidity [76].
There are many opportunities for commuter universities to build communities for low-carbon travel behaviors. For example, universities can partner with cities to build affordable housing with mixed-land uses targeting students within 2 km of campus to make zero car use zone. Improving the bicycle network and public transit with zero emission buses with integrated land use and close proximity to bus stops can reduce many negative externalities of automobile mobility for individuals living beyond 2 m from campus [77]. Our findings strongly support Greensboro’s current initiative “Mobility Greensboro 2040” and “Vision Zero” planning and policy initiatives for enhancing equitable and safe transit-oriented multi-modal infrastructures [60]. There is considerable agreement in the literature and our findings reiterate cities that build with a mixed-land use, transit accessible, well-connected street network with good sidewalks encourage higher levels of LCT mode shares for the entire populations. Therefore, the “Vision Zero” program will not only enhance the LCT mode for the UNCG students, it also can encourage non-student populations to utilize LCT modes. Universities often play a major role in expanding the quality of the local economy and cultures, hence, we suggest that UNCG should utilize its influence to advocate and further facilitate these ongoing efforts by partnering with local transportation and planning stakeholders.
Author Contributions
S.S. originally came up with the idea and designed the conceptual framework of the research with H.K., N.P., and F.K. While S.S. did the major share of analysis and wrote the paper, H.K., N.P., and F.K. contributed to the data acquisition and analysis whenever needed.
Funding
The authors acknowledge the financial support from the University of North Carolina at Greensboro for conducting this research.
Conflicts of Interest
The authors declare no conflict of interest.
References
- Tolley, R. Green campuses: Cutting the environmental cost of commuting. J. Transp. Geogr. 1996, 4, 213–217. [Google Scholar] [CrossRef]
- Balsas, C.J.L. Sustainable transportation planning on college campuses. Transp. Policy 2003, 10, 35–49. [Google Scholar] [CrossRef]
- Bonham, J.; Koth, B. Universities and the cycling culture. Transp. Res. Part D Transp. Environ. 2010, 15, 94–102. [Google Scholar] [CrossRef]
- Kaplan, D.H. Transportation sustainability on a university campus. Int. J. Sustain. High. Educ. 2015, 16, 173–186. [Google Scholar] [CrossRef]
- The American College & University Presidents Climate Commitment (ACUPCC). 2007 ACUPCC Annual Report. Available online: http://secondnature.org/ (accessed on 28 May 2018).
- Böcker, L.; Prillwitz, J.; Dijst, M. Climate change impacts on mode choices and travelled distances: A comparison of present with 2050 weather conditions for the Randstad Holland. J. Transp. Geogr. 2013, 28, 176–185. [Google Scholar] [CrossRef]
- Zhou, J. Proactive sustainable university transportation: Marginal effects, intrinsic values, and university students’ mode choice. Int. J. Sustain. Transp. 2016, 10, 815–824. [Google Scholar] [CrossRef]
- U.S. Department of Energy (USDOE). #948 Transportation Fact of the Week—2016 Archive. Available online: https://www.energy.gov/eere/vehicles/transportation-fact-week-2016-archive (accessed on 28 May 2018).
- Givoni, M.; Banister, D. Moving Towards Low Carbon Mobility; Edward Ellgar: Cheltenham, UK, 2013; ISBN 9781781007228. [Google Scholar]
- Wang, J.; Lindsey, G. Equity of Bikeway Distribution in Minneapolis, Minnesota. Transp. Res. Rec. 2017, 2605, 18–31. [Google Scholar] [CrossRef]
- Lee, R.J.; Sener, I.N.; Jones, S.N. Understanding the role of equity in active transportation planning in the United States. Transp. Rev. 2017, 37, 211–226. [Google Scholar] [CrossRef]
- Pucher, J.; Buehler, R. Cycling towards a more sustainable transport future. Transp. Rev. 2017, 37, 689–694. [Google Scholar] [CrossRef] [Green Version]
- Grisé, E.; El-Geneidy, A. If we build it, who will benefit? A multi-criteria approach for the prioritization of new bicycle lanes in Quebec City, Canada. J. Transp. Land Use 2018, 11, 1–22. [Google Scholar] [CrossRef]
- Zhou, J. University Students’ Mode Choice in College Towns. In Proceedings of the Transportation Research Board 96th Annual Meeting, Washington, DC, USA, 8–12 January 2017. [Google Scholar]
- Delmelle, E.; Delmelle, E.C.; Casas, I.; Barto, T. HELP: A GIS-based Health Exploratory AnaLysis Tool for Practitioners. Appl. Spat. Anal. Policy 2011, 4, 113–137. [Google Scholar] [CrossRef]
- Pitsiava-Latinopoulou, M.; Basbas, S.; Gavanas, N. Implementation of alternative transport networks in university campuses. Int. J. Sustain. High. Educ. 2013, 14, 310–323. [Google Scholar] [CrossRef]
- Lundberg, B.; Weber, J. Non-motorized transport and university populations: An analysis of connectivity and network perceptions. J. Transp. Geogr. 2014, 39, 165–178. [Google Scholar] [CrossRef]
- Nakamura, K.; Hayashi, Y. Strategies and instruments for low-carbon urban transport: An international review on trends and effects. Transp. Policy 2013, 29, 264–274. [Google Scholar] [CrossRef]
- Duarte, F.; Gadda, T.; Moreno Luna, C.A.; Souza, F.T. What to expect from the future leaders of Bogotá and Curitiba in terms of public transport: Opinions and practices among university students. Transp. Res. Part F 2016, 38, 7–21. [Google Scholar] [CrossRef]
- Schwanen, T.; Banister, D.; Anable, J. Rethinking habits and their role in behaviour change: The case of low-carbon mobility. J. Transp. Geogr. 2012, 24, 522–532. [Google Scholar] [CrossRef]
- Rybarczyk, G. Toward a spatial understanding of active transportation potential among a university population. Int. J. Sustain. Transp. 2018, 1–12. [Google Scholar] [CrossRef]
- Guinn, J.M.; Stangl, P. Pedestrian and bicyclist motivation: An assessment of influences on pedestrians’ and bicyclists’ mode choice in Mt. Pleasant, Vancouver. Urban Plan. Transp. Res. 2014, 2, 105–125. [Google Scholar] [CrossRef]
- Boettge, B.; Hall, D.M.; Crawford, T. Assessing the bicycle network in St. Louis: A place-based user-centered approach. Sustainability 2017, 9, 241. [Google Scholar] [CrossRef]
- The University of North Carolina System. The UNC Policy Manual. Available online: http://www.northcarolina.edu/apps/policy/index.php?pg=vs&id=5606 (accessed on 28 May 2018).
- UNCG Office of Sustainabilitty. GETTING TO ZERO: THE UNCG CLIMATE ACTION PLAN. Available online: https://beta-sustainability.uncg.edu/operating-papers/uncg-climate-action-plan-2/ (accessed on 28 May 2018).
- Pucher, J.; Dill, J.; Handy, S. Infrastructure, programs, and policies to increase bicycling: An international review. Prev. Med. 2010, 50, S106–S125. [Google Scholar] [CrossRef] [PubMed]
- Useche, S.; Montoro, L.; Alonso, F.; Oviedo-Trespalacios, O. Infrastructural and human factors affecting safety outcomes of cyclists. Sustainability 2018, 10, 299. [Google Scholar] [CrossRef]
- Peachey, A.A.; Baller, S.L. Perceived Built Environment Characteristics of On-Campus and Off-Campus Neighborhoods Associated with Physical Activity of College Students. J. Am. Coll. Health 2015, 63, 337–342. [Google Scholar] [CrossRef] [PubMed]
- Loukaitou-Sideris, A.; Medury, A.; Fink, C.; Grembek, O.; Shafizadeh, K.; Wong, N.; Orrick, P. Crashes on and near college campuses: A comparative analysis of pedestrian and bicyclist safety. J. Am. Plan. Assoc. 2014, 80, 198–217. [Google Scholar] [CrossRef]
- Frank, L.; Bradley, M.; Kavage, S.; Chapman, J.; Lawton, T.K. Urban form, travel time, and cost relationships with tour complexity and mode choice. Transportation 2008, 35, 37–54. [Google Scholar] [CrossRef]
- Shannon, T.; Giles-Corti, B.; Pikora, T.; Bulsara, M.; Shilton, T.; Bull, F. Active commuting in a university setting: Assessing commuting habits and potential for modal change. Transp. Policy 2006, 13, 240–253. [Google Scholar] [CrossRef]
- Chillón, P.; Molina-García, J.; Castillo, I.; Queralt, A. What distance do university students walk and bike daily to class in Spain. J. Transp. Health 2016, 3, 315–320. [Google Scholar] [CrossRef]
- Van Wee, B. Evaluating the impact of land use on travel behaviour: The environment versus accessibility. J. Transp. Geogr. 2011, 19, 1530–1533. [Google Scholar] [CrossRef]
- Maddison, R.; Jiang, Y.; Hoorn, S.V.; Mhurchu, C.N.; Exeter, D.; Utter, J. Perceived versus Actual Distance to Local Physical-Activity Facilities: Does It Really Matter? J. Phys. Act. Health 2010, 7, 323–332. [Google Scholar] [CrossRef] [PubMed]
- Ma, L.; Dill, J. Do people’s perceptions of neighborhood bikeability match “Reality”? J. Transp. Land Use 2016, 10, 291–308. [Google Scholar] [CrossRef]
- McGinn, A.P.; Evenson, K.R.; Herring, A.H.; Huston, S.L.; Rodriguez, D.A. Exploring associations between physical activity and perceived and objective measures of the built environment. J. Urban Health 2007, 84, 162–184. [Google Scholar] [CrossRef] [PubMed]
- Wardman, M.; Tight, M.; Page, M. Factors influencing the propensity to cycle to work. Transp. Res. Part A Policy Pract. 2007, 41, 339–350. [Google Scholar] [CrossRef] [Green Version]
- Scheepers, C.E.; Wendel-Vos, G.C.W.; van Kempen, E.E.M.; de Hollander, E.L.; van Wijnen, H.J.; Maas, J.; den Hertog, F.R.J.; Staatsen, B.A.M.; Stipdonk, H.L.; Int Panis, L.L.R.; et al. Perceived accessibility is an important factor in transport choice—Results from the AVENUE project. J. Transp. Health 2016, 3, 96–106. [Google Scholar] [CrossRef]
- Haustein, S.; Hunecke, M. Reduced use of environmentally friendly modes of transportation caused by perceived mobility necessities: An extension of the theory of planned behavior. J. Appl. Soc. Psychol. 2007, 37, 1856–1883. [Google Scholar] [CrossRef]
- Sultana, S. Factors associated with students’ parking-pass purchase decisions: Evidence from an American University. Transp. Policy 2015, 44, 65–75. [Google Scholar] [CrossRef]
- Van Exel, N.J.A.; Rietveld, P. Could you also have made this trip by another mode? An investigation of perceived travel possibilities of car and train travellers on the main travel corridors to the city of Amsterdam, The Netherlands. Transp. Res. Part A Policy Pract. 2009, 43, 374–385. [Google Scholar] [CrossRef]
- Emond, C.R.; Handy, S.L. Factors associated with bicycling to high school: Insights from Davis, CA. J. Transp. Geogr. 2012, 20, 71–79. [Google Scholar] [CrossRef]
- Ma, L.; Cao, J. How perceptions mediate the effects of the built environment on travel behavior? Transportation 2017, 1–23. [Google Scholar] [CrossRef]
- Hull, A.; O’Holleran, C. Bicycle infrastructure: Can good design encourage cycling? Urban Plan. Transp. Res. 2014, 2, 369–406. [Google Scholar] [CrossRef]
- Rybarczyk, G.; Gallagher, L. Measuring the potential for bicycling and walking at a metropolitan commuter university. J. Transp. Geogr. 2014, 39, 1–10. [Google Scholar] [CrossRef]
- Pike, S.; Lubell, M. Geography and social networks in transportation mode choice. J. Transp. Geogr. 2016, 57, 184–193. [Google Scholar] [CrossRef]
- Pucher, J.; Buehler, R. Making cycling irresistible: Lessons from the Netherlands, Denmark and Germany. Transp. Rev. 2008, 28, 495–528. [Google Scholar] [CrossRef]
- Carse, A.; Goodman, A.; Mackett, R.L.; Panter, J.; Ogilvie, D. The factors influencing car use in a cycle-friendly city: The case of Cambridge. J. Transp. Geogr. 2013, 28, 67–74. [Google Scholar] [CrossRef] [PubMed]
- Bamberg, S.; Schmidt, P. Incentives, Morality, or Habit? Predicting Students’ Car Use for University Routes with the Models of Ajzen, Schwartz, and Triandis. Environ. Behav. 2003, 35, 264–285. [Google Scholar] [CrossRef]
- Haustein, S.; Klöckner, C.A.; Blöbaum, A. Car use of young adults: The role of travel socialization. Transp. Res. Part F Traffic Psychol. Behav. 2009, 12, 168–178. [Google Scholar] [CrossRef]
- Davison, L.; Ahern, A.; Hine, J. Travel, transport and energy implications of university-related student travel: A case study approach. Transp. Res. Part D Transp. Environ. 2015, 38, 27–40. [Google Scholar] [CrossRef]
- Garikapati, V.M.; Pendyala, R.M.; Morris, E.A.; Mokhtarian, P.L.; McDonald, N. Activity patterns, time use, and travel of millennials: A generation in transition? Transp. Rev. 2016, 36, 558–584. [Google Scholar] [CrossRef]
- Kuhnimhof, T.; Buehler, R.; Wirtz, M.; Kalinowska, D. Travel trends among young adults in Germany: Increasing multimodality and declining car use for men. J. Transp. Geogr. 2012, 24, 443–450. [Google Scholar] [CrossRef]
- Brown, A.; Blumenberg, E.; Taylor, B.; Ralph, K.; Voulgaris, C. A Taste for Transit? Analyzing Public Transit Use Trends among Youth. J. Public Transp. 2016, 19, 49–67. [Google Scholar] [CrossRef] [Green Version]
- Heinen, E.; Maat, K.; Van Wee, B. The role of attitudes toward characteristics of bicycle commuting on the choice to cycle to work over various distances. Transp. Res. Part D Transp. Environ. 2011, 16, 102–109. [Google Scholar] [CrossRef]
- Caldwell, K.B.; Boyer, R.H.W. Bicycle commuting in an automobile-dominated city: How individuals become and remain bike commuters in Charlotte, North Carolina. Transportation 2018, 1–22. [Google Scholar] [CrossRef]
- Schwanen, T.; Lucas, K. Understanding auto motives. In Auto Motives: Understanding Car Use Behaviors; Lucas, K., Blumenberg, E., Weinberger, R., Eds.; Emerald Group Publishing: Bingley, UK, 2011; pp. 3–38. ISBN 978-0-85-724233-4. [Google Scholar]
- Office of Institutional Research (UNCG-IR). Fast Facts (Fall 2017). Available online: https://ire.uncg.edu/fastfacts/ (accessed on 28 May 2018).
- Best Workplaces for Commuters. 2018 List of Best Workplaces for Commuters. Available online: https://www.bestworkplaces.org/list/list-by-state-2/ (accessed on 28 May 2018).
- City of Greensboro and Greensboro Transit Authority. Mobility Greensboro 2040. Available online: http://getonboard2040.org/ (accessed on 28 May 2018).
- The League of American Bicyclists. Greensboro, NC Bicycle Friendly Community Report Card. Available online: http://www.bikeleague.org/sites/default/files/bfareportcards/BFC_Fall_2017_ReportCard_Greensboro_NC.pdf (accessed on 31 July 2018).
- Greensboro Department of Transportation (GDOT). Available online: https://www.greensboro-nc.gov/departments/transportation (accessed on 28 May 2018).
- Hall, C.M.; Ram, Y. Walk score® and its potential contribution to the study of active transport and walkability: A critical and systematic review. Transp. Res. Part D Transp. Environ. 2018. [Google Scholar] [CrossRef]
- Winters, M.; Teschke, K.; Brauer, M.; Fuller, D. Bike Score®: Associations between urban bikeability and cycling behavior in 24 cities. Int. J. Behav. Nutr. Phys. Act. 2016, 13, 18. [Google Scholar] [CrossRef] [PubMed]
- Schafer, A.; Victor, D.G. The future mobility of the world population. Transp. Res. Part A Policy Pract. 2000, 34, 171–205. [Google Scholar] [CrossRef] [Green Version]
- Hodges, T. Public Transportation’s Role in Responding to Climate Change. United States Department of Transportation. Available online: https://www.transit.dot.gov/regulations-and-guidance/environmental-programs/public-transportations-role-reducing-greenhouse-gas (accessed on 28 May 2018).
- Guell, C.; Panter, J.; Ogilvie, D. Walking and cycling to work despite reporting an unsupportive environment: Insights from a mixed-method exploration of counterintuitive findings. BMC Public Health 2013, 13, 497. [Google Scholar] [CrossRef] [PubMed]
- Plaut, P.O. Non-motorized commuting in the US. Transp. Res. Part D Transp. Environ. 2005, 10, 347–356. [Google Scholar] [CrossRef]
- Dargay, J.; Gately, D. Income’s effect on car and vehicle ownership, worldwide: 1960–2015. Transp. Res. Part A Policy Pract. 1999, 33, 101–138. [Google Scholar] [CrossRef]
- Gardner, B.; Abraham, C. What drives car use? A grounded theory analysis of commuters’ reasons for driving. Transp. Res. Part F Traffic Psychol. Behav. 2007, 10, 187–200. [Google Scholar] [CrossRef]
- Abasahl, F.; Kelarestaghi, K.B.; Ermagun, A. Gender gap generators for bicycle mode choice in Baltimore college campuses. Travel Behav. Soc. 2018, 11, 78–85. [Google Scholar] [CrossRef]
- Sultana, S.; Salon, D.; Kuby, M. Transportation sustainability in the urban context: A comprehensive review. Urban Geogr. 2017, 1–30. [Google Scholar] [CrossRef]
- Hong, S.; Kuby, M. A threshold covering flow-based location model to build a critical mass of alternative-fuel stations. J. Transp. Geogr. 2016, 56, 128–137. [Google Scholar] [CrossRef]
- Maynard, C. Most Americans Can’t Afford a New Car, Study Finds. CONSUMERAFFAIRS. Available online: https://www.consumeraffairs.com/news/most-americans-cant-afford-a-new-car-study-finds-062817.html (accessed on 28 May 2018).
- Vandycke, N. Technology Holds Great Promise for Transport. The World Bank. Available online: http://blogs.worldbank.org/transport/technology-holds-great-promise-transport (accessed on 28 May 2018).
- Sarigiannis, D.A.; Kontoroupis, P.; Nikolaki, S.; Gotti, A.; Chapizanis, D.; Karakitsios, S. Benefits on public health from transport-related greenhouse gas mitigation policies in Southeastern European cities. Sci. Total Environ. 2017, 579, 1427–1438. [Google Scholar] [CrossRef] [PubMed]
- Karanikola, P.; Panagopoulos, T.; Tampakis, S.; Tsantopoulos, G. Cycling as a smart and green mode of transport in small touristic cities. Sustainability 2018, 10, 268. [Google Scholar] [CrossRef]
Figure 1.
Theoretical framework of mode choice.

Figure 2.
City of Greensboro, NC with participating students’ residential locations.

Figure 3.
UNCG network zones with survey participants’ home locations.

Figure 4.
Proportion of modal splits by transportation network zones.

Figure 5.
Walking and bicycling to UNCG by transportation network zones.

Figure 6.
Geographic locations of transit riders with bus stops.

Figure 7.
Mode choice by actual distance (RD) vs. perceived distance (PD).

Figure 8.
Reasons for not walking or bicycling to campus.


Table 1.
Selected variables for analysis.
| Socio-Demographic Characteristics |
| Age |
| Race: White = 1; 0 = All Other |
| Gender: Female = 1; Male = 0 |
| Fulltime: Fulltime = 1; Part-time = 0 |
| Total income |
| Car ownership: Yes = 1; No = 0 |
| Home ownership: Own = 1; Rent = 0 |
| Physical Characteristics at Students’ Home Locations |
| Walk score |
| Bike score |
| Distance from campus |
| NetZone1 = 1; All other = 0 |
| NetZone2 = 1; All other = 0 |
| NetZone3 = 1; All other = 0 |
| NetZone4 = 1; All other = 0 |
| NetZone5 = 1; All other = 0 |
| PercievedZone1 = 1; All other = 0 |
| PercievedZone2 = 1; All other = 0 |
| PercievedZone3 = 1; All other = 0 |
| PercievedZone4 = 1; All other = 0 |
| Length of sidewalk; Sidewalk ratio |
| Length of bike lane; Bike lane ratio |
| Population density |
| Bus stop distance from home |
| Number of bike accidents; Number of pedestrian accidents |
| Psychological Variables: Habits, Beliefs, Attitudes, and Perceptions |
| Convenience to UNCG is the primary reason for home location: Yes = 1; No = 0 |
| Affordability is the primary reason for home location; Yes = 1; No = 0 |
| Like to be physically Active: Yes = 1; No = 0 |
| Bike for transportation: Yes = 1; No = 0 |
| Walk for transportation: Yes = 1; No = 0 |
| Saving time is the most important reason for driving to campus: Yes = 1; No = 0 |
| Obstruction for walking/bicycling 1: Too many things to carry = 1; All Other = 0 |
| Obstruction for walking/bicycling 2: Too many cars on the street = 1; All Other = 0 |
| Obstruction for walking/bicycling 3: Unsafe street crossing = 1; All other = 0 |
| Obstruction for walking/bicycling 4: Traffic is too fast = 1; All other = 0 |
| Obstruction for walking/bicycling 5: No bike path = 1; All other = 0 |
| Obstruction for walking/bicycling 6: No side walk or bad condition = 1; All other = 0 |
| Obstruction for walking/bicycling 7: Too busy to walk = 1; All other = 0 |
| Obstruction for walking/bicycling 8: Not enough light on street at night = 1; All other = 0 |
| Consider myself an environmentalist: Yes = 1; No = 0 |
| Willing to move close to campus for reducing GHG emission: Yes = 1; No = 0 |
| Willing to move close to campus for reducing travel time and cost: Yes = 1; No = 0 |
Table 2.
Survey participants’ basic demographic, location, and transport characteristics.
| Basic Characteristics of Students | Respondents (n) | Percent Valid Respondents | Total Valid Sample (N) | Missing | |
|---|---|---|---|---|---|
| Student status | Full-Time | 476 | 90.5 | 526 (92.3%) | 44 (7.7%) |
| Part-Time | 50 | 9.5 | |||
| Age | Traditional Students (≤25 years old) | 336 | 62.7 | 536 (94%) | 34 (6.0%) |
| Non-traditional (≥25 years old) | 200 | 37.3 | |||
| Gender | Male | 150 | 28.1 | 534 (93.7%) | 36 (6.3%) |
| Female | 384 | 71.9 | |||
| Race/ethnicity | White | 363 | 68.1 | 534 (93.7%) | 36 (6.3%) |
| Black/African American | 72 | 13.5 | |||
| Asian | 36 | 6.7 | |||
| Hispanic | 12 | 2.2 | |||
| Multicultural | 23 | 4.3 | |||
| Native Am, Pacific Island & other | 28 | 5.2 | |||
| Students’ income | <25 K | 363 | 70.1 | 515 (90.4) | 55 (9.6%) |
| >25 K | 152 | 29.5 | |||
| Parents’ income | <50 K | 107 | 57.5 | 186 (32.7%) | 384 (67.3%) |
| >50 K | 79 | 42.5 | |||
| Owned car/s | Yes | 446 | 78.2 | 570 (100%) | |
| No | 124 | 21.8 | |||
| Live within zone (network distance from campus) | 1 (≤1.61 km) | 136 | 23.9 | 570 (100%) | |
| 2 (>1.61 km, ≥3.22 km) | 74 | 13.0 | |||
| 3 (>3.22 km, ≤8 km + <1 km from bus stops) | 134 | 23.5 | |||
| 4 (>8.1 km + <1 km from bus stops) | 72 | 12.6 | |||
| 5 (>8.1 km + more than 1 km from bus stops) | 154 | 27.0 | |||
| Dominant travel mode to campus | Walk | 96 | 19.4 | 495 (86.8%) | 75 (13.2%) |
| Bike | 27 | 5.5 | |||
| Drive Alone | 316 | 63.8 | |||
| Carpool | 27 | 5.5 | |||
| Transit and Other | 29 | 5.9 | |||
Table 3.
Binary logistic regression model for walking, bicycling, and transit commuters (Yes/No).
| Variables | Walk Model (n = 96) | Bicycle Model (n = 27) | Transit Model (n = 23) | ||||||
|---|---|---|---|---|---|---|---|---|---|
| B | SE | OR | B | SE | OR | B | SE | OR | |
| Socio-Demography | |||||||||
| Race: White = 1; 0 = All Other | 1.941 | 0.812 | 6.965 * | −1.358 | 0.473 | 0.257 * | |||
| Own a car = 1; No = 0 | −1.621 | 0.623 | 0.198 ** | −2.041 | 0.512 | 0.130 ** | |||
| Spatial features or built-environment at students’ home locations | |||||||||
| NetZone1 = 1; All other = 0 | 2.139 | 0.438 | 8.491 ** | ||||||
| NetZone3 = 1; All other = 0 | 1.208 | 0.578 | 3.347 * | ||||||
| Sidewalk ratio | 0.010 | 0.003 | 1.010 * | ||||||
| Bus stop distance from home | 0.109 | 0.056 | 1.116 * | ||||||
| Psychological Variables: Habits, beliefs, attitudes, and perceptions | |||||||||
| Convenience to UNCG is the primary reason for home location = 1; No = 0 | 1.171 | 0.396 | 3.224 * | ||||||
| I like to be physically active = 1; No = 0 | 1.565 | 0.775 | 4.783 * | ||||||
| I Walk for transportation = 1; No = 0 | 1.846 | 0.395 | 6.333 ** | ||||||
| Saving time is the most important reason for driving to campus = 1; No = 0 | −1.459 | 0.542 | 0.233 ** | −1.299 | 0.485 | 0.273 ** | |||
| Obstruction for walking/bicycling 1: Too many things to carry = 1; All Other = 0 | −2.066 | 0.576 | 0.127 ** | −2.411 | 1.043 | 0.090 * | |||
| Obstruction for walking/bicycling 3: Unsafe street crossing = 1; All other = 0 | −2.496 | 1.142 | 0.082 * | ||||||
| Nagelkerke R Square value | 0.688 | 0.318 | 0.217 | ||||||
** Significant at p ≤ 0.01; * Significant at p ≤ 0.05.
Table 4.
Binary logistic regression model for carpool and solo-auto driver (Yes/No).
| Variables | Carpool (n = 27) | Solo-Auto Driver (n = 316) | ||||
|---|---|---|---|---|---|---|
| B | SE | OR | B | SE | OR | |
| Socio-Demography | ||||||
| Car ownership: Yes = 1; No = 0 | −1.468 | 0.533 | 0.257 ** | 2.721 | 0.571 | 15.199 ** |
| Spatial Features or Built-Environment at Students’ Home Locations | ||||||
| NetZone1 = 1; All other = 0 | −1.320 | 0.353 | 0.267 ** | |||
| NetZone3 = 1; All other = 0 | 1.785 | 0.543 | 4.094 ** | |||
| NetZone4 = 1; All other = 0 | 1.218 | 0.603 | 3.379 * | |||
| NetZone5 = 1; All other = 0 | 1.101 | 0.540 | 3.006 * | |||
| Bus stop distance from home | 0.141 | 0.047 | 1.152 ** | |||
| Psychological Variables: Habits, Beliefs, Attitudes, and Perceptions | ||||||
| Convenience to UNCG is the primary reason for home location: Yes = 1; No = 0 | −0.905 | 0.336 | 0.404 ** | |||
| Walk for transportation: Yes = 1; No = 0 | −1.110 | 0.311 | 0.329 ** | |||
| Saving time is the most important reason for driving to campus: Yes = 1; No = 0 | 1.148 | 0.306 | 3.151 ** | |||
| Obstruction for walking/bicycling 1: Too many things to carry = 1; All Other = 0 | 1.388 | 0.328 | 4.006 ** | |||
| Nagelkerke R Square value | 0.123 | 0.583 | ||||
** Significant at p ≤ 0.001; * Significant at p ≤ 0.05.
© 2018 by the authors. Licensee MDPI, Basel, Switzerland. This article is an open access article distributed under the terms and conditions of the Creative Commons Attribution (CC BY) license (http://creativecommons.org/licenses/by/4.0/).
Share and Cite
MDPI and ACS Style
Sultana, S.; Kim, H.; Pourebrahim, N.; Karimi, F. Geographical Assessment of Low-Carbon Transportation Modes: A Case Study from a Commuter University. Sustainability 2018, 10, 2696. https://doi.org/10.3390/su10082696
AMA Style
Sultana S, Kim H, Pourebrahim N, Karimi F. Geographical Assessment of Low-Carbon Transportation Modes: A Case Study from a Commuter University. Sustainability. 2018; 10(8):2696. https://doi.org/10.3390/su10082696
Chicago/Turabian StyleSultana, Selima, Hyojin Kim, Nastaran Pourebrahim, and Firoozeh Karimi. 2018. "Geographical Assessment of Low-Carbon Transportation Modes: A Case Study from a Commuter University" Sustainability 10, no. 8: 2696. https://doi.org/10.3390/su10082696
Note that from the first issue of 2016, this journal uses article numbers instead of page numbers. See further details here.