Article

Tasty or Sustainable? The Effect of Product Sensory Experience on a Sustainable New Food Product: An Application of Discrete Choice Experiments on Chianina Tinned Beef

1
Department of Agricultural, Food and Environmental Sciences, University of Perugia, 06121 Perugia, Italy
2
Department of Land, Environment, Agriculture and Forestry, University of Padova, 35020 Legnaro (PD), Italy
*
Author to whom correspondence should be addressed.
Sustainability 2018, 10(8), 2795; https://doi.org/10.3390/su10082795
Submission received: 29 June 2018 / Revised: 20 July 2018 / Accepted: 4 August 2018 / Published: 7 August 2018
(This article belongs to the Special Issue Marketing of Sustainable Food and Drink)

Abstract

:
This study aims to contribute to the existing literature by verifying whether the degree of liking of a new food product influences people’s preferences and willingness to pay from a discrete choice experiment when dealing with sustainable food products. To this purpose, we considered the case study of the introduction into the Italian market of a new food product: tinned Chianina meat. Among the attributes considered for this new product, two in particular were related to sustainability: organic breeding and the preservation of a traditional rural landscape. Half of the respondents underwent a sensory test before taking part in the hypothetical market (discrete choice experiment), while the remaining were administered the tests in reverse order. Tasting the product before the discrete choice experiment did not produce different willingness to pay (WTP) parameters as estimated by a taste factor interaction. However, separating the respondents into those who liked or disliked the product in the tasting condition revealed differences in willingness to pay results. The preferences are different for more than 50% of the attributes considered, and the magnitude of this difference is quite relevant. The WTP for one well known and certified sustainability related attribute—organic breeding—was not affected by the liking, while, for the other—the preservation of a traditional rural landscape—the effect of liking decreases the WTP. As a consequence, we suggest that tasting and liking studies should be routinely coupled with discrete choice studies when analyzing the introduction of new food products, especially when considering sustainable attributes in the experimental design. In the case of organic products where the expectations about taste are higher, neglecting to consider their sensory perception, along with the other discrete choice experiment attributes, could seriously undermine their long lasting success on the market.

1. Introduction

Meat is part of the diet of most of the world population and its demand is supposed to grow by 68% from 2000 to 2030 [1] (18% in developed countries from 2002 to 2030). Considering the economic and social dimensions of sustainability, the importance of the livestock sector in economic terms for the agricultural sector is testified by its contribution for 40% of agriculture GDP according to the Food and Agriculture Organization of the United Nations (FAO) 2006 data [2], while in terms of social relevance it ensures employment for “1.3 billion people and creates livelihoods for one billion of the world’s poor” [2]. With regard to the environmental pillar of sustainability, according to the FAO report “Livestock’s Long Shadow Environmental Issues and Options” [2] livestock production has substantial environmental cost in terms of global greenhouse gas (GHG) emissions (18% on a worldwide basis) and it is “one of the leading causal factors in the loss of biodiversity, while in developed and emerging countries it is perhaps the leading source of water pollution”.
A solution to solve “the conflicting demands for animal products and environmental services” ([2], p. 276) is found in the possibility of a demand-driven change thanks to consumers’ power to foster a more sustainable production with healthier diets, and “the development of markets for organic products and other forms of eco-labelling”. A further note suggests that grass-land based production, especially in vulnerable areas, “must adjust itself to deliver landscape maintenance, biodiversity protection, clean water and eventually carbon sequestration, rather than only production of conventional livestock commodities” ([2], p. 276).
In a complex scenario like that of meat demand [3,4,5], our study aims to understand the relative importance of some of the sustainable attributes suggested by the FAO report to foster a consumer driven [6,7] “sustainable” meat production in the Italian market. In our specific case study, we considered a new food product (NFP), tinned Chianina meat, characterised by two attributes that can be related to the FAO’s report suggestions: organic production and the maintenance of the traditional landscape. The Chianina is an old Italian cattle breed raised since the Roman era and now reared throughout central Italy. Chianina beef is well known in Italy, since the traditional ‘bistecca alla fiorentina’, the Tuscan T-bone steak, is sourced from Chianina young beef. Because of its high quality, Chianina beef has never been marketed as tinned meat. In terms of sustainability, the Chianina meat is produced using breeding techniques that have less environmental impact (extensive breeding) and can improve biodiversity by rearing local breeds of cattle.
The production of organic meat is regulated by the Council Regulation (EC) No 834/2007 in Italy. The main aspects of the regulation are that livestock shall be fed with organic feed and that animal welfare should be respected. The concept of traditional rural landscape was introduced in Italy in 2012 by the Decree n. 0017070/2012 of the Ministry of Agriculture, Food and Forestry. According to such Decree and its implementing regulation, traditional rural landscapes “have been established in a given territory for a long time, even many centuries, and appear to have stabilized, or to evolve very slowly. They are generally maintained with practices and techniques requiring few external energy inputs, whether in the form of mechanization and irrigation or of chemical fertilizers and agro-drugs […]. Their stability, or slow evolution, is evidence of harmonious integration of production, the environment and culture in a given area or region” ([8], p. 26). Therefore, while the regulation relative to organic production relates to the sustainability of the farm producing the livestock and the livestock conditions, that relative to the traditional rural landscape is related to the sustainability of the territory in which the firm operates.
Besides the attributes suggested by FAO, we also considered the meat type, the meat processing method, the geographical origin certification (Protected Geographical Indication—PGI (The Protected Geographical Indication (PGI) label is part of the European Union quality logos—Regulation (EU) No 1151/2012), the packaging and price. This choice is motivated by the evidence from results about consumer preferences and perceptions both from literature [4,5] and large surveys like the Eurobarometer report 473 about European consumer preferences. According to the Special Eurobarometer report 473 [9], “more than three quarters (77%) say a respect for local tradition and ‘know-how’ is an important factor in their decision to buy food products, 76% say having a specific label ensuring quality is important while 75% say coming from a known geographic area is important in their decision to buy food products”.
The literature related to meat choice determinants highlights how consumer choices are driven by quality expectations and how the drivers of consumer demand should be studied and conceptualised with a multidimensional approach [3,4].
Demand for food products depends on the quality of the food, and consumers build quality expectations from quality cues and quality attributes [10]. Quality signals can be sensed before product consumption and can be further divided into intrinsic cues, which are related to the product’s physical characteristics (i.e., colour and visible fat) [11,12,13], and extrinsic cues (i.e., price, brand, and breed origin) [12,14]. Quality attributes, which can be perceived only during or after consumption [13], can be further classified into experience and credence attributes [15,16,17]. While experience attributes can be perceived during consumption, credence attributes cannot be directly evaluated, and they are part of the benefits expected by consumers, such as health, sustainability or environmental benefits [14].
Among quality signals, those related to the sustainability of food products are particularly important in order to ensure sustainable consumption and a sustainable food system for society (see FAO [18] for a definition of sustainable diets). Quality signals related to sustainability can be framed among the credence attributes, especially for what concerns the product labelling with regard to organic production [4].
Methods to analyze consumers’ preferences for products to be placed on the market fall into two main categories: affective methods and hypothetical markets. In affective methods [19], the product is assessed by a panel of consumers after they taste it. A variety of methods are used to express the degree of liking, with hedonic scaling being one of the most employed [20]. The significant advantages of affective methods are the possibility of identifying preferences related to the product itself and having the ability to quantify the number of potential future consumers who would buy it regularly after the real tasting. However, in general, affective methods sometimes fail to correctly predict real consumers’ behaviour because they do not take into account that consumers’ choices depend not only on food taste but also on other relevant factors [21] and price is one of the most important [22,23,24]. The importance of price in determining real purchase behaviour is crucial especially when dealing with preferences for healthier and more environmentally sustainable foods, as testified by previous research that highlighted how a higher perceived cost is a prevailing barrier [25,26], given that organic products are often more expensive.
In this respect, hypothetical markets have the advantage to take into consideration price and measure consumer preferences in monetary terms. They aim to analyze consumers’ preferences and their willingness to pay (WTP) to buy products that vary in certain attributes. Methods that can be used to this end can be grouped into two broad categories: experimental markets, such as experimental auctions [27], and stated preference approaches, such as contingent valuation (CVM), conjoint analysis and discrete choice experiments (DCEs) [28].
Since 2000, DCEs have become increasingly popular for the valuation of the WTP for some attributes of food products [29,30,31,32]. These methods have the advantages of having a sound theoretical background since they are based on the stochastic utility theory [33] and of being rather simple to apply (at least in regard to data collection). Moreover, DCEs use a familiar decision-making process, as the respondent is placed in a situation similar to typical, everyday purchasing activities in stores. Despite relative operational simplicity, using DCEs incurs some possible sources of error that might invalidate the reliability of the results. According to some authors [34,35], these methods tend to overestimate the real WTP of consumers. This effect might be amplified, at least in theory, by the lack of product tasting in DCEs.
According to De Pelsmaeker et al. [36], the study of consumer preferences for NFP development based only on a hypothetical description of the characteristics is one of the main criticism of conjoint analysis and discrete choice experiments [37]. While a “fully” hypothetical market can be considered sufficient for analyzing the importance of credence attributes and extrinsic cues, it seems that a certain consideration of consumer sensory preferences in the hypothetical market would help in enhancing the reliability of the DCE results [38]. Different authors [36,39,40,41] found that taste should be considered when a hypothetical market such as that used in conjoint analysis or discrete choice experiments is used to identify purchase decisions or elicit willingness to pay for NFP. According to Grunert [42], the re-purchase of an NFP, or product loyalty, depends on how well a product satisfies a consumer’s expectations. In addition, as De Pelsmaeker et al. [36] note, taste is a factor strictly related to the satisfaction of such expectations: while extrinsic attributes might be important, according to the authors, “it is really unlikely that any consumer will buy the product a second time after they tried it and disliked it” ([36], p. 111). The same is theorized looking at the horizontal dimension of perceived quality from the “Total Food Quality Model” presented by Grunert [43], which discriminates the importance between credence and experience qualities before and after a first purchase. According to this model, while credence and experience qualities are on the same level of importance before a first purchase, experience qualities such as taste become more important after a first purchase and crucial for subsequent purchases. As Grunert et al. [3] highlights, consumers associate different values and expectations to organic production. Besides good health, animal welfare and concern for the environment, organic production is often associated with better taste, and, in this respect, organic labeling raises the expectations of consumers also with regard to the sensory dimension of the meat. It is therefore really important to consider the sensory aspects of organic labelled products when studying consumers preferences for a new food product, given that, if the taste expectations are disconfirmed after purchase, this might rise “a potential barrier to consumer demand” [3]. Recent surveys on consumers’ preferences and purchase intentions support the literature quoted above in giving a key role to taste as a driver for purchase intentions. According to the International Food Information Council Foundation (IFIC) [44], US consumers declared that their purchase choice is driven by taste (84%), price (66%), healthiness (63%), convenience (49%), sustainability (38%), and brand (35%). With regard to the EU, a recent report on fishery product habits revealed that the “large majority of Europeans who never eat these products say they do not like their taste, smell or appearance (55%)” ([45], p. 450). Given that DCEs are often applied to derive WTP measures for the different attributes (both intrinsic and extrinsic) of an NFP, it is crucial to understand if such monetary estimates are reliable in a fully hypothetical scenario, or if combining a DCE with a sensory test to assess the degree of liking would alter such measures.
To date, the two methods—hedonic scaling and DCEs—have been applied jointly in only a few cases. With respect to the application of DCEs, Baba et al. [46] highlighted that tasting is able to modify, at least partially, the importance of the different attributes of beef, although these authors did not estimate the WTP. A positive relationship between WTP and product liking has been observed for some kinds of processed food. Barnes et al. [47] used a DCE to verify whether tasting a cheese can influence the WTP for the cheese, and they identified a positive relationship between the hedonic score and WTP. Similar results were obtained by Gabrielyan et al. [48] for beer. In a recent study, Malone and Lusk [49] combined the liking with consumer preferences in a DCE and found a positive relation between the liking score of the product and respondents’ WTP. Nevertheless, in the study, the authors used a “hypothetical” tasting, given that respondents were requested to declare their degree of liking about the products based on previous experiences, rather than on a “real” sensory test given that they did not use new products for the market. Hoek et al. [50] studied the willingness to substitute three products (rice, beef and tomatoes) with a sustainable counterpart. Again, they used “hypothetical tasting” and found that, especially for meat, taste and disgust were the main barriers in making consumers switch to the sustainable substitute. Nevertheless, the authors did not measure the impact of liking on WTP.
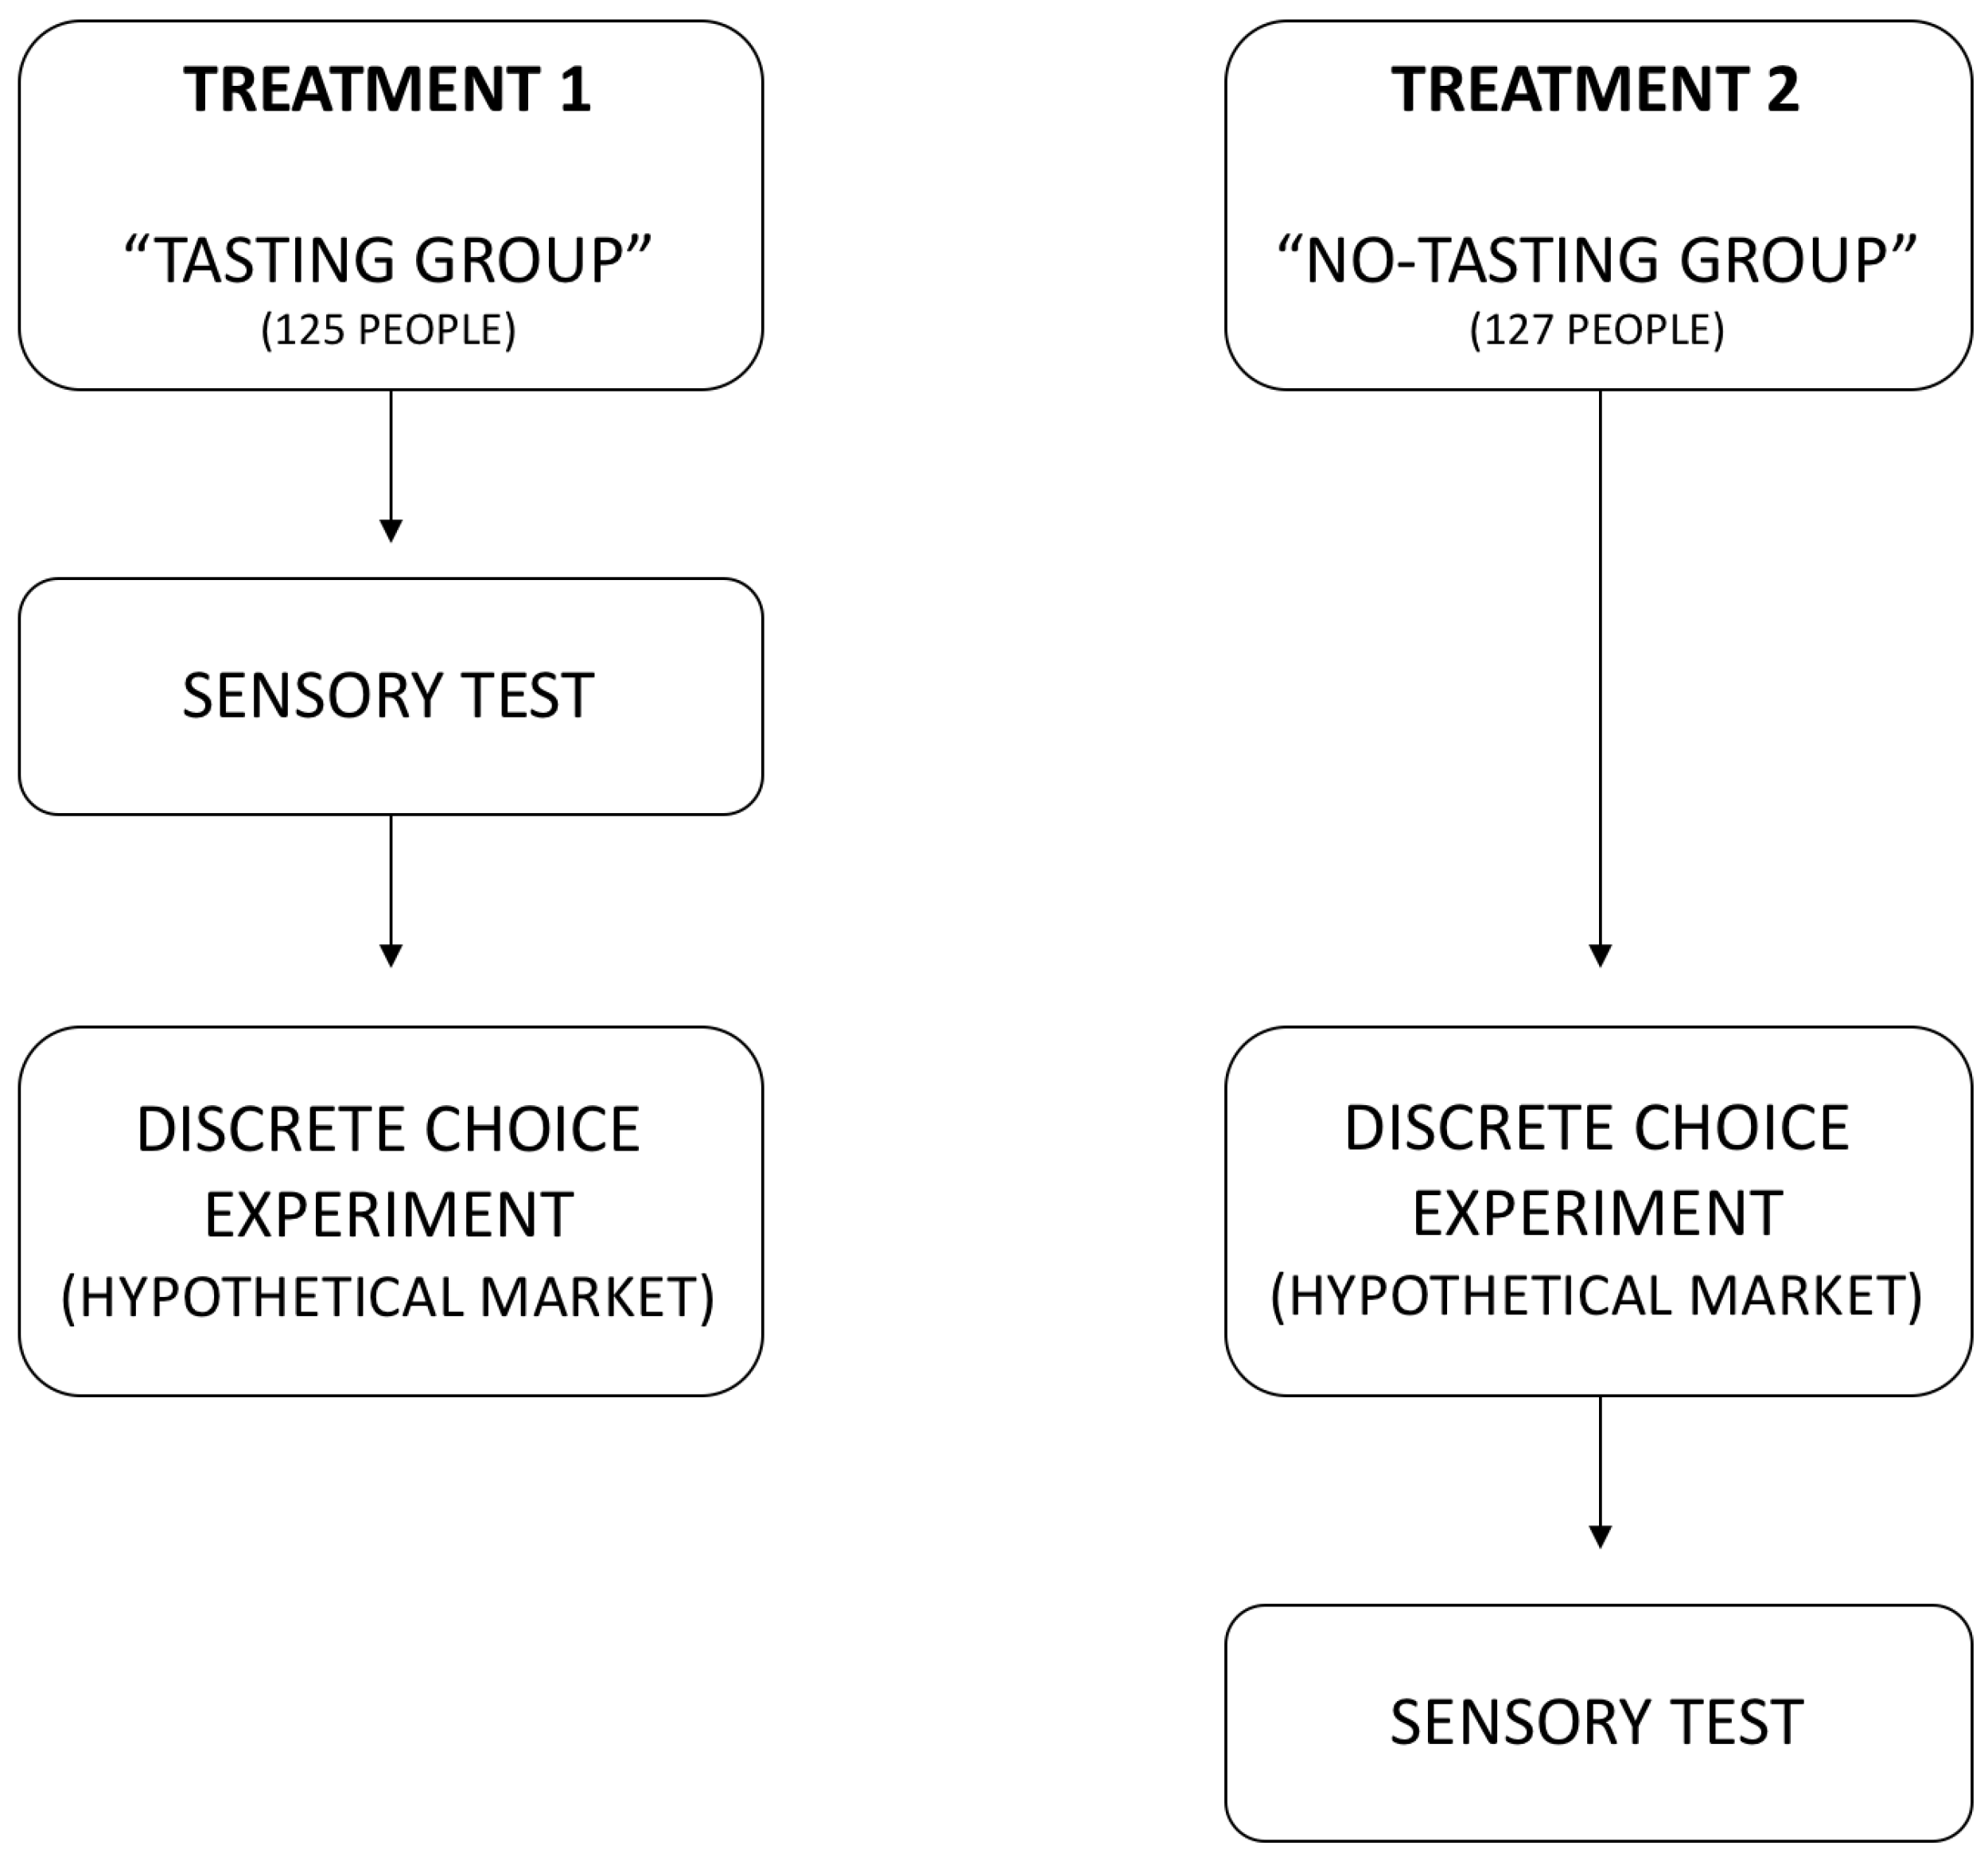
To verify the effect of tasting and liking on the product sustainability attributes, a sensory test and a hypothetical market with a DCE were designed using the introduction of a new food product, tinned Chianina meat, into the market as a case study. The main innovative aspect of this research is the fact that it is one of the few investigations in the meat sector that combined product tasting and DCEs. A further innovative aspect is the consideration of the landscape externalities of meat production including among the attributes the preservation of the traditional rural landscape. This paper is structured as follows. After a brief literature review (Section 2), the methodology is illustrated in Section 3. The results are reported in Section 4, before discussing the findings and drawing our conclusions in the final Section 5.

2. Literature Review

2.1. Discrete Choice Experiments without Product Tasting in the Meat Sector

Food product demand has been increasingly analyzed, drawing on stated preference methods or experimental auctions. Studies based on DCEs have highlighted that consumers rely on different cues and attributes to establish meat quality and safety. Regarding credence attributes, analyzes have focused on how expected quality is affected by breeding techniques (conventional or organic) [14,51,52,53], origin [14,51,52,54], animal welfare [14,52], traceability [52,53,55], production area and breed [14,53,55], animal feed [52,56], and effects on human health [51,57,58]. Regarding intrinsic cues, previous studies have examined the effects of colour, marbling and visible fats [14,55,56], as well as those of stated meat tenderness [51,55,56].
From the results of these studies, we infer that the factors most affecting the product’s expected quality are (i) country of origin and cattle breed; (ii) breeding techniques; and (iii) animal welfare. In general, research has largely focused on fresh product consumption, with only a few studies dealing with processed products (ham, sausages, and salami) [59,60]; to our knowledge, no other study has analyzed tinned meat demand in the past.

2.2. Analysis of the Effect of Food Tasting on Demand

To date, numerous studies have analyzed the effect of food product tasting on the demand and the propensity to pay a premium price. A review of existing research revealed 39 studies containing 48 evaluations (Table 1). For the methods used, 58.3% of the evaluations used experimental auctions; 20.8%, the contingent valuation method (CVM); and 10.4%, discrete choice experiments (DCEs). Overall, DCEs have been combined with product tasting in only a few cases. The most analyzed product is fresh beef (30.4%). The methods most used to investigate the effect of fresh meat tasting on WTP are the contingent valuation method (CVM) (6 of 14 cases) and experimental auctions (6 cases). The demand for processed meat or fish has been analyzed through experimental auctions in only five cases.
Some research has shown a positive relationship between liking a product and WTP [47,61,62,63,64], while, in other studies, a clear relationship between WTP and hedonic score has not emerged [59,65,66]. Hung and Verbeke [67] found a positive relation between liking a product and WTP for ham and a nearly null one for sausages.
In analyzing food demand through experimental auctions, many researchers have adopted an experimental protocol suitable for verifying whether the WTP value is different depending on whether consumers are given only information about extrinsic and intrinsic cues and credence attributes (as is usually the case in DCEs) or whether they are also given the opportunity to taste the product. Some research adopted the following experimental protocol, structured into three stages: (i) blind test (tasting only); (ii) expectation test (product information only); and (iii) full information test (tasting and product information combined) [68,69,70,71,72,73]. The stage 2 protocol (expectation test) corresponds to the usual experimental conditions under which DCEs are conducted since, in DCEs, consumers are only given information about the product. Consequently, a comparison between the WTP of stage 2 and stage 3 (full information test) can offer some insight into the possible effect of product tasting on WTP in DCEs. Generally, it is possible to observe a common trend in the WTP expressed under the three different experimental conditions. WTP tends to increase from stage 1 to stage 2 (if the attributes of the tested product are positive; otherwise, it tends to decrease) and to decrease when passing from stage 2 to stage 3. This trend is particularly evident in the case of wine [69,70], while it is less obvious when investigating beef [73]. Umberger et al. [73]’s results confirm this trend for grass-feed beef but not for grain-feed beef. These studies suggest that the standard DCE approach might overestimate the true value of the product since, when considering tasting and product information together, consumers tend to lower their WTP. Note, however, that this is only a general tendency that probably depends on the kind of product under analysis, on the attributes (information) considered, and on the experimental protocol adopted.

3. Material and Methods

A sensory test (affective method using the hedonic scale) and a hypothetical market have been used in this investigation. During the sensory test, people were asked to taste the product in a controlled and neutral environment and to rate their overall liking by means of a 9-point hedonic scale [74]. In the hypothetical market, people were involved in a discrete choice experiment (DCE) and asked to choose which meat they would have bought based on the description of its characteristics (attributes). To collect data, respondents were divided into two groups and tested conversely: one group was administered the sensory test first and then the hypothetical market, while the other group was administered the same tests in reverse order (Figure 1). In this way, the first group (called “tasting group”) could enter the hypothetical market with a sensory opinion about the product, while the second group (called “no tasting group”) had only descriptive information about the product and no direct experience. The second experimental treatment reproduces the standard DCE approach in which people make their choices considering only the verbal description of the product’s attributes. Considering the hedonic score—provided for the overall liking of the NFP during the sensory test—in the DCE made it possible to analyze the impact of the degree of liking on product demand. The methodologies used in carrying out the two tests are widely known. Therefore, in this section, we illustrate only the details of our experimental design for reproducibility purposes, and we suggest further sources for in-depth exploration of each methodology (for DCEs, see Ben-Akiva and Lerman [75], Hensher et al. [76]; for hedonic scaling, see Lim [20], Peryam and Pilgrim [74], Stone et al. [77]).

3.1. Subjects and Data Collection

Data were collected by means of a questionnaire. The sensory section of the questionnaire included the hedonic scales used to determine the perceptions of the product in terms of appearance, smell, flavour, texture and overall liking. The DCE section of the questionnaire is composed of an introduction, three main sections, and a final general section. In the introduction, a box contains detailed information on some attributes being investigated (organic breeding, cattle reared in a traditional rural landscape, PGI certifications, processing methods). The first section includes the real choice experiment, where the choice tasks are presented. Section 2 is focused on the collection of information on meat purchase habits in general. Section 3 investigates meat purchase habits in terms of frequency and quantity. The last section of the questionnaire collects socio-economic information about the respondents. The survey sample consists of a group of consumers belonging to the CIAS (Centro Italiano di Analisi Sensoriale), the Italian Center for Sensory Analysis. The selection criteria required consumers to be tinned meat consumers.
Data were collected in the sensory analysis centre based in Matelica (Italy) in 2014. Overall, 252 questionnaires were administered; in 125 of the questionnaires, the sensory test preceded the hypothetical market (tasting group), while, in the other 127 questionnaires, the hypothetical market preceded the sensory test (no tasting group).

3.2. Sensory Analysis

The CIAS managed the sensory test collecting data on the evaluations of sensory liking. To assess consumers’ acceptability of the product, we chose the affective method with a hedonic scale. Participants were asked to express their degree of liking the product based on five aspects: (i) appearance; (ii) smell; (iii) flavour; (iv) texture; and (v) overall liking. For each aspect, the participants expressed their degree of liking on a 9-point hedonic scale [74], from 1 (I dislike extremely) to 9 (I like extremely). The existing literature offers several types of sensory tests, ranging from analytical testing, such as flavour profiles, texture profiles, quantitative descriptive analysis, and qualitative discrimination methods, to affective testing, such as preference tests, acceptance tests, and hedonic scaling methods. Despite such a varied range, the test used in our study was chosen assuming that consumers have no problems rating a product in terms of liking or disliking it, especially when evaluating sensory characteristics such as flavour or aroma, since liking and disliking food products represent a primary stimulus [78,79].
Regarding the sensory evaluation, following previous studies [46,47,61,80], the interviewees tasted the meat only once before the DCE application. We adopted this strategy considering that the DCE immediately follows the sensory evaluation and that conducting the DCE experiment will take no more than 10 min. Additionally, it has to be considered that previous studies have highlighted that liking preferences are relatively stable over time and may influence the future behaviour of the consumer [81,82,83]. Moreover, as described by Morin-Audebrand et al. [84] (p. 233), “food memory is tuned at detecting novelty and change, rather than at recognising a previously encountered food”, so it is possible to assume that the interviewees remembered the taste of the tinned Chianina meat, a product that they never tasted before, during the DCE application.
The product was stored in a dedicated refrigerator at a controlled temperature between 1 C and 4 C before being prepared for sensory testing. During the test, the product was served on small disposable plastic plates with lettuce leaves so as not to affect the meat monochromaticity and presented in test rooms complying with established standards (ISO 8589—Sensory Analysis—General Guidance for the Design of Test Rooms) [85]. Lighting, temperature, and relative humidity in the sensory analysis room were optimized and monitored to avoid any conditioning resulting from the experimental context.
Before starting the experiment, the test supervisor explained what the participants were going to taste, namely, tinned Chianina meat, and provided an overview of the attributes used in the choice experiment. The description was kept general, as we did not want to influence the participants’ subsequent behaviour. The tasting group’s participants were told “We are conducting an investigation into the willingness to buy Chianina ready-made meals. In this regard, you will be asked to taste an innovative product made from Chianina. During the tasting, we will ask you to answer a few questions about the sensory aspects (first part) that will be followed by other questions related to the discrete choice experiment (part two). Finally, you will be asked some information about your purchasing and eating habits and some personal information (third part)”. In the case of the no tasting group, the order of the information given was partly modified to take into account the different order of experimental tasks.

3.3. Discrete Choice Experiment (Hypothetical Market)

3.3.1. Focus Groups, Attributes Selection and Experimental Design

To select the proper attributes and avoid experimental design errors, two focus groups involving 12 consumers were carried out in two cities in central Italy, Perugia and Matelica, in October 2013. Each participant was selected according to a set of predefined characteristics mainly related to food habits and to their consumption—even occasional—of Chianina beef and tinned meat in particular. Each focus group lasted approximately 90 min. Moderators conducted the meetings following a semi-structured discussion guide with ten questions aimed at describing: (i) consumption attitudes and habits towards beef in general and Chianina beef in particular, as well as towards tinned meat; (ii) relevant attributes at the moment of meat purchase; and (iii) questions related to the innovation processes of Chianina meat as “quality preserved meat”.
Focus group results were then used to prepare the final questionnaire and select the set of attributes and levels to be presented during the choice experiment. The original set of attributes first considered (organic breeding, rearing in a traditional rural landscape, animal welfare, and a fair purchase price for the farmer) was revised due to the feedback from the focus groups. The final set of seven attributes (Table 2) was meat type (Chianina, other Italian quality cattle breeds, and standard), organic breeding (yes/no), cattle reared in a traditional rural landscape (yes/no), protected geographical indication certification (PGI) (yes/no), meat processing method (industrial/traditional), packaging (glass jar/aluminium tin), and price (0.92, 1.7, 2.0. 2.38, and 2.7 euro per 90 g). The base price (0.92 €) was selected considering the average price of the “standard” (namely the most commonly purchased tinned meat—we do not report here the brand) at the time of the survey in a 90 g format in supermarkets.
Following the model proposed by Steenkamp [10], organic breeding, cattle reared in a traditional rural landscape, protected geographical indication (PGI) certification, and meat processing method can be included in the credence attributes, meat type is an intrinsic cue, while packaging can be identified as an extrinsic cue. It should be noted that three out of seven attributes (organic breeding, cattle reared in a traditional rural landscape and packaging) are related to the sustainability of the product. While organic breeding might be perceived as a quality also affecting the intrinsic properties of the product (organic production is often associated with better taste [3]), packaging and the preservation traditional rural landscape can be considered as related to the externalities associated to the food production, but that do not affect the sensory aspects of the product.
In the final DCE, we employed a D p -efficient design [86] that was generated using NGene software (version 1.1.2, ChoiceMetrics, Sydney, Australia). We opted for an efficient design since these designs produce more reliable parameter estimates with a lower sample size compared to orthogonal designs [86]. Considering that the design is labelled (see de Bekker-Grob et al. [87] for a definition of “labelled” choice experiments), we used the meat type (Chianina, Other Italian quality cattle breeds, and standard) as a label to name the different choice options for each choice set. The final design had 16 choice sets and each choice set had three different choice options corresponding to the type of meat under analysis. The experimental design was divided into two blocks of eight choice sets each: each respondent (who either tasted the product first or did not) had to perform eight choice tasks and was assigned randomly to block 1 or block 2 of the experimental design (Figure 2). We used blocking given that it “promotes response efficiency by reducing the necessary cognitive effort for each respondent who completes the survey” ([88], p. 8). Table 3 shows one of the 16 choice tasks submitted to respondents.
In each choice task, there are three alternatives represented by three different products: ‘Chianina’ (young bovine aged 18 to 24 months), ‘other Italian quality breeds’ (Piemontese breed young bovine aged 15 to 18 months), and ‘standard’ (cow aged more than four years). In the experiment, we opted for the ‘my usual brand’ as ‘no choice’ option format [89], represented by the ‘Standard’ meat. We opted for this format since our sample was composed of consumers of tinned meat, or people who buy this type of product in the ’Standard’ format regardless of the experiment. The attribute levels of the ’Standard’ option were therefore held constant in all choice tasks. Before undertaking the choice experiment, all attributes presented in the choice cards where illustrated for the respondents (see Appendix B).

3.3.2. Model Specification

To test the effect of tasting and liking, a Random Parameters Logit (RPL) model was estimated using two dummy variables to highlight the differences in preferences between the following three subsamples:
  • No tasting group (people that tasted the meat after the DCE).
  • Tasting—low liking group (people that tasted the meat before the DCE and gave a low hedonic score on the overall NFP liking).
  • Tasting—high liking group (people that tasted the meat before the DCE and gave a high hedonic score on the overall NFP liking).
These dummy variables interacted with the attributes of the product under analysis. In this way, it was possible to verify the effect of tasting and liking on the interviewees’ preferences. The following utility function was used to estimate the model (Equation (1)):
U ( X ) = β i · A i + β A G E i · A i · A G E + β P F i · A i · P F + β H L i · A i · H i g h L + β L L i · A i · L o w L + β p r i c e i · P r i c e ,
where A represents a vector of all attributes apart from price, AGE is a dummy variable assuming value 1 if the respondents have an age greater than 40; PF is a dummy variable assuming value 1 if the respondents purchasing frequency of tinned meat is equal or higher than twice per month, LowL is a dummy variable assuming the value 1 if the respondents belonging to the tasting group expressed an overall liking equal to or lower than a given hedonic score (see the next paragraphs for a discussion about the identification of the liking score), and HighL is a dummy variable assuming the value 1 if the people belonging to the tasting group expressed an overall liking greater than a given hedonic score (see the next paragraphs for a discussion about the identification of the liking score). To analyze respondents’ preferences towards tinned Chianina meat and to verify the effect of tasting and liking on their choices, we considered the hedonic scale for the overall liking presented in the sensory test. We chose to use the overall liking [74] given that, according to ([90], p. 354), “the formation of the flavor percept is dependent upon multisensory integration” with “an asymmetrical involvement of gustatory and olfactory regions”. To analyze the effect of the degree of liking on the individual choices, we estimated the RPL model considering four alternative discriminant thresholds:
  • Interviewees who gave a score lower than or equal to 3 versus interviewees who gave a score higher than 3;
  • Interviewees who gave a score lower than or equal to 4 versus interviewees who gave a score higher than 4;
  • Interviewees who gave a score lower than or equal to 5 versus interviewees who gave a score higher than 5; and
  • Interviewees who gave a score lower than or equal to 6 versus interviewees who gave a score higher than 6.
According to the McFadden pseudo-R 2 and the Akaike’s information criterion, the last model performed better than the others (namely, the model where the HighL dummy represents people who gave a score higher than 6 and the LowL dummy interviewees who gave a score lower than or equal to 6). Moreover, in this model, the coefficients β H L i were significant at the 95% level in four cases out of seven, while, in the other models, the coefficients were never significant. Therefore, we considered the interviewees who gave a score lower than 7 as belonging to the low-liking group and those who gave a liking score higher than 6 as belonging to the high-liking group. The models were estimated with 1000 Halton draws using the software Nlogit 5.0 (Econometric Software, Plainview, NY, USA). All of the variables were effect-coded, except ‘Chianina’ and ‘other Italian quality cattle breeds’, which were dummy coded. We assumed the random parameters to be normally distributed. The average premium price of each attribute was calculated as follows (Equation (2)):
W T P i = β i β p r i c e .
For the effect coded variables, the WTPi obtained with Equation (2) was multiplied by 2. In fact, with effect coding, the reference point shifted from 0 to 1 [91].

4. Results

4.1. Sample Characteristics and Consumption Habits

Table 4 presents the socio-economic characteristics of all the respondents and the two sub-samples considered in the analysis (tasting and no tasting). Considering the whole sample, women outnumber men (63.1%), and 88% of the respondents are actually in charge of household purchases. For age, the participants are mainly young people (52% of them are less than 40 years), although older age groups are also well represented. The average educational qualification is quite high, with 38% of the respondents being graduates, while the employment rate (55%) reflects the Italian statistic (55.6% in 2014 according to the “Istituto nazionale di statistica” (Italian National Statistical Institute) ISTAT [92]).
Nearly all respondents’ households are composed of less than four people, although this average size is larger than the Italian average household size (ISTAT [92]). The majority of participants live in an urban area (city centre or suburbs). Approximately one-third of the respondents did not state their household income.
To determine whether the two subsamples are significantly different, we used Pearson’s Chi-Square Test. Regarding the variables listed in Table 4, the two subsamples are not significantly different at the 95% level, with the exception of household size (p = 0.029).
Considering consumption habits, respondents spend an average of €427.3 per month to buy food (Table 5), a figure close to the Italian average (€460 per month) (ISTAT [92]). In contrast, meat expenditures for the sample are higher than the Italian rate since our respondents are all meat consumers. Expenditures on meat amount to more than 41% of the monthly food expenditures. Beef is the most consumed meat, accounting for 48% of the total expenditures on meat. By using analysis of variance, it was found that, in this case, the two subsamples are not significantly different at the 95% level.
The Chianina meat is well known among respondents; only 2.4% of them have never eaten it, whereas 43% of them eat it at least once every two weeks. Regarding consumption habits for Chianina, the subsamples are not significantly different with a 95% probability. After tasting Chianina meat, respondents were asked to state their liking on a 1-to-9-point hedonic scale. The liking rate of the subsamples was very similar (Table 6) and was not significantly different (chi squared = 11.35; p = 0.18). In general, only a small percentage of the sample (16.2%) disliked the meat (score equal or less than 3). By contrast, approximately one-fourth liked it very much (score equal or higher than 7). Considering that 5 equals a neutral judgement (“I neither like nor dislike”), 50% of the sample appears to like tinned Chianina meat.

4.2. Choice Experiment Results

The estimated model has a good fit (McFadden pseudo R 2 = 0.364). All of the random parameter coefficients are significant at the 99% level and have a reasonable level of heterogeneity (standard deviation is significant for all of them, p < 0.05). All of the attributes except price have a positive effect on the probability in which respondents would choose one of the proposed products in the hypothetical market (Table 7).
The first part of the model (mean values without interactions) presents the WTP of the no tasting group. With reference to the standard tinned meat, on the average, the WTP is higher for the tinned Chianina meat (1.47 €/90 g) and the other Italian quality breeds (1.25 €/90 g). Considering the other credence attributes, the most important is organic production (0.64 €/90 g), followed by the characteristics of the landscape where the cows are reared (0.59 €/90 g), traditional manufacturing (0.50 €/90 g), and protected geographical indication (0.42 €/90 g). Small glass jar packaging, the only extrinsic attribute, has the lowest WTP (0.29 €/90 g). Considering the effect of liking, none of the variables that interacted with the low liking variable (LowL) were significant. This means that the WTP of the people that did not appreciate the Chianina tinned meat very much (LowL interaction term) is not statistically different from that of the interviewees that did not taste the meat before undertaking the DCE experiment.
On the contrary, the high liking interaction variable (HighL) was significant in 4 of 7 cases in which it interacted. With reference to the people that did not taste the meat before participating in the DCE, the WTP was lower in 3 of 4 cases and higher in one case (Chianina) (Table 7). The magnitude of the difference in WTP is +34% for Chianina (calculated considering the mean WTP of the no tasting group, 1.47 €, and the difference from the mean WTP for those who liked the product, 0.50 €: Δ W T P = 0.50 1.47 × 100 = 34 % ), 54 % for traditional landscape, and 72 % for both traditional manufacturing and glass jar. This result shows that, considering the degree of liking, people with an appreciation for the NFP do have different preferences compared to those that did not taste the NFP. The preferences are different for more than 50% of the attributes considered, and the magnitude of this difference is quite relevant. It is also important to note that tasting and liking did not have a significant influence on the WTP for organic production. This probably means that the sustainability of the meat production system is a value per se, to a certain extent independent from the taste of the product at least in our case study.
From the results obtained, it can be observed that not only are the mean WTPs different for those who tasted and liked the product and the other two groups, but the system of preferences has also changed. In particular, those who tasted and liked the product gave more importance to intrinsic cues (meat type) that are supposed to influence the meat taste, rather than to the extrinsic cue (packaging) and credence attributes (traditional landscape and traditional processing). With reference to the two other interaction terms, it is interesting to note that older people have a lower WTP for Chianina and other Italian quality breeds’ meat. This result probably depends on the aversion of older people to innovative products. Additionally, the interaction term purchasing frequency of tinned meat is significant in two cases. The model showed that people who consume tinned meat almost two times a month attribute a lower importance to packaging and to the landscape characteristics of the rearing area.

5. Discussion and Conclusions

Many past studies highlighted the presence of a gap between consumers’ intentions and behaviour. This is particular evident in the case of ethical consumerism where a wide difference exists between what people say and how people act [93,94]. The presence of such a discrepancy may induce the producers to overestimate the importance of some ethical attributes when deciding the most appropriate marketing strategies and, most importantly, this tendency could have a negative impact on the diffusion of environmental friendly production systems especially in the case of NFPs. DCEs can be considered a useful methodology to reduce this gap with reference to other survey instruments [95]. However, some studies found that DCEs tend to overestimate people WTP [34,35], due to their hypothetical nature. Giving interviewees the possibility to taste the product can be a useful strategy to reduce the effect of the hypothetical bias on DCEs results.
The key role of liking in food choice is well explained by affective neuroscience. The sensory experience serves as a stimulus to activate conscious and unconscious emotions in our brain that react to the stimulus either positively or negatively. Liking is a sensory pleasure created by a positive stimulus and generates behavioural positive affective reactions to pleasant sensations [96]. From a marketing perspective, such a positive affecting reaction is expected to translate into a greater probability of food choice and purchasing and a higher willingness to pay.
The different experimental treatments employed in this study (product tasting before or after the DCE) seems to provide useful information on how tasting and liking may influence consumers’ purchase behaviours. We found tasting and liking to have a considerable effect on our DCE estimates. While other authors found a positive relationship between liking and WTP [47,61,62,63,64], or no clear relationship between WTP and hedonic scores [59,65,66], we found a positive relationship related to the intrinsic cues (meat type) and no effect (organic breeding and PGI) or a negative effect (traditional landscape, traditional manufacturing and small glass jar) for extrinsic cues. This result highlights how tasting and liking a product modified the relative importance of the attributes considered by the respondents probably due to the fact that tasting reduced the asymmetry of information towards intrinsic cues. This finding confirms what Grunert [43] theorized, especially for new products, where credence qualities tend to lose importance with respect to experience qualities once an NFP is tasted. Therefore, according to our results, the effect of liking on the DCE estimates seems to depend on the attributes considered.
In this respect, it is interesting to observe that the WTP did not change as a consequence of tasting for two attributes, for which the product characteristics are vouched by a certification ruled by national and European norms. This finding is coherent with the results of Bray et al. [97] that affirm how the purchase of ethical and sustainable products is often limited by lack of information and what the authors define as cynicism. In the first case, participants in the focus groups stated that they have not enough knowledge to buy ethical products. With reference to the cynicism, some interviewees consider that ethical claims “were just another marketing ploy, commanding higher prices by taking advantage of consumer goodwill” ([97], p. 603). Considering that in Europe the certification of organic products is ruled by the Council Regulation (EEC) No 2092/91 issued nearly 30 years ago (and updated in 2007), it is possible to suppose that nowadays consumers have a certain trust in the European certification logo and in the respect by producers of the directives of the regulation. When a consumer buys an organic livestock product, he is probably fairly sure that, for its production, animals were fed with organic feed and that their welfare was respected. Even the geographical denomination of origin is a quality signal that was introduced by some years in the Italian and European regulations and the Protected Geographical Indication (PGI) of “Vitellone Bianco dell’Appennino Centrale”, that includes the Chianina breed, was established in 1998. For both organic production and the PGI logos, there are production specifications that establish the requirements to be met in the production process so that the product can be certified. With reference to the traditional rural landscape, Italy’s Government has established the criteria that have to be respected by a territory to be registered at the National Registry of Rural Historical Landscapes only in 2012. It is therefore possible to suppose that at present only a few people know about the existence of the Register and that the elements that distinguish a traditional rural landscape from a modern one are unknown to the majority of people.
However, the results reported in the study should be considered carefully, and more investigations are needed to confirm them. First, looking at the possible limits of the research, other tests on different samples and NFPs should be carried out to generalize our results. A second aspect that deserves further investigation is the level of the degree of liking that implicates a critical difference in the DCE estimates. In this research, the threshold was a liking score greater than 6 on a 1-to-9 Likert scale of overall liking. Previous studies highlighted that only a high degree of liking can significantly modify the consumer attitude towards a good [98], but more research is needed in this respect.
Despite the possible limits of the study, the results, if confirmed, could have important implications for future applications of the DCE method on the study of an NFP and particularly on pricing policies based on WTP estimates and their success in the market. A protocol that combines a sensory test and a DCE when studying pricing policies for NFP should be adopted to gain more reliable WTP estimates, especially in the case of the attributes that are not certified following official norms prescribed by the national or European Union legislation (for the European context). In this case, WTP estimates of such characteristics obtained without tasting should be used carefully given that the mean estimates might both overestimate or underestimate the real WTP of the potential long-term purchasers (the high-liking group). In our study, this discrepancy ranged in absolute terms from 34% to 72%. According to the literature, there are some exceptions, such as in the case of wine [99] and champagne [70], where given the complex nature or symbolic meaning (purchase for special occasions) of the product, sensory aspects play a less important role compared to extrinsic cues such as information on bottle labels. Therefore, in our opinion, the choice of whether to combine sensory tests with hypothetical markets also depends on the type of NFP considered, but it is particularly important in the case of organic products where the expectations about their sensory characteristics, and taste in particular [3], are higher. The potential dissatisfaction of the sensory expectations raised by the organic label could seriously undermine the long lasting success of a sustainable product.
Although this research was based on the effect of tasting and liking on DCE estimates, the importance of credence attributes should not be minimised. They might still play a crucial role in determining a “first” purchase of an NFP according to the “Total Food Quality Model” [43], and they should therefore not be neglected. The DCE’s results highlighted that, even for a processed product such as tinned meat, some credence attributes, such as organic breeding and certified production area (PGI), are still crucial to consumers. The effects of such attributes on consumers’ behaviour have already been confirmed in several studies [5,100,101,102].
As a final note, it should not be overlooked that even if the product is tasted, information obtained from the DCE may only partially reflect the real market behaviour of food product consumers since purchase decisions are affected by many factors that are usually not considered in laboratory experiments.
To conclude, although the current study is based on a small sample size, the findings suggest that in the food sector, DCEs should always be combined with product tasting when launching a NFP to obtain more realistic information on the real consumers’ attitudes. A DCE that does not consider the results of a sensory test for launching an NFP could provide biased estimates on the real importance that consumers give to some product attributes, and therefore, the estimates could lead producers to adopt sub-optimal market strategies.

Author Contributions

T.T., B.T., D.V. and S.V. conceived and designed the experiments; B.T. and S.V. followed and organized the sensory test and DCE data collection; T.T. and D.V. analyzed the DCE data; B.T. and D.V. contributed paragraph Section 1. B.T. contributed paragraphs Section 3.1 and Section 4.1; S.V. contributed paragraphs Section 3.2 and Section 3.3.1. T.T. contributed paragraphs Section 2 and Section 4.2. D.V. contributed paragraphs Section 3 and Section 3.3.2. T.T., B.T., D.V. and S.V. contributed equally to paragraphs Section 5.

Funding

This research was funded by the Rural Development Plan, measure 124 “Cooperation for Development of New Products, Processes and Technologies in the Agriculture, Food and Forestry Sector”, Umbria Region (Italy), grant number 94752207244.

Acknowledgments

This paper is based on research carried out as part of the innovation research project titled ‘Panis cum Carne’. We would like to thank the Umbria Region for funding the research and farmer Fabio Ciri, the project leader.

Conflicts of Interest

The authors declare no conflict of interest.

Abbreviations

The following abbreviations are used in this manuscript:
CIASCentro Italiano di Analisi Sensoriale
CVMContingent Valuation
DCEDiscrete Choice Experiment
MNLMultinomial Logit Model
NFPNew Food Product
PGIProtected Geographical Indication
RPLRandom Parameters Logit Model
WTPWillingness To Pay

Appendix A

Table A1. List of studies considered in Table 1.
NAuthorPublication YearMethod a Food Type
1Almli and Hersleth [68]2013AuctionSmoked salmon
2Baba et al. [46]2016DCEBeef
3Barnes et al. [47]2014DCECheese
4Beriain et al. [103]2009CVMBeef
5Bower et al. [104]2003CVMFat spread
6Carrillo-Rodriguez et al. [105]2013AuctionApple
7Combris et al. [69]2009AuctionWine
8Costanigro et al. [106]2014AuctionApple
9Djumboung et al. [107]2014DCAWine
10Dransfield et al. [108]2005CVMPig
11Enneking et al. [109]2007DCASoft drink
12Gabrielyan et al. [48]2016CVMBeer
13Ginon et al. [59]2014AuctionBread
14aGinon et al. [59]2014AuctionCheese
14bGinon et al. [59]2014AuctionHam
14cGinon et al. [59]2014AuctionJuice
15Ginon et al. [110]2009AuctionBread
16Gwin et al. [61]2012DCEBeef
17Heid and Hamm [60]2013AuctionBoar meat salami
18aHung and Verbeke [67]2018AuctionSausages
18bHung and Verbeke [67]2018AuctionHam
19Killinger et al. [111]2004AuctionBeef
20Lange et al. [112]2000OtherJuice
21Lange et al. [70]2002AuctionWine
22Lange et al. [113]2015AuctionCoffee
23Lange et al. [112]2000OtherJuice
24Luo et al. [114]2009CVM - MPLBeef
25Lusk et al. [115]2001AuctionBeef
26aLyford et al. [62]2010CVMBeef
26bLyford et al. [62]2010CVMBeef
26cLyford et al. [62]2010CVMBeef
26dLyford et al. [62]2010CVMBeef
27Martínez-Carrasco et al. [116]2015Auction and CVMTomato
28Mueller and Szolnoki [117]2010OtherWine
29Mueller et al. [99]2010DCEWine
30Napolitano et al. [65]2010AuctionBeef
31Napolitano et al. [118]2008AuctionYogurt
32aNoussair et al. [66]2004AuctionJuice
32bNoussair et al. [66]2004AuctionCookies
32cNoussair et al. [66]2004AuctionChocolate bars
33Scholderer et al. [119]2004CVMPork
34Seppä et al. [63]2015AuctionApple
35Stefani et al. [72]2006AuctionBoiled spelt
36Umberger and Feuz [64]2004AuctionBeef
37Umberger et al. [73]2009AuctionBeef
38Umberger et al. [120]2002AuctionBeef
39Yue and Tong [80]2011DCEApple
40Zhang and Vickers [121]2014AuctionApple
a Legend: DCE = discrete choice experiment; CVM = contingent valuation method; DCA = discrete conjoint analysis; Auction = experimental auction; MPL = multiple price list; Other = other methods.

Appendix B

DCE introduction and attributes presentation to respondents:
We are investigating the propensity to purchase tinned meat. During the interview, you will be asked to indicate your preference for buying tinned meat by comparing different products that differ in some features. These characteristics are related to the type of meat (Chianina—young bovine aged 18 to 24 months, other quality breeds—Piemontese breed young bovine aged 15 to 18 months, standard—cow aged more than four years), breeding techniques (conventional/organic), breeding site (traditional agricultural landscape), meat processing techniques (traditional/industrial), the presence of a geographical certification of origin (PGI), and type of packaging (glass jar/tin). We will give you an overview of these characteristics that you will find in the choice cards.
With regard to the meat type, Chianina is an old Italian cattle breed raised since the Roman era. It is now reared throughout central Italy and is well known as the traditional ‘bistecca alla Fiorentina’ (the Tuscan T-bone steak), sourced from Chianina young beef, aged 18 to 24 months. Tinned meat from other quality breeds is also derived from a traditional Italian cattle breed, the Piemontese breed, young bovine aged 15 to 18 months. For standard tinned meat, we mean a meat derived from Italian cows of no specific breed, aged more than four years.
Organic breeding is an environmentally friendly system of production where animal welfare standards are high, and cattle are fed agricultural products that are organically produced. The traditional rural landscape can be defined as a complex system where preserved traditional sustainable agricultural practices and conserved biological diversity (agrobiodiversity) are carried out [122], recognizing its value from a socio-economic and cultural perspective. The protected geographical indication (PGI) certification shows a link with the area in at least one of the stages of production, processing or preparation, as defined by Council Regulation (EC) No 510/2006. Regarding the last attribute, the industrial and traditional processing methods share a high standard and quality meat processing but differ because they work with different product quantities and are based on distinctive recipes passed on through the generations in the traditional sense. The presence of a feature/attribute does not exclude the other. You will also be asked for information on your buying habits for meat. There are no right or wrong answers, but only ideas, opinions and experiences. All of the information gathered in the questionnaire will be treated confidentially.
Your participation in this study is essential: we ask you to answer the questionnaires carefully and express your real preferences as if you want to buy the product.

References

  1. Food and Agriculture Organization of the United Nations (FAO). World Agriculture: Towards 2030/2050—Interim Report; FAO: Rome, Italy, 2006. [Google Scholar]
  2. Food and Agriculture Organization of the United Nations (FAO). Livestock’s Long Shadow: Environmental Issues and Options; FAO: Rome, Italy, 2006. [Google Scholar]
  3. Grunert, K.G.; Bredahl, L.; Brunsø, K. Consumer perception of meat quality and implications for product development in the meat sector—A review. Meat Sci. 2004, 66, 259–272. [Google Scholar] [CrossRef]
  4. Henchion, M.; McCarthy, M.; Resconi, V.C.; Troy, D. Meat consumption: Trends and quality matters. Meat Sci. 2014, 98, 561–568. [Google Scholar] [CrossRef] [PubMed] [Green Version]
  5. Font-i-Furnols, M.; Guerrero, L. Consumer preference, behavior and perception about meat and meat products: An overview. Meat Sci. 2014, 98, 361–371. [Google Scholar] [CrossRef] [PubMed]
  6. Moskowitz, H.R. R&D-driven product evaluation in the early stage of development. In Developing New Food Products for a Changing Marketplace; Brody, A.L., Lord, J.B., Eds.; Book Section 12; CRC Press Inc.: Boca Raton, FL, USA, 1999; pp. 277–328. [Google Scholar]
  7. Steenkamp, J.B.E.M.; Van Trijp, H.C.M. Quality guidance: A consumer-based approach to food quality improvement using partial least squares. Eur. Rev. Agric. Econ. 1996, 23, 195–215. [Google Scholar] [CrossRef]
  8. Agnoletti, M. Italian Historical Rural Landscapes: Dynamics, Data Analysis and Research Findings. In Italian Historical Rural Landscapes: Cultural Values for the Environment and Rural Development; Agnoletti, M., Ed.; Springer: Dordrecht, The Netherlands, 2013; pp. 3–87. [Google Scholar]
  9. European Commission (EC). Special Eurobarometer 473: Europeans, Agriculture and the CAP; Technical Report, European Commission—Special Eurobarometer 473/Wave EB88.4—TNS Opinion & Social; EC: Brussels, Belgium, 2018. [Google Scholar]
  10. Steenkamp, J.B.E.M. Conceptual model of the quality perception process. J. Bus. Res. 1990, 21, 309–333. [Google Scholar] [CrossRef]
  11. Brunsø, K.; Fjord, T.A.; Grunert, K.G. Consumers’ Food Choice and Quality Perception; The Aarhus School of Business Publ.: Aarhus, Denmark, 2002. [Google Scholar]
  12. Luning, P.A.; Marcelis, W.J.; Jongen, W.M.F. Food Quality Management: A Techno-Managerial Approach; Wageningen Pers: Wageningen, The Netherlands, 2002; p. 323. [Google Scholar]
  13. Oude Ophuis, P.A.M.; Van Trijp, H.C.M. Perceived quality: A market driven and consumer oriented approach. Food Qual. Preference 1995, 6, 177–183. [Google Scholar] [CrossRef]
  14. Zanoli, R.; Scarpa, R.; Napolitano, F.; Piasentier, E.; Naspetti, S.; Bruschi, V. Organic label as an identifier of environmentally related quality: A consumer choice experiment on beef in Italy. Renew. Agric. Food Syst. 2012, 28, 70–79. [Google Scholar] [CrossRef]
  15. Andersen, E.S. The Evolution of Credence Goods: A Transaction Approach to Product Specification and Quality Control; Working Paper; Aarhus University: Aarhus, Denmark, 1994. [Google Scholar]
  16. Nelson, P. Information and Consumer Behavior. J. Polit. Econ. 1970, 78, 311–329. [Google Scholar] [CrossRef]
  17. Wilde, L.L. The Economics of Consumer Information Acquisition. J. Bus. 1980, 53, S143–S158. [Google Scholar] [CrossRef]
  18. Food and Agriculture Organization of the United Nations (FAO). Sustainable Diets and Biodiversity: Directions and Solutions for Policy, Research and Action; FAO: Rome, Italy, 2010. [Google Scholar]
  19. Dos Santos Garruti, D.; de Vasconcelos Facundo, H.V.; Lima, J.R.; Cardoso de Aquino, A. Sensory Evaluation in Fruit Product Development. In Advances in Fruit Processing Technologies; Rodrigues, S., Fernandes, F.A.N., Eds.; Contemporary Food Engineering, CRC Press: Boca Raton, FL, USA, 2012; pp. 415–440. [Google Scholar]
  20. Lim, J. Hedonic scaling: A review of methods and theory. Food Qual. Preference 2011, 22, 733–747. [Google Scholar] [CrossRef]
  21. Köster, E.P. Diversity in the determinants of food choice: A psychological perspective. Food Qual. Preference 2009, 20, 70–82. [Google Scholar] [CrossRef]
  22. Thow, A.M.; Downs, S.; Jan, S. A systematic review of the effectiveness of food taxes and subsidies to improve diets: Understanding the recent evidence. Nutr. Rev. 2014, 72, 551–565. [Google Scholar] [CrossRef] [PubMed]
  23. Steptoe, A.; Pollard, T.M.; Wardle, J. Development of a Measure of the Motives Underlying the Selection of Food: The Food Choice Questionnaire. Appetite 1995, 25, 267–284. [Google Scholar] [CrossRef] [PubMed]
  24. Hawkes, C.; Smith, T.G.; Jewell, J.; Wardle, J.; Hammond, R.A.; Friel, S.; Thow, A.M.; Kain, J. Smart food policies for obesity prevention. Lancet 2015, 385, 2410–2421. [Google Scholar] [CrossRef]
  25. Hoek, A.; Pearson, D.; James, S.; Lawrence, M.; Friel, S. Shrinking the food-print: A qualitative study into consumer perceptions, experiences and attitudes towards healthy and environmentally friendly food behaviours. Appetite 2017, 108, 117–131. [Google Scholar] [CrossRef] [PubMed]
  26. Pearson, D.; Friel, S.; Lawrence, M. Building environmentally sustainable food systems on informed citizen choices: Evidence from Australia. Biol. Agric. Hortic. 2014, 30, 183–197. [Google Scholar] [CrossRef]
  27. Lusk, J.L.; Shogren, J.F. Experimental Auctions: Methods and Applications in Economic and Marketing Research; Quantitative Methods for Applied Economics and Business Research; Cambridge University Press: Cambridge, UK, 2007. [Google Scholar]
  28. Lusk, J.L.; Hudson, D. Willingness-to-Pay Estimates and Their Relevance to Agribusiness Decision Making. Appl. Econ. Perspect. Policy 2004, 26, 152–169. [Google Scholar] [CrossRef]
  29. Birol, E.; Koundouri, P.; Kountouris, Y. Applications of the Choice Experiment Method in Europe: A Review. In Choice Experiments Informing Environmental Policy: A European Perspective; Birol, E., Koundouri, P., Eds.; Edward Elgar Publishing: Cheltenham, UK, 2008; Book Section 2. [Google Scholar]
  30. Mahieu, P.A.; Andersson, H.; Beaumais, O.; Crastes, R.; Wolff, F.C. Is Choice Experiment Becoming More Popular than Contingent Valuation? A Systematic Review in Agriculture, Environment and Health; Working Papers 2014.12—FAERE—French Association of Environmental and Resource Economists; FAERE: Paris, France, 2014. [Google Scholar]
  31. Girgenti, V.; Massaglia, S.; Mosso, A.; Peano, C.; Brun, F. Exploring Perceptions of Raspberries and Blueberries by Italian Consumers. Sustainability 2016, 8, 1027. [Google Scholar] [CrossRef]
  32. Poelmans, E.; Rousseau, S. Beer and Organic Labels: Do Belgian Consumers Care? Sustainability 2017, 9, 1509. [Google Scholar] [CrossRef]
  33. Louviere, J.J.; Flynn, T.N.; Carson, R.T. Discrete Choice Experiments Are Not Conjoint Analysis. J. Choice Model. 2010, 3, 57–72. [Google Scholar] [CrossRef]
  34. List, J.A.; Gallet, C.A. What Experimental Protocol Influence Disparities Between Actual and Hypothetical Stated Values? Environ. Resour. Econ. 2001, 20, 241–254. [Google Scholar] [CrossRef]
  35. Murphy, J.J.; Allen, P.G.; Stevens, T.H.; Weatherhead, D. A Meta-analysis of Hypothetical Bias in Stated Preference Valuation. Environ. Resour. Econ. 2005, 30, 313–325. [Google Scholar] [CrossRef] [Green Version]
  36. De Pelsmaeker, S.; Dewettinck, K.; Gellynck, X. The possibility of using tasting as a presentation method for sensory stimuli in conjoint analysis. Trends Food Sci. Technol. 2013, 29, 108–115. [Google Scholar] [CrossRef]
  37. Green, P.E.; Srinivasan, V. Conjoint Analysis in Consumer Research: Issues and Outlook. J. Consum. Res. 1978, 5, 103–123. [Google Scholar] [CrossRef]
  38. Asioli, D.; Varela, P.; Hersleth, M.; Almli, V.L.; Olsen, N.V.; Næs, T. A discussion of recent methodologies for combining sensory and extrinsic product properties in consumer studies. Food Qual. Preference 2017, 56, 266–273. [Google Scholar] [CrossRef]
  39. Haddad, Y.; Haddad, J.; Olabi, A.; Shuayto, N.; Haddad, T.; Toufeili, I. Mapping determinants of purchase intent of concentrated yogurt (Labneh) by conjoint analysis. Food Qual. Preference 2007, 18, 795–802. [Google Scholar] [CrossRef]
  40. Jaeger, S.R.; Hedderley, D.; MacFie, H.J.H. Methodological issues in conjoint analysis: A case study. Eur. J. Mark. 2001, 35, 1217–1239. [Google Scholar] [CrossRef]
  41. Lee, C.M.; Moskowitz, H.R.; Lee, S.Y. Expectations, needs and segmentation of healthy breakfast cereal consumers. J. Sens. Stud. 2007, 22, 587–607. [Google Scholar] [CrossRef]
  42. Grunert, K.G. Purchase and consumption: The interdisciplinary nature of analyzing food choice. Food Qual. Preference 2003, 14, 39–40. [Google Scholar] [CrossRef]
  43. Grunert, K.G. Food quality and safety: Consumer perception and demand. Eur. Rev. Agric. Econ. 2005, 32, 369–391. [Google Scholar] [CrossRef]
  44. IFIC. The International Food Information Foundation’s 2017 Food & Health Survey “A Healthy Perspective: Understanding American Food Values”; Report; IFIC: Washington, DC, USA, 2017. [Google Scholar]
  45. EC. Special Eurobarometer 450—June 2016: EU Consumer Habits Regarding Fishery and Aquaculture Products; EC: Brussels, Belgium, 2017. [Google Scholar]
  46. Baba, Y.; Kallas, Z.; Costa-Font, M.; Gil, J.M.; Realini, C.E. Impact of hedonic evaluation on consumers’ preferences for beef attributes including its enrichment with n-3 and CLA fatty acids. Meat Sci. 2016, 111, 9–17. [Google Scholar] [CrossRef] [PubMed]
  47. Barnes, R.; Bosworth, R.C.; Bailey, D.; Curtis, K.R. Connecting sensory quality characteristics and local designations to willingness to pay for cheese at the retail level. Int. Food Agribus. Manag. Rev. 2014, 17, 115–138. [Google Scholar]
  48. Gabrielyan, G.; McCluskey, J.J.; Marsh, T.L.; Ross, C.F. Willingness to Pay for Sensory Attributes in Beer. Agric. Resour. Econ. Rev. 2016, 43, 125–139. [Google Scholar] [CrossRef]
  49. Malone, T.; Lusk, J.L. Taste trumps health and safety: Incorporating consumer perceptions into a discrete choice experiment for meat. J. Agric. Appl. Econ. 2017, 49, 139–157. [Google Scholar] [CrossRef]
  50. Hoek, A.; Pearson, D.; James, S.; Lawrence, M.; Friel, S. Healthy and environmentally sustainable food choices: Consumer responses to point-of-purchase actions. Food Qual. Preference 2017, 58, 94–106. [Google Scholar] [CrossRef]
  51. Domínguez-Torreiro, M. Alternative experimental design paradigms in choice experiments and their effects on consumer demand estimates for beef from endangered local cattle breeds: An empirical test. Food Qual. Preference 2014, 35, 15–23. [Google Scholar] [CrossRef]
  52. Lagerkvist, C.J.; Berthelsen, T.; Sundström, K.; Johansson, H. Country of origin or EU/non-EU labelling of beef? Comparing structural reliability and validity of discrete choice experiments for measurement of consumer preferences for origin and extrinsic quality cues. Food Qual. Preference 2014, 34, 50–61. [Google Scholar] [CrossRef]
  53. Scozzafava, G.; Casini, L.; Contini, C. Analysis of Italian consumer preferences for beef. New Medit 2014, 13, 66–72. [Google Scholar]
  54. Demartini, E.; Vecchiato, D.; Tempesta, T.; Gaviglio, A.; Viganò, R. Consumer preferences for red deer meat: A discrete choice analysis considering attitudes towards wild game meat and hunting. Meat Sci. 2018. forthcoming. [Google Scholar] [CrossRef]
  55. Loureiro, M.L.; Umberger, W.J. A choice experiment model for beef: What US consumer responses tell us about relative preferences for food safety, country-of-origin labeling and traceability. Food Policy 2007, 32, 496–514. [Google Scholar] [CrossRef]
  56. Lusk, J.L.; Roosen, J.; Fox, J.A. Demand for Beef from Cattle Administered Growth Hormones or Fed Genetically Modified Corn: A Comparison of Consumers in France, Germany, the United Kingdom, and the United States. Am. J. Agric. Econ. 2003, 85, 16–29. [Google Scholar] [CrossRef]
  57. Kallas, Z.; Realini, C.E.; Gil, J.M. Health information impact on the relative importance of beef attributes including its enrichment with polyunsaturated fatty acids (omega-3 and conjugated linoleic acid). Meat Sci. 2014, 97, 497–503. [Google Scholar] [CrossRef] [PubMed]
  58. Van Wezemael, L.; Caputo, V.; Nayga, R.M.; Chryssochoidis, G.; Verbeke, W. European consumer preferences for beef with nutrition and health claims: A multi-country investigation using discrete choice experiments. Food Policy 2014, 44, 167–176. [Google Scholar] [CrossRef]
  59. Ginon, E.; Combris, P.; Lohéac, Y.; Enderli, G.; Issanchou, S. What do we learn from comparing hedonic scores and willingness-to-pay data? Food Qual. Preference 2014, 33, 54–63. [Google Scholar] [CrossRef] [Green Version]
  60. Heid, A.; Hamm, U. Organic consumers’ willingness-to-pay for boar meat products before and after tasting product samples. Org. Agric. 2013, 3, 83–93. [Google Scholar] [CrossRef]
  61. Gwin, L.; Durham, C.A.; Miller, J.D.; Colonna, A. Understanding Markets for Grass-Fed Beef: Taste, Price, and Purchase Preferences. J. Food Distrib. Res. 2012, 43, 91–111. [Google Scholar]
  62. Lyford, C.P.; Thompson, J.M.; Polkinghorne, R.; Miller, M.F.; Nishimura, T.; Neath, K.; Allen, P.; Belasco, E.J. Is willingness to pay (WTP) for beef quality grades affected by consumer demographics and meat consumption preferences? Australas. Agribus. Rev. 2010, 18, 1–17. [Google Scholar]
  63. Seppä, L.; Latvala, T.; Akaichi, F.; Gil, J.M.; Tuorila, H. What are domestic apples worth? Hedonic responses and sensory information as drivers of willingness to pay. Food Qual. Preference 2015, 43, 97–105. [Google Scholar] [CrossRef] [Green Version]
  64. Umberger, W.J.; Feuz, D.M. The Usefulness of Experimental Auctions in Determining Consumers’ Willingness-to-Pay for Quality-Differentiated Products. Appl. Econ. Perspect. Policy 2004, 26, 170–185. [Google Scholar] [CrossRef]
  65. Napolitano, F.; Braghieri, A.; Piasentier, E.; Favotto, S.; Naspetti, S.; Zanoli, R. Effect of information about organic production on beef liking and consumer willingness to pay. Food Qual. Preference 2010, 21, 207–212. [Google Scholar] [CrossRef] [Green Version]
  66. Noussair, C.; Robin, S.; Ruffieux, B. A comparison of hedonic rating and demand-revealing auctions. Food Qual. Preference 2004, 15, 393–402. [Google Scholar] [CrossRef]
  67. Hung, Y.; Verbeke, W. Sensory attributes shaping consumers’ willingness-to-pay for newly developed processed meat products with natural compounds and a reduced level of nitrite. Food Qual. Preference 2018, 70, 21–31. [Google Scholar] [CrossRef]
  68. Almli, V.; Hersleth, M. Salt replacement and injection salting in smoked salmon evaluated from descriptive and hedonic sensory perspectives. Aquacult. Int. 2013, 21, 1091–1108. [Google Scholar] [CrossRef]
  69. Combris, P.; Bazoche, P.; Giraud-Héraud, E.; Issanchou, S. Food choices: What do we learn from combining sensory and economic experiments? Food Qual. Preference 2009, 20, 550–557. [Google Scholar] [CrossRef]
  70. Lange, C.; Martin, C.; Chabanet, C.; Combris, P.; Issanchou, S. Impact of the information provided to consumers on their willingness to pay for Champagne: Comparison with hedonic scores. Food Qual. Preference 2002, 13, 597–608. [Google Scholar] [CrossRef]
  71. Napolitano, F.; Caporale, G.; Carlucci, A.; Monteleone, E. Effect of information about animal welfare and product nutritional properties on acceptability of meat from Podolian cattle. Food Qual. Preference 2007, 18, 305–312. [Google Scholar] [CrossRef]
  72. Stefani, G.; Romano, D.; Cavicchi, A. Consumer expectations, liking and willingness to pay for specialty foods: Do sensory characteristics tell the whole story? Food Qual. Preference 2006, 17, 53–62. [Google Scholar] [CrossRef] [Green Version]
  73. Umberger, W.J.; Boxall, P.C.; Lacy, R.C. Role of credence and health information in determining US consumers’ willingness-to-pay for grass-finished beef. Aust. J. Agric. Resour. Econ. 2009, 53, 603–623. [Google Scholar] [CrossRef] [Green Version]
  74. Peryam, D.R.; Pilgrim, F.J. Hedonic scale method of measuring food preferences. Food Technol. 1957, 11, 9–14. [Google Scholar]
  75. Ben-Akiva, M.; Lerman, S.R. Discrete Choice Analysis: Theory and Application to Predict Travel Demand; MIT Press: Cambridge, MA, USA, 1985. [Google Scholar]
  76. Hensher, D.A.; Rose, J.M.; Greene, W.H. Applied Choice Analysis: A Primer; Cambridge University Press: Cambridge, UK, 2005; p. 717. [Google Scholar]
  77. Stone, H.; Bleibaum, R.N.; Thomas, H.A. Sensory Evaluation Practices; Academic Press: San Diego, CA, USA, 2012. [Google Scholar]
  78. Yoshida, M. Studies in psychometric classification of odors (4). Jpn Psychol. Res. 1964, 6, 115–124. [Google Scholar] [CrossRef]
  79. Yoshida, M. Studies in psychometric classification of odors (5). Jpn Psychol. Res. 1964, 6, 145–154. [Google Scholar] [CrossRef]
  80. Yue, C.; Tong, C. Consumer Preferences and Willingness to Pay for Existing and New Apple Varieties: Evidence from Apple Tasting Choice Experiments. HortTechnology 2011, 21, 376–383. [Google Scholar]
  81. Higgs, S. Memory for recent eating and its influence on subsequent food intake. Appetite 2002, 39, 159–166. [Google Scholar] [CrossRef] [PubMed]
  82. Mojet, J.; Köster, E.P. Texture and flavour memory in foods: An incidental learning experiment. Appetite 2002, 38, 110–117. [Google Scholar] [CrossRef] [PubMed]
  83. Møller, P.; Mojet, J.; Köster, E.P. Incidental and Intentional Flavor Memory in Young and Older Subjects. Chem. Senses 2007, 32, 557–567. [Google Scholar] [CrossRef] [PubMed] [Green Version]
  84. Morin-Audebrand, L.; Mojet, J.; Chabanet, C.; Issanchou, S.; Møller, P.; Köster, E.; Sulmont-Rossé, C. The role of novelty detection in food memory. Acta Psychol. 2012, 139, 233–238. [Google Scholar] [CrossRef] [PubMed]
  85. ISO-Standard 8589. Sensory Analysis: General Guidance for the Design of Test Rooms; ISO: Geneva, Switzerland, 2007. [Google Scholar]
  86. Rose, J.M.; Bliemer, M.C.J. Constructing Efficient Stated Choice Experimental Designs. Transp. Rev. 2009, 29, 587–617. [Google Scholar] [CrossRef]
  87. De Bekker-Grob, E.W.; Hol, L.; Donkers, B.; van Dam, L.; Habbema, J.D.F.; van Leerdam, M.E.; Kuipers, E.J.; Essink-Bot, M.L.; Steyerberg, E.W. Labeled versus Unlabeled Discrete Choice Experiments in Health Economics: An Application to Colorectal Cancer Screening. Value Health 2010, 13, 315–323. [Google Scholar] [CrossRef] [PubMed]
  88. Reed Johnson, F.; Lancsar, E.; Marshall, D.; Kilambi, V.; Mühlbacher, A.; Regier, D.A.; Bresnahan, B.W.; Kanninen, B.; Bridges, J.F.P. Constructing Experimental Designs for Discrete-Choice Experiments: Report of the ISPOR Conjoint Analysis Experimental Design Good Research Practices Task Force. Value Health 2013, 16, 3–13. [Google Scholar] [CrossRef] [PubMed]
  89. Kamakura, W.; Haaijer, R.; Wedel, M. The No—Choice Alternative in Conjoint Choice Experiments. Int. J. Mark. Res. 2001, 43, 1–12. [Google Scholar] [CrossRef]
  90. Small, D.M.; Prescott, J. Odor/taste integration and the perception of flavor. Exp. Brain Res. 2005, 166, 345–357. [Google Scholar] [CrossRef] [PubMed]
  91. Bech, M.; Gyrd-Hansen, D. Effects coding in discrete choice experiments. Health Econ. 2005, 14, 1079–1083. [Google Scholar] [CrossRef] [PubMed]
  92. ISTAT. Italia in Cifre 2014; Report; ISTAT: Rome, Italy, 2014. [Google Scholar]
  93. Auger, P.; Devinney, T.M. Do What Consumers Say Matter? The Misalignment of Preferences with Unconstrained Ethical Intentions. J. Bus. Ethics 2007, 76, 361–383. [Google Scholar] [CrossRef]
  94. Carrington, M.J.; Neville, B.A.; Whitwell, G.J. Why Ethical Consumers Don’t Walk Their Talk: Towards a Framework for Understanding the Gap Between the Ethical Purchase Intentions and Actual Buying Behaviour of Ethically Minded Consumers. J. Bus. Ethics 2010, 97, 139–158. [Google Scholar] [CrossRef] [Green Version]
  95. Devinney, T.M.; Auger, P.; Eckhardt, G.M. The Myth of the Ethical Consumer. J. Consum. Cult. 2011, 11, 392–394. [Google Scholar] [CrossRef]
  96. Berridge, K.; Winkielman, P. What is an unconscious emotion? (The case for unconscious “liking”). Cognit. Emot. 2003, 17, 181–211. [Google Scholar] [CrossRef] [PubMed]
  97. Bray, J.; Johns, N.; Kilburn, D. An Exploratory Study into the Factors Impeding Ethical Consumption. J. Bus. Ethics 2011, 98, 597–608. [Google Scholar] [CrossRef]
  98. Rosas-Nexticapa, M.; Angulo, O.; O’Mahony, M. How well does the 9-point hedonic scale predict purchase frequency? J. Sens. Stud. 2005, 20, 313–331. [Google Scholar] [CrossRef]
  99. Mueller, S.; Osidacz, P.; Francis, I.L.; Lockshin, L. Combining discrete choice and informed sensory testing in a two-stage process: Can it predict wine market share? Food Qual. Preference 2010, 21, 741–754. [Google Scholar] [CrossRef]
  100. Aschemann-Witzel, J.; Zielke, S. Can’t Buy Me Green? A Review of Consumer Perceptions of and Behavior Toward the Price of Organic Food. J. Consum. Aff. 2017, 51, 211–251. [Google Scholar] [CrossRef]
  101. Grunert, K.G.; Aachmann, K. Consumer reactions to the use of EU quality labels on food products: A review of the literature. Food Control 2016, 59, 178–187. [Google Scholar] [CrossRef]
  102. Hemmerling, S.; Hamm, U.; Spiller, A. Consumption behaviour regarding organic food from a marketing perspective—A literature review. Org. Agric. 2015, 5, 277–313. [Google Scholar] [CrossRef]
  103. Beriain, M.J.; Sánchez, M.; Carr, T.R. A comparison of consumer sensory acceptance, purchase intention, and willingness to pay for high quality United States and Spanish beef under different information scenarios. J. Anim. Sci. 2009, 87, 3392–3402. [Google Scholar] [CrossRef] [PubMed] [Green Version]
  104. Bower, J.A.; Saadat, M.A.; Whitten, C. Effect of liking, information and consumer characteristics on purchase intention and willingness to pay more for a fat spread with a proven health benefit. Food Qual. Preference 2003, 14, 65–74. [Google Scholar] [CrossRef]
  105. Carrillo-Rodriguez, L.; Gallardo, K.; Yue, C.; McCracken, V.; Luby, J.; McFerson, J.R. Consumer Preferences for Apple Quality Traits. Presented at the 2013 Annual Meeting on Agricultural and Applied Economics Association, Washington, DC, USA, 4–6 August 2013. [Google Scholar]
  106. Costanigro, M.; Kroll, S.; Thilmany, D.; Bunning, M. Is it love for local/organic or hate for conventional? Asymmetric effects of information and taste on label preferences in an experimental auction. Food Qual. Preference 2014, 31, 94–105. [Google Scholar] [CrossRef]
  107. Djumboung, D.A.; Tempesta, T.; Arboretti, R.; Corain, L.; Salmaso, L.; Tomasi, D.; Boatto, V. Caractéristiques du paysage et propension à acheter du vin: une expérience de choix. New Medit 2014, 13, 31–38. [Google Scholar]
  108. Dransfield, E.; Ngapo, T.M.; Nielsen, N.A.; Bredahl, L.; Sjödén, P.O.; Magnusson, M.; Campo, M.M.; Nute, G.R. Consumer choice and suggested price for pork as influenced by its appearance, taste and information concerning country of origin and organic pig production. Meat Sci. 2005, 69, 61–70. [Google Scholar] [CrossRef] [PubMed]
  109. Enneking, U.; Neumann, C.; Henneberg, S. How important intrinsic and extrinsic product attributes affect purchase decision. Food Qual. Preference 2007, 18, 133–138. [Google Scholar] [CrossRef]
  110. Ginon, E.; Lohéac, Y.; Martin, C.; Combris, P.; Issanchou, S. Effect of fibre information on consumer willingness to pay for French baguettes. Food Qual. Preference 2009, 20, 343–352. [Google Scholar] [CrossRef]
  111. Killinger, K.M.; Calkins, C.R.; Umberger, W.J.; Feuz, D.M.; Eskridge, K.M. A comparison of consumer sensory acceptance and value of domestic beef steaks and steaks from a branded, Argentine beef program. J. Anim. Sci. 2004, 82, 3302–3307. [Google Scholar] [CrossRef] [PubMed]
  112. Lange, C.; Issanchou, S.; Combris, P. Expected versus experienced quality: Trade-off with price. Food Qual. Preference 2000, 11, 289–297. [Google Scholar] [CrossRef]
  113. Lange, C.; Combris, P.; Issanchou, S.; Schlich, P. Impact of information and in-home sensory exposure on liking and willingness to pay: The beginning of Fairtrade labeled coffee in France. Food Res. Int. 2015, 76, 317–324. [Google Scholar] [CrossRef] [PubMed]
  114. Luo, J.; Mainville, D.; You, W.; Nayga, R.M., Jr. Taste and visual influences on Hispanic consumers’ preferences and willingness-to-pay for pasture-fed beef. Presented at the Agricultural & Applied Economics Association AAEA & ACCI Joint Annual Meeting, Milwaukee, WI, USA, 26–29 July 2009. [Google Scholar]
  115. Lusk, J.L.; Fox, J.A.; Schroeder, T.C.; Mintert, J.; Koohmaraie, M. In-Store Valuation of Steak Tenderness. Am. J. Agric. Econ. 2001, 83, 539–550. [Google Scholar] [CrossRef] [Green Version]
  116. Martínez-Carrasco, L.; Brugarolas, M.; Martínez-Poveda, A.; Ruiz-Martínez, J. Comparing hypothetical versus non-hypothetical methods for measuring willingness to pay in a food context. Span. J. Agric. Res. 2015, 13, e0109. [Google Scholar] [CrossRef]
  117. Mueller, S.; Szolnoki, G. The relative influence of packaging, labelling, branding and sensory attributes on liking and purchase intent: Consumers differ in their responsiveness. Food Qual. Preference 2010, 21, 774–783. [Google Scholar] [CrossRef]
  118. Napolitano, F.; Pacelli, C.; Girolami, A.; Braghieri, A. Effect of Information About Animal Welfare on Consumer Willingness to Pay for Yogurt. J. Dairy Sci. 2008, 91, 910–917. [Google Scholar] [CrossRef] [PubMed]
  119. Scholderer, J.; Nielsen, N.; Bredahl, L.; Claudi-Magnussen, C.; Lindahl, G. Organic Pork: Consumer Quality Perceptions; Project Paper 02/04; MAPP: Aarhus, Denmark, 2004; ISSN 0907 2101. [Google Scholar]
  120. Umberger, W.J.; Feuz, D.M.; Calkins, C.R.; Killinger-Mann, K. U.S. consumer preference and willingness-to-pay for domestic corn-fed beef versus international grass-fed beef measured through an experimental auction. Agribusiness 2002, 18, 491–504. [Google Scholar] [CrossRef]
  121. Zhang, K.M.; Vickers, Z. The order of tasting and information presentation in an experimental auction matters. Food Qual. Preference 2014, 36, 12–19. [Google Scholar] [CrossRef]
  122. Harrop, S.R. Traditional agricultural landscapes as protected areas in international law and policy. Agric. Ecosyst. Environ. 2007, 121, 296–307. [Google Scholar] [CrossRef]
Figure 1. Experimental treatments.
Sustainability 10 02795 g001
Figure 2. The DCE experimental design blocking.
Sustainability 10 02795 g002
Table 1. Studies that analyzed the effects of tasting on food product demand.
Food TypeMethods
DCECVMDCAAuctionOtherTotal
Beef26 6 14
Pork 2 2
Processed Meat and Fish 5 5
Fresh Product1 5 6
Alcoholic Drinks111216
Soft Drinks and Juices 1225
Bread 2 2
Cheese and Yogurt1 2 3
Other Processed Food 1 4 5
Total510228348
Note: see Table A1 (Appendix A) for a list of the authors and related works to which this table refers. Legend: DCE = discrete choice experiment; CVM = contingent valuation method; DCA = discrete conjoint analysis; Auction = experimental auction; Other = other methods.
Table 2. Attributes and levels used in the DCE design.
AttributesLevels
Meat TypeChianina, Other Italian Quality Cattle Breeds, Standard
Organic BreedingYes, No
Cattle Reared in a Traditional Rural LandscapeYes, No
Protected Geographical Indication (PGI) CertificationYes, No
Meat Processing MethodIndustrial, Traditional
PackagingGlass Jar, Tin
Price (€/90 g)0.92, 1.7, 2.0., 2.38, 2.7
Table 3. Example of a choice task.
Tinned Meat
Other Italian
Quality Breeds
ChianinaStandard
Organic BreedingYesNoNo
Cattle Reared in a Traditional Rural LandscapeYesYesNo
PGI CertificationYesNoNo
Meat Processing MethodIndustrialTraditionalIndustrial
PackagingGlass JarTinTin
Price (€/90 g)2.7 €2 €0.92 €
Specify your choice:
Table 4. Respondents’ socio-economic characteristics.
CategoryClassNo Tasting GroupTasting GroupTotal
n%n%n%
GenderFemale7458.3856815963.1
Male5341.740329336.9
Age≤303628.435287128.3
31–404031.52116.86124.2
41–502015.730245019.8
51–602116.52822.44919.4
≥60107.9118.8218.3
Education levelMiddle school107.91411.2249.5
High school6349.66854.413152
Graduate5442.54334.49738.5
Household size1–25644.14838.410441.3
3–466525745.612348.8
≥553.92016259.9
Household income (gross annual)≤€10.0001713.42116.83815.1
€10.001–30.0004535.44636.89136.1
€30.001–50.0002015.715123513.9
≥€50.00043.243.283.2
No information4132.33931.28031.7
In charge of household purchasesYes5845.7504010842.9
No1310.21915.23212.7
Yes, with another family member5644.15644.811244.4
Table 5. Monthly food and meat expenditure.
No Tasting GroupTasting GroupTotal
nAv. exp. (€) a St.Dev.nAv. exp.(€) a St.Dev.nAv. exp. (€) a St.Dev.
Food expenditure127421.9238.7125432.8219.4252427.3228.9
Per capita food expenditure127174.796.2125161.174.525216886.2
Meat expenditure127177.5127.2125180.3116.9252178.9121.9
Per capita meat expenditure12770.748.312566.238.125268.543.5
Beef expenditure1278885.912585.879.425286.982.6
Per capita beef expenditure12733.730.112530.625.425232.227.9
a monthly average expenditure in €.
Table 6. Sensory test hedonic score on the overall liking of the tinned Chianina meat.
Liking Hedonic ScoreNo Tasting GroupTasting GroupTotal
n%n%n%
132.410.841.6
2107.964.8166.3
386.31310.4218.3
41713.497.22610.3
52418.93427.25823.0
63225.23124.86325.0
71915.02318.44216.7
886.321.6104.0
964.764.8124.8
mean score5.335.45.37
Table 7. DCE model’s results.
Attribute LevelCoeff.WTP Mean (€/90 g)
Random parameters (latent heterogeneity)
Chianina3.950 ***1.47 [1.23, 1.72]
Other Italian quality breeds3.354 ***1.25 [1.00, 1.50]
Organic0.852 ***0.64 [0.53, 0.74]
Traditional landscape0.791 ***0.59 [0.49, 0.69]
Protected Geographical Indication (PGI)0.564 ***0.42 [0.34, 0.50]
Traditional Manufacturing0.677 ***0.50 [0.42, 0.59]
Glass jar0.382 ***0.29 [0.21, 0.36]
Non-Random Parameters
Price−2.682 ***
Heterogeneity in mean parameters
Chianina · LowL0.1570.06 [ 0.22 , 0.34]
Chianina · HighL1.334 **0.50 [0.08, 0.91]
Chianina · AGE−0.669 * 0.25 [−0.51, 0.01]
Chianina · PF 0.55 −0.21 [ 0.47 , 0.06]
Other Italian quality breeds · LowL0.42780.16 [ 0.12 , 0.44]
Other Italian quality breeds · HighL0.7330.27 [ 0.12 , 0.67]
Other Italian quality breeds · AGE−0.804 ** 0.30 [ 0.56 , 0.03 ]
Other Italian quality breeds · PF0.1860.07 [ 0.19 , 0.33]
Organic · LowL0.0030.00 [ 0.12 , 0.12]
Organic · HighL0.1310.10 [ 0.08 , 0.27]
Organic · AGE 0.192 0.14 [ 0.26 , 0.03 ]
Organic · PF 0.096 0.07 [ 0.18 , 0.04]
Traditional landscape · LowL 0.151 0.11 [ 0.22 , 0.00]
Traditional landscape · HighL−0.431 ** 0.32 [ 0.47 , 0.17 ]
Traditional landscape · AGE 0.037 0.03 [ 0.13 , 0.08]
Traditional landscape · PF−0.234 * 0.17 [ 0.28 , 0.07 ]
PGI · LowL 0.139 0.10 [ 0.20 , 0.01 ]
PGI · HighL0.1640.12 [ 0.01 , 0.25]
PGI · AGE0.0150.01 [ 0.08 , 0.10 ]
PGI · PF 0.146 0.11 [ 0.20 , 0.02 ]
Traditional Manufacturing · LowL 0.0501 0.04 [−0.13, 0.06]
Traditional Manufacturing · HighL−0.479 ** 0.36 [ 0.50 , 0.22 ]
Traditional Manufacturing · AGE0.00790.01 [ 0.08 , 0.10 ]
Traditional Manufacturing · PF0.00740.01 [ 0.08 , 0.09 ]
Glass jar · LowL0.04180.03 [ 0.05 , 0.11 ]
Glass jar · HighL−0.283 * 0.21 [ 0.33 , 0.09 ]
Glass jar · AGE0.11480.09 [0.01, 0.16]
Glass jar · PF−0.341 *** 0.25 [ 0.33 , 0.18 ]
Derived standard deviations of random parameters distributions
Chianina1.278 ***
Other Italian quality breeds1.021 ***
Organic0.800 ***
Traditional landscape0.689 ***
Protected Geographical Indication (PGI)0.430 ***
Traditional Manufacturing0.539 ***
Glass jar0.476 ***
N. respondents252
N. observations2016
Log-likelihood 1408.21
Halton draws1000
McFadden pseudo R 2 0.364
AIC2902
Note: ***, **, * significant at the 1%, 5%, and 10% levels, respectively. Legend: LowL = people that tasted the product and expressed an overall liking greater than 6; HighL: people that tasted the product and expressed an overall liking equal or lower than 6; PF = purchasing frequency of tinned meat equal to or higher than twice per month; AGE = age greater than 40. 95% confidence intervals in squared brackets. Random parameters were assumed to be normally distributed.

