Hydropower Potential in the Periglacial Environment of Switzerland under Climate Change


1
Laboratory of Hydraulics, Hydrology and Glaciology, ETH Zurich, 8093 Zurich, Switzerland
2
Swiss Competence Center for Energy Research (SCCER-SoE), ETH Zurich, 8093 Zurich, Switzerland
*
Author to whom correspondence should be addressed.
Sustainability 2018, 10(8), 2794; https://doi.org/10.3390/su10082794
Submission received: 30 April 2018
/
Revised: 22 July 2018
/
Accepted: 2 August 2018
/
Published: 7 August 2018
(This article belongs to the Special Issue Hydropower Production)
Abstract
:Hydropower is the most important domestic source of renewable energy in Switzerland. Many reservoirs are located in the periglacial environment of the Swiss Alps. Climate change and the changeover to a new energy system will challenge the existing infrastructure, but will also provide perspectives for new hydropower plants (HPPs). This study presents a framework for the systematic analysis of the hydropower potential of the periglacial Swiss Alps. The results are referenced to the Swiss Energy Strategy and other potential courses of action, such as upgrade of existing infrastructure. An evaluation matrix with 16 economical, environmental and social criteria for the consistent rating of all feasible sites is proposed. All criteria and their ratings are explained. It is demonstrated that the chosen methodology leads to a relatively stable ranking even for significantly different weighting models. Although being affected by uncertainties and remaining challenges, the methodology and results are sufficiently detailed for decision-making. Therefore, recommendations for future hydropower investments can be given. The results are strongly linked to Swiss boundary conditions, but the methodology itself is generally applicable for all glaciers worldwide, if the required input data are available.
1. Introduction
Hydropower is the most important domestic source of renewable energy in Switzerland. Today, 59% (36.3 TWh/year) of domestic electricity production is sourced from hydropower, of which more than 50% originates from storage or pumped storage hydropower plants (HPPs) [1]. After the nuclear disaster of Fukushima Daichii on 11 March 2011, the Federal Council and Swiss Parliament decided to withdraw from nuclear power, which accounts for more than 30% of domestic energy production. Adaptions of the Swiss energy system were implemented into the Swiss Energy Strategy 2050, which targets in its Energy Act that hydropower shall produce at least 37.4 TWh/year in 2035 [2]. The hydropower production must therefore be increased by a minimum of 1.1 TWh/year (+3%) by 2035. These numbers are net values, i.e., production losses at the national level due to increased environmental flows following more severe regulations have to be additionally replaced. Although this 3% net increase may seem small, it should be noted that the exploitable Swiss hydropower potential under today’s severe environmental and economic restrictions is quite limited. To reach this goal, large-scale hydropower development will therefore benefit from investment subsidies, market premiums, and status of national interest. New HPPs and upgrades of existing infrastructure may become feasible now, even under the current challenging market conditions.
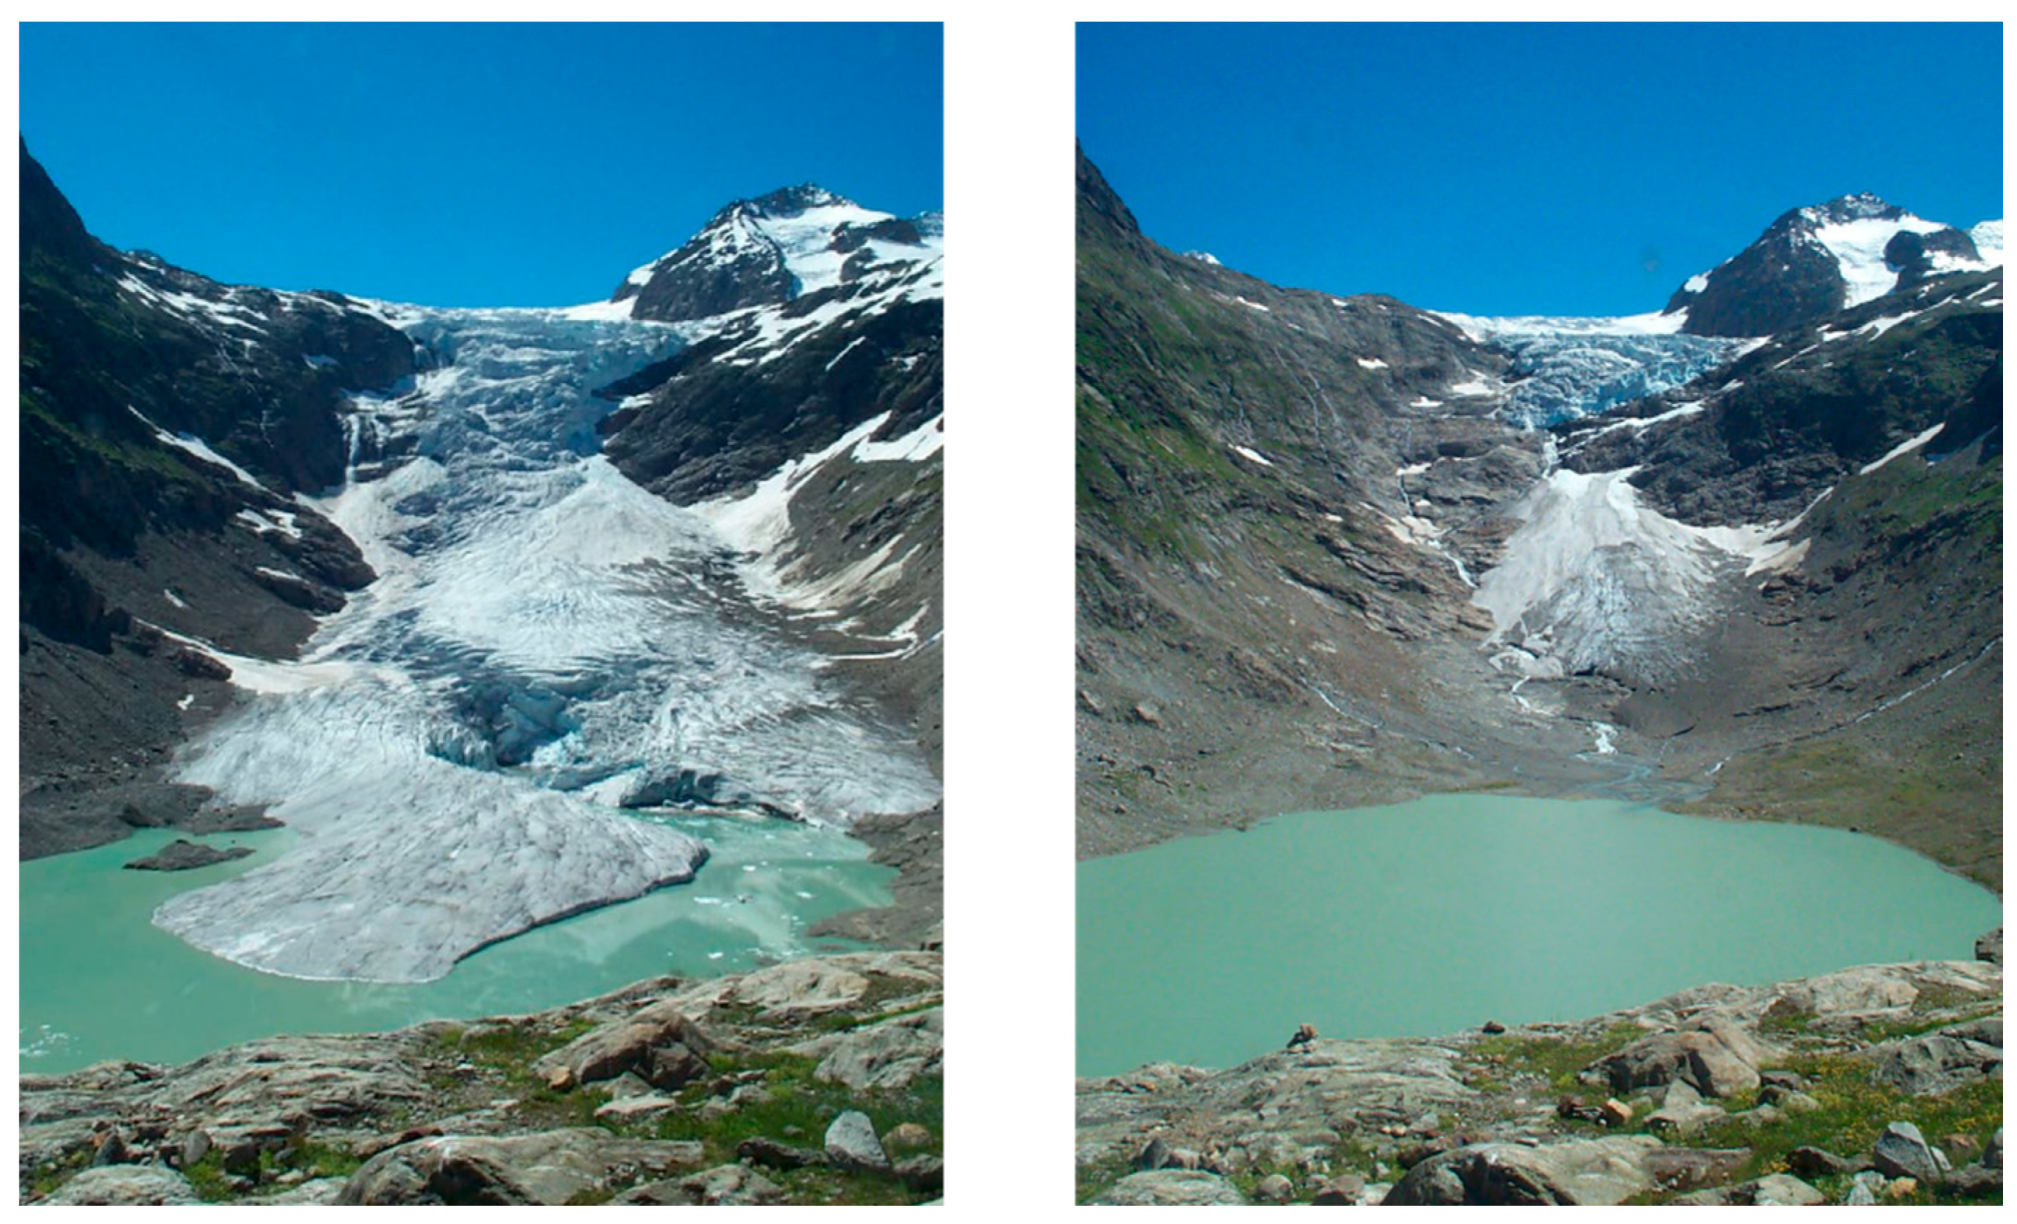
The changeover to a new energy system is affected by impacts of climate change. The global mean air temperature has risen by 0.85 °C between 1880 and 2012 [3], with even stronger impacts in Switzerland. Since the end of the Little Ice Age (around 1864), the mean air temperature has risen by 1.8 °C, which resulted in a glacier surface area reduction from 1300 km2 to 940 km2 (−28%) between 1973 and 2010 [4]. Atmospheric warming affects existing HPPs in the periglacial environment due to changing boundary conditions, such as modified runoff regimes [5,6,7,8,9], increased sediment yield [10] or more frequent and intense natural hazards [11]. However, it also provides perspectives for new HPPs, as suitable reservoir locations become ice-free due to glacier retreat. Such new proglacial lakes have recently started forming at the terminus of Lower Grindelwald Glacier, Trift Glacier and Rhône Glacier, in the proglacial area of Palü Glacier and Gauli Glacier, or even on the Plaine Morte Glacier. Figure 1 shows the proglacial lake at Trift Glacier where a new reservoir is already in the approval procedure.
The potential of new HPPs integrating new lakes has been studied by [11,12], who applied the model of [13] and identified 500–600 depressions below glaciers, which might be filled with water and become new lakes once the glaciers have receded. Forty new lakes would have a volume of more than 10 hm3; five new lakes at Aletsch Glacier, Gorner Glacier, Otemma Glacier, Corbassière Glacier and Gauli Glacier would have volumes larger than 50 hm3. The largest depression is located at Konkordia Place in the middle of Aletsch Glacier, with a maximum depth of 300 m and a volume of 250 hm3, which is comparable to the volume of Lac d’Emosson [13], one of the largest reservoirs in Switzerland. Except for a few case studies, glacier retreat and new lakes in the Swiss Alps and new lakes as a consequence of clacier cetreat in high mountains: chances and risks [11,12] did not present estimates of the hydropower potential of these new lakes.
In this study, we evaluate the potential of new HPPs in the periglacial environment of Switzerland. Diverging from [11,12], we only consider reservoir locations that are currently ice-free, but we include all glaciers and did not exclude locations without proglacial lakes. We discuss how suitable sites for new reservoirs can be identified from a technical point of view and how many new HPPs would be needed to cover the deficit imposed by the Swiss Energy Strategy 2050. A systematic analysis to evaluate the potential of new HPPs in the periglacial environment considering climate change scenarios is presented, starting from (1) evaluating runoff projections for different global circulation models (GCM) and emission scenarios (representative concentration pathways; RCP); (2) selecting sites with annual runoff volumes above a certain threshold; (3) subjecting all remaining sites to an evaluation matrix to rate them consistently; and, (4) estimating the HPP potential of the best-rated sites.
2. Methods
2.1. Site Selection
Runoff evolution for 197,654 glaciers worldwide for the time period 2010–2100 has been computed with the Global Glacier Evolution Model (GloGEM) presented by [14]. It is driven by near-surface air temperature and precipitation from 14 GCM and forced by the emission scenarios RCP2.6, RCP4.5, and RCP8.5 (note that four GCM did not use RCP2.6) [3]. They specify annual greenhouse gas concentrations and anthropogenic emissions up to 2100. The runoff projections were further processed by [15] for 1576 glaciers in Switzerland. Output data are monthly-averaged runoff volumes at current glacier terminus, with precipitation on current glacier surface being included (but not on non-glaciated parts of the catchment).
In the present study, the average of all GCM was used. RCP4.5 was analyzed further, as it can be interpreted as the “realistic” scenario, lying between the “optimistic” scenario RCP2.6 and the “pessimistic” scenario RCP8.5. All sites with annual runoff volumes larger than 10 hm3, averaged over the time period 2017–2035, were analyzed further, leading to a reduction to 62 potential sites. Runoff from non-glaciated parts of the catchments (one-quarter to one-half of the total area) was left available for environmental flows, so that it is not available for electricity production. This is a conservative assumption regarding annual production, because a large amount of water is consequently not exploited.
2.2. Site Rating
All sites were compared to each other and rated with 16 evaluation criteria, grouped into the three classical sustainability domains: economy, environment and society. The criteria and structure of the evaluation matrix was chosen to adequately rate HPPs in the periglacial environment facing challenges of climate change. The criteria weights are generally subjective and were based on personal experience. They have been varied in a sensitivity analysis, but did not significantly change the order of best-rated sites. The corresponding evaluation matrix is shown in Table 1. Some criteria can be attributed to two domains; for example, “degree of protection” could be both an environmental and social criterion. All criteria are explained below.
2.2.1. Installed Capacity
The design discharge (m3/s) is calculated as:
where (m3/year) is the annual runoff volume and (h/year) is the annual full-load production hours. It was assumed that run-of-river power plants have 5000 full-load production hours per year (ca. 13.7 hours per day), whereas storage plants have 3000 full-load production hours per year (ca. 8.2 hours per day). The installed capacity (MW) is then calculated as:
where (–) is the overall efficiency, (9.81 m2/s) is the gravitational acceleration, (1000 kg/m3) is the density of water and (m) is the gross head. The overall efficiency was assumed to be 0.73: It includes 10% loss at the turbines and 5% friction loss as well as 15% loss due to year-to-year variability and uncertainty in runoff projections.
2.2.2. Electricity Production
The annual electricity production (GWh/year) is the product of installed capacity and the annual full-load production hours:
2.2.3. Investment Costs
Investment costs were not calculated at this stage, but rated qualitatively. Six factors were either judged positively or negatively:
- dam height: positive if less than 150 m;
- tunnel lengths (headrace tunnel and penstock/pressure shaft): positive if less than 2 km;
- HPP type: positive if run-of-river HPP or storage HPP (negative if pumped storage HPP);
- gross head: positive if less than 500 m (more degrees of freedom regarding turbine selection);
- surge shaft: positive if the ratio of total tunnel/penstock length to gross head is less than 4, because a maximum start-up time of 2.5 s to avoid a surge shaft according to IEC 60308 (International Electrotechnical Commission) [16] can then typically be met;
- distance to access road: positive if less than 2 km.
If there are more negative than positive factors, the site is rated with “high” investment costs and vice versa. If positive and negative factors level out, the site is rated with “medium” investment costs.
2.2.4. Runoff Evolution
Average annual runoff volumes of the time periods 2017–2035 and 2090–2099 were compared. The reduction between the first period (when the goals of the Energy Act have to be reached) and the second period (end of the runoff projections) was rated.
2.2.5. Reservoir Sedimentation
Reservoir sedimentation is represented by the infill time (years), which is calculated as:
where (m3) is the reservoir capacity, (m3/year) is the annual sediment deposition volume, (m3/year) is the annual sediment input and (–) is the trap efficiency. The annual sediment input, , is calculated with the approach of [17], which relies on annual inflow volumes and sediment density, (2650 kg/m3), solely and does not account for bed-load. However, it is assumed that 70–100% of the sediment input into periglacial reservoirs is clay and silt [18], which, consequently, will be transported in suspension. Note that Equation (5) is dimensionally incorrect:
2.2.6. Earthquake Vulnerability
Earthquake vulnerability of the dams was classified into three zones according to the classification of the Swiss Standard SN 505 261 “Actions on Structures” [21].
2.2.7. Impulse Wave Vulnerability
Impulse wave vulnerability was linked to the slopes of the future reservoir shores. Impulse waves can be triggered by, for example, rock falls in summer, or snow and ice avalanches in winter. Such mass movements are expected on slopes with angles of 30–45° [22]. At higher angles, the unstable masses slide off in small portions because the inner friction angle is usually exceeded. At lower angles, friction forces are usually high enough to prevent large mass movements.
2.2.8. Flood Protection
The larger the reservoir volume compared to the annual runoff volume, the more relative storage volume is likely to be used for flood protection, the less likely becomes an overspill during floods and the higher the retention capacity [23]. Seasonal storage reservoirs with a CIR of at least 40% were rated best, daily storage (run-of-river) HPPs with CIR of less than 10% [24] were rated worst.
2.2.9. Flexibility and Storage Capacity
Storage capacity and power system stability are important regarding future electricity demands. Pumped storage HPPs are the most flexible setup possible and rated best.
2.2.10. Visibility from Settlements
Dams visible from settlement areas are a significant disturbance of the landscape in public perception. Therefore, they were rated worst. Reservoirs without artificial dams (natural lakes in ice-free depressions) were rated best.
2.2.11. Environmental Flow
Environmental flow regulations depend on the biotopes and biocoenoses of the downstream reaches. Natural rivers will likely have the most restrictive regulations, whereas purely artificial reaches may have only a minimum of constraints to be met.
2.2.12. Sediment Continuity
According to the Federal Act on the Protection of Water [25], reservoirs may not interrupt bed-load transport in a way that flora and fauna are seriously harmed (Art. 43). Reservoirs with trap efficiencies (Equation (6)) of less than 50% were rated best, because still half of the sediments are released. Reservoirs with trap efficiencies of more than 90% were consequently rated worst, as they almost completely prevent sediment continuity. It has to be noted that the legal framework refers to bed-load only and suspended-load is not included.
2.2.13. Hydro- and Thermo-Peaking
Short-term, rapid artificial changes in discharge and water level in rivers (hydropeaking) must be prevented or eliminated according to [25] (Art. 39a). Pumped storage HPPs are judged to be the least problematic because they usually release water into an artificial reservoir. In contrast, the release of turbined water into a natural river is most problematic.
2.2.14. Degree of Protection
The Federal Inventory of Landscapes and Natural Monuments of National Importance protects 19% of Swiss land area [26]. These so-called “BLN” areas have the highest degree of protection in Switzerland. Less restrictive degrees of protection apply to sites in the Emerald Network or UNESCO World Heritage sites.
2.2.15. Land Use
Most potential reservoir locations are located on glacier forefields, which are considered to be unproductive areas. These reservoirs are rated highest. HPPs that interact with settlement areas are rated lowest.
2.2.16. Tourism
Most reservoir locations would not affect touristic activities. Some sites have negative impacts on recreational areas (for example, popular skiing and hiking trails) and were rated lowest, whereas others could have positive impacts on local recreation and were rated best.
2.3. Preliminary Design Study
Preliminary design studies were carried out for the best-rated new HPPs based on the following assumptions:
- center of mass of reservoir is located at 40% of maximum reservoir depth below full supply level;
- overall constant roughness of 85 m1/3/s in both steel- and concrete-lined tunnels and penstocks;
- a surge shaft is needed whenever the start-up time is above 2.5 s (IEC 60308);
- pressure shaft length should be minimized, while pressure tunnel length should be maximized;
- optimum flow velocities of 3–4 m/s in pressure tunnel and 5–7 m/s in pressure shaft must be achieved;
- interactions with existing HPPs must be considered (for example, the new HPP at Aletsch Glacier has to release the water into Gebidem reservoir, from which the total runoff is turbined).
These preliminary design studies allowed for a more accurate estimate of installed capacity, annual electricity production and energy equivalent of the reservoir. The latter is defined as the annual energy production that can be produced from one reservoir filling in the newly built and all existing storage HPPs (if applicable) downstream of the new reservoir, when the water is released into the upper reservoir of an existing pumped storage HPP or released immediately upstream of an existing intake.
3. Results
Three different types of sites were distinguished: (a) sites suitable for isolated new HPPs; (b) sites suitable as upper reservoirs of pumped storage HPPs due to their proximity to existing reservoirs, which can be used as lower reservoir; and (c) sites suitable for upgrading existing HPPs by collecting water and transferring it into adjacent reservoirs. Best-rated sites for new HPPs are at the terminus of Aletsch, Gorner, Grindelwald, Hüfi, Rhône, Roseg, and Trift Glacier (Table 2). These reservoirs achieve 192–213 points out of the maximum of 300 (minimum score is 100). This shows that even the best-rated sites have significant drawbacks or, vice versa, the most feasible sites are already being exploited and only partially feasible sites remain. Upper reservoirs of new pumped storage HPPs would be feasible at Oberaletsch, Corbassière, Gauli, Allalin, and Schwarzberg Glacier. At many locations, existing reservoirs will have substantially higher inflows (for example, Gebidem, Lac de Mauvoisin, Lac des Dix or Grimselsee) due to the higher contributions from glacier meltwater in the future. Additionally, they could be further upgraded by transferring water from neighboring catchments that is not yet used.
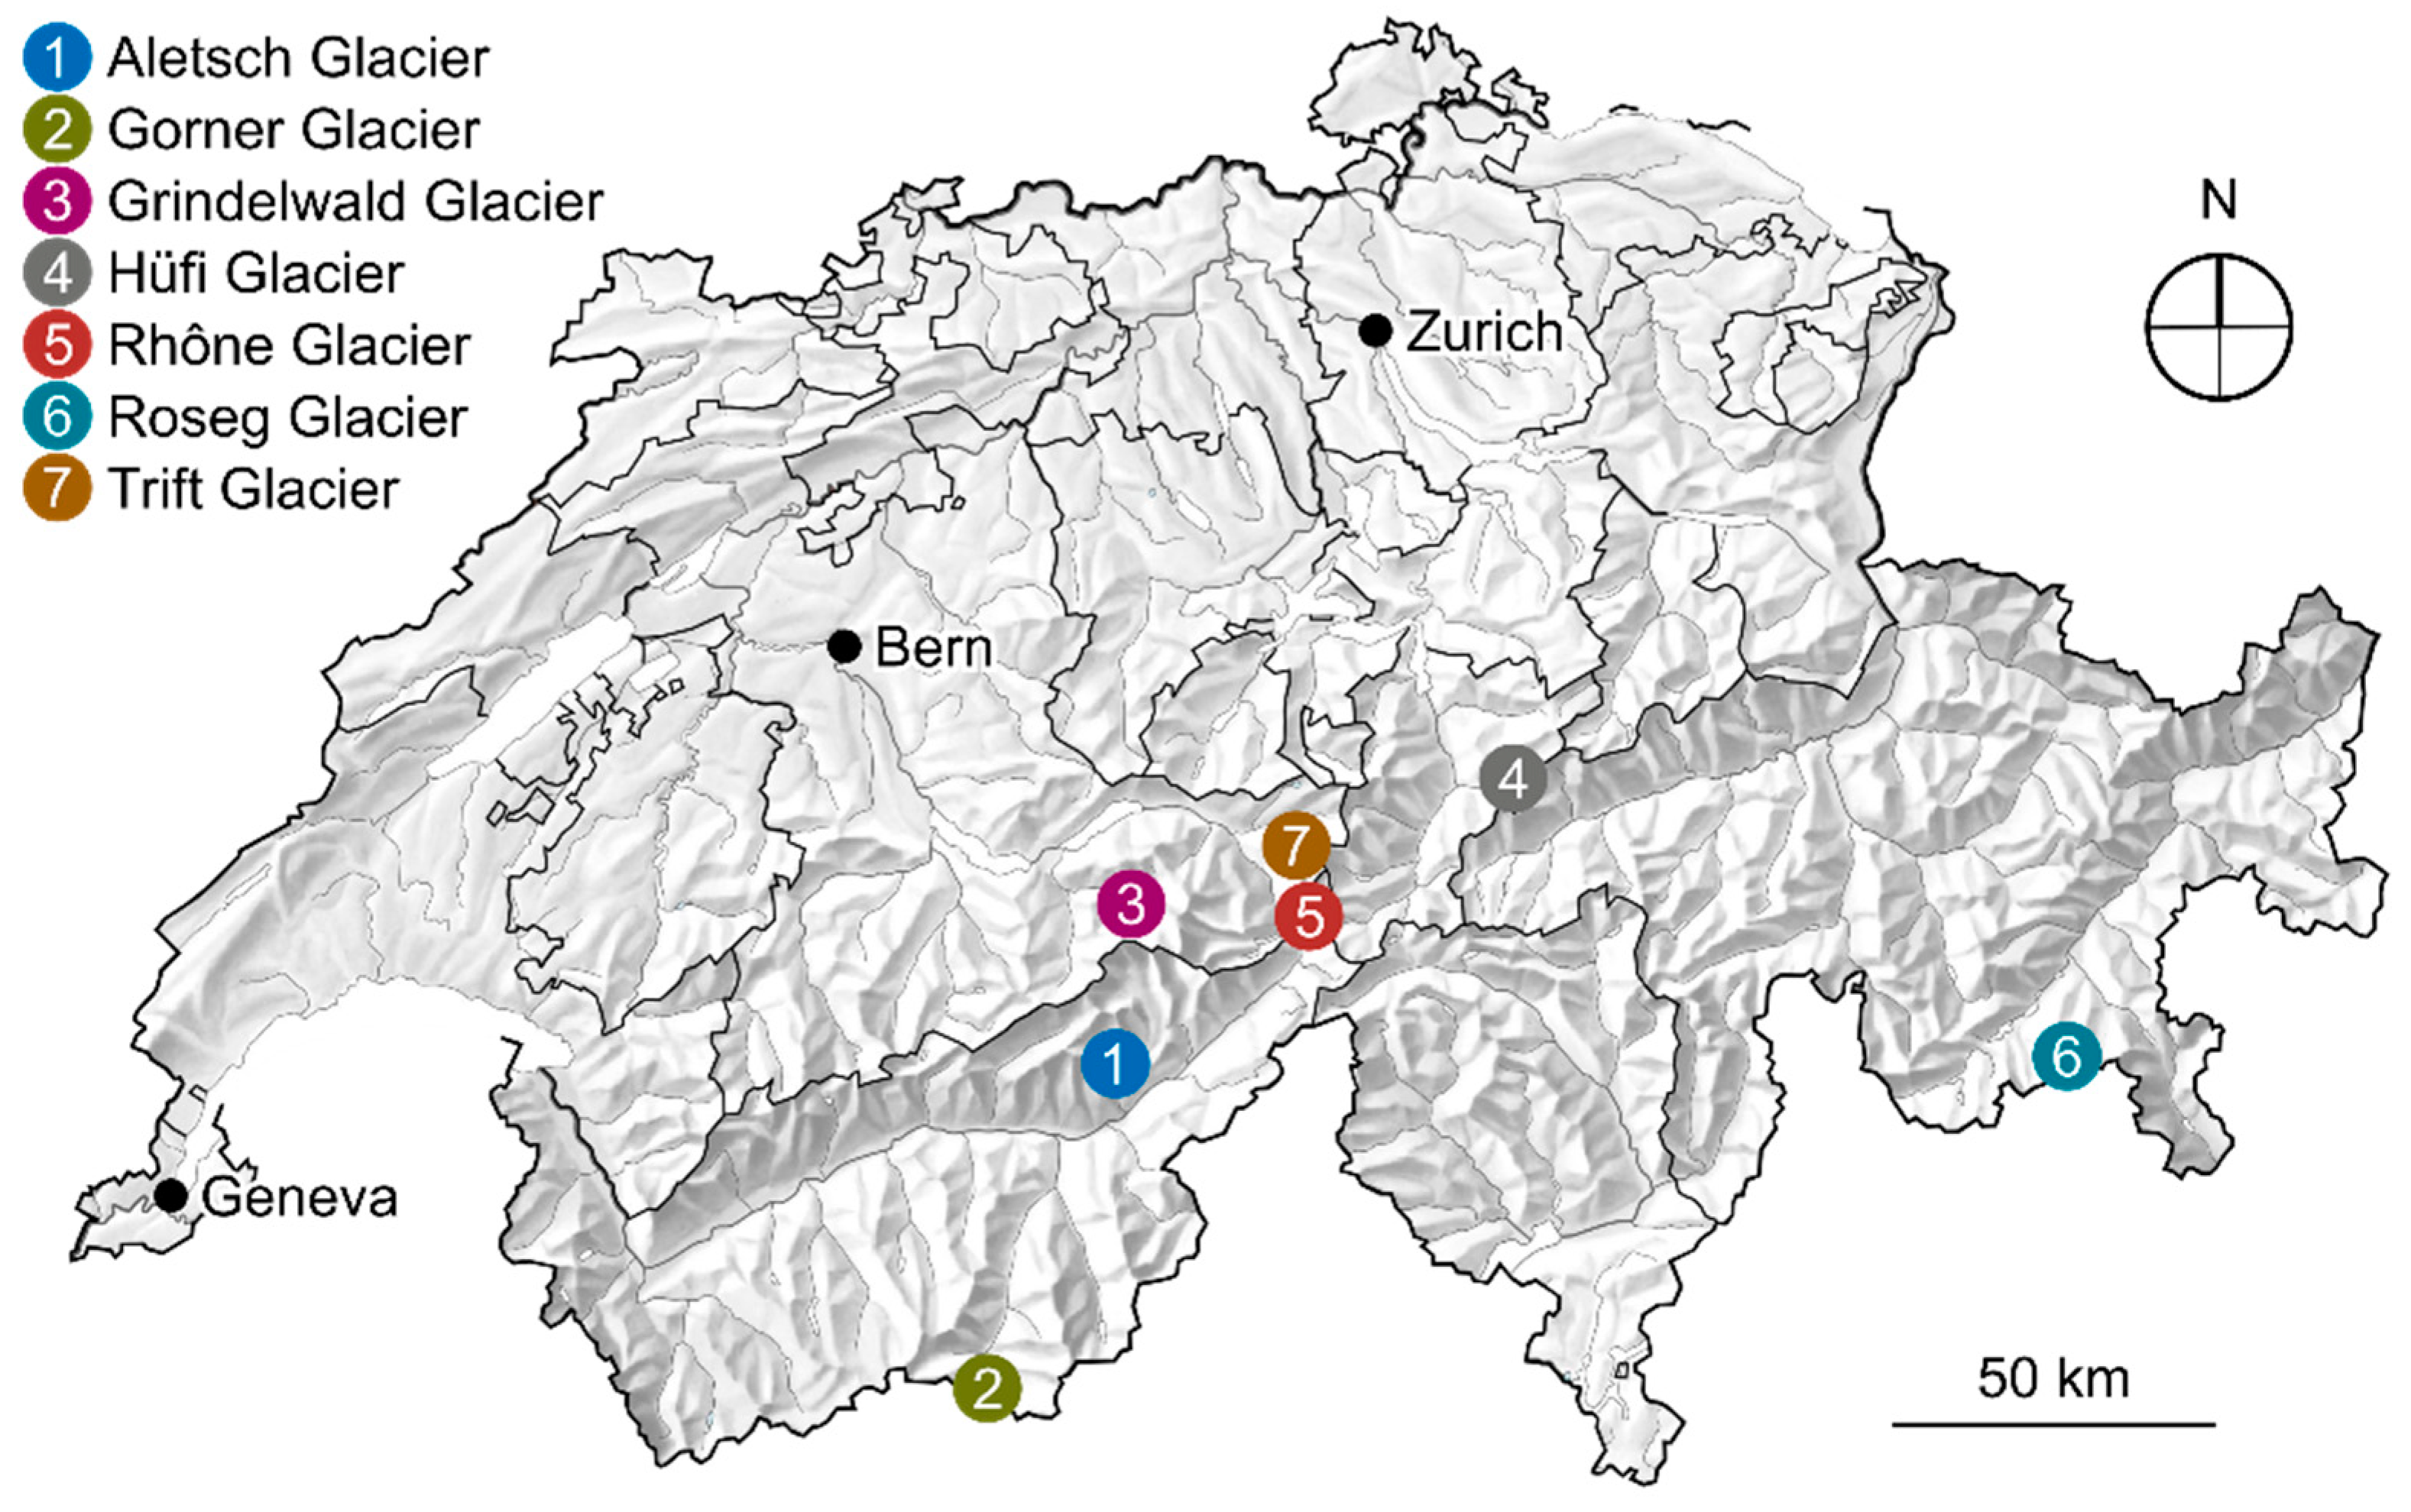
The seven best-rated new HPPs can exploit an annual electricity production of 1.1 TWh/year and consequently fulfill the requirements of the Swiss Energy Strategy 2050 (Table 2). All reservoirs serve as seasonal storages and are intended for energy production as their main purpose. However, they will have additional flood retention functions, even if the reservoir is at full supply level during a flood due to flood peak damping effects (see Section 2.2.6). The location of the new HPPs is shown in Figure 2.
4. Discussion
4.1. Uncertainties
Four main sources of uncertainty, subsequently classified in descending order, can be identified:
- Runoff projections depend on climate change evolution and thus on the chosen scenario. Here, scenario RCP4.5 was chosen, which is a stabilization scenario that lies between the mitigation scenario RCP2.6 and the non-intervention scenario RCP8.5. For the time period 2017–2035, the annual runoff volumes 2% lower for RCP2.6 and 1% higher for RCP8.5 on average, compared to RCP4.5. These differences are negligible. By the end of the century (2090–2099), these differences will be 9% lower for RCP2.6 and 2% higher for RCP8.4, on average.
- The operation modes of the new HPPs depend on the evolution of new renewables as well as on political measures and market conditions. It was assumed that all new HPPs, which have CIR > 0.55, operate as seasonal storages to help reduce the winter season deficit imposed by the Energy Strategy 2050, with the phase-out of nuclear power plants providing base load. The need for multi-purpose reservoirs (for example for irrigation in dry and hot summers) and the demand for grid regulation and network stabilization, which may increase significantly (for example, when the share of volatile, weather-dependent new renewables increases), were neglected. Nevertheless, storage HPPs can support network stabilization by providing balance energy generated by turbine operation (or pumping operation in the case of pumped storage HPPs). Electrical and mechanical equipment should be selected with regards to this service.
- Reservoir volumes at today’s glacier sites were estimated using bed-rock topography derived from ground-penetrating radar (GPR) measurements, which have a horizontal resolution of ±25–50 m and are consequently affected with considerable uncertainties. The bed-rock level can be estimated with an accuracy in the order of ±10 m (D. Farinotti/VAW ETH Zurich, pers. comm.). Combined with the coarse horizontal resolution, uncertainties in the bed rock topography are relatively high. Reservoir volumes, dam heights and installed capacity are therefore subject to uncertainty.
- Assumptions of overall efficiency, full production hours, etc., were solely determined based on empirical values and experience. Furthermore, environmental flow regulations were not investigated in detail and it was assumed that the high portion of runoff from non-glaciated catchment will meet the requirements. Finally, water loss due to infiltration and quantitative cost estimates were neglected, and hydropower or energy strategies of the cantons concerned were not considered.
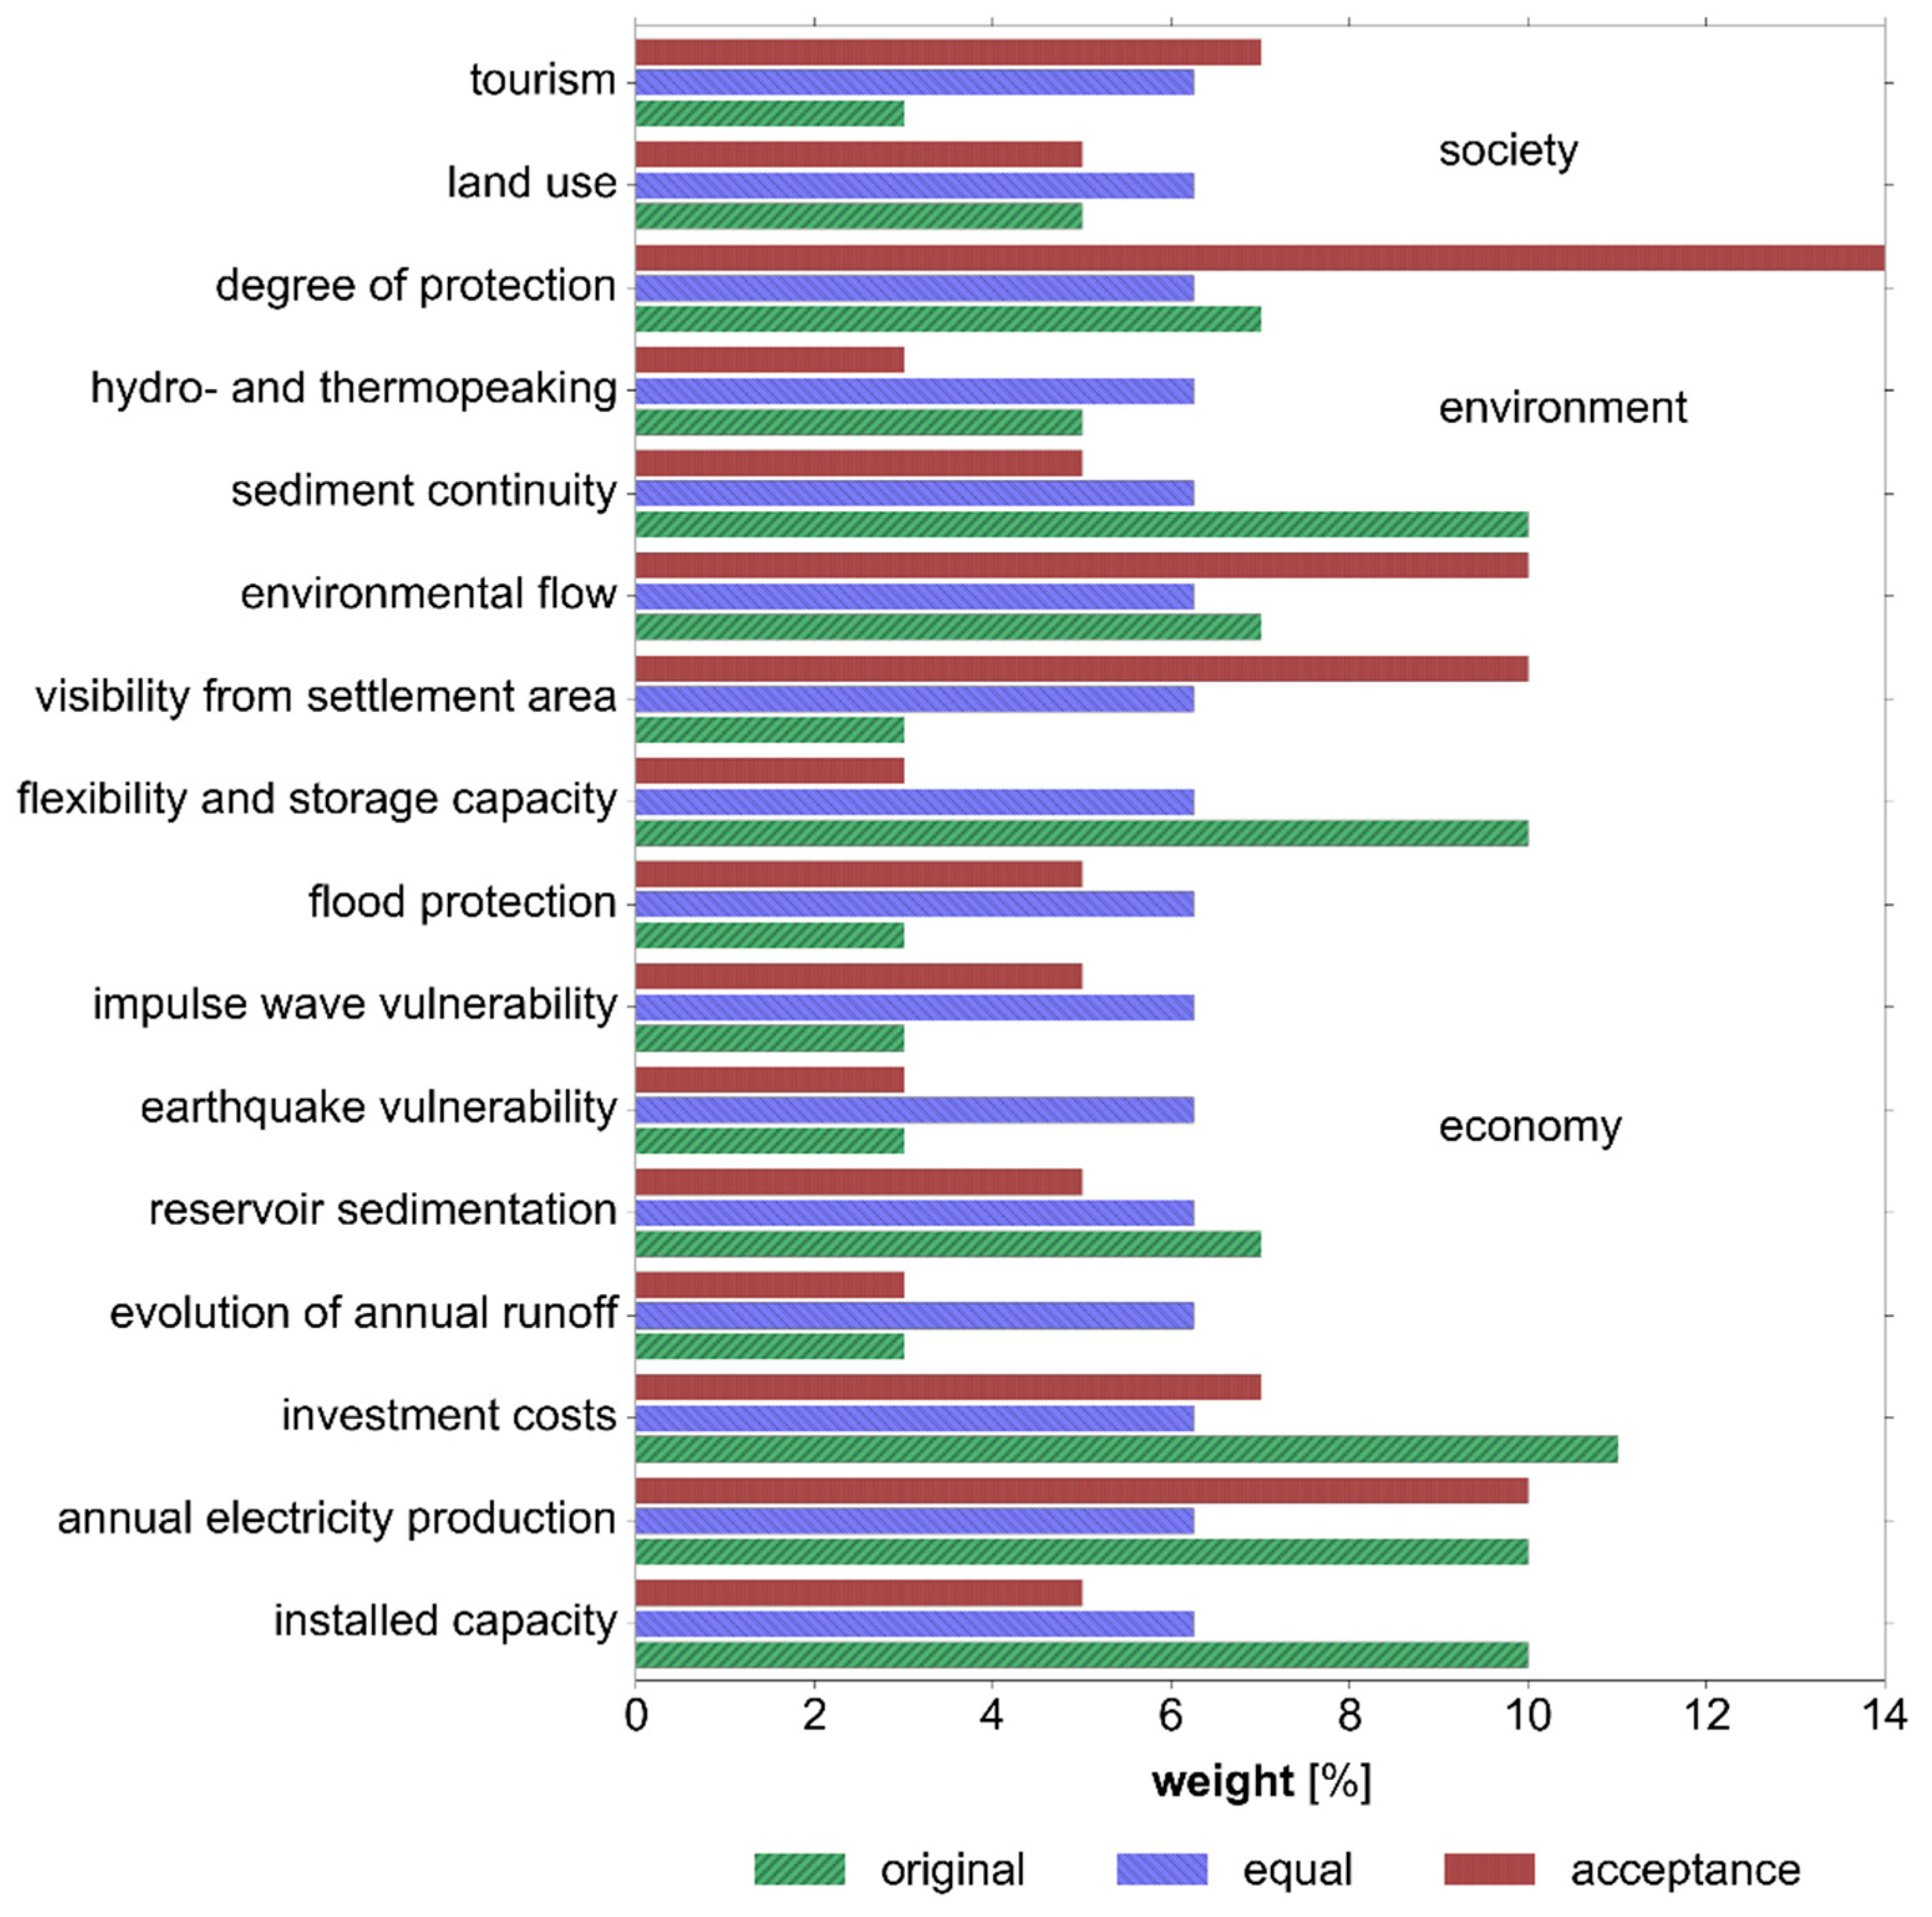
Although these uncertainties affect the quantities in Table 2, the sites selected as best reservoir options are judged to remain among the most interesting of all 62 potential sites investigated in detail. This has been examined with a sensitivity analysis regarding the weights of the evaluation matrix. Various weighting models have been applied, of which three are shown in Figure 3. The achieved scores and the ranking for the three different weighting models presented are shown in Table 3. The model “original” allows for a distinct rating with scores from 193 to 213 points for the seven new HPPs. The model “equal” does not weight the criteria (i.e., each criterion has the same weight). The achieved scores range from 187.5 to 212.5, but many new HPPs have the same score. The model “acceptance” weights criteria higher, when they are considered to be important in public perception. Again, scores are in the range of 187 to 218. As expected, Trift Glacier is now the best-rated reservoir, as it does not affect a protected area, it is invisible from settlement areas and still provides a high annual electricity production.
All models have in common that Aletsch Glacier, Grindelwald Glacier, Roseg Glacier and Trift Glacier are among the top five reservoirs all over Switzerland, followed by Hüfi Glacier, Gorner Glacier and Rhône Glacier. Trift Glacier is the most promising site in the Swiss Alps and appears in the top five for all weighting models. This is another indicator of the reliability of the chosen approach. The new reservoirs include sites that could be used as upper reservoirs for pumped storage HPPs or sites suitable for upgrading existing HPPs, which were not examined further in this project.
In the weighting models “equal” and “acceptance”, Blüemlisalp Glacier, Hohlicht Glacier and Moming Glacier are rated better than Gorner Glacier or Rhône Glacier, respectively. Nevertheless, these potential new HPPs were discarded because the estimated annual electricity is well below 50 GWh and installed capacities are only 5 MW (Blüemlisalp Glacier, Hohlicht Glacier) and 11 W (Moming Glacier). Although no preliminary design study has been carried out for these three reservoirs, they would probably be close to small-scale HPPs and not contribute substantially to the domestic electricity production.
4.2. Challenges
All new HPPs would face several challenges. From a technical point of view, construction and site accessibility will be costly, as all HPPs are located in high-alpine environments. All new HPPs, apart from the reservoir at Trift Glacier, are located within protected areas and strong social opposition must be expected.
At Roseg Glacier, the water naturally flows into the Inn River and later into the Black Sea. The proposed scheme would turbine the water in Poschiavo and release into the Poschiavino River, from where the water would flow into the Adriatic Sea. This would distort the hydrological conditions of the catchment. An alternative would be to turbine the water in Sils, in Upper Engadine, instead of Poschiavo. The installed capacity and annual electricity production would be 25 MW and 75 GWh, respectively, due to the reduced head (i.e., about one third of the Poschiavo variant).
Some potential future HPPs might be endangered by natural hazards. The reservoirs at Aletsch Glacier, Lower Grindelwald Glacier and Trift Glacier are especially prone to impulse wave hazards due to large, steep, unstable slopes and hanging glaciers around the reservoirs. This would require temporary measures, such as real-time monitoring of the potential slides, or permanent interventions, such as dam crest heightening, to keep the required freeboard [28].
Integration of the new HPPs into the already dense hydropower network is a demanding task. The new HPPs at Aletsch Glacier, Gorner Glacier and Rhône Glacier would have significant impacts on the existing HPPs Gebidem, Zmutt (pumping station for Lac des Dix) and Gletsch-Oberwald, respectively. These interactions must be examined in detail in a possible planning stage.
4.3. Other Courses of Action
Previous studies suggested other courses of action to increase electricity production in Switzerland. New machines with improved efficiencies could lead to an annual production increase of 0.6–1.1 TWh [29]. A study by [30] claimed that the pure exchange of hydraulic machinery with better efficiencies would allow for 0.7 TWh of additional electricity production, taking increased environmental flow prescriptions into account. This would, however, only partially cover the deficit imposed by the Swiss Energy Strategy 2050.
The upgrade of existing schemes in combination with the construction of new HPPs could provide up to 4.2 TWh under favorable political and legislative conditions [30]. Extending and upgrading existing schemes could gain 1.3–1.7 TWh, again taking higher environmental flows into account. Estimation of upgrade potential of hydropower in the framework of energy strategy 2050 [31] presented an additional annual potential of 3.2 TWh under improved economic and social conditions, considering new environmental flow regulations. Many dams have sufficient excess bearing capacity to be heightened by 10% of their original height [32]. Existing waterways could be used with minor adaptions only. The heightening of 19 dams would lead to an additional 700 hm3 of storage volume and an additional winter production of 2 TWh. The goals of the Swiss Energy Strategy 2050 could consequently also be reached with these upgrade and heightening projects.
5. Conclusions
Glacier retreat offers new perspectives for hydropower in the periglacial environment, as suitable sites for new reservoirs become ice-free. A methodology has been presented to identify technically feasible sites and to rate them consistently for a subsequent analysis of the hydropower potential of the most promising sites. It was shown that the chosen set of 16 criteria leads to robust results, even if the weights are changed significantly. Nevertheless, the results are affected by various sources of uncertainties, mainly related to climate change evolution, future reservoir operation, subglacial topography and assumptions regarding efficiency, full production hours, etc. Preliminary design studies demonstrated that at least seven new HPPs are needed to cover the deficit of 1.1 TWh, as will be imposed by the Swiss Energy Act until 2035. The most promising site in the Swiss Alps, Trift Glacier, is included in this analysis. It would contribute approximately 13% of the deficit. All sites except Trift Glacier would be located within areas of highest protection, so severe social opposition must be expected. Other challenges, such as the integration into the existing hydropower network and natural hazards, must also be mastered.
The deficit of 1.1 TWh of annual electricity production can be covered by other measures, such as increasing efficiency of existing HPPs or heightening of dams. Although some studies provide estimates of these upgrade potentials, future research should also focus on this course of action, as dam heightening may be implemented easier than the construction of new HPPs.
One main prerequisite to ensure a sustainable use of new HPPs is to control reservoir sedimentation and to support sediment continuity. Both criteria weights sum up to 17% in the proposed evaluation matrix, so the site rating significantly depends on the handling of the sediment fluxes. Experience shows that many projects failed to account for reservoir sedimentation and sediment continuity in the planning stage, which eventually compromised reservoir use. Storage HPPs with large capacity-inflow-ratios offer the greatest resilience to climate change, as [33] demonstrated, but an appropriate sediment management is imperative to conserve storage and ensure reliable energy production. In this study, empirical relationships were applied to tackle this problem. However, observed infill times of Swiss periglacial reservoirs range significantly, covering orders of magnitude. This large range cannot be represented by empirical relationships. Therefore, an adequate numerical model, as developed by [34], should be used to predict long-term and large-scale sediment fluxes and deposition processes in periglacial reservoirs.
Author Contributions
The hydropower potential analysis and writing of the manuscript was performed by D.E. under the supervision of L.S., D.F.V. and R.M.B.
Funding
This research was funded by the Swiss National Science Foundation (SNSF) within the National Research Programme NRP 70 “Energy Turnaround”, Project No. 153927.
Acknowledgments
The project was financially supported by the Swiss National Science Foundation (SNSF) within the National Research Programme NRP 70 “Energy Turnaround”, Project No. 153927. It is under the umbrella of the Swiss Competence Center for Energy Research—Supply of Electricity (SCCER-SoE). The valuable inputs of Florent Gauye, Melanie Helfenberger, Reshma Kannanmannil, Sebastian Klar, Federico Sartori and Jonas Wydler as well as of Valeria Hutter and Romina Rulli in the framework of their student project and Master theses, respectively, at the chair of hydraulic engineering of ETH Zurich is gratefully acknowledged. The article fees to publish in open access were covered by the ETH Zurich library.
Conflicts of Interest
The authors declare no conflict of interest.
References
- Schweizerische Elektrizitätsstatistik 2016 (‘Swiss Electricity Statistics 2016’). Swiss Federal Office of Energy (SFOE), 2017. Available online: http://www.bfe.admin.ch/php/modules/publikationen/stream.php?extlang=de&name=de_306571764.pdf&endung=Schweizerische%20Elektrizit%E4tsstatistik%202016 (accessed on 28 March 2018).
- Energiegesetz (‘Energy Act’). Swiss Confederation. Available online: https://www.admin.ch/opc/de/classified-compilation/20121295/201801010000/730.0.pdf (accessed on 28 March 2018).
- Climate Change 2013: The Physical Science Basis. Intergovernmental Panel on Climate Change (IPCC), 2013. Available online: http://www.climatechange2013.org/images/report/WG1AR5_ALL_FINAL.pdf (accessed on 28 March 2018).
- Brennpunkt Klima Schweiz. Grundlagen, Folgen und Perspektiven. (‘Focus Climate Switzerland. Basics, Consequences and Perspectives’). Swiss Academy of Sciences, 2016. Available online: http://www.naturalsciences.ch/uuid/289496e5-c703-5917-ad42-1abd05b8fe36?r=20161005181841_1484061355_0d8762b6-48e9-5186-a15e-a89c7ed607ff (accessed on 28 March 2018).
- Farinotti, D.; Usselmann, S.; Huss, M.; Bauder, A.; Funk, M. Runoff evolution in the Swiss Alps: Projections for selected high-alpine catchments based on ENSEMBLES scenarios. Hydrol. Process. 2012, 26, 1909–1924. [Google Scholar] [CrossRef]
- Addor, N.; Rössler, O.; Köplin, N.; Huss, M.; Weingartner, R.; Seibert, J. Robust changes and sources of uncertainty in the projected hydrological regimes of Swiss catchments. Water Resour. Res. 2014, 50, 7541–7562. [Google Scholar] [CrossRef] [Green Version]
- Huss, M.; Zemp, M.; Jörg, P.C.; Salzmann, N. High uncertainty in 21st century runoff projections from glacierized basins. J. Hydrol. 2014, 510, 35–48. [Google Scholar] [CrossRef] [Green Version]
- Schaefli, B.; Hingray, B.; Musy, A. Climate change and hydropower production in the Swiss Alps: Quantification of potential impacts and related modelling uncertainties. Hydrol. Earth Syst. Sci. Discuss. 2007, 11, 1191–1205. [Google Scholar] [CrossRef]
- Westaway, R. Modelling the potential effects of climate change on the Grande Dixence hydro-electricity scheme, Switzerland. Water Environ. J. 2000, 14, 179–185. [Google Scholar] [CrossRef]
- Micheletti, N.; Lane, S.N. Water yield and sediment export in small, partially glaciated Alpine watersheds in a warming climate. Water Resour. Res. 2016, 52, 4924–4943. [Google Scholar] [CrossRef]
- Haeberli, W.; Schleiss, A.; Linsbauer, A.; Künzler, M.; Bütler, M. Gletscherschwund und neue Seen in den Schweizer Alpen (‘Glacier retreat and new lakes in the Swiss Alps’). Wasser Energie Luft 2012, 104, 93–102. Available online: https://infoscience.epfl.ch/record/178376/files/2012-846_Haeberli_Schleiss_Linsbauer_K%C3%BCnzler_B%C3%BCtler_Gletscherschwund_und_neue_Seen_in_de_Schweizer_Alpen.pdf (accessed on 28 March 2018).
- Haeberli, W.; Bütler, M.; Huggel, C.; Schleiss, A. Neue Seen als Folge des Gletscherschwundes im Hochgebirge: Chancen und Risiken (‘New Lakes as a Consequence of Glacier Retreat in High Mountains: Chances and Risks’); National Research Programme NRP 61 “Sustainable Water Management”. 2013. Available online: https://infoscience.epfl.ch/record/197261/files/2013-911_Haeberli_Butler_Huggel_Muller_Schleiss_3534_Neue-Seen-als-Folge-des-Gletscherschwundes-im-Hochgebirge_OA.pdf (accessed on 28 March 2018).
- Linsbauer, A.; Paul, F.; Haeberli, W. Modeling glacier thickness distribution and bed topography over entire mountain ranges with GlabTop: Application of a fast and robust approach. J. Geophys. Res. Earth Surf. 2012, 117. [Google Scholar] [CrossRef] [Green Version]
- Huss, M.; Hock, R. A new model for global glacier change and sea-level rise. Front. Earth Sci. 2015, 3. [Google Scholar] [CrossRef]
- Farinotti, D.; Pistocchi, A.; Huss, M. From dwindling ice to headwater lakes: Could dams replace glaciers in the European Alps? Environ. Res. Lett. 2016, 11. [Google Scholar] [CrossRef]
- International Electrotechnical Commission (IEC). Hydraulic Turbines—Testing of Control Systems; IEC: Geneva, Switzerland, 2005; Volume IEC 60308:2005. [Google Scholar]
- Gurnell, A.; Hannah, D.; Lawler, D. Suspended sediment yield from glacier basins. In Erosion and Sediment Yield: Global and Regional Perspectives; Walling, D.E., Webb, B., Eds.; International Association of Hydrological Sciences (IAHS): Exeter, UK, 1996; pp. 97–104. ISBN 978-0-947571-89-4. [Google Scholar]
- Jenzer Althaus, J.M.I. Sediment Evacuation from Reservoirs through Intakes by Jet Induced Flow. Ph.D. Thesis, École Polytechnique Fédérale de Lausanne (EPFL), Lausanne, Switzerland, 2011. Available online: https://infoscience.epfl.ch/record/154766/files/EPFL_TH4927.pdf (accessed on 28 March 2018).
- Brune, G.M. Trap efficiency of reservoirs. Trans. Am. Geophys. Union 1953, 34, 407–418. [Google Scholar] [CrossRef]
- Jenzer Althaus, J.; De Cesare, G. Möglichkeiten und Anwendung einer Datenbank bezüglich der Stauraumverlandung von alpinen Speichern (‘Opportunities and application of a database on sedimentation of Alpine reservoirs’). Wasser Energie Luft 2006, 98, 202–206. Available online: https://infoscience.epfl.ch/record/103652/files/206-509_Jenzer_DeCesare_Alpreserv_Datenbank_wel.pdf?version=1 (accessed on 28 March 2018).
- Swiss Society of Engineers and Architects (SIA). Actions on Structures. Available online: http://iisee.kenken.go.jp/worldlist/50_Switzerland/50_Switzerland_Code.pdf (accessed on 28 March 2018).
- Rickli, C.; Bebi, P.; Graf, F.; Moos, C. Shallow landslides: Retrospective analysis of the protective effects of forest and conclusions for prediction. In Recent Advances in Geotechnical Research; Wu, W., Ed.; Springer: Cham, Switzerland, 2019; ISBN 978-3-319-89671-7. [Google Scholar]
- Boes, R.; Perzlmaier, S.; Schönlaub, H.; Linser, M.; Hofer, B. Flood retention by storage reservoirs and alpine water intakes. In Proceedings of the ICOLD Symposium “Operation, Rehabilitation and Upgrading of Dams”, Sofia, Bulgaria, 2–6 June 2008; pp. 1–20. [Google Scholar]
- Michalec, B. Evaluation of an empirical reservoir shape function to define sediment distributions in small reservoirs. Water 2015, 7, 4409–4426. [Google Scholar] [CrossRef]
- Bundesgesetz über den Schutz der Gewässer (‘Federal Act on the Protection of Waters’). Swiss Confederation. Available online: https://www.admin.ch/opc/de/classified-compilation/19910022/201701010000/814.20.pdf (accessed on 28 March 2018).
- Faktenblatt BLN—Das Bundesinventar der Landschaften und Naturdenkmäler (BLN) (‘Factsheet BLN—The Federal Inventory of Landscapes and Natural Monuments of National Importance’). 2017. Available online: https://tinyurl.com/ya8mgaa7 (accessed on 28 March 2018).
- Digital Elevation Model SwissALTI3D of Switzerland. Available online: https://shop.swisstopo.admin.ch/en/products/height_models/alti3D (accessed on 28 March 2018).
- Evers, F.M.; Schmocker, L.; Fuchs, H.; Schwegler, B.; Fankhauser, A.U.; Boes, R.M. Landslide generated impulse waves: Assessment and mitigation of hydraulic hazards. In Proceedings of the 26th ICOLD Congress, Vienna, Austria, 1–7 July 2018; pp. 679–694. [Google Scholar]
- Laufer, F.; Grötzinger, S.; Peter, M.; Schmutz, A. Ausbaupotential der Wasserkraft (‘Development Potential of Hydropower’). 2004. Available online: https://www.newsd.admin.ch/newsd/message/attachments/2663.pdf (accessed on 28 March 2018).
- Boes, R.M. Potenziale und Grenzen der Wasserkraft—Was bringen Anlagenoptimierungen? (‘Potential and limits of hydropower—What can be gained from optimization of schemes?’). Natur und Mensch, Sonderheft Quo Vadis Wasserkraft 2011, 53, 24–28. [Google Scholar]
- BFE. Wasserkraftpotential der Schweiz. Abschätzung des Ausbaupotenzials der Wasserkraftnutzung im Rahmen der Energiestrategie 2050 (‘Hydropower Potential in Switzerland. Estimation of Upgrade Potential of Hydropower in the Framework of Energy Strategy 2050’). 2012. Available online: http://www.news.admin.ch/NSBSubscriber/message/attachments/27057.pdf (accessed on 28 March 2018).
- Schleiss, A. Talsperrenerhöhungen in der Schweiz: Energiewirtschaftliche Bedeutung und Randbedingungen (‘Dam heightenings in Switzerland: Economical importance and boundary conditions’). Wasser Energie Luft 2012, 104, 199–203. Available online: https://infoscience.epfl.ch/record/181591/files/2012-881_Schleiss_Talsperrenerhohungen_in_der_Schweiz.pdf (accessed on 28 March 2018).
- Annandale, G.W. Policy considerations for sustainable hydropower: Reliability, climate change and sedimentation. In Proceedings of the HYDRO 2015, Bordeaux, France, 26–28 October 2015. [Google Scholar]
- Ehrbar, D. Hydropower Potential and Reservoir Sedimentation in the Periglacial Environment under Climate Change. Ph.D. Thesis, ETH Zurich, Zurich, Switzerland, 2018. [Google Scholar]
Figure 1.
New lake at the tongue of Trift Glacier on 30 June, 2004 (left) and 3 July 2014 (right), illustrating the fast glacier retreat encountered in the Swiss periglacial environment (Image courtesy: VAW, ETH Zurich).
Figure 1.
New lake at the tongue of Trift Glacier on 30 June, 2004 (left) and 3 July 2014 (right), illustrating the fast glacier retreat encountered in the Swiss periglacial environment (Image courtesy: VAW, ETH Zurich).

Figure 2.
Location of the seven best-rated new HPPs in the Swiss periglacial environment.

Figure 3.
Three different weighting models for the sensitivity analysis of the evaluation matrix.


Table 1.
Evaluation matrix applied to rate potential hydropower plants (HPPs) with quantitative boundaries for the criterion rating (1, 2, or 3 points) and corresponding criterion weights.
Table 1.
Evaluation matrix applied to rate potential hydropower plants (HPPs) with quantitative boundaries for the criterion rating (1, 2, or 3 points) and corresponding criterion weights.
| Criterion | 1 Point If… | 2 Points If… | 3 Points If… | Weight |
|---|---|---|---|---|
| ECONOMY | 60% | |||
| installed capacity | <10 MW | 10–20 MW | >20 MW | 10% |
| electricity production | <50 GWh/year | 50–100 GWh/year | >100 GWh/year | 10% |
| investment costs | high | medium | low | 11% |
| runoff evolution | reduction > 25% | reduction < 25% | increase | 3% |
| reservoir sedimentation | infill time < 100 years | infill time 100–1000 years | infill time > 1000 years | 7% |
| earthquake vulnerability | Zone 3 (a and b) | Zone 2 | Zone 1 | 3% |
| impulse wave vulnerability | most slopes 30–45° | few slopes 30–45° | no slopes 30–45° | 3% |
| flood protection | daily storage | monthly storage | seasonal storage | 3% |
| flexibility and storage capacity | run-of-river HPP | storage HPP | pumped storage HPP | 10% |
| ENVIRONMENT | 25% | |||
| visibility from settlements | visible | not visible | use of natural lake | 3% |
| environmental flow | natural river | impaired river | artificial river | 7% |
| sediment continuity | trap efficiency > 90% | trap efficiency 50–90% | trap efficiency < 50% | 10% |
| hydro- and thermo-peaking | release into river | release into lake | pumped storage HPP | 5% |
| SOCIETY | 15% | |||
| degree of protection | high (BLN) | low (Emerald and others) | no protection | 7% |
| land use | settlement areas | agricultural area or forest | unproductive area | 5% |
| tourism | negative impacts | negligible impacts | positive impacts | 3% |
BLN: Bundesinventar der Landschaften und Naturdenkmäler.
Table 2.
Best-rated new HPPs in the periglacial environment of Switzerland ( = annual runoff volume; = reservoir volume; = full supply level; = gross head; = installed capacity; = annual electricity production; and = energy equivalent of the reservoir).
Table 2.
Best-rated new HPPs in the periglacial environment of Switzerland ( = annual runoff volume; = reservoir volume; = full supply level; = gross head; = installed capacity; = annual electricity production; and = energy equivalent of the reservoir).
| Reservoir Location | |||||||
|---|---|---|---|---|---|---|---|
| Aletsch Glacier | 309 | 181 | 1880 | 435 | 73 | 218 | 396 |
| Gorner Glacier | 199 | 168 | 2300 | 650 | 78 | 235 | 199 |
| Grindelwald Glacier | 94 | 71 | 1520 | 520 | 28 | 85 | 64 |
| Hüfi Glacier | 44 | 36 | 1780 | 1260 | 35 | 105 | 86 |
| Rhône Glacier | 56 | 46 | 2300 | 550 | 19 | 57 | 75 |
| Roseg Glacier | 96 | 78 | 2260 | 1260 | 77 | 231 | 261 |
| Trift Glacier 1 | 154 | 85 | 1776 | 446 | 80 | 145 | 215 |
| Total | 390 | 1076 | 1296 |
1 Data provided by future operator Kraftwerke Oberhasli AG (KWO).
Table 3.
Ranking and scores of best-rated potential future HPPs.
| Weighting Model “Original” | Weighting Model “Equal” | Weighting Model “Acceptance” | ||||||
|---|---|---|---|---|---|---|---|---|
| Rank | Glacier | Score | Rank | Glacier | Score | Rank | Glacier | Score |
| 1 | Grindelwald | 213 | 1 | Grindelwald | 212.5 | 1 | Allalin * | 218 |
| 2 | Allalin * | 212 | Allalin * | 212.5 | 2 | Trift | 211 | |
| 3 | Aletsch | 211 | 3 | Trift | 206.25 | 3 | Grindelwald | 210 |
| 4 | Trift | 210 | Roseg | 206.25 | 4 | Roseg | 207 | |
| 5 | Oberaletsch * | 209 | Oberaletsch * | 206.25 | 5 | Palü ° | 204 | |
| 6 | Roseg | 206 | Schwarzberg ° | 206.25 | 6 | Corbassière * | 202 | |
| 7 | Turtmann ° | 205 | Gauli ° | 206.25 | Mellich * | 202 | ||
| 8 | Gorner | 204 | 8 | Aletsch | 200 | Schwarzberg ° | 202 | |
| 9 | Rhône | 201 | Corbassière * | 200 | 9 | Blüemlisalp | 200 | |
| Schwarzberg ° | 201 | Turtmann ° | 200 | 10 | Turtmann ° | 199 | ||
| 11 | Corbassière * | 200 | Palü ° | 200 | 11 | Aletsch | 198 | |
| 12 | Gauli ° | 197 | 12 | Hüfi | 193.75 | 12 | Hohlicht | 195 |
| 13 | Palü ° | 195 | 13 | Rhône | 193.75 | 13 | Gorner | 192 |
| 14 | Hüfi | 192 | 14 | Blüemlisalp | 193.75 | Oberaletsch * | 192 | |
| 15 | Fiescher ° | 190 | 15 | Theodul ° | 193.75 | 15 | Gauli ° | 191 |
| 16 | Mellich * | 189 | 16 | Gorner | 187.5 | 16 | Plaine Morte * | 191 |
| Tsanfleuron | 189 | 17 | Mellich * | 187.5 | 17 | Hüfi | 190 | |
| 18 | Findel | 188 | 18 | Tsanfleuron | 187.5 | Theodul ° | 190 | |
| Blüemlisalp | 188 | 19 | Otemma | 187.5 | Moming | 190 | ||
| 20 | Theodul ° | 187 | 20 | Silvretta | 187.5 | 20 | Rhône | 187 |
Sites marked with * do not yet have fully ice-free dam locations; sites marked with ° are close to existing HPPs and could be used as upper reservoirs for pumped storage (i.e., combined with an upgrade of the existing infrastructure); both were therefore neglected in Table 2.
© 2018 by the authors. Licensee MDPI, Basel, Switzerland. This article is an open access article distributed under the terms and conditions of the Creative Commons Attribution (CC BY) license (http://creativecommons.org/licenses/by/4.0/).
Share and Cite
MDPI and ACS Style
Ehrbar, D.; Schmocker, L.; Vetsch, D.F.; Boes, R.M. Hydropower Potential in the Periglacial Environment of Switzerland under Climate Change. Sustainability 2018, 10, 2794. https://doi.org/10.3390/su10082794
AMA Style
Ehrbar D, Schmocker L, Vetsch DF, Boes RM. Hydropower Potential in the Periglacial Environment of Switzerland under Climate Change. Sustainability. 2018; 10(8):2794. https://doi.org/10.3390/su10082794
Chicago/Turabian StyleEhrbar, Daniel, Lukas Schmocker, David F. Vetsch, and Robert M. Boes. 2018. "Hydropower Potential in the Periglacial Environment of Switzerland under Climate Change" Sustainability 10, no. 8: 2794. https://doi.org/10.3390/su10082794
Note that from the first issue of 2016, this journal uses article numbers instead of page numbers. See further details here.