Assessing the Runoff Reduction Potential of Highway Swales and WinSLAMM as a Predictive Tool


Department of Civil and Environmental Engineering, The University of Tennessee, Knoxville, TN 37996, USA
*
Author to whom correspondence should be addressed.
Sustainability 2018, 10(8), 2871; https://doi.org/10.3390/su10082871
Submission received: 21 June 2018
/
Revised: 27 July 2018
/
Accepted: 8 August 2018
/
Published: 13 August 2018
(This article belongs to the Special Issue Green Stormwater Infrastructure for Sustainable Urban and Rural Development)
Abstract
:Across the United States, the impacts of stormwater runoff are being managed through the National Pollutant Discharge Elimination System (NPDES) in an effort to restore and/or maintain the quality of surface waters. State transportation authorities fall within this regulatory framework, being tasked with managing runoff leaving their impervious surfaces. Opportunely, the highway environment also has substantial amounts of green space that may be leveraged for this purpose. However, there are questions as to how much runoff reduction is provided by these spaces, a question that may have a dramatic impact on stormwater management strategies across the country. A highway median swale, located on Asheville Highway, Knoxville, Tennessee, was monitored for hydrology over an 11-month period. The total catchment was 0.64 ha, with 0.26 ha of roadway draining to 0.38 ha of a vegetated median. The results of this study indicated that 87.2% of runoff volume was sequestered by the swale. The Source Loading and Management Model for Windows (WinSLAMM) was used to model the swale runoff reduction performance to determine how well this model may perform in such an application. To calibrate the model, adjustments were made to measured on-site infiltration rates, which was identified as a sensitive parameter in the model that also had substantial measurement uncertainty in the field. The calibrated model performed reasonably with a Nash Sutcliffe Efficiency of 0.46. WinSLAMM proved to be a beneficial resource to assess green space performance; however, the sensitivity of the infiltration parameter suggests that field measurements of this characteristic may be needed to achieve accurate results.
1. Introduction
Increases in imperviousness lead to higher peak flow rates and total runoff volume from watersheds [1], with detrimental effects to stream stability and ecology. One notable source of imperviousness in watersheds is the transportation system. State highway systems are required to operate under municipal separate storm sewer system (MS4) requirements since large amounts of stormwater runoff are transferred from roads to surface waters, carrying with it a range of pollutants associated with vehicle tires, brakes, engine wear, and lubricating fluids [2]. Increasingly, stormwater management techniques have shifted toward green infrastructure applications where runoff reduction is the targeted outcome and ultimately leads to decreased pollutant export.
To achieve post-construction stormwater goals, state transportation authorities are in need of Stormwater Control Measures (SCMs) that can both achieve stormwater management goals and are applicable to the highway environment. Although originally designed primarily as a stormwater conveyance, studies suggest that the vegetated (grassed) swale is one SCM that may have these desired characteristics. Grass swales convey water, yet simultaneously promote infiltration and decreased stormwater velocity [3]. Volume reduction is achieved due to this infiltration, occurring both laterally over the swale side slope and longitudinally along the swale pathway, and through storage in soil pore space (Weiss et al., 2010).
Although a number of field studies have examined the water quality performance of swales, far fewer studies have quantified hydrologic benefits. One example is Lucke et al. [4], which observed the responses of four field swales handling 24 standardized synthetic runoff events. This study found that the swales performed well at attenuating flow, with a mean total flow reduction of 52% in 30 m long swales and a peak flow reduction of 61%. Other authors have reported volume reduction ranging from 30 to 50% and peak flow reductions between 10 and 20% [5,6,7,8].
Parameters impacting volume reduction include the duration and depth of rain events and the available storage and length of the swale [5]. During small storm events, complete or high runoff volume reduction is possible; but, during large storm events, soil saturation causes volume reduction to be small and at times, negligible [5,8]. Multiple studies have confirmed this occurrence and suggested the utility of these systems for capturing small events. For instance, Davis et al. [5] defined a complete capture depth for swales ranging from 0.4 to 2.2 cm, with a study from Kaighn and Yu [9] also falling within this range for two 30 m swales (0.5 to 0.7 cm). Yu et al. [10] showed a slightly higher complete capture depth of 1.27 cm for a 274.5 m swale with two check dams. Some of this variability is likely attributed to differences in soil composition, most notably soil infiltration, amongst the sites.
Ahmed et al. [11] took a total of 722 infiltration measurements across six grassed swales and showed high variability in infiltration rates (0.75–15.5 cm/h). High variability in infiltration rates was even apparent in measurements across individual swales, with uncertainties in the geometric mean as high as a factor of 4–7 when a small number of measurements are made at a site (five spatially distributed readings). Studies such as Garcia-Serrana et al. [12] have verified the influence of infiltration rate in controlled field studies of highway sideslope hydrologic function, and field analyses such as Winston et al. [13] show that poorer volume reduction performance can be observed (relative to other studies) for swales constructed in poorly infiltrating soils.
Source Loading and Management Model for Windows (WinSLAMM) was developed to model and analyze stormwater management projects of varying scale, accounting for landscape attributes such as soil infiltration rate [14]. WinSLAMM is an empirical model that is unique in its ability to determine the runoff volume and pollution loading for every source area within a land use for each rainfall event [15]. The analysis accounts for the land use variability and site characteristics, predicts runoff volumes, and evaluates stormwater control effectiveness. After being developed in the mid-1970s, the model started being used in state water quality regulatory agencies in the mid-1980s (Wisconsin Department of Natural Resources for instance). Studies such as Borris et al. [16] and Hurley and Forman [17] have utilized the model to predict the influence of various management and future socio-environmental conditions on urban water systems. Although a common model in the stormwater management field for nearly 40 years, few studies have been performed in literature to assess the performance of this model for SCMs in comparison to field collected data, and no such study was found which focused on grassed swales.
Despite the number of studies performed on vegetated swales, there are still gaps in knowledge regarding their performance. In particular, this is the case for volume reduction, where the influence of local conditions (such as infiltration rate) have been shown in literature, necessitating studies across a range of landscapes. Further, the ability for a common stormwater management analysis tool, WinSLAMM, to predict swale volume reduction is largely unknown. The objectives of this study include: (1) evaluating swale performance for volume reduction; and (2) model the swale in WinSLAMM to determine its ability to provide accurate volume reduction estimates.
2. Materials and Methods
2.1. Study Area
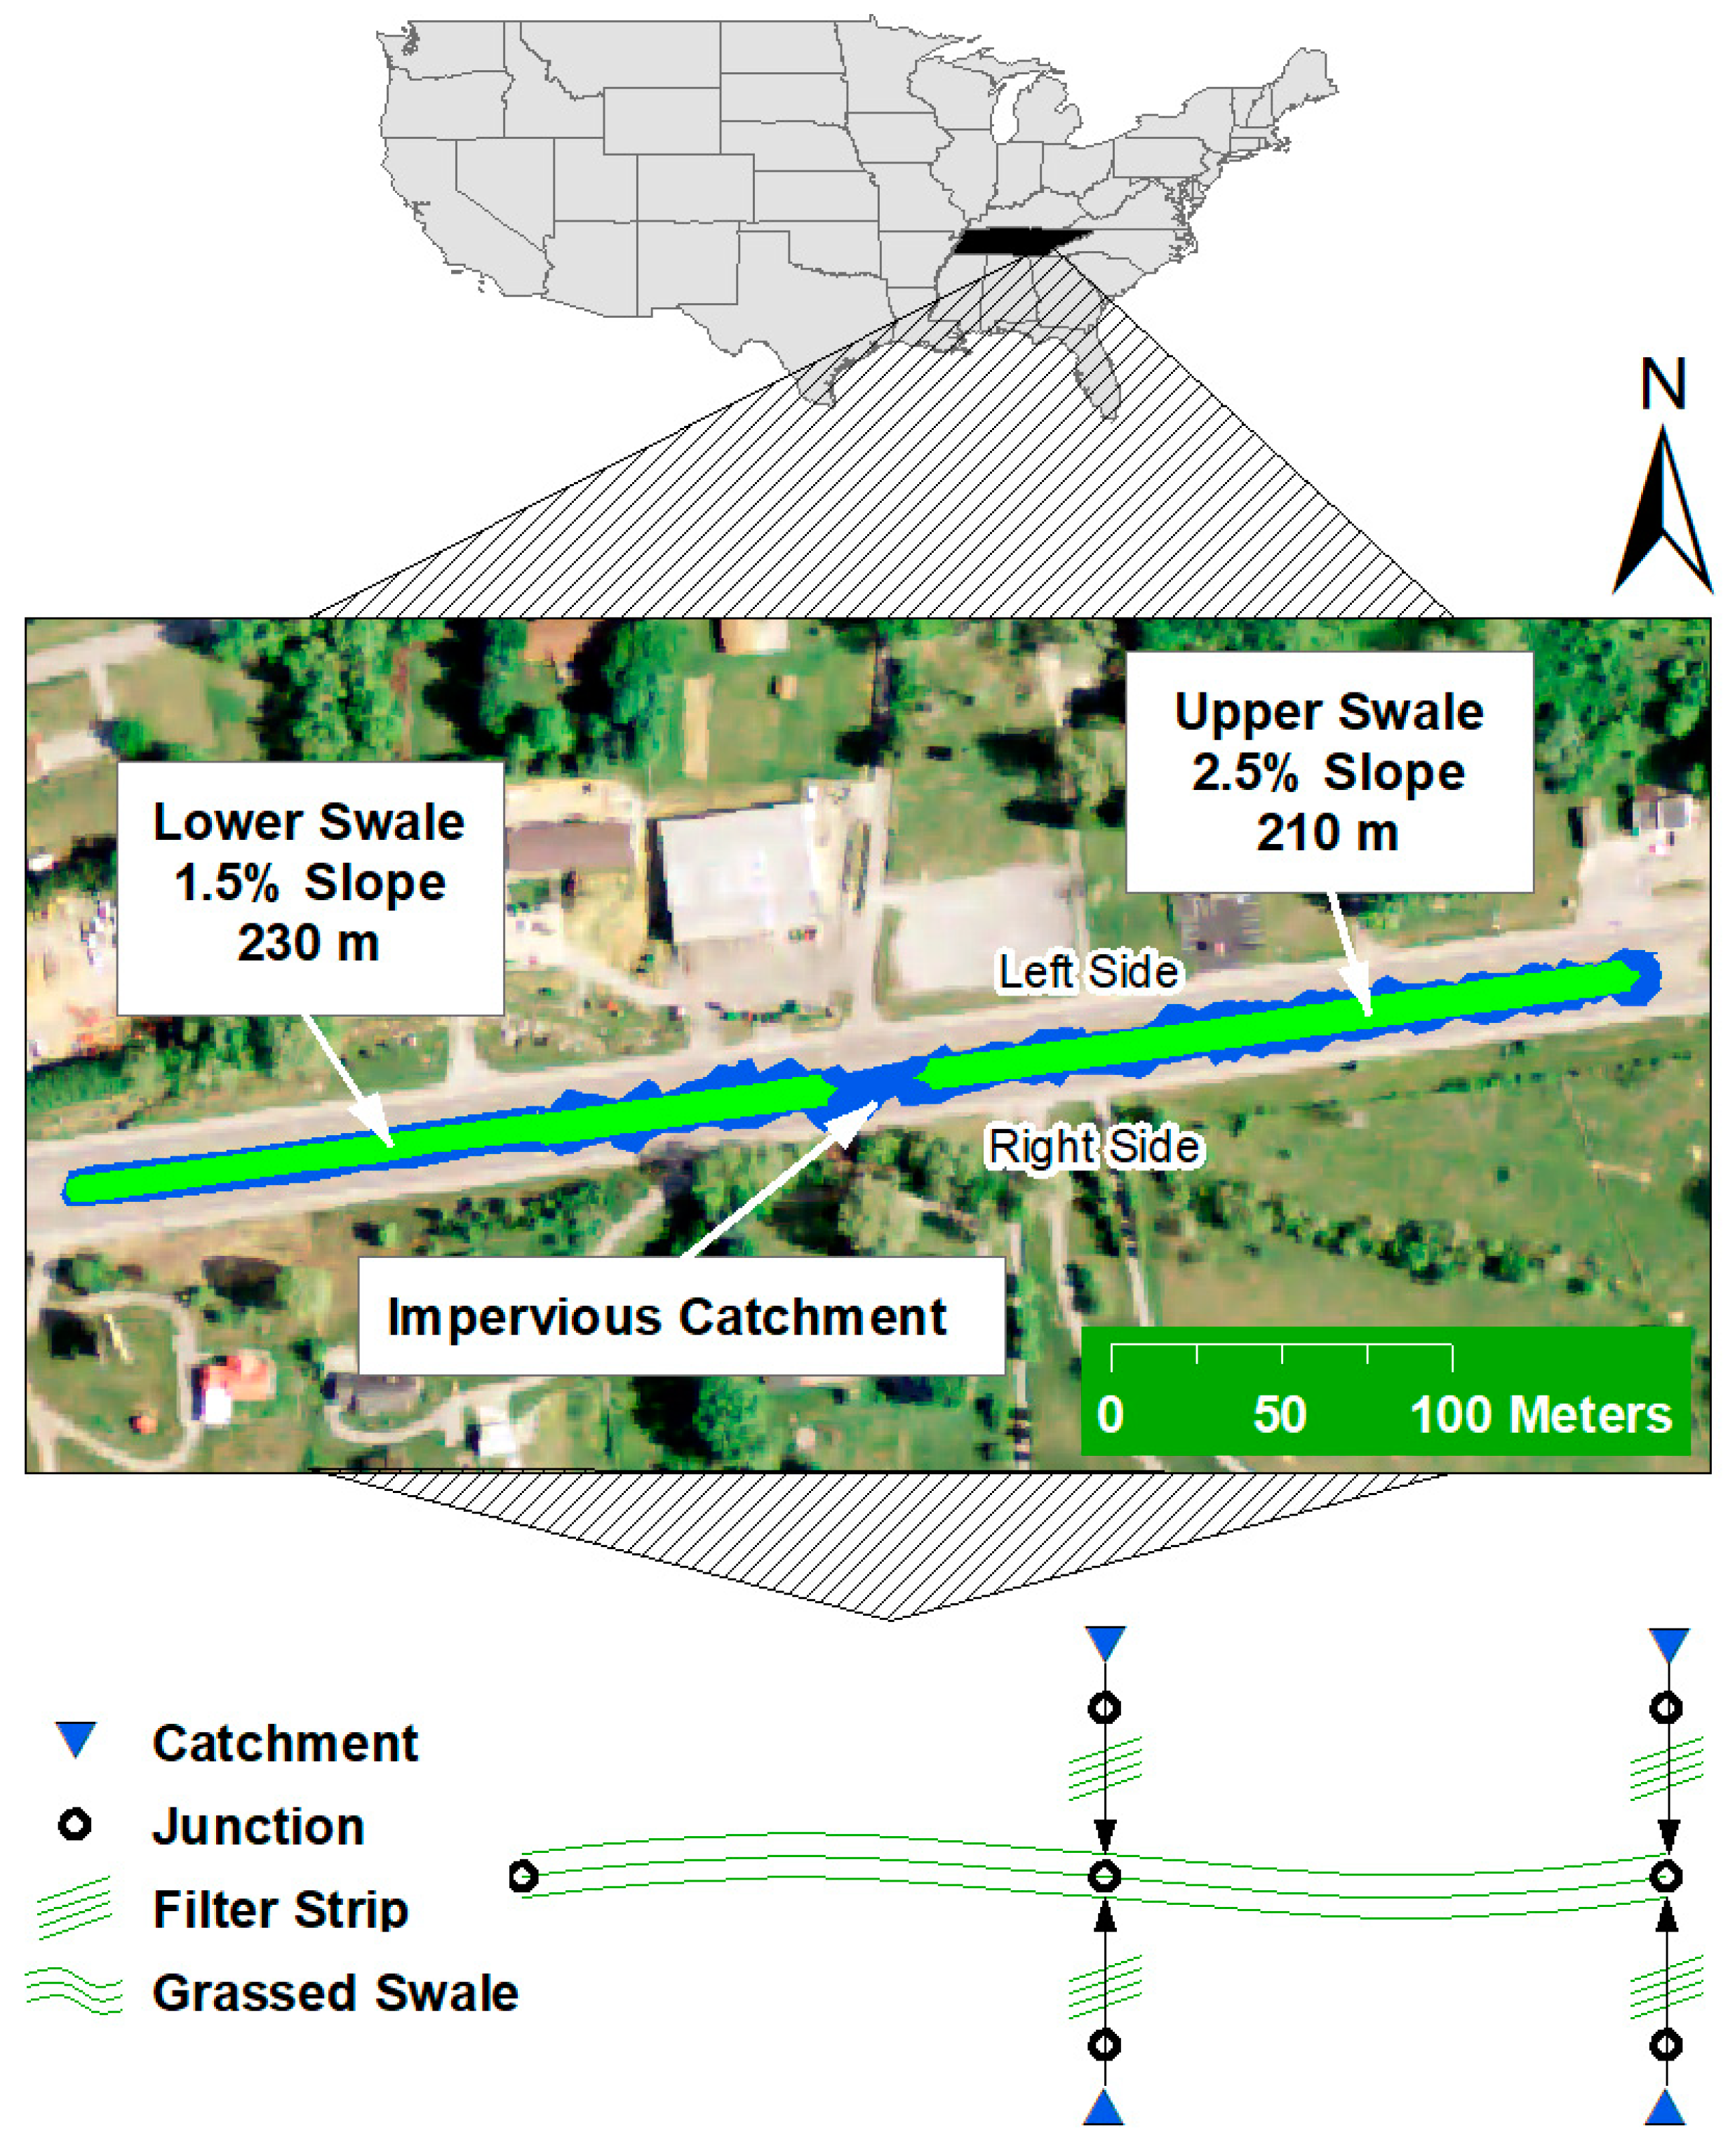
The project site is in Knoxville, TN, in the median of Asheville Highway located near the intersection of Lecil Road (Figure 1). Asheville Highway is a four-lane divided highway with an average annual daily traffic of approximately 27,378 vehicles [18]. Stormwater is drained via two swales connected in series by a pipe for a total of 440 m. The longitudinal slope of the upper swale is 2.5% over a length of 210 m while the longitudinal slope of the lower swale is 1.5% over 230 m. The total catchment area is 0.64 ha, with 0.38 ha of pervious area (including the swale) and 0.26 ha of impervious area, making the contributing area 41% impervious and 59% pervious. The pervious area is made up of loam and silt loam soils [19]. According to the Tennessee Department of Transportation (TDOT) Standard RD01-S-11A, sod ditches are seeded with vegetal retardance classification “C” and are scarified prior to seeding [20,21].
2.2. Swale Outflow Monitoring
Monitoring equipment was installed during the summer of 2016. A 45.75 cm TRACOM fiberglass H-flume was installed at the downslope end of the swale immediately prior to discharge into a storm drain outfall. The presence of the outfall (a drop inlet style structure) allowed free discharge from the flume. Concrete was used to secure the flume approach to prevent flow under the device. Wingwalls were constructed to direct the flow into the flume and to prevent flow from traveling around the sides. An ISCO 6712 equipped with a 730 Bubbler Flow Module was utilized to collect stage data every minute which was converted to flow via standard equations. An ISCO 674 rain gauge was installed on site and connected to an ISCO 4230 flow meter for data collection. The rain data was recorded every 5 min.
2.3. Runoff Estimations
Runoff entered the grassed swale via sheet flow, negating the ability to explicitly monitor inflow. Thus, runoff was estimated following a similar approach to that of Brown and Hunt [22], whereby an initial abstraction of 1.3 mm is assumed (i.e., a curve number of 98) for the impervious area and the remainder of the rainfall produces runoff [23]. The pervious areas of the catchment were all associated with the swale and its sideslopes (i.e., filter strip). The total amount of rainfall that fell on these areas was considered in the runoff volume calculation. To calculate the total runoff volume, the impervious and pervious rainfall volumes were added together. Runoff reduction was calculated per Equation (1):
2.4. Modeling
WinSLAMM was selected to model the vegetated swale due to its established usage by regulatory agencies, desire to further test its capabilities, and usage in literature [16,17]. For this study, stormwater volume was the focus, being modeled, calibrated, and analyzed for performance using collected site data. Hourly rainfall depths, the finest resolution the model allows, were aggregated from the rain gage data at the site and used to populate the rainfall parameter file. Antecedent moisture content was calculated by the model based on the rainfall file. Other parameter files remained as model suggested values based on the site’s location in the southeastern United States.
For the catchment rainfall-runoff modeling, the highway was described in the model as freeway draining to pervious area. The freeway length and average daily traffic were input. All greenspace in the catchment was labeled as a pervious highway traffic urban area. Because runoff entered the greenspace as sheet flow, volume monitoring was not possible at the edge of the pavement, making calibration of these parameters impossible.
To model the swale in WinSLAMM, the contributing area was divided into four catchments. The site was divided between the upper and lower swales and subdivided into northern and southern sections (one on each side of the road). The catchment areas were determined by processing a 1-meter resolution digital elevation model in ArcGIS (Figure 1). Land use calculations were then made. Each catchment was made up of a freeway area (the roadway) and a large turf area (the median). The large turf area consisted of the sideslope/filter strip and the grass swale. To distinguish between the filter strip and swale, the area inundated by the static volume of a five-year frequency storm with a duration of 24 h (not considering slope) was used as the boundary condition. This method produced a depth of 0.21 m in the trapezoidal median, filling the trapezoid to a top width of 3.35 m. The associated area was taken as the extent of the swale, while the remaining area was assumed to represent the filter strip. This depth was found to be conservative (larger) than the depth of flow predicted by the mannings equation for a 10-year, 24-h storm (as estimated from the rational equation), the 10-year storm being the design criteria for TDOT. The characteristics for each control, measured or from literature, were input into WinSLAMM (Table 1). The swale and filter strip lengths, longitudinal slopes, and the swale side slopes were determined using measurement tools within ArcGIS applied to a digital elevation model. The bottom width, grass height, and grass type were determined based on field measurements.
Due to the filter strips’ steep slope (12 to 17%), WinSLAMM automatically removes 3 m from their length per standard procedure (performed when slopes are >5%: PV & Associates, 2015). For the Asheville Highway site, this is the entire length of the filter strips which were measured as having lengths from 2.1 to 3 m. Thus, the lack of filter strip representation in the model as a control practice is likely a source of some error. It should be noted that the filter strip still was included in the runoff model as a pervious land use. Thus, Table 1 focuses on the attributes of the grassed swales.
2.5. Infiltration Measurements
Infiltration rates were determined by conducting field tests using double-ring infiltrometers (DRI) on the northern filter strip, southern filter strip, and grass swale [24]. Graphs of the results from the DRI tests were used to determine the point at which the infiltration rates reached an equilibrium. Field tests were performed in triplicate for each grassed swale and filter strip on two occasions (a total of six readings at each location—Table 2). WinSLAMM requires dynamic infiltration rate as an input, which is equivalent to the measured static infiltration rates divided by two [25]. High variability was noted for the site as has been shown in other studies of highway green space. The infiltration rates of the side slopes varied from those at the center of the swale, and the measured infiltration rates were higher than WinSLAMM’s defined infiltration rates for loam and silt loam soil types (the predominate soil type in the surrounding area). Ahmed et al. [11] obtained similar results from a roadside swale study. Large differences were observed between the geometric mean infiltration rate of the side slopes and that of the center of the swale. Ahmed et al. [11] also observed that soil texture class did not have a statistically significant effect on the mean field-saturated hydraulic conductivity of a swale, which supports the observation of higher measured infiltration rates than implied by the soil type. It should be noted that soil type is a typical input to WinSLAMM from which infiltration rate is estimated.
3. Results and Discussion
3.1. Data Summary
Data was collected for 11 months from 18 August 2016 until 18 July 2017, with 65 rainfall events monitored. The events ranged from a minimum rainfall of 2.8 mm to a maximum rainfall of 138.9 mm (see Figure 2). The rainfall events were distributed over the four seasons with the most (40%) occurring during spring and the least (6%) occurring during autumn when abnormally low rainfall totals occurred. The other two seasons, summer and winter, constituted 32% and 22% of events, respectively.
3.2. Hydrology Results
Rainfall-outflow data was plotted and resulted in a linear relationship with a correlation coefficient of 0.8 (Figure 2a). Two potential outliers in the data lacked agreement with the rainfall-outflow pattern. These were the largest two events monitored, a 139-mm storm showed substantially less outflow than expected (119 m3), while the 98-mm storm showed substantially more (418 m3). The runoff volumes from both events were removed from further analysis as there appeared to be monitoring error for these events.
The swale hydrologic performance exceeded what has been seen in previous literature. The swale runoff reduction ranged from 54.1% to 100% with a mean (average of all individual event reductions) of 87.2% (Figure 2b). Percent runoff reduction for swales in literature ranges from 20–52% [4,8,13,26,27,28,29]. Davis et al. [5], Deletic [8], and Yu et al. [10] also observed complete capture for small storm events, ranging from 4 to 22 mm. Similarly, in this study, rain events up to 22 mm approached complete capture with an average runoff reduction of 89%. Rainfall events below 12.5 mm varied between complete capture and producing a small runoff volume, relative to rainfall, with runoff reduction varying from 75 to nearly 100% (average of 93%). This performance variability could be a result of the soil’s antecedent moisture content at the time of the event.
3.3. WinSLAMM Output
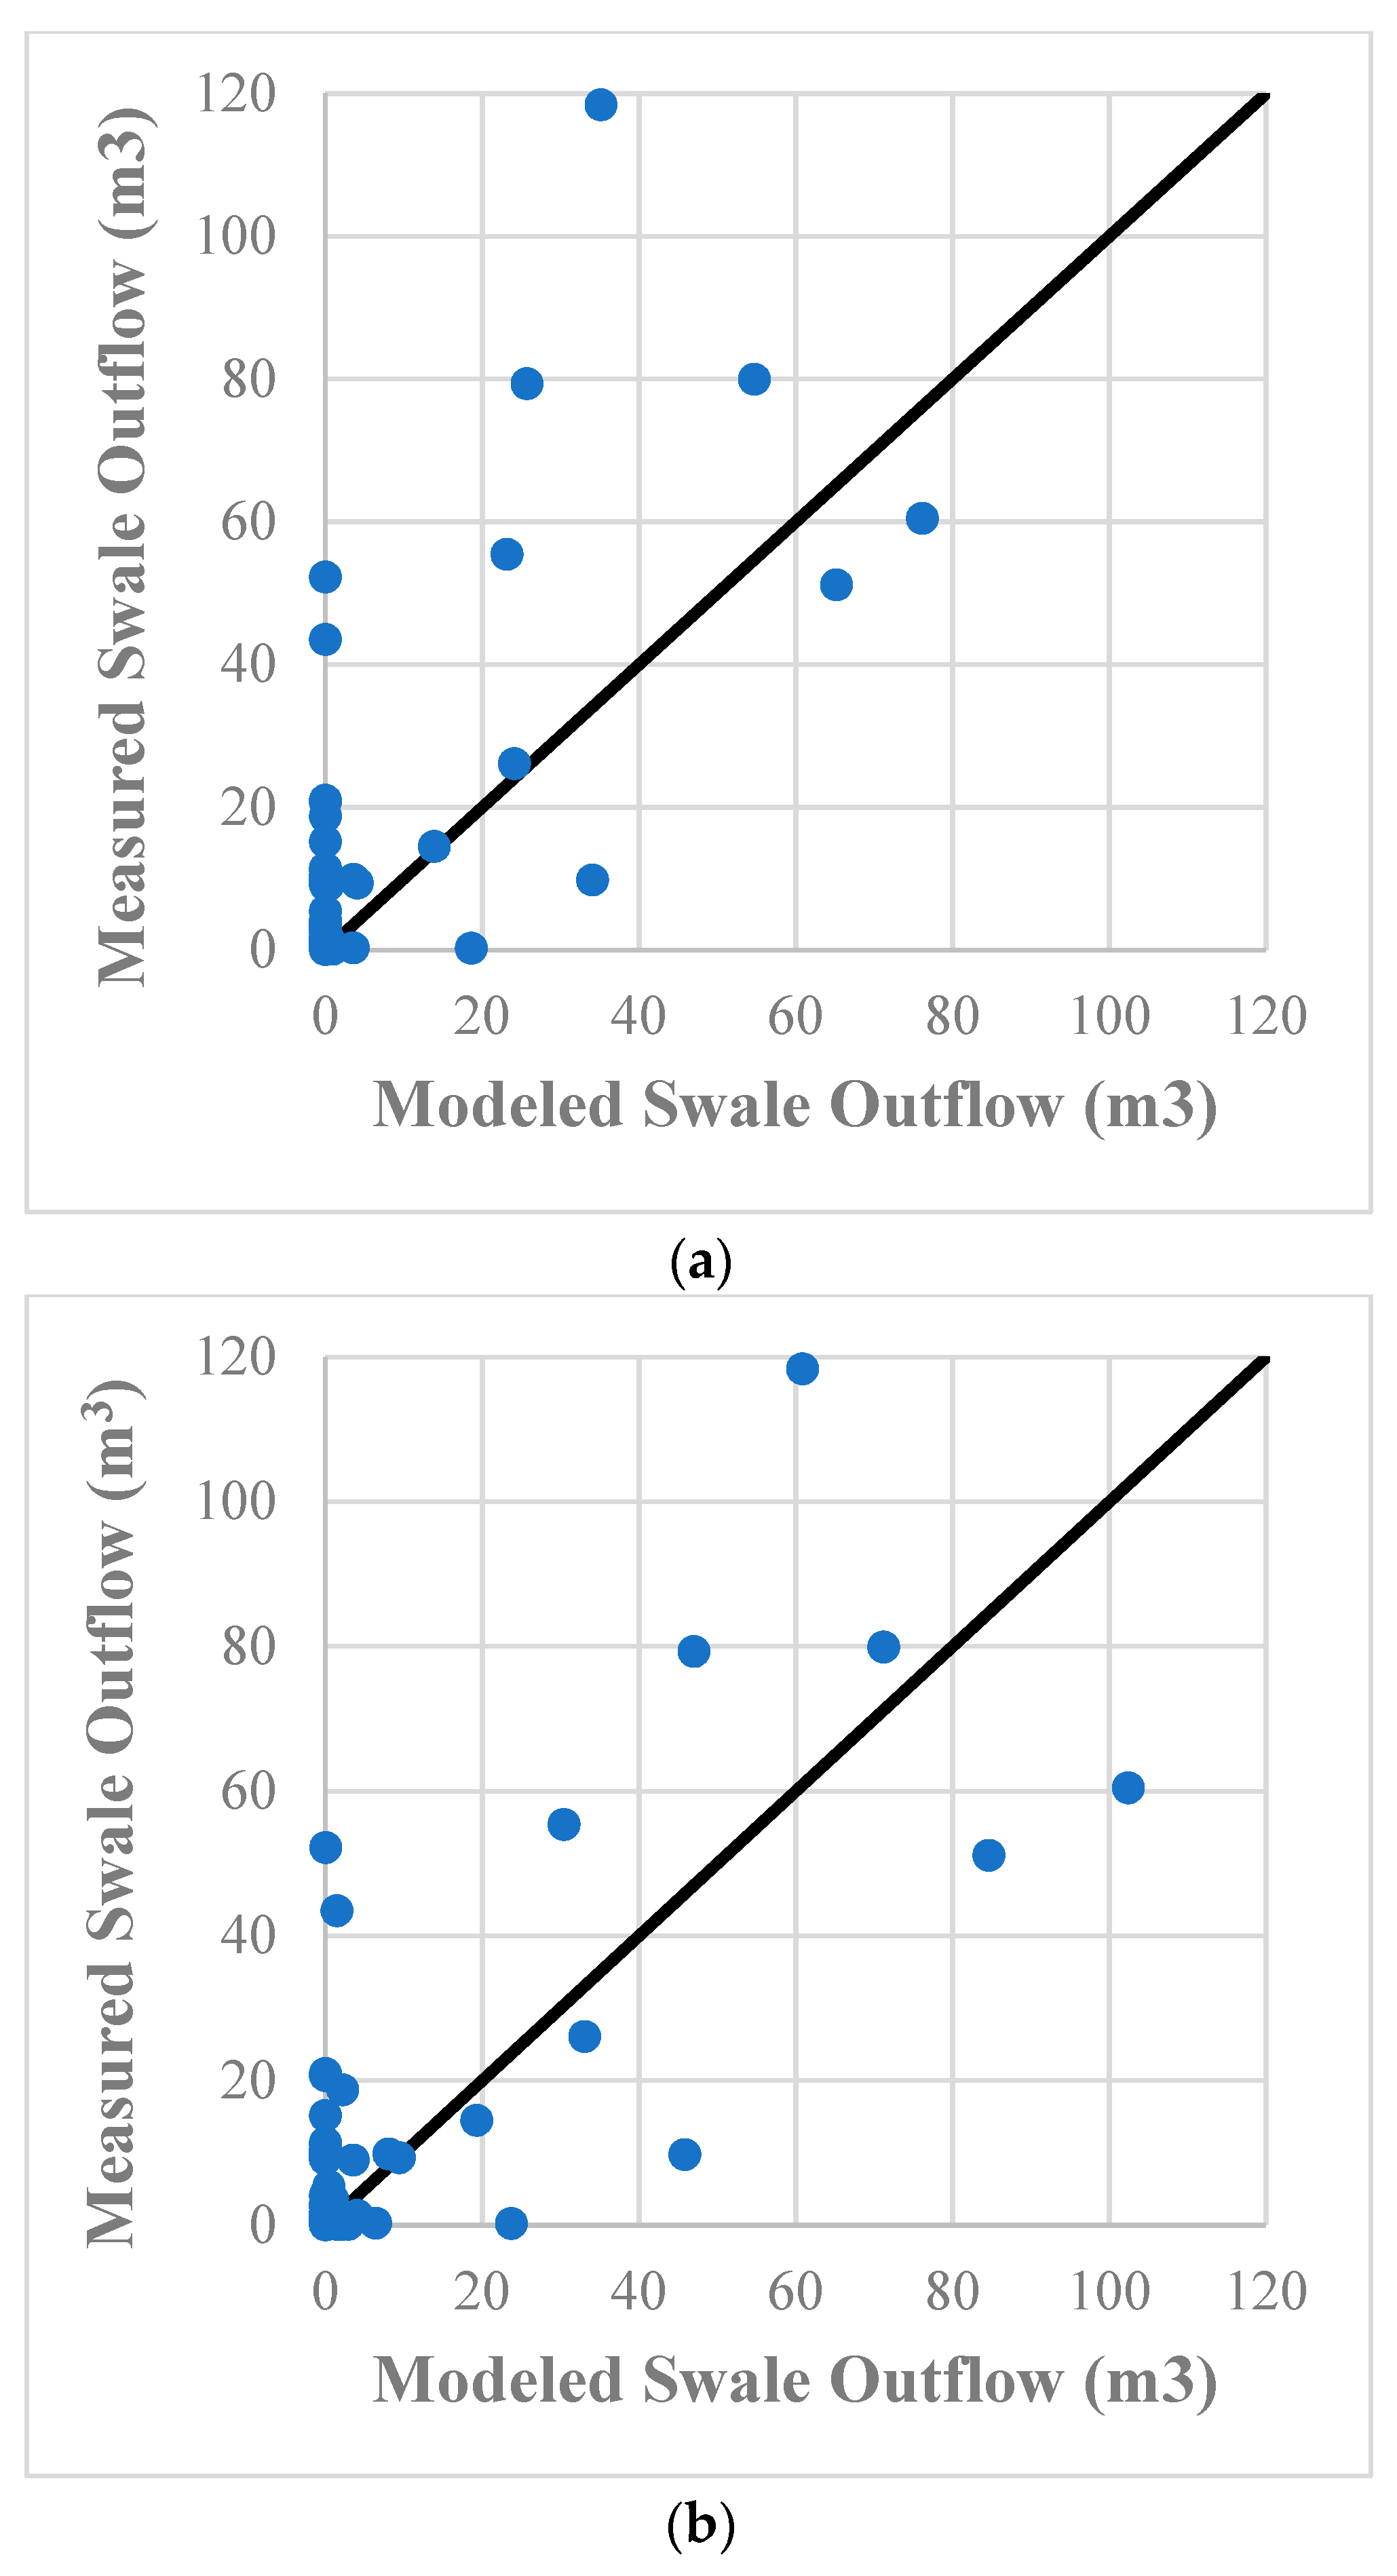
Due to the model structure, whereby the impervious roadway drains onto the median green space (filter strip and swale), nearly no runoff was produced by the model for any events unless soil compaction was set to “severe” within the rainfall-runoff variables. As runoff was observed and monitored for many events conflicting with model results (as seen in Figure 2), this was the first point of calibration in the modeling procedure. After compaction severity was adjusted, the model was found to underestimate swale outflow values (NSE of 0.35) when the field measured dynamic infiltration rates of 1.7 and 2.7 cm/h were input for the upper swale and lower swale, respectively (Figure 3a).
Underestimation of swale outflow suggested that either the catchment was providing more flow to the system than the model predicted, or that the swale was retaining more water than the model predicted (i.e., the infiltration rate was too high). Errors due to the temporal resolution of rainfall data (1-h precipitation) may have also contributed due to how rapidly many processes occur in small, urban watersheds. Since runoff was only measured at the outfall and not quantified at the edge of pavement, the runoff coefficients could not be calibrated to observed data. Further, it was anticipated that the runoff coefficients in WinSLAMM are generally reasonable, given their determination through extensive field monitoring, calibration, and verification [30]. Most input variables for the model were default values or taken from field measurements. However, infiltration measurements within the swale were noted to be highly variable, from 2.5 to 9.2 cm/h for the lower swale, providing substantial error to that parameter and making it the most likely to need calibration. This is supported by recent studies by Ahmed et al. [11] who also showed high variability in the information rate of highway green space. A sensitivity analysis was performed to understand the effect of this parameter on the model performance.
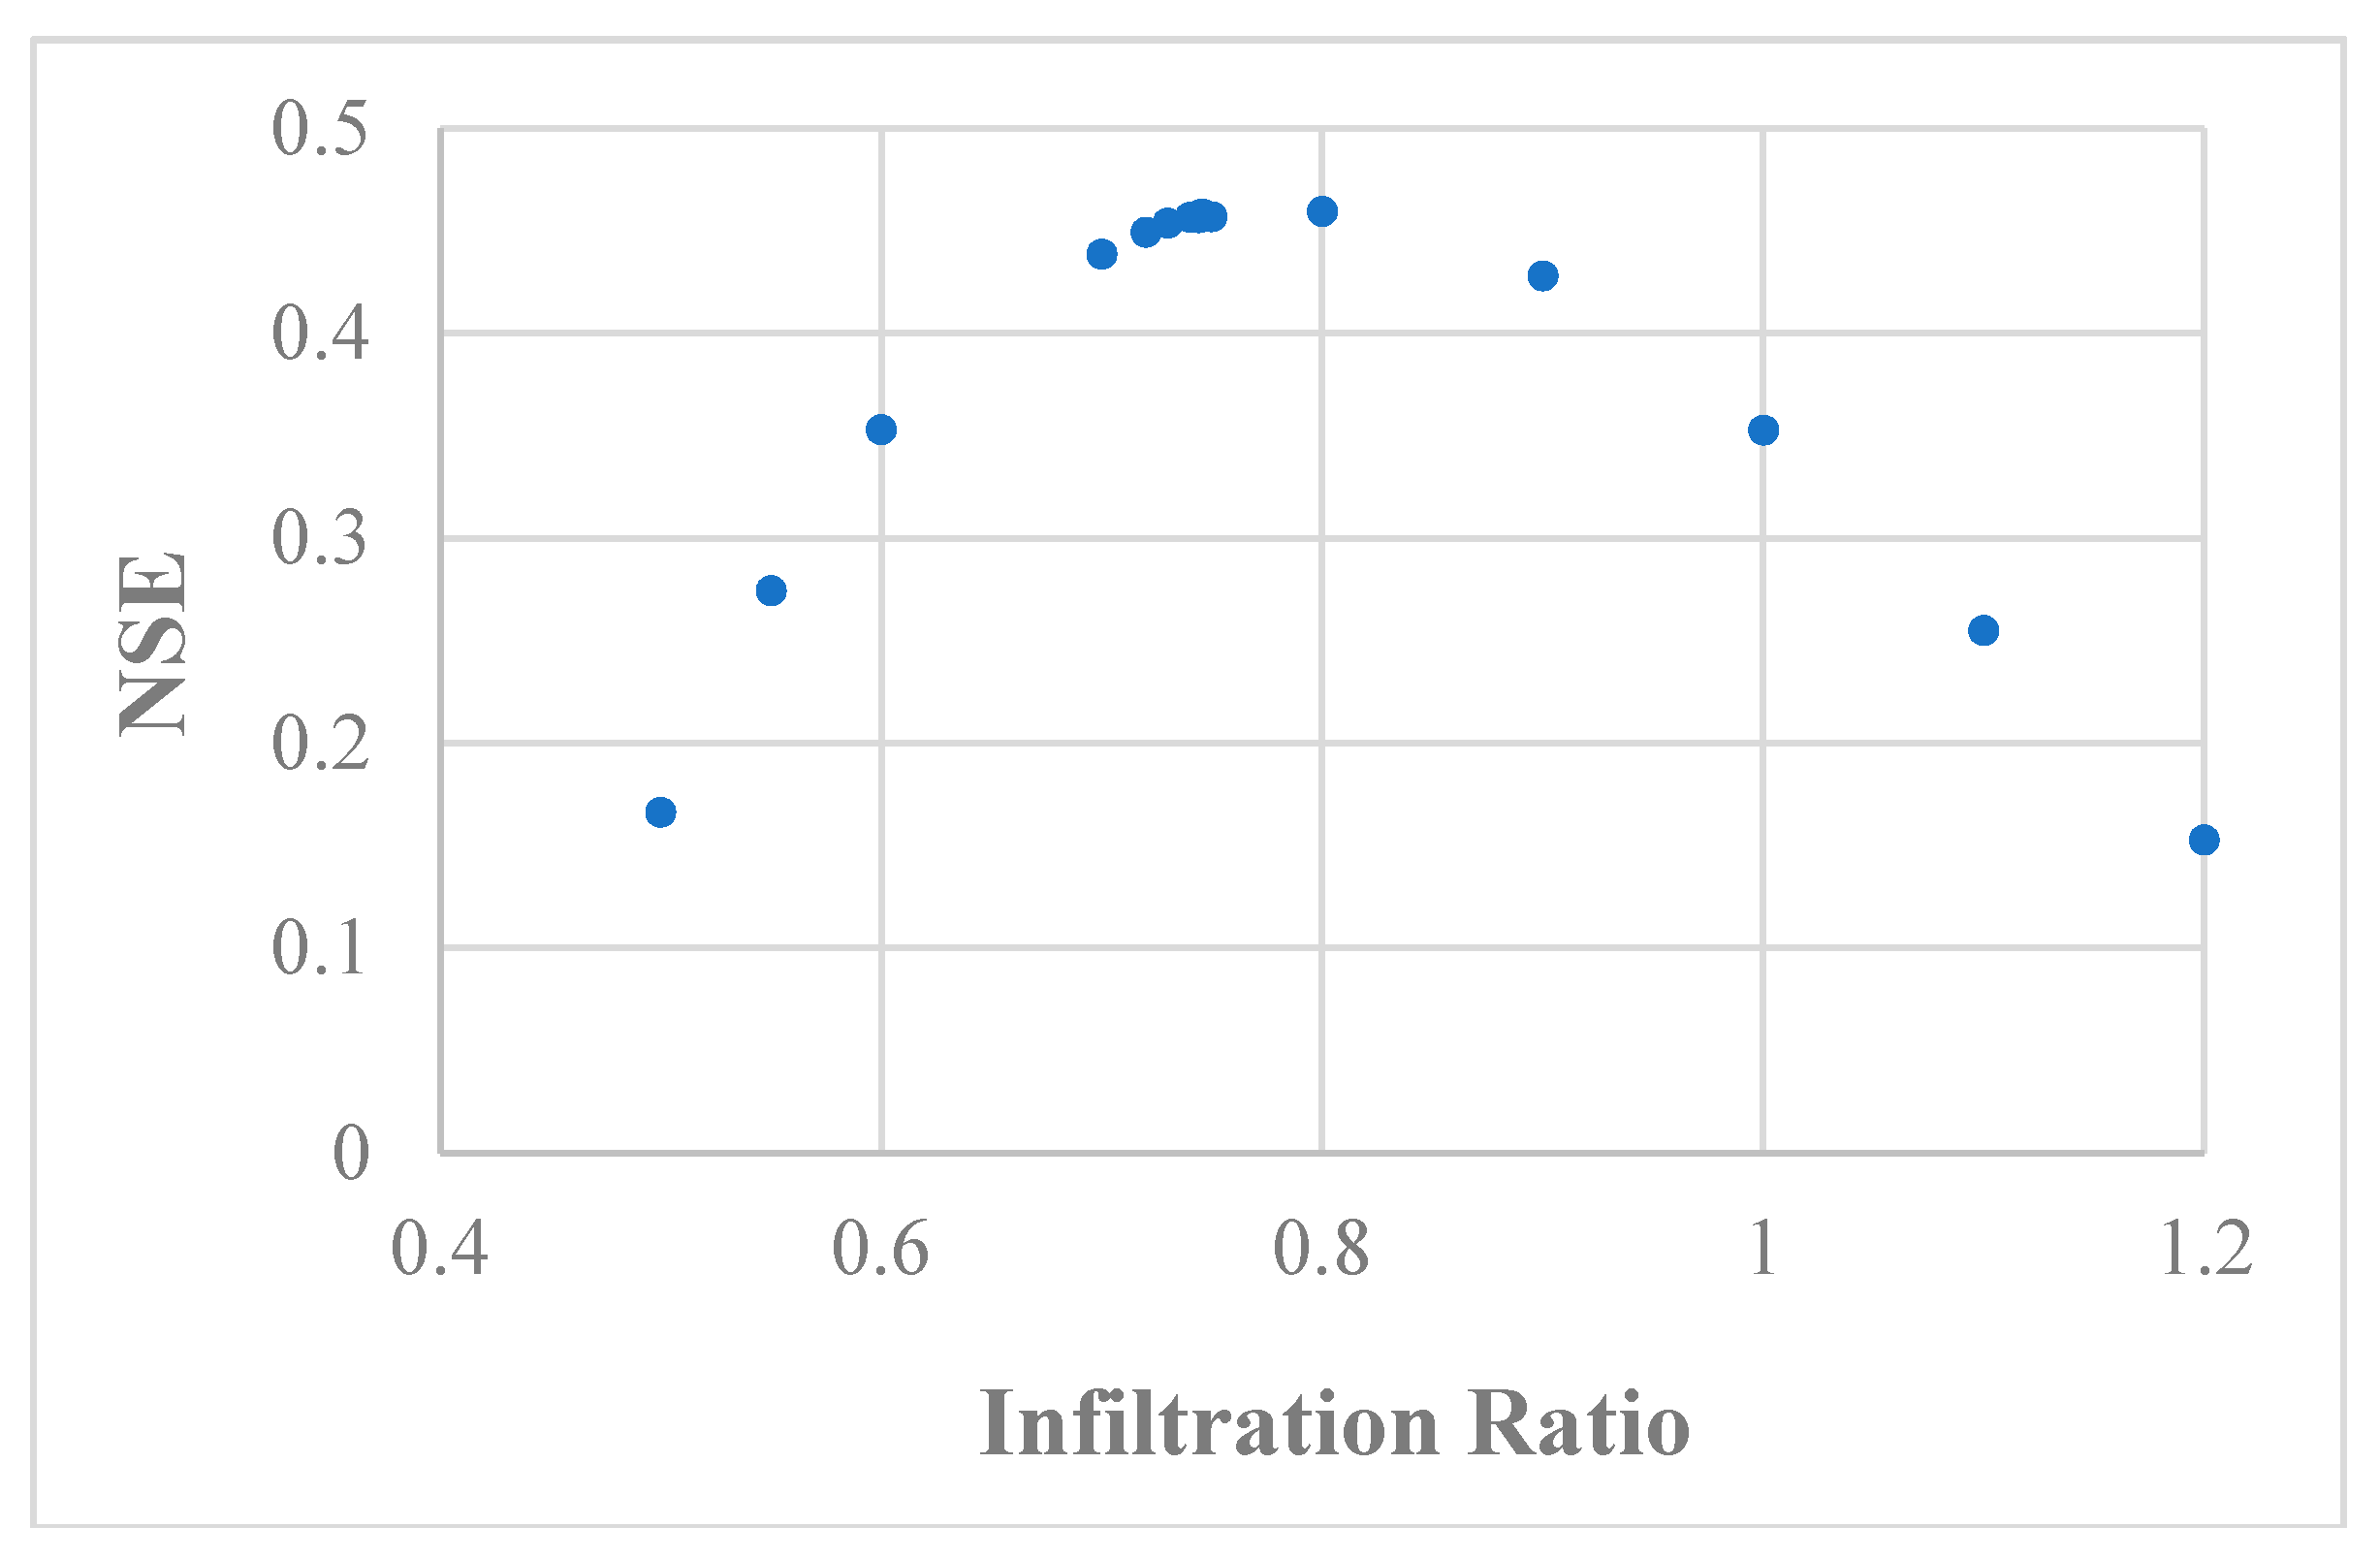
The measured dynamic infiltration rates were multiplied by factors from 0.5 to 1.2, a range of 0.9 to 2.1 cm/h and 1.4 to 3.3 cm/h for the upper and lower swales, respectively. The model was run with each adjusted infiltration rate, and the Nash-Sutcliffe model efficiency coefficient (NSE) was generated for each model iteration [31]. NSE values and modeled infiltration rates were plotted to determine under which multiplier the maximum NSE value occurs. The optimum dynamic infiltration rates were found at 80% of measured values (Figure 4).
As an additional observation, the calibrated infiltration rates fall within the range of sandy loam and loamy sand per the WinSLAMM manual. Given that the soils surrounding the site are made up of loam and silt loam per the USDA soil survey of the area, the native soils do not correspond with the calibrated infiltration rate, which is higher than expected based on soil type [32]. Similarly, the saturated hydraulic conductivity field tests performed by Garcia-Serrana et al. [12] also showed higher infiltration rates than the native soil texture classes indicated. It is possible that the dense stand of grass provided improved permeability over time due to root action, that fill soils were used for the roadway (thus making the soil map inaccurate), and/or that an organic layer developed over time and provided additional water storage. Regardless, it is apparent that infiltration tests should be performed instead of assuming that infiltration rates in highway medians will correspond with those assumed based on soil texture. As suggested by Ahmed et al. [11], this may require a large number of infiltration tests (between 10–40 per swale, depending on desired uncertainty factor) to be performed for a given location, likely exceeding the number of tests performed herein. This is particularly important in light of how sensitive this variable was shown to be during calibration.
Figure 3b shows the measured vs. modeled runoff volumes for the final calibrated model. The measured runoff volume for each rain event during the study period was totaled and every modeled runoff volume was totaled; the percent difference was calculated to be 28.4% over the entire study. Percent differences for other catchments modeled by WinSLAMM have ranged from 0 to 27%, with the site size ranging from 1.6 to 390 ha of varying land use [14]. Although this project from literature was focused on catchment modeling, these values do provide some context for past WinSLAMM performance. The max NSE was approximately 0.46 using only one calibration parameter which approaches the value suggested as acceptable model performance (>0.5) in such studies as Dongquan et al. [33] and Santhi et al. [34]. The Root Mean Square Error was 19.0 m3, corroborating the fair, but not flawless, performance of the model suggested by the NSE. WinSLAMM appears to be a reasonable planning model for highway managers, but further study from other locations is needed to both verify the results herein and to understand which parameters can be estimated based on literature and which require field measurement. In particular, site specific infiltration measurements may be required to achieve reasonable performance.
4. Conclusions
This study investigated the potential for highway grassed swales to contribute to the stormwater management goals of entities such as state transportation agencies to meet MS4 requirements. The results were favorable for volume control, as the swale reduced runoff volume by a median 88.2%. One explanation for the high reduction percentage is the elevated infiltration rates measured for the site. Despite soil maps of the area identifying soils as primarily loam and silt loam, on-site infiltration tests showed relatively high infiltration rates compared to literature (2.5 cm/h to 9.2 cm/h). This parameter became critical in modeling the system, showing high sensitivity during the calibration process. The final, calibrated WinSLAMM model showed a percent difference of 28.4% between observed and modeled for the entire study period with an NSE of 0.46 and RMSE of 19.0 m3. The modeling process reiterated the importance of collecting localized infiltration data when modeling these systems and confirmed the findings of other studies [11,12] that infiltration rates can be highly variable in highway environments. In addition, these results suggest the value of using WinSLAMM for estimating the performance of highway green space for stormwater management.
Although there are a number of studies examining the performance of swales as stormwater management features, the performance variability in literature suggests further study is needed to allow them to be properly credited by regulators. In particular, there is a need to better understand how infiltration rates vary in the highway environment and if tools to estimate these rates are feasible. Examining additional sites to see if infiltration rates are more elevated than the native soil texture class suggests would be beneficial for scaling estimates of highway swale performance from the local to regional level. In addition, WinSLAMM was shown to be a reasonable tool for modeling swale performance, but further study is needed to determine if the observed performance can be replicated in other sites and if improvements such as allowing a 15-min resolution rainfall input would improve performance. Using this tool, highway stormwater managers may also be able to determine how swale performance would vary given a range of infiltration rates, catchment sizes, and swale geometries.
Author Contributions
Conceptualization, J.M.H. and Q.H.; Methodology, B.N.Y., J.M.H. and Q.H.; Formal Analysis, B.N.Y., W.A.L., J.M.H. and Q.H.; Investigation, B.N.Y.; Writing-Original Draft Preparation, B.N.Y.; Writing-Review & Editing, B.N.Y., W.A.L. and J.M.H.
Funding
Funding for this research was provided by the Tennessee Department of Transportation Grant No. RES 2016-21.
Conflicts of Interest
The authors declare no conflict of interest.
References
- Weis, P.T.; Gulliver, J.S.; Erickson, A.J. The Performance of Grassed Swales as Infiltration and Pollution Prevention Practices: A Literature Review; University of Minnesota: Minneapolis, MN, USA, 2010; Available online: http://stormwater.safl.umn.edu/publications/reports (accessed on 21 June 2018).
- USEPA. Stormwater Discharges from Transportation Sources; USEPA: Washington, DC, USA, 2015. Available online: https://www.epa.gov/npdes/stormwater-discharges-transportation-sources#overview (accessed on 27 July 2016).
- USEPA. Storm Water Technology Fact Sheet: Vegetated Swales; EPA Reference No. 832-F-99-006; USEPA: Washington, DC, USA, 1999. Available online: http://nepis.epa.gov/Exe/ZyPDF.cgi/200044A8.PDF?Dockey=200044A8.PDF (accessed on 20 July 2016).
- Lucke, T.; Mohamed, M.; Tindale, N. Pollutant Removal and Hydraulic Reduction Performance of Field Grassed Swales during Runoff Simulation Experiments. Water 2014, 6, 1887–1904. [Google Scholar] [CrossRef] [Green Version]
- Davis, A.P.; Stagge, J.H.; Jamil, E.; Kim, H. Hydraulic performance of grass swales for managing highway runoff. Water Res. 2011, 46, 6775–6786. [Google Scholar] [CrossRef] [PubMed]
- Barrett, M.E. Comparison of BMP Performance Using the International BMP Database. J. Irrig. Drain. Eng. 2008, 134, 556–561. [Google Scholar] [CrossRef]
- Shafique, M.; Kim, R.; Kyung-Ho, K. Evaluating the capability of grass swale for the rainfall runoff reduction from an urban parking lot, Seoul, Korea. Int. J. Environ. Res. Public Health 2018, 15, 537. [Google Scholar] [CrossRef] [PubMed]
- Deletic, A. Modelling of water and sediment transport over grassed areas. J. Hydrol. 2001, 248, 168–182. [Google Scholar] [CrossRef]
- Kaighn, R.J.; Yu, S.L. Testing of Roadside Vegetation for Highway Runoff Pollutant Removal. Transp. Res. Rec. J. Transp. Res. Board 1996, 1523, 116–123. [Google Scholar] [CrossRef]
- Yu, S.L.; Kuo, J.T.; Fassman, E.A.; Pan, H. Field Test of Grassed-Swale Performance in Removing Runoff Pollution. J. Water Resour. Plan. Manag. 2001, 127, 168–171. [Google Scholar] [CrossRef]
- Ahmed, F.; Gulliver, J.S.; Nieber, J.L. Field infiltration measurements in grassed roadside drainage ditches: Spatial and temporal variability. J. Hydrol. 2015, 530, 604–611. [Google Scholar] [CrossRef]
- Garcia-Serrana, M.; Gulliver, J.S.; Nieber, J.L. Infiltration capacity of roadside filter strips with non-uniform overland flow. J. Hydrol. 2017, 545, 451–462. [Google Scholar] [CrossRef]
- Winston, R.J.; Powell, J.T.; Hunt, W.F. Retrofitting a grass swale with rock check dams: Hydrologic impacts. Urban Water J. 2018. [Google Scholar] [CrossRef]
- PV & Associates (PVA). Using WinSLAMM: Meeting Urban Stormwater Management Goals; Workshop Presentations; PVA: Madison, WI, USA, 20–21 April 2017. [Google Scholar]
- Pitt, R. WINSLAMM Documentation. 2013. Available online: http://rpitt.eng.ua.edu/SLAMM DETPOND /WinSlamm/MainWINSLAMM_book.html (accessed on 27 August 2017).
- Borris, M.; Leonhardt, G.; Marsalek, J.; Osterlund, H.; Viklander, M. Source-Based Modeling of Urban Stormwater Quality Response to the Selected Scenarios Combining Future Changes in Climate and Socio-Economic Factors. Environ. Manag. 2016, 58, 223–237. [Google Scholar] [CrossRef] [PubMed]
- Hurley, S.E.; Forman, R.T.T. Stormwater ponds and biofilters for large urban sites: Modeled arrangements that achieve the phosphorus reduction target for Boston’s Charles River, USA. Ecol. Eng. 2011, 36, 850–863. [Google Scholar] [CrossRef]
- Knoxville Geographic Information System (KGIS). Traffic Counts. KGIS Maps. 2017. Available online: http://www.kgis.org/KGISMaps/Map.htm (accessed on 7 July 2016).
- United States Department of Agriculture (USDA). Natural Resources Conservation Service. Web Soil Survey. Available online: https://websoilsurvey.sc.egov.usda.gov/App/WebSoilSurvey.aspx (accessed on 18 March 2017).
- TDOT. Roadside Ditch Details for Design and Construction (RD01-S-11A). Standard Drawings Library. 2002. Available online: http://www.tn.gov/assets/entities/tdot/attachments/RD01S11A_101502.pdf (accessed on 10 November 2017).
- TDOT. Section 801—Seeding. TDOT Spec Book. 2015. Available online: https://www.tn.gov/assets/entities/tdot/attachments/2015_TDOT_Spec_Book.pdf (accessed on 10 November 2017).
- Brown, R.A.; Hunt, W.F. Underdrain configuration to enhance bioretention exfiltration to reduce pollutant loads. J. Environ. Eng. 2011, 137, 1082–1091. [Google Scholar] [CrossRef]
- Pandit, A.; Heck, H.H. Estimations of soil conservation service curve numbers for concrete and Asphalt. J. Hydrol. Eng. 2009, 14, 335–345. [Google Scholar] [CrossRef]
- American Society for Testing and Materials International (ASTM). Standard Test Method for Infiltration Rate of Soils in Field Using Double-Ring Infiltrometer; ASTM International: West Conshohocken, PA, USA, 2009. [Google Scholar]
- PV & Associates (PVA). WinSLAMM Model Algorithms. 2015. Available online: http://winslamm.com/Select_documentation.html (accessed on 27 August 2017).
- Backstrom, M. Grassed swales for stormwater pollution control during rain and snowmelt. Water Sci. Technol. 2003, 48, 123–132. [Google Scholar] [CrossRef] [PubMed]
- Barrett, M.E.; Irish, L.B.; Malina, J.F.; Charbeneau, R.J. Characterization of Highway Runoff in Austin, Texas, Area. J. Environ. Eng. 1998, 124, 131–137. [Google Scholar] [CrossRef] [Green Version]
- Rushton, B.T. Low-impact parking Lot design reduces runoff and pollutants loads. J. Water Res. Plan. Mgnag. 2001, 127, 172–179. [Google Scholar] [CrossRef]
- Knight, E.M.P.; Hunt, W.F.; Winston, R.J. Side-by-side evaluation of four level spreader-vegetated filter strips and a swale in eastern North Carolina. J. Soil Water Conserv. 2013, 7, 5330–5346. [Google Scholar] [CrossRef]
- Pitt, R. Calibration of WinSLAMM. 2008. Available online: http://winslamm.com/Select_documentation.html (accessed on 27 August 2017).
- Nash, J.E.; Sutcliffe, J.V. River flow forecasting through conceptual models part I—A discussion of principles. Elsevier 1970, 10, 282–290. [Google Scholar] [CrossRef]
- Pitt, R.; Lantrip, J.; Harrison, R.; Henry, C.; Hue, D. Infiltration through Disturbed Urban Soils and Compost-Amended Soil Effects on Runoff Quality and Quantity; EPA 600/R-00/016; U.S. Environmental Protection Agency, Water Supply and Water Resources Division, National Risk Management Research Laboratory: Cincinnati, OH, USA, 1999.
- Zhao, D.; Chen, J.; Wang, H.; Tong, Q.; Cao, S.; Sheng, Z. GIS-based urban rainfall-runoff modeling using an automatic catchment-discretization approach: A case study in Macau. Environ. Earth Sci. 2009, 59, 465–472. [Google Scholar]
- Santhi, C.; Arnold, J.G.; Williams, J.R.; Dugas, W.A.; Srinivasan, R.; Hauck, L.M. Validation of the SWAT model on a large river basin with point and nonpoint sources. J. Am. Water Resour. Assoc. 2001, 37, 1169–1188. [Google Scholar] [CrossRef]
Figure 1.
Project site schematic showing aerial view of swale and associated catchment, and the WinSLAMM model representation of the site.
Figure 1.
Project site schematic showing aerial view of swale and associated catchment, and the WinSLAMM model representation of the site.

Figure 2.
(a) Rainfall-Outflow and (b) Runoff-Outflow trends with Outliers Removed.

Figure 3.
Modeled vs. Measured Swale Outflow for (a) Measured Infiltration Rates and (b) 80% of Measured Infiltration Rates.
Figure 3.
Modeled vs. Measured Swale Outflow for (a) Measured Infiltration Rates and (b) 80% of Measured Infiltration Rates.

Figure 4.
NSE vs. Infiltration Ratio.

Table 1.
Upper and lower grassed swale attributes and model inputs.
| Parameter Description | Upper Swale | Lower Swale | Guidance/Source |
|---|---|---|---|
| Total Drainage Area (ha) | 0.32 | 0.47 | Measured in ArcGIS |
| Impervious Drainage Area (ha) | 0.13 | 0.13 | Measured in ArcGIS |
| Length (m) | 210 | 230 | Measured in ArcGIS |
| Bottom Width (m) | 0.46 | 0.46 | Measured in ArcGIS |
| Sideslope (H:V) | 6.1 | 7.3 | Measured in ArcGIS |
| Longitudinal Slope (%) | 2.5 | 1.0 | Measured in ArcGIS |
| Swale Retardance Factor | C | C | WinSLAMM Manual |
| Typical Grass Height (cm) | 20 | 20 | Field Measurement |
| Infiltration Rate (cm/h) * | 3.4 | 5.5 | Field Measurement |
* Further detail provided in “Infiltration Measurements” Section.
Table 2.
Measured infiltration rates (cm/h).
| Location | Right FS | Swale | Left FS | ||||||
|---|---|---|---|---|---|---|---|---|---|
| Min | Max | Avg | Min | Max | Avg | Min | Max | Avg | |
| Upper Section | 11.9 | 16.2 | 13.7 | 3.0 | 4.2 | 3.4 | 4.7 | 6.4 | 5.3 |
| Lower Section | 8.7 | 12.2 | 10.1 | 2.5 | 9.2 | 5.5 | 1.0 | 6.2 | 3.7 |
© 2018 by the authors. Licensee MDPI, Basel, Switzerland. This article is an open access article distributed under the terms and conditions of the Creative Commons Attribution (CC BY) license (http://creativecommons.org/licenses/by/4.0/).
Share and Cite
MDPI and ACS Style
Young, B.N.; Hathaway, J.M.; Lisenbee, W.A.; He, Q. Assessing the Runoff Reduction Potential of Highway Swales and WinSLAMM as a Predictive Tool. Sustainability 2018, 10, 2871. https://doi.org/10.3390/su10082871
AMA Style
Young BN, Hathaway JM, Lisenbee WA, He Q. Assessing the Runoff Reduction Potential of Highway Swales and WinSLAMM as a Predictive Tool. Sustainability. 2018; 10(8):2871. https://doi.org/10.3390/su10082871
Chicago/Turabian StyleYoung, Bailee N., Jon M. Hathaway, Whitney A. Lisenbee, and Qiang He. 2018. "Assessing the Runoff Reduction Potential of Highway Swales and WinSLAMM as a Predictive Tool" Sustainability 10, no. 8: 2871. https://doi.org/10.3390/su10082871
Note that from the first issue of 2016, this journal uses article numbers instead of page numbers. See further details here.