An Empirical Study on the Design of Digital Content Products from a Big Data Perspective


1
Department of Economics, School of Economics and Finance, Xi’an Jiaotong University, Xi’an 710049, China
2
Department of Safety Engineering, School of Safety and Environmental Engineering, Capital University of Economics and Business, Beijing 100070, China
3
Department of Strategic Management, College of Business Administration, Capital University of Economics and Business, Beijing 100070, China
4
Zhongshan Institute, University of Electronic Science and Technology of China, Zhongshan 528402, China
*
Authors to whom correspondence should be addressed.
Sustainability 2018, 10(9), 3092; https://doi.org/10.3390/su10093092
Submission received: 13 July 2018
/
Revised: 24 August 2018
/
Accepted: 25 August 2018
/
Published: 30 August 2018
(This article belongs to the Special Issue Expert Systems: Applications of Business Intelligence in Big Data Environments)
Abstract
:The competition within the digital content market has become extremely fierce recently in China. With increasingly diversified product choices offered to customers, the focus on customer experience has been elevated to the highest level ever. It has become key to winning customers from within the intense competition and for companies to obtain differentiation advantages to create optimized customer experience from the customers’ viewpoint. The article analyzes the relationship between customer experience and the business model of digital content companies. Later, it comes up with an innovated business model based on the big data of customer experience to restructure the business process of digital content companies and to illustrate the designing process of new models in the product application design and customer care stages based on the model proposed, which can be used as references for the transformation and innovation of digital content companies.
1. Introduction
Digital content is a product form which integrates the contents of text, image, audio, video, and others through digital technology. It is the combination of digital media technology and cultural creativity [1]. In the era of mobile Internet, the entertainment demand from users is on a constant increase, which has greatly promoted the development momentum of digital content products, such as music, videos, e-books, games, and animation. The digital content industry competition is becoming increasingly fierce in China with Internet giants such as rapidly rising. How to create differential advantages among many similar products and acquire users has become a vital topic for the development of digital content enterprises.
Meanwhile, the “experience economy” based on user experience is becoming the new stage of the mobile Internet era. In the past, more attention was paid to price, function, and appearance when customers purchased products. However, in the new “experience economy” era, companies that simply rely on offering basic products and services are likely to fail to meet the high standard of user experience needs from the buyers’ market and they are at an absolute disadvantage in the market competition. Users are concerned about the outcome of products and services as well as the process of interaction with service providers. Every action that users have with service providers may contribute to experience perception, thus forming the complete process of “user experience”. “Experience” is now the key value of products and services and the economic lifeline of the mobile Internet era.
A well-designed, user-oriented product that offers an enjoyable, practical, and unique experience is more capable of attracting a large sum of potential users and motivate consumption behavior from them, leading to outstanding financial performances and a sustainable benign development cycle for its creator. Meanwhile, though a product with tremendous design flaws and poor content can kick off in the market with a substantial investment and massive advertisement, it will hardly be able to hold on to its user foundation due to the unpleasant and uncomfortable user experience. Thus, in the pursuit of sustainability development, the emphasis of digital content companies should be placed not only on the short-term financial performances such as revenue and profit, but also on the user factor behind such figures, which are users’ activeness in the product and their loyalty towards it, both of which are driven by user experience.
The existing research on user experience mainly focuses on the design of user experience models and the analysis of user experience evaluation. Little research has been carried out on the combination of user experience and big data. Considering that user experience is multi-dimensional, multi-leveled, and on a continuous change, in order to accurately grasp users’ needs of digital content product experience, it is necessary to use big data tools and research means to realize the quantification of user experience perception.
This article introduces a modified CUBI-C2B model based on user experience data that transforms digital content companies’ traditional business process into a user-centric, data-driven, sustainable practice. By complying with the data privacy protection rules and being adapted accordingly, digital content companies are likely to possess a competitive edge in the market with prominent user experience design and better their financial performances by avoiding unnecessary content investment losses.
This paper consists of 5 sections. Section 2 summarizes the related researches and theoretical basis of user experience and the big data business model. Section 3 analyzes the internal relations between the user experience, big data, and the business model, and points out the application field of the innovated business model based on user experience data for digital content enterprises. Based on the result of the application field analysis, Section 4 designs the C2B innovation mode based on user experience data in two key areas of digital content companies: business decision making and user insight. In these models, through the data acquisition mechanism, the result of experience data analysis can be converted to an important reference for business operations, which greatly helps digital content enterprises accelerate the transformation process of user experience and data-driven innovation.
2. Literature Review
Prior research on user experience mainly focused on its consisting factors and operation values, while the big data business model is yet to be related to user experience studies. In Section 2.1 the existing research on user experience is reviewed, and in Section 2.2, the big data-based business model studies are thoroughly looked into.
2.1. Review of User the Experience Factor and Value Studies
As a concept, user experience was first proposed and promoted by scholar Donald Norman in the mid-1990s and it began to be recognized by the academic community in the same time period [2]. ISO defines user experience as “user’s feelings, beliefs, preferences, cognitive impressions, physiological and psychological responses, behavior, and achievements before, during and after the use of a certain product” [3]. The ISO definition emphasizes that user experience is the overall feeling and impression of a user using a product or accepting a service, and the factors affecting the user experience are summarized as system factors (system attributes), user factors (user status and past experience) and environmental factors (usage scenarios).
Since the mid-1990s, a large number of theoretical researches on user experience factors and values have been carried out in academic circles both in China and abroad. Alban proposed that user experience contains all the feelings that the user has when using the product, which is a collection of feelings on the exterior design, touch, quality, and so on. Attention from users is paid not only to the product or service itself, but also to the fit degree between the product and the environment [4]. Peter Morville pointed out that user experience factors include seven aspects, which are value, practicality, usability, benefit, advisability, credibility, and convenience. These factors are combined in the form of a cellular model, in which value is the center while the other six elements revolve around it, forming a complete user experience system [5]. Monroe interpreted the connotation of user value as the contrast between the pay and harvest that the user recognizes, and points out that user awareness, attitude, and experience all cast influence on user value [6]. Mattelmaki pointed out that the quality and performance of a product or service constitute the basis of the user value hierarchy, which can promote one’s sustained and high level of consumption [7]. Shin and others designed the pyramid model of user value and focused on the impact of user experience value on enterprise marketing activities during the period of industrial change and new product emergence [8].
Although existing user experience and its economic value researches are abundant, they are generally based on the concept of user experience and its connotation. It stays at the theoretical level and explores the application mode of user experience through the perspective of applied economics, while the application research of user experience based on big data and other technical perspectives is still scarce. Little research and analysis have been done on the use of technical means to improve user experience and its application value.
2.2. Review of Big Data-Based Business Model Studies
The existing research on the business model of big data by domestic and foreign scholars mainly focuses on two directions: one is based on information value theory. Venkatraman and others pointed out that the knowledge activeness and connectivity of the IT platform can produce new market opportunities and promote the business operation of the enterprise to change [9]. Pateli and Giaglis argued that the development of communication and information technology has greatly challenged the traditional business model, and enterprises need to integrate information technology such as big data to accelerate the business model transformation [10]. Domestic scholar Li Changyun put forward that the new generation of information technology such as big data will promote the business model transformation and upgrade by influencing the product and service innovation, alliance network innovation, and customer value mining [11]. Jiang Wei combined the genetic algorithm with the error back propagation algorithm and brought forward the enterprise business model based on the big data mining algorithm with a focus on optimizing key decision making processes such as market entry [12].
The other research direction is the realization of big data’s commercial value based on the competitive intelligence theory, focusing on modes and paths to enhance the value of big data. Kim proposed a business model based on the big data of the entrepreneurship ecosystem in a competitive environment and discussed data source, the priority of data processing and other technical links [13]. Kazman and others proposed a big data value mining model for business model innovation, which uses consumer and market competition factors as main data sources [14]. Domestic scholars have also been involved in this research direction. Jing Hao proposed that big data can make creative reshaping of the business model, forming a differential advantage in the new model. A framework and components of the new business model in the era of big data were also proposed by him [15].
The existing research on big data business value indicates that the importance of this subject has been recognized. However, a complete theoretical system is yet to be formed. Another drawback is that the existing application type research is mostly concentrated on the business model application of enterprise marketing data and cooperation data, and rarely about user experience data, which has remained undiscovered until recent years.
3. Research Methods
Based on the conclusion of Section 2, we illustrate the relationships in the triangle of “user experience—big data—business model” in this section. Section 3.1 looks into the relationship between user experience and the business model, which reconstructs the most applicable adoption method of user experience for digital content companies in their business operation activities. Section 3.2 studies the relationship between big data and the business model, which helps determine the most suitable and valuable areas for such a model to be adopted in digital content companies’ operations.
3.1. Analysis of Relationship between User Experience and Business Model
Being abstract and subjective, user experience originates from various aspects of the interaction between users and products or services. In the process of research, a user experience model should be established to model the abstract user experience concept. The user experience model is a perceptual logic system that displays the user’s perception from common objects, behaviors or systems in the form of abstract diagrams.
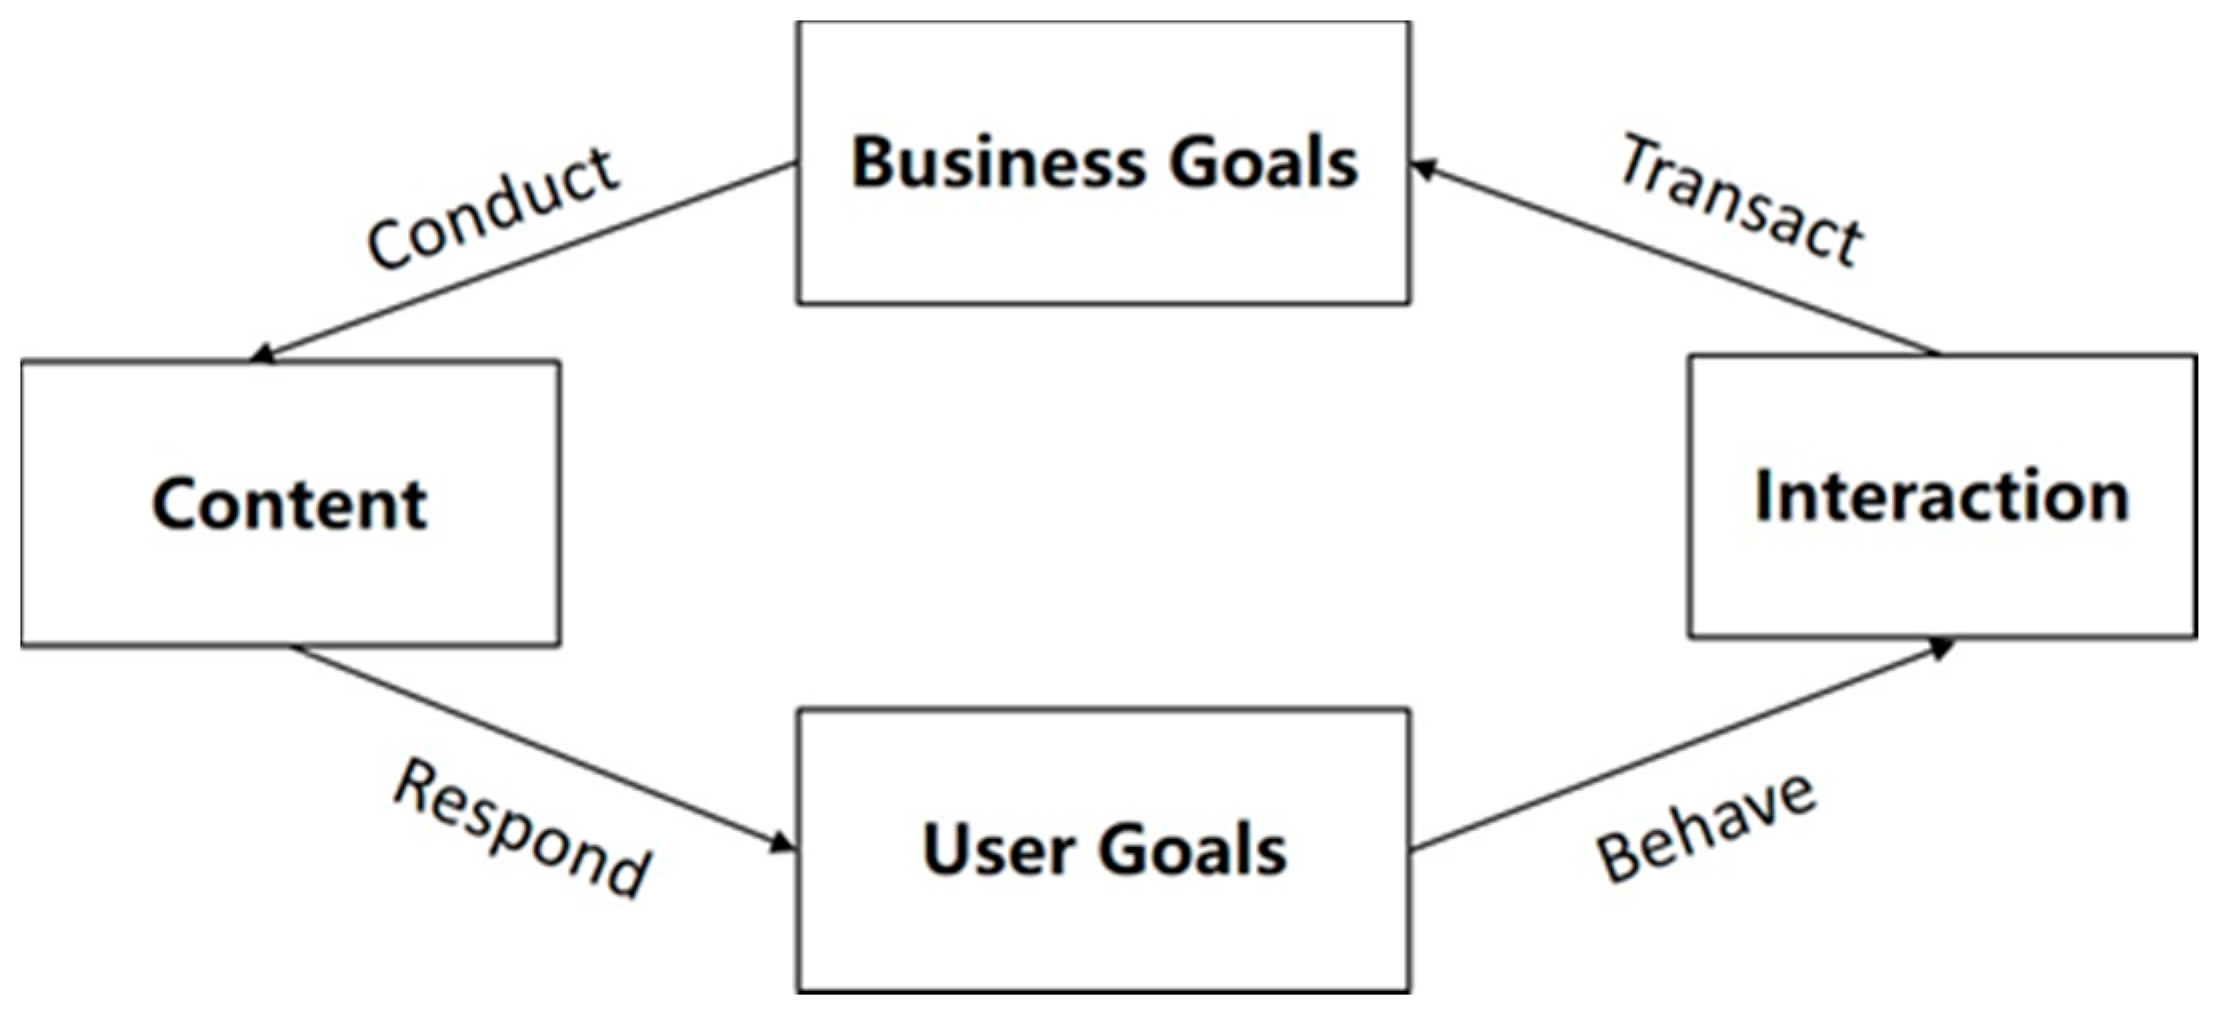
Domestic and foreign academics have designed a variety of user experience research models from various perspectives. Among them is Corey Stern who argued that an effective user experience model should include various business factors so that it can create a truly effective and innovative design with limited budget and time. He combined user experience concepts with business goals, content and interactions to design the CUBI user experience model [16]. As shown in Figure 1, the CUBI user experience model consists of four modules: content, user goals, business goals, and interaction. A complete closed loop of the user experience cycle is formed through four steps, which are conduction, response, reaction, and transaction. The CUBI model can be used to test whether the product content and interaction design are reasonable and whether the business goals and user goals can be achieved.
Based on the model proposed by Corey Stern and the characteristics of digital content products, this paper brings two innovations to the CUBI user experience model.
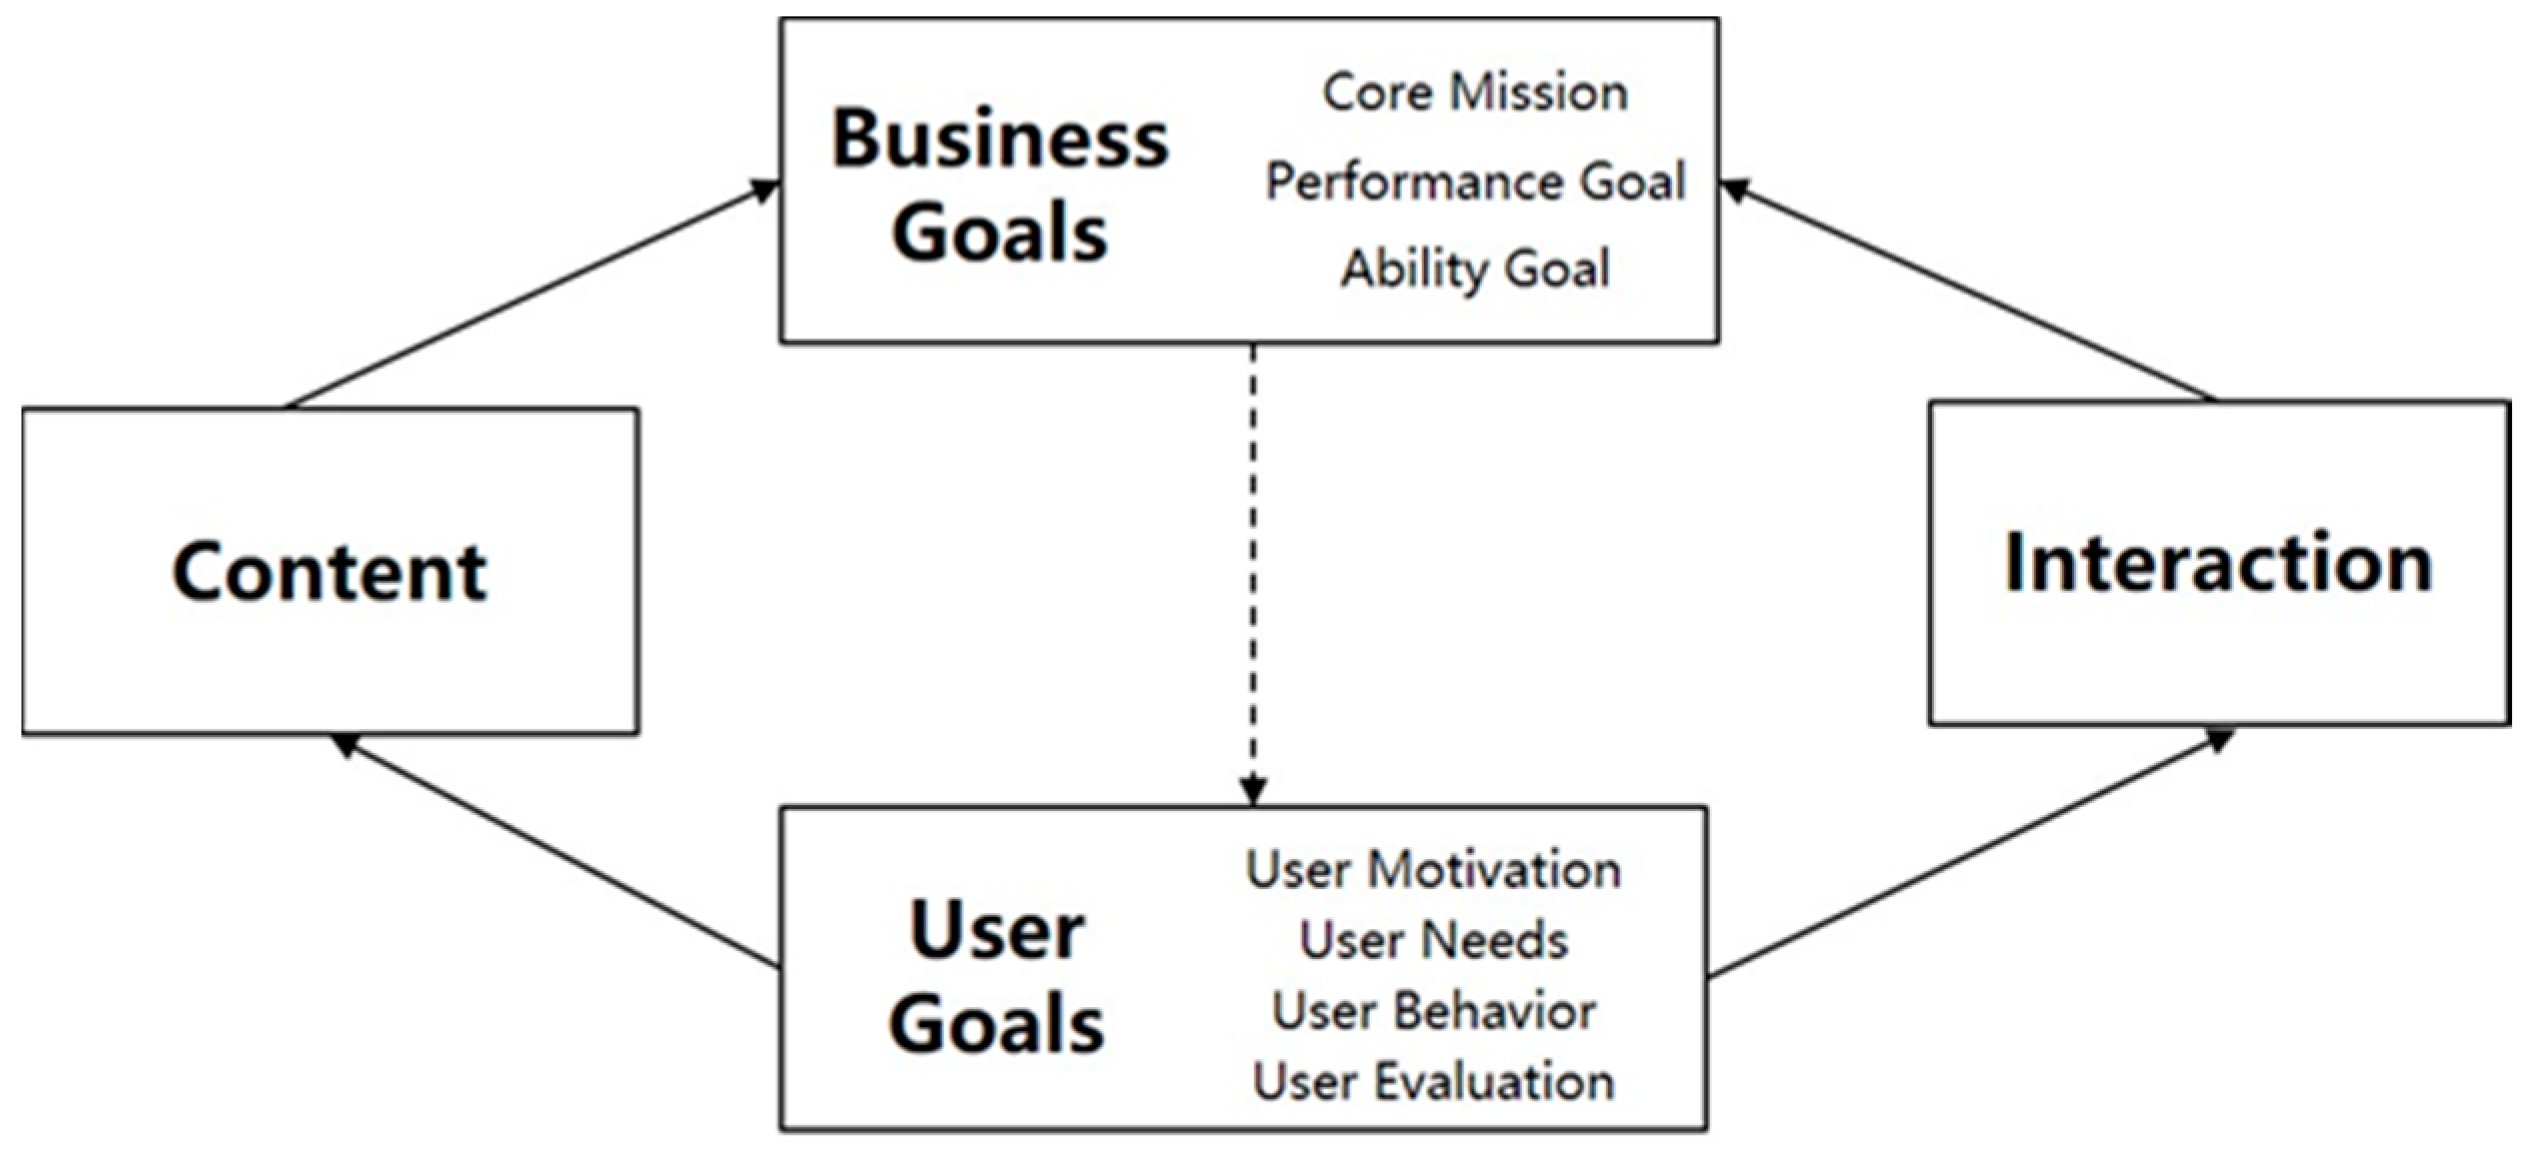
Firstly, the key goal elements are decomposed and the internal flow of the user experience is clarified. The decomposition of the business goal element starts from the basic mission of digital content product design and development, focuses on the core mission of revenue and profitability, and matches the companies’ ability goals, including design, development, marketing, and operation. Therefore, the digital content product business goal element is further decomposed into the core mission, performance goal and ability goal. The user goal element includes the whole lifecycle of the company, which goes through stages of user contact, understanding, recognizing, and obtaining. By taking a series of research on user behaviors, a digital content company can gradually transform users into loyal customers [17]. Therefore, the digital content product user goal element can be further decomposed into user motivations, user needs, user behavior and user evaluation.
Secondly, based on the C2B business model, the internal links of various elements are reshaped and a new user-centric business model is created. Originating from business goals, the traditional CUBI model tests whether the content and interaction elements of the product can help in achieving the established business goals. This is a typical B2C (business-user) model that focuses on internal process optimization. However, in the case of digital content products, the user perception of interaction and content will directly affect their willingness to use the product, which determines the realization of business goals. Therefore, this paper focuses on the C2B model connotation while optimizing the CUBI model by taking the user goals as the starting point, emphasizing the users’ leading role in the remake of the business process, and reshaping the CUBI-C2B model for digital content products. The proposed CUBI-C2B model is illustrated in Figure 2.
3.2. Decomposition of the Relationship between Big Data and the Business Model of Digital Content Products
Massiveness, high-speed, diversity, and volatility are the distinguishing features of big data. The comprehensive penetration of big data in multiple industries has a cast profound impact on various aspects of business models, such as marketing decision making and internal process optimizing [18]. For digital content companies, its main product is indeed a form of big data itself. Thus, in order to achieve sustainable development, digital content companies are required to replace old notions, use their data collection, processing, analysis, and other technical methods to reshape the business model and maximize user value.
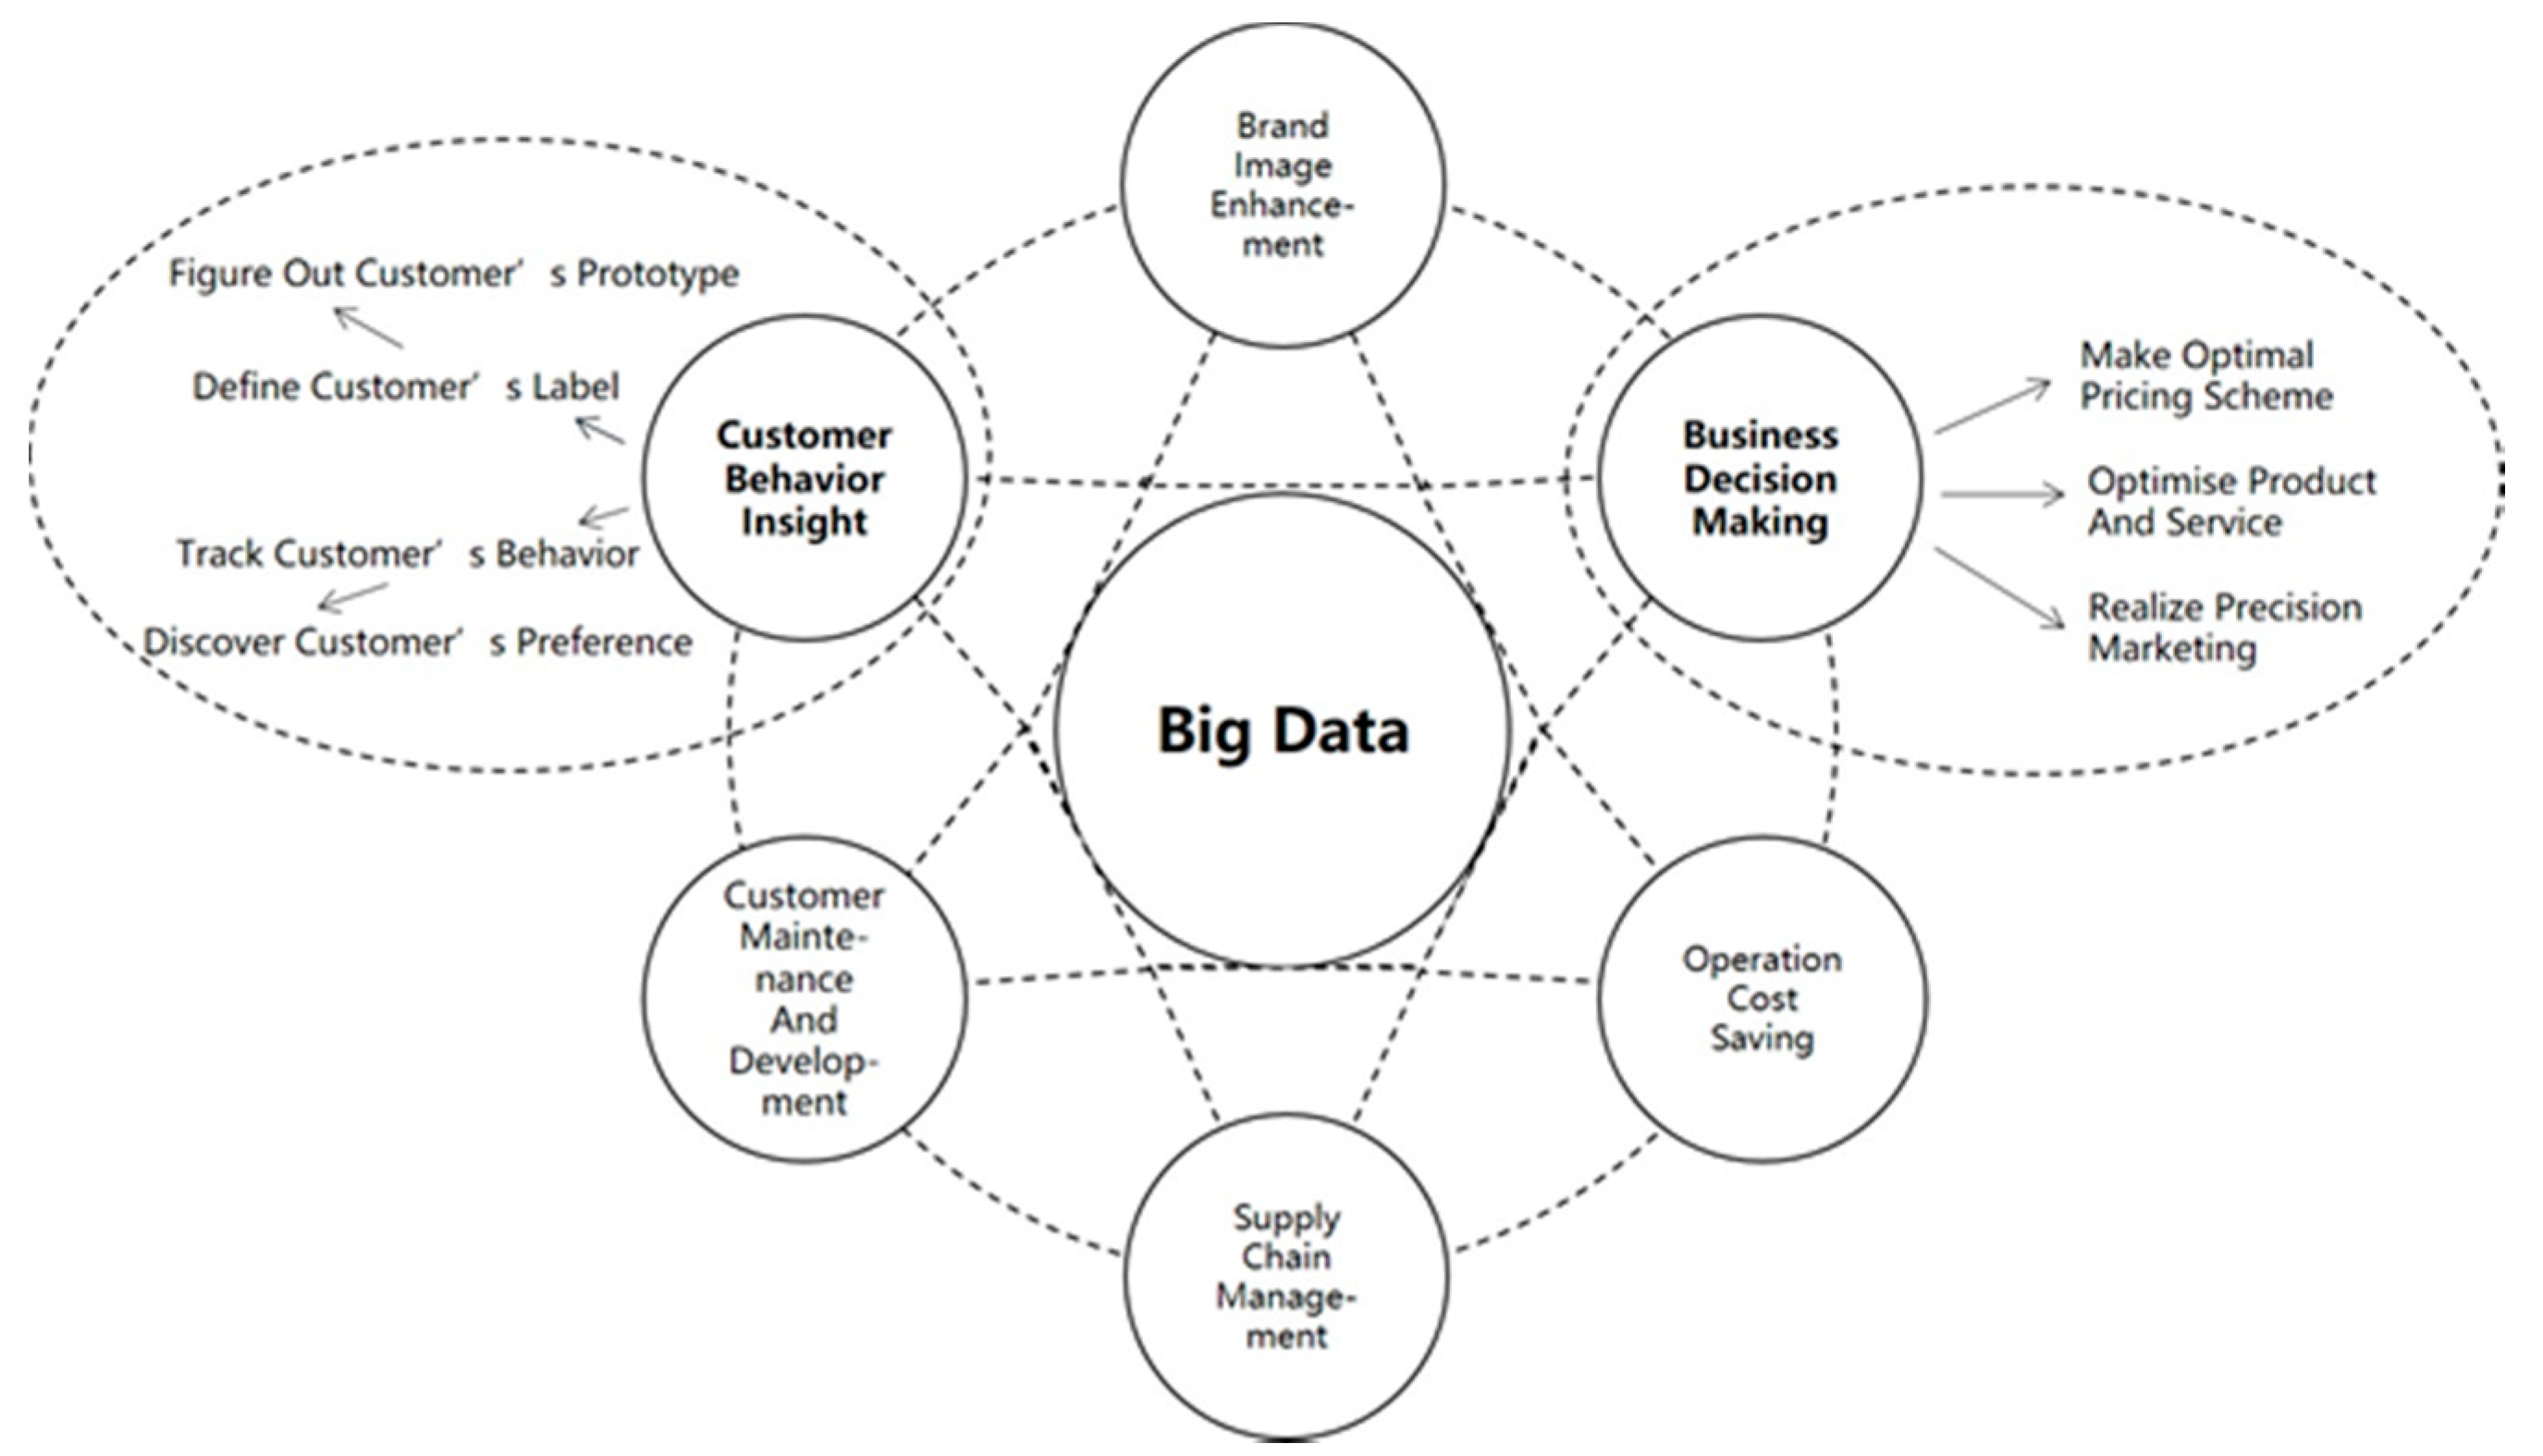
Based on the existing research, this paper combines the characteristics of digital content companies and concludes the impacts of big data on the business model of digital content companies into six elements, namely, customer behavior insights, business decision making, brand image enhancement, operation costs saving, supply chain management and customer relationship maintenance and development [19], as shown in Figure 3. Considering that user experience perception is directly related to customer behavior insights and business decision making, as it is an important data input for these two elements [20], the deployment of a big data method to collect, process, and analyze user experience data can directly promote the process and outcome of customer behavior insights and business decision making. Therefore, we regard business decision making and customer behavior insight as the focused areas of the business model design. While in the process of brand image enhancement, operation cost saving and supply chain management, user participation is relatively weak, and customer relationship maintenance is not highly relevant to user experience data, the above mentioned four areas are not covered in this article.
The impact of user experience data on customer behavior insights and the business decision making of digital content companies can be shown as
1. The impact of user experience data on business decision making
Through the analysis of market economic characteristics of user experience data, the digital content companies can grasp the dynamic and instant changes of the user’s demand and form a clear judgment of reputation and evaluation of their products. As the main contributor of company’s revenue and the main carrier of market influence, users can provide reference data for new product designs, an iterative optimization of existing products, external marketing cooperation, etc., and the efficiency and accuracy of the company business decision-making process can be improved accordingly. Meanwhile, a company’s business decision making process is likely to become more market-oriented, thus, the revenue and profit resulted by those decisions are more likely to get as close as possible to the established business goals.
2. The impact of user experience data on customer behavior insights
For one thing, when collecting user experience data, companies can follow the users’ behavior track as well as content and function preferences. By doing this, the recommendation that meets users’ personal preference of products or services can be made at the best timing. The introduction of user experience data to companies helps create a full process insight into the user behavior and adjust their products or services accordingly.
For another, analyzing user experience data assists companies to define individual attribute tags, such as interests and preferences, for targeted individual customers, which enriches the user’s basic portrait, enables marketing teams to specify targeted customer groups and improve the precision marketing results.
Based on the above analysis and the proposed CUBI-C2B model, this paper aims at promoting the digital content business model to achieve two major capability enhancements: one is to enhance the product revenue performance by applying user needs data to the business decision-making process; the other is to enhance the product competitiveness by adapting the user experience data to user behavior insights.
3.3. A Roadmap of User Experience Data Driven CUBI-C2B Model
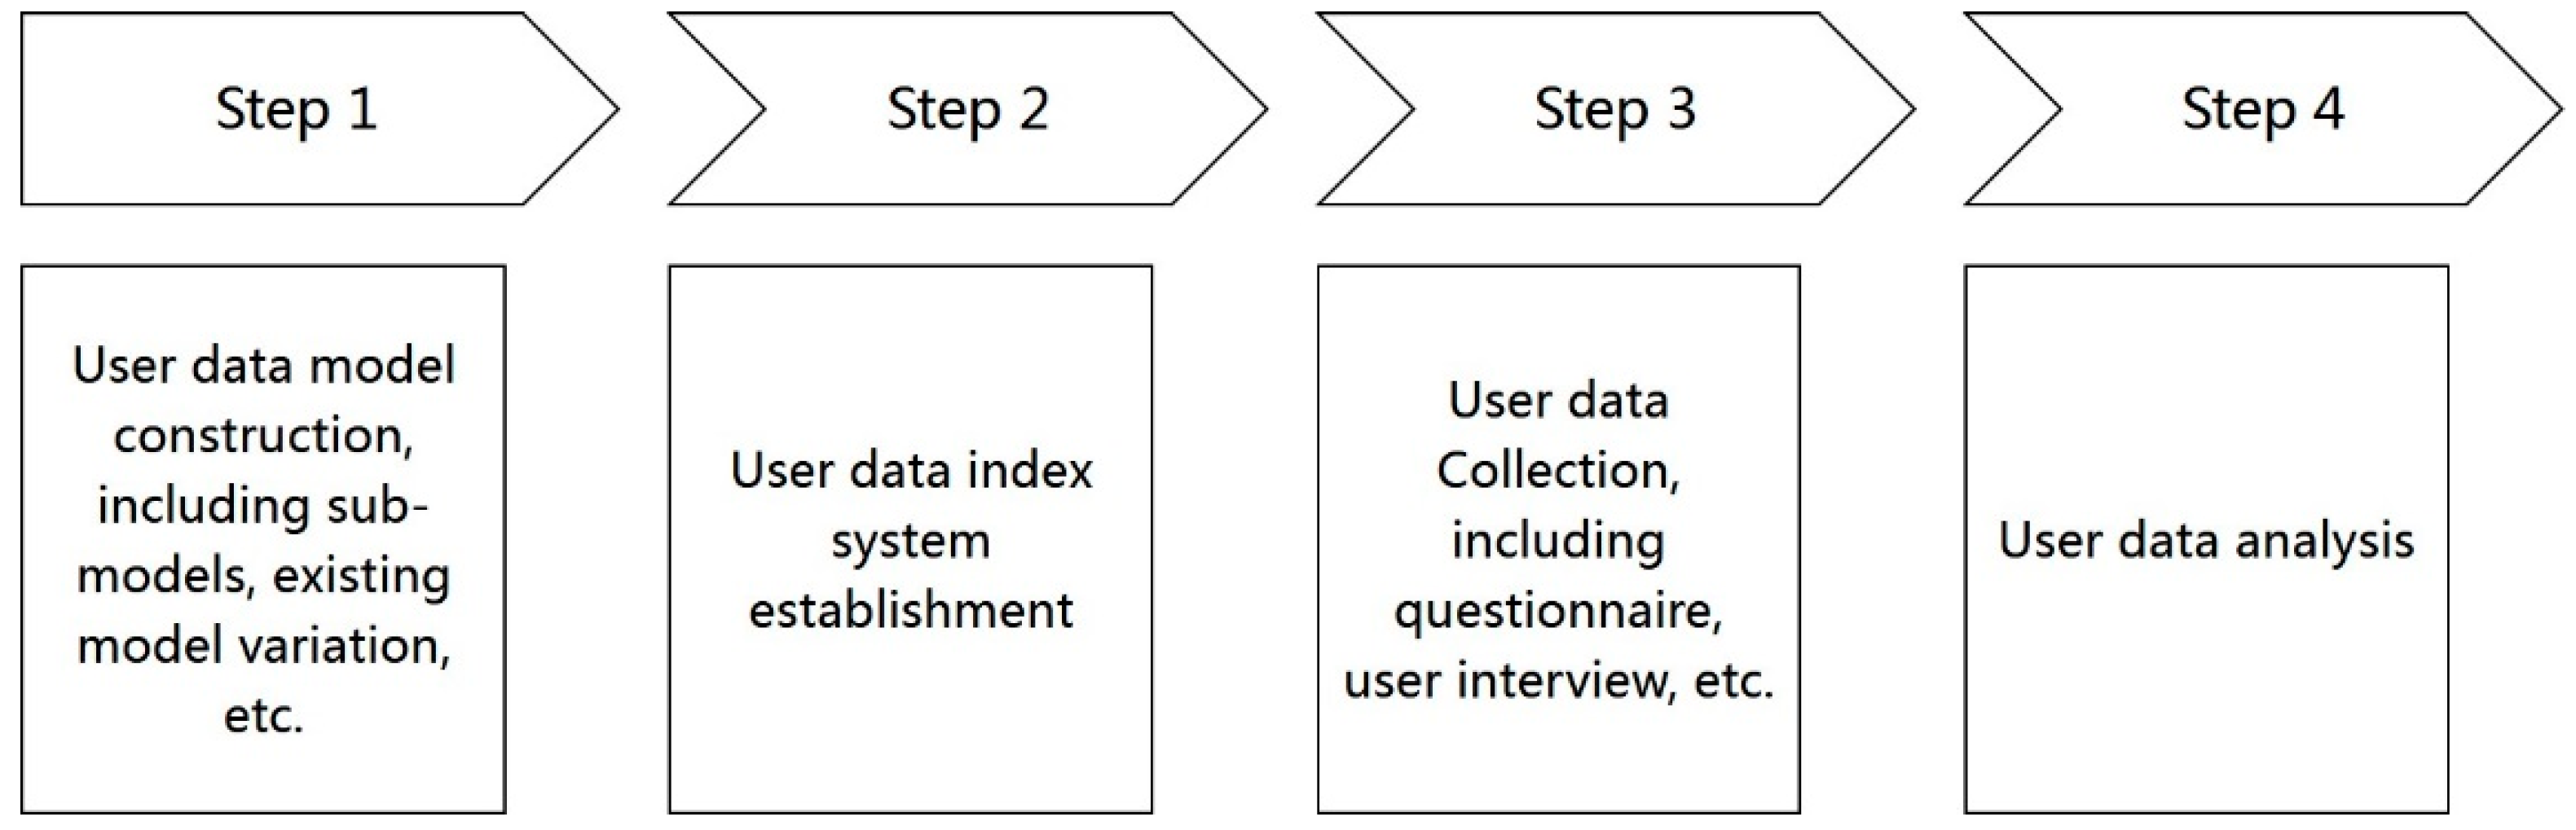
Based on the modified CUBI-C2B model in Section 3.1 and the application area analysis in Section 3.2, we designed the roadmap of the CUBI-C2B model in content business decision making and customer insight into four steps: (1) user data model construction, including sub-models construction and existing model variation according to the application scenario; (2) user data index system establishment, which specifies the user data type and definition; (3) user data collection, which includes methods such as the questionnaire and user interview; (4) user data analysis, which produces outcomes that can be used as a reference for content business making and customer insight. (Figure 4)
4. CUBI-C2B Model for Digital Content Companies Based on User Experience Data
In this section, we put the user experience oriented CUBI-C2B model proposed in Section 3.1 into practical use for digital content companies. As concluded in Section 3.2, the two promising application areas for big data-based models are business decision making and customer behavior insight. Therefore, we specify the application of the CUBI-C2B model in the content-related business decision making phase in Section 4.1, so as to assist digital content companies to achieve their product revenue goals. We further conducted a detailed application method design of the CUBI-C2B model in customer behavior insight in Section 4.2 with the purpose of achieving the product ability goal for digital content companies.
4.1. Achieving Product Business Goals with User Content Needs Data
Based on the designed roadmap in Section 3.3, the content business decision making activity is carried out in Section 4.1.1, Section 4.1.2 and Section 4.1.3.
4.1.1. User Content Needs Model Design
This paper decomposes the user’s content needs model of digital content products into two sub-models, namely, the user attribute model and user content preference model.
The user attribute model is defined by the demographic and psychological characteristics of users. The demographic characteristics include the user’s gender, age, education level, occupation, income, location, etc., comprehensively depicting the user’s basic attribute information [21]. The psychological characteristics include the user’s personality, hobbies, lifestyles, etc. On the basis of user basic information, the psychological description is made by the individual differences of users with psychological characteristics [22].
The user content preference model examines the user’s preference for content types and aims to establish a direct link between the user needs and digital content products [23,24,25,26,27,28,29]. This paper further decomposes it into historical behavioral preferences and usage scenario behavioral preferences. The former preference is the statistical result of the user’s past usage behavior with regards to different types of content, while the latter one is the specific content needed to satisfy their personal emotions (such as pleasure, worry, relaxation, etc.) in specific usage scenarios (such as commuting, solitude, etc.) [30,31,32,33,34,35,36].
The process of designing and generating digital content products is also the process of focusing on the target users to fulfill their content needs. Therefore, by establishing a user content needs analysis model, this paper helps product designers think from the user’s perspective, explore the driving factors behind the user’s behavior, and create products and services that are highly compatible with the user’s needs.
4.1.2. User Content Needs Index System Establishment
Taking influencing factors of the user needs model into consideration, this paper creates a digital content product needs model index system based on user’s demand data, which consists of four elements: accuracy index, authenticity index, payment index, and pleasure index.
The interest index indicates the interest level that users show towards a certain type of content. Obtained from the early stage of user journey, we set the interest index as a quantifiable degree that users express when getting to know the content offered to them through a simple introduction, such as title, cover, storyline, trailer, and demo. It is a highly objective “first impression” towards the content creator’s work, often influenced by topics and trends in social media, user’s previous experience and preference, surroundings, scenarios, and so on.
The authenticity index indicates the true extent of the content satisfaction that certain content products deliver to users. Contrary to the interest index, we set the authenticity index as a quantifiable degree that users express at the end of the content using journey. Being also highly objective, the authenticity index is an afterward self-evaluation that users conduct when weighing the value of the content product. It can be defined as the ratio between the users’ initial content expectation and the actual degree of satisfaction towards it after the user journey [37]. The results of the authenticity index can vary greatly among individuals or even through time, showing a high level of uncertainty and instability.
The payment index is examined by the likeliness of users to pay for the product or service after a trial use. By setting up payment index, the intrinsic incentive degree of products to users’ consumption intention can be measured and the users’ motivation for consuming can be enhanced.
The pleasure index reflects the user’s satisfaction level through the process of product using. It is directly related to the user’s motivation, behavior, and use environment. The pleasure index is collected and quantified by evaluating the content’s direct impact on the user’s mood and spirit through research by means of surveys, interviews, and etc.
4.1.3. User Content Needs Data Collection and Analysis
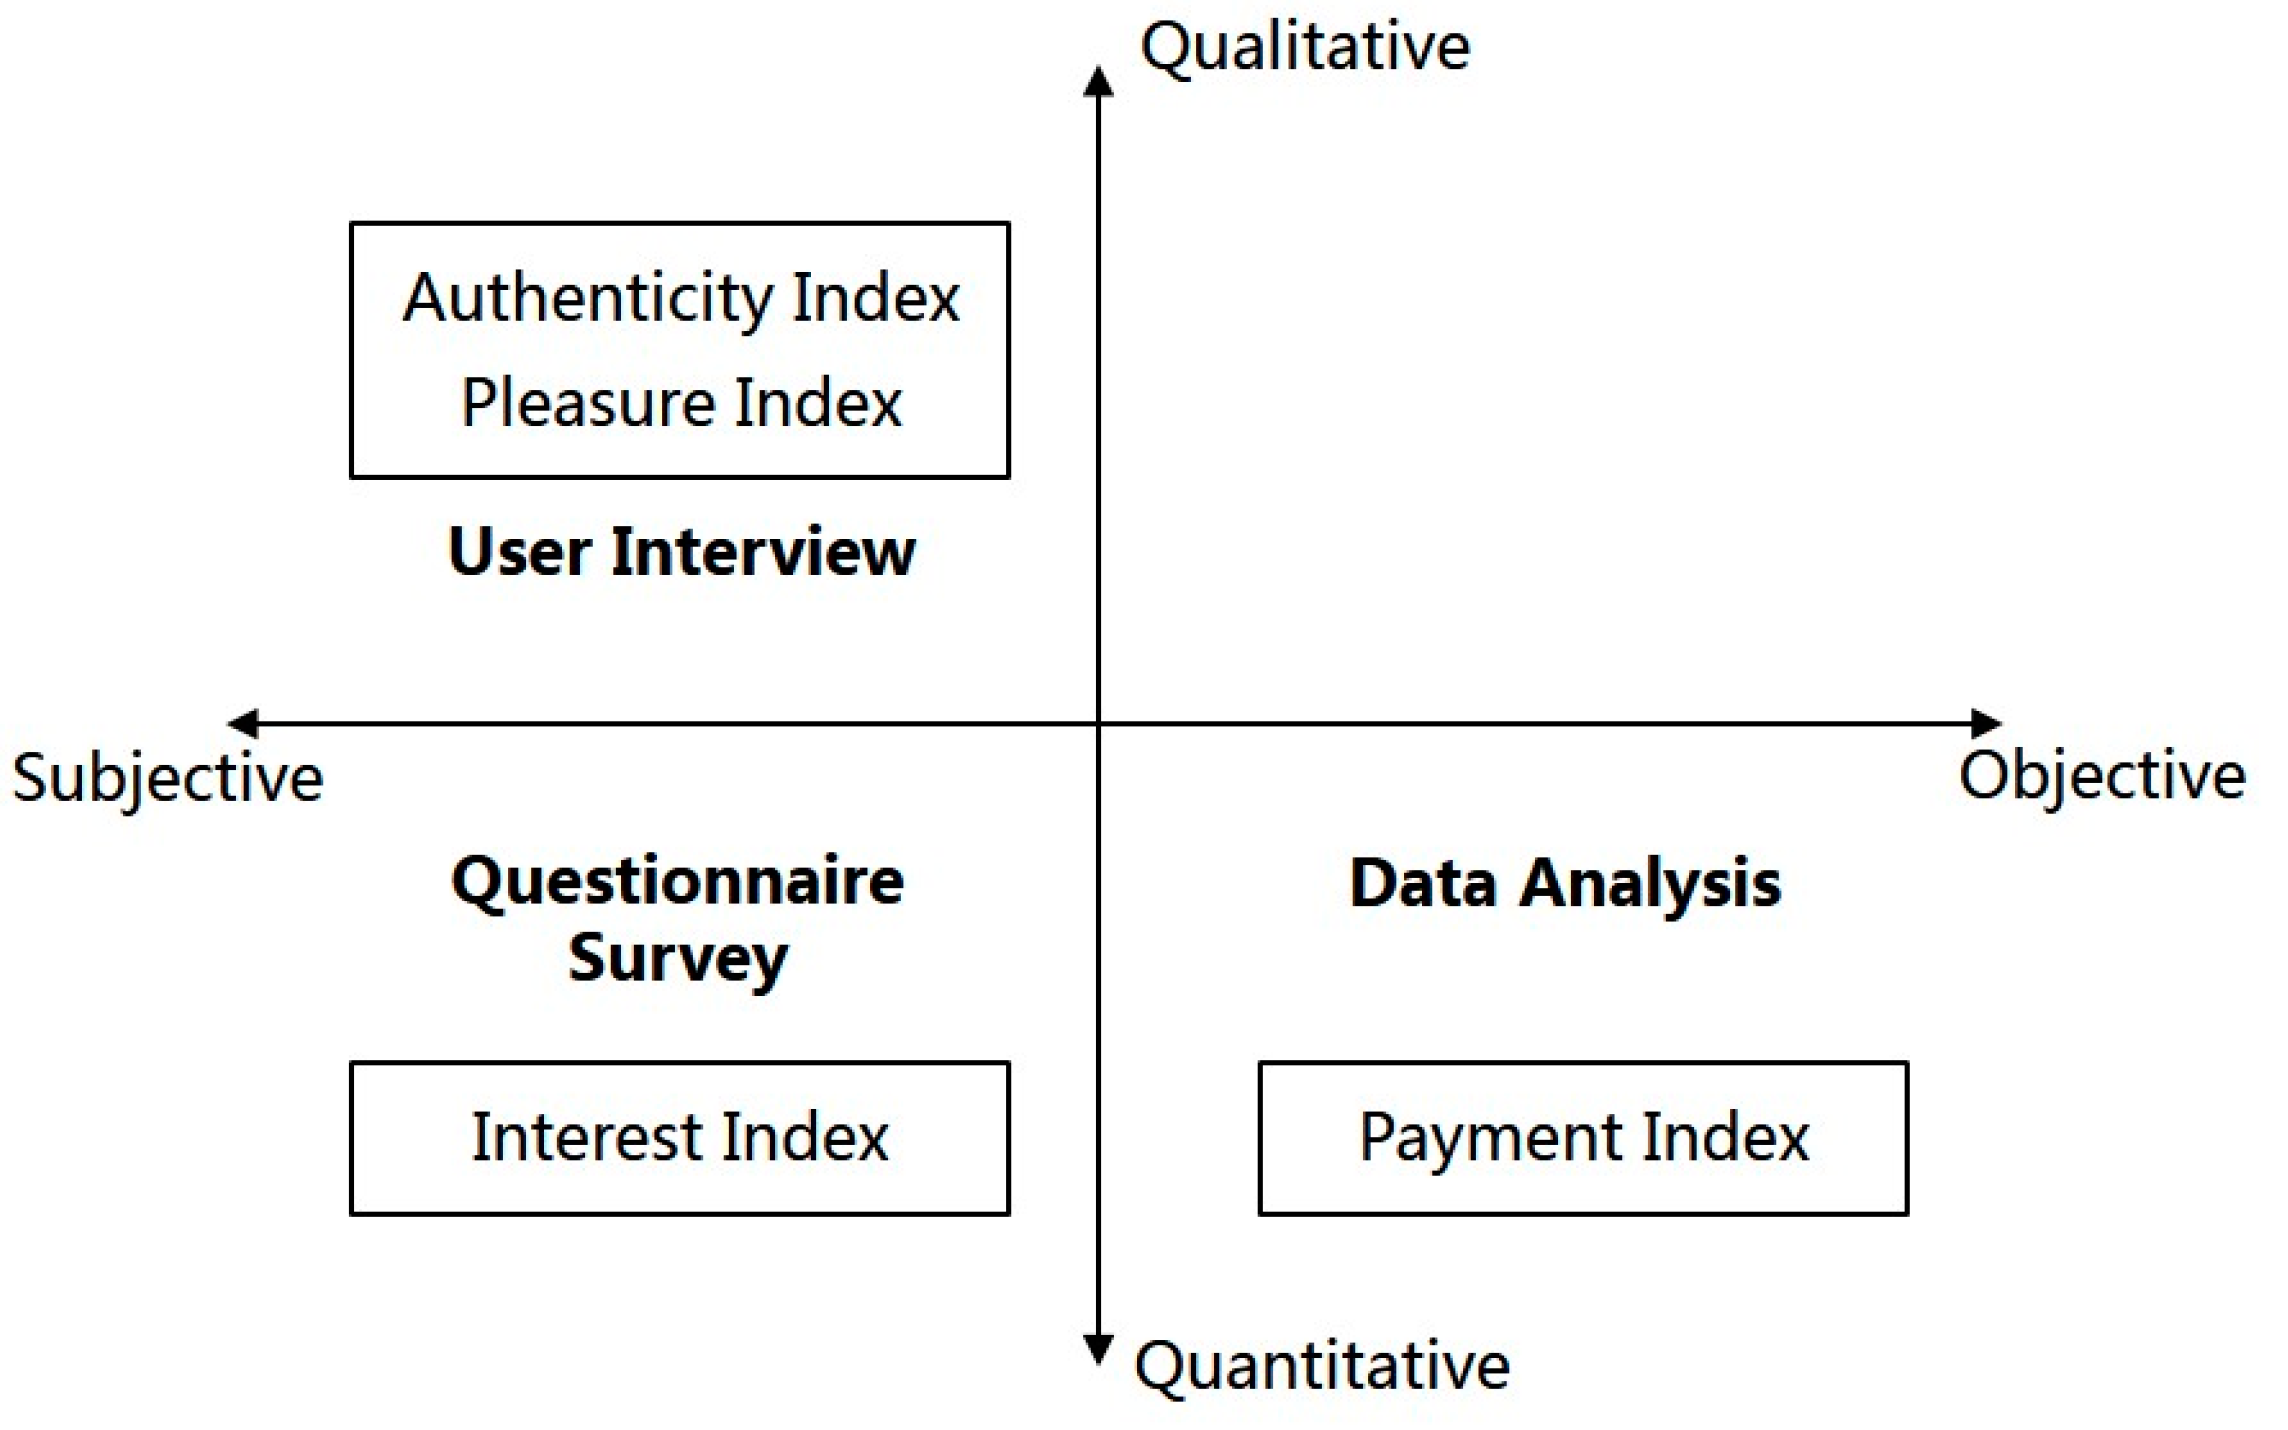
Looking into the attributes of each index in the proposed user content needs model, the conclusions can be made as follows: the interest index, pleasure index, and authenticity index all reflect the users’ subjective evaluation of products, but are collected at different stages of the user journey. The interest index is set to be obtained at the beginning stage, therefore a simple questionnaire survey can be applied to collect the data for this index, which offers a glimpse of the user’s feedback towards a certain type of content or a specific product. The authenticity index is designed to be obtained at the end of the user journey, while the pleasure index covers the complete length of the user journey, thus, an in-depth, thorough, face-to-face user interview is required to form an accurate judgment of the user’s pleasure level and satisfaction authenticity level. The payment index combines the user’s motivation and willingness to pay for the product, which results from the user’s quantitative evaluation and can be obtained by analyzing the user’s payment behavior and records data. Therefore, the collection of the user needs model index data requires an integration of qualitative, quantitative, subjective, and objective research methods. The data collection methods for user’ digital content needs are shown in Figure 5:
Due to massive but fragmentary information on the Internet, users have become the core of the entire C2B model. In the C2B model, users are deeply embedded in the company’s content production and operation process. They create values by fully participating in the company’s content incubation, production, promotion, sales, customer service, and other areas. A typical application of market-oriented pricing for digital content is the “demand aggregation model” in C2B style. In the demand aggregation model, the company concentrates on the scattered and differentiated user content requirements through pre-sales, collective group purchases, etc., to find common content needs points. The content is produced based on the analysis results which meet the common expectations of general users to a high degree. For companies, the cost of copyright purchases and original content making is likely to be reduced while risks and losses can be avoided. There are two reasons for this. Firstly, companies can produce content whenever they need it without waiting, which greatly reduces the cost of original content incubation. Secondly, under this mode, users are required to pay part of the fee for content subscriptions to companies in advance, which helps companies to lock in part of revenue, reducing the potential risk of poor market sales to a minimum.
In order to verify the effectiveness of the proposed model, we cooperated with a local digital music company which ranks in the top 10 in the mobile music market in China according to the user number. Voluntary and anonymous user participation was later demanded during the process of user content needs data collection. All three above mentioned data collection methods, questionnaire survey, user interview, and data analyses, were utilized during our model verification process.
Questionnaire Survey: The questionnaire survey was conducted online on Wenjuanxing, China’s biggest online survey platform. It consisted of three types of questions. The first type is the user’s basic feature questions, including gender, age, education, occupation and operating system of their phones. The second type is the user’s general content interest-related questions. In this part of the survey, we asked participants about their music interests based on previous habits, of which questions included the music genre and region preferences. Fewer than 3 choices were allowed to be accepted for questions about music genres and only 1 choice was allowed for the question about the music region. In the last part of the online survey, we displayed a list of potential music artists that the company was considering to introduce in according to the chosen music genre and region, and asked user’s to grade their interest level towards these artists’ works with a score ranging from 0 to 10 (0 means with absolutely no interest, 10 means extremely interested). If multiple choices were given by the user in the music genre question, each genre chosen would have a corresponding artist list offered to the user. We recorded the artist’s content interest index i as the average interest level score from users.
Overall, a total of 1227 users participated in the content needs survey. Among them, 917 questionnaires were effectively distributed, 588 of which were used for the interest index analysis. A total of 329 questionnaires were discarded due to the incompleteness and logic contradiction of the answers provided. The personal features of online survey participants of user content needs survey are shown in Table 1.
User Interview: The user interview was hosted in an offline 1-on-1 format, all of whom participated in the previous music interest questionnaire survey. A total of 50 users participated in 1 h long user interviews organized by us. We first categorized the users according to their music taste preferences which they indicated in their submitted questionnaire. Later, the participated user was given a playlist on a smartphone with 50 songs from the 5 candidate artists in their chose music genre and region (10 songs from each artist). Without giving any hint, the user was asked to play 10 songs from the list in a 30-min time period during which they were left alone in the meeting room without any environmental disturbance. One music artist’s content needs authenticity index was later calculated according to the number of times and duration that their songs were played by the participating users. We set 10 times and a 30-min duration as the 10-point score. Each artist’s content corresponding authenticity index a was obtained by a linear proportion when comparing their songs’ actual played times and duration to the maximum value.
At the end of the interview session, the interviewer rejoined the user to discuss their mood status after listening to a certain artist’s songs. The user was asked to evaluate their pleasure level for each artist’s songs after listening to them with a score ranging from 0 to 10, which was recorded as each artist’s content pleasure index p. If a certain artist’s songs were never played during the 30-min session, their content pleasure index p was automatically recorded as 0.
Data Monitoring and Analysis: After gaining permission from a group of users to utilize their within-APP data for analysis, we observed those users’ payment related data on the company’s BOSS (Business & Operation Support System) platform. The collected data included the user’s purchased album list, average subscription payment value of each purchase and payment frequency . If the candidate artist already had previous works in the media library of the company’s music APP, their payment index p is calculated as after going through all the users’ purchased album lists and averaging the ones with corresponding purchased records. Otherwise, the candidate artist’s payment index was obtained from sales records from the outside platform and converted to the same value range as the first kind.
Results: The online questionnaire survey results are shown in Table 2.
According to Table 2, a certain music artist’s target user group percentage can be calculated as , where is the user distribution percentage for the music genre this artist represents, and is the user distribution percentage for the music region this artist is from.
Take “Mainland China”—“Pop Music” as an example, the score results of the listed artists from the users and their corresponding interest index are shown in Table 3:
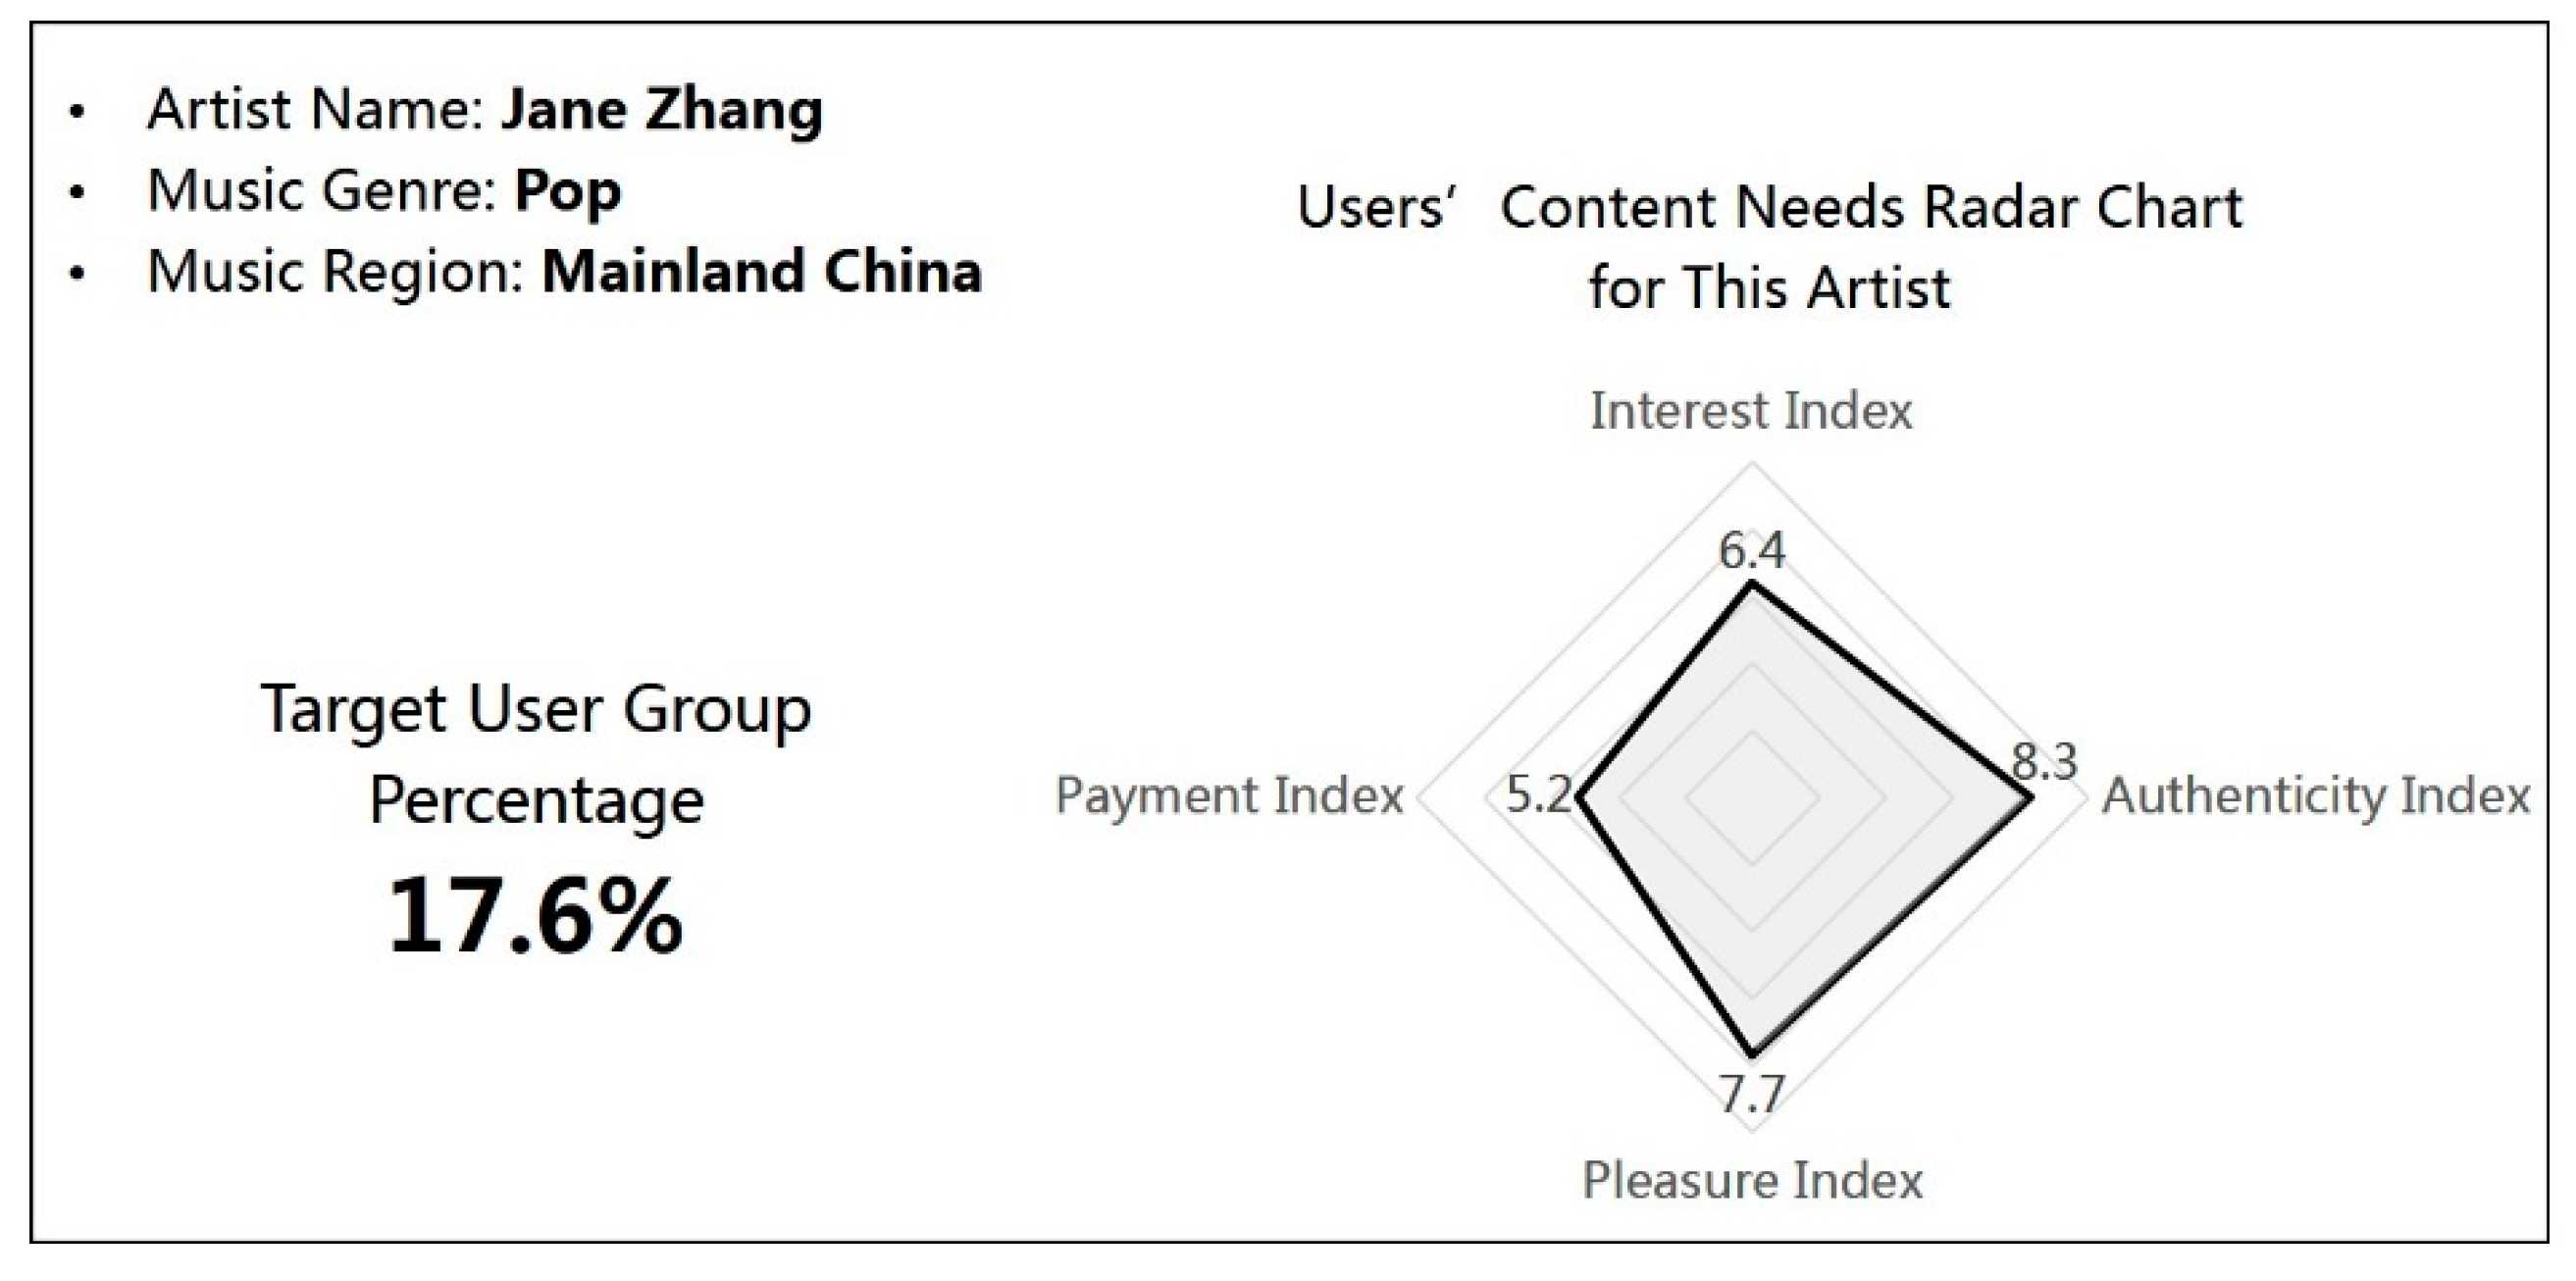
At this point, user data related to the four indexes in the proposed content needs CUBI-C2B model were all collected and transformed into the index required for analysis. We, therefore, built a comprehensive content needs profile for each candidate music artist, which illustrated the four content needs index in the form of a radar chart with the previously calculated target user group percentage . Figure 6 shows an example result of such profile.
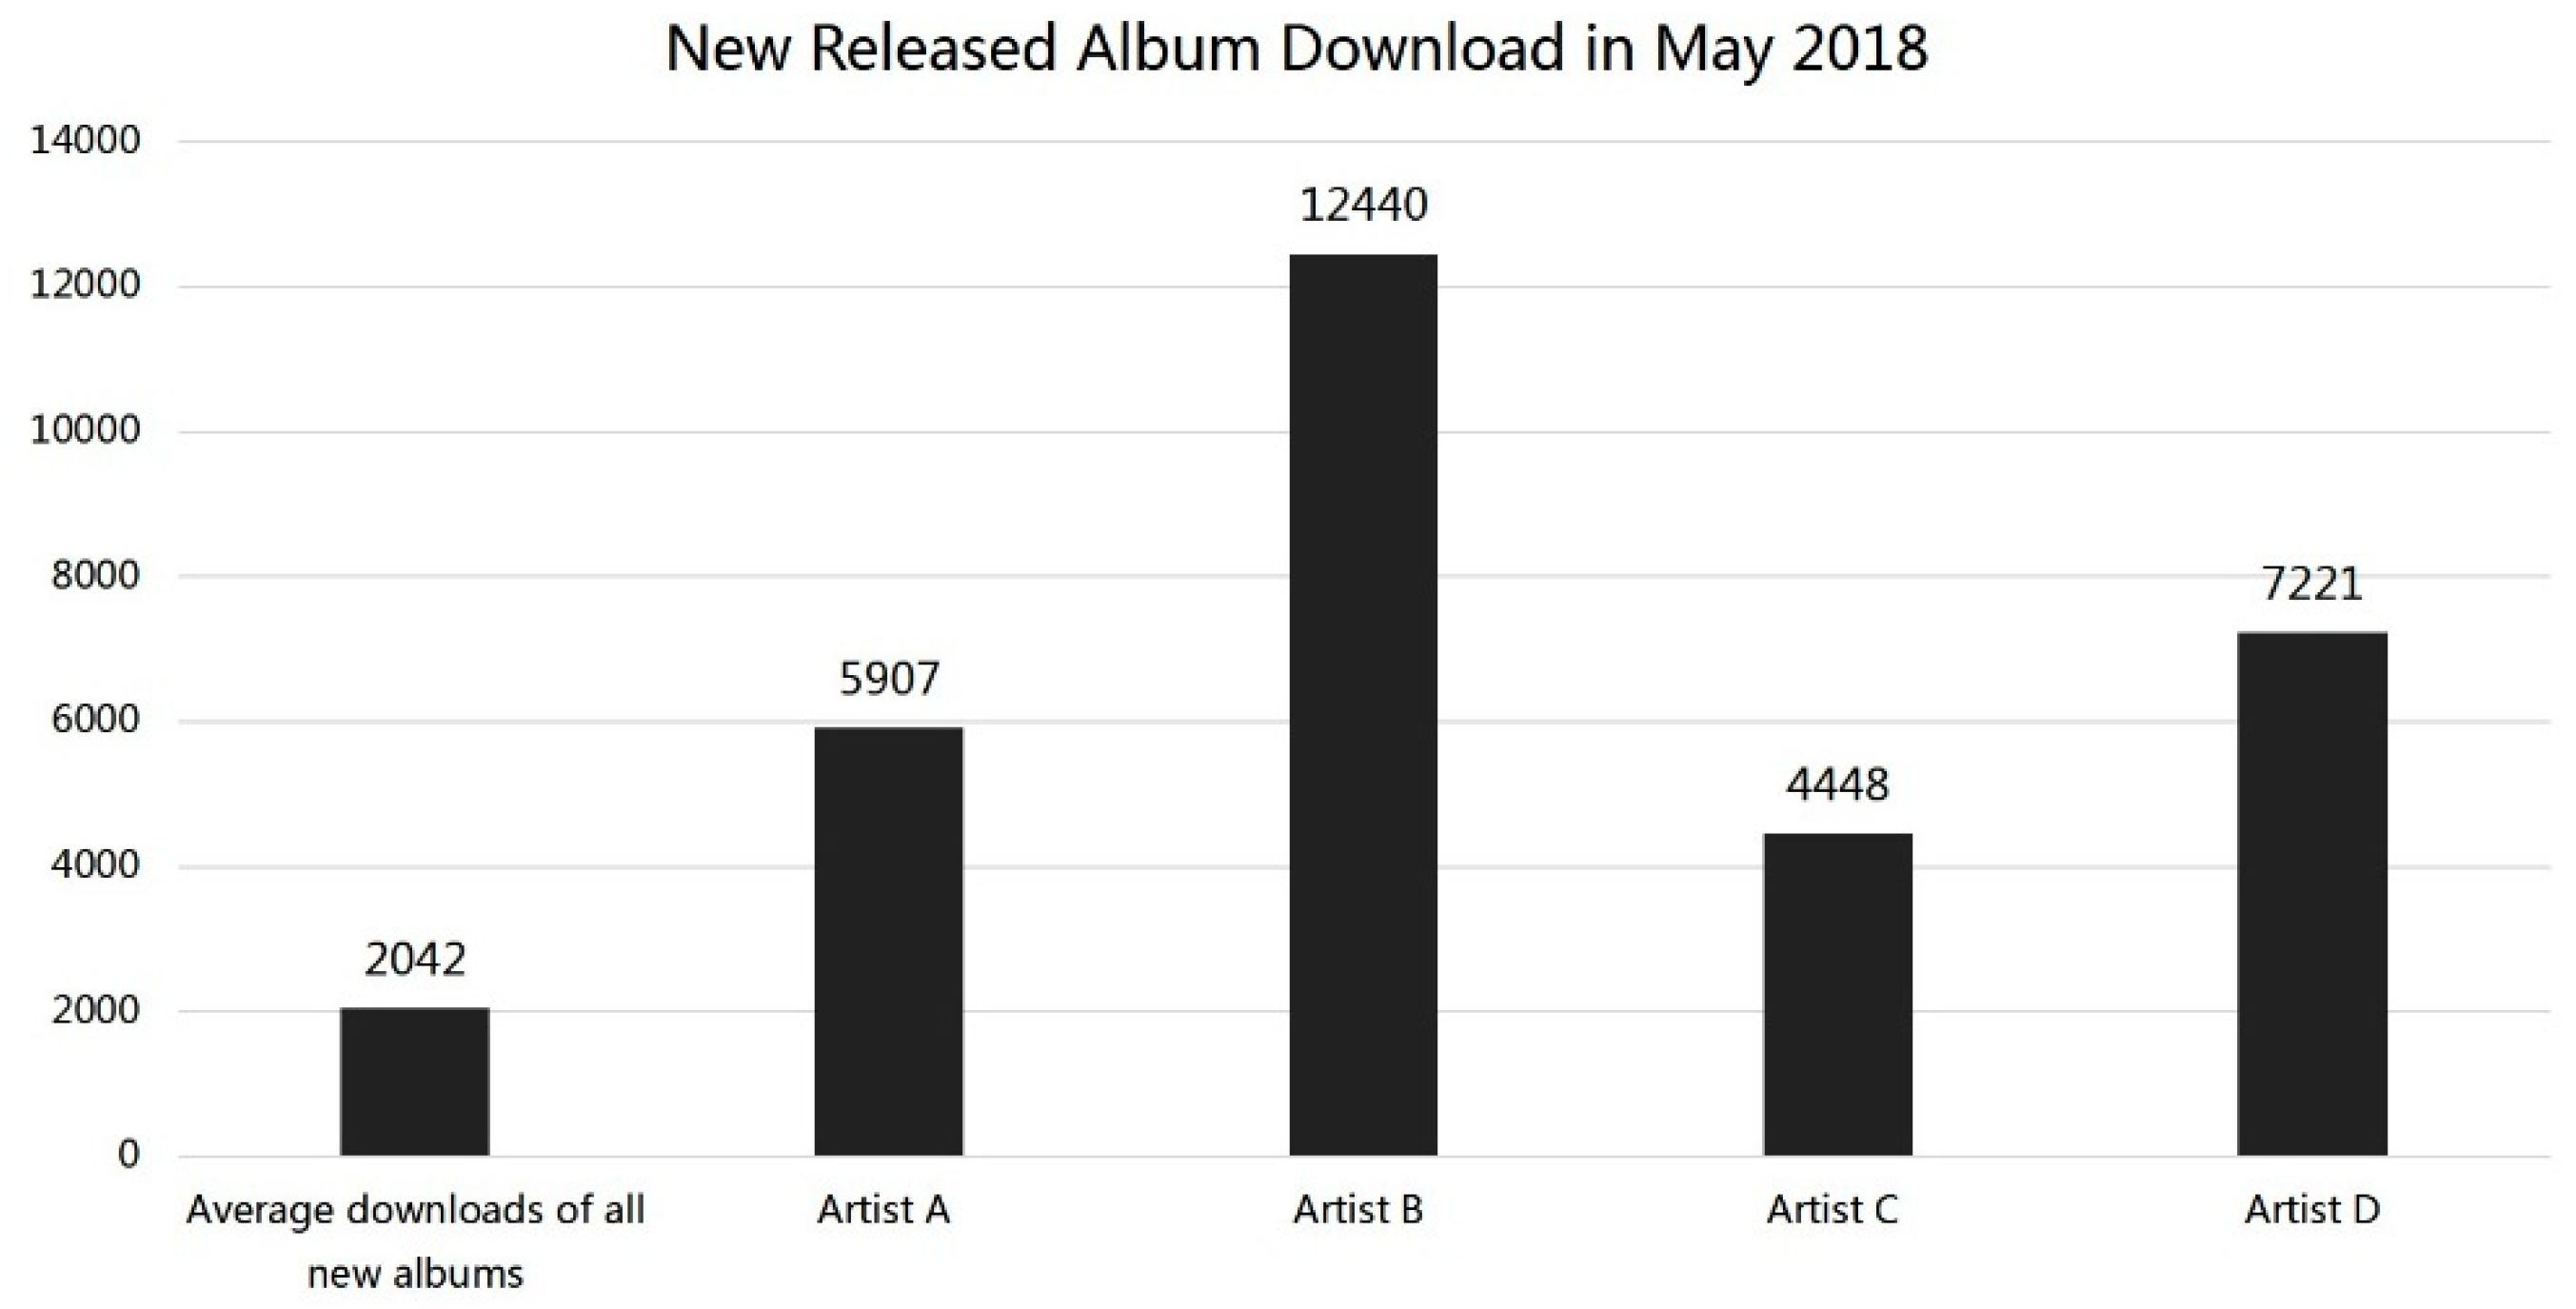
The proposed CUBI-C2B model was introduced into the company’s music album copyright purchase process together with the content needs profile analysis results. According to the overall index and target user group percentage results such as Figure 6, the company conducted a trial copyright purchase attempt at the top four candidate artists’ new album of pop music and observed their digital album downloads performance. The performance result is shown in Figure 7.
The introduced artists A, B, C, and D, according to the user content needs model analysis results, all released their new album in the time period of 15 April to 30 April. According to Figure 7, their new album downloads records were respectively 2.9 times, 6.1 times, 2.2 times, and 3.5 times of the average downloads of all new albums released in the same time period on the platform, which all contributed a significantly higher album purchase revenue than normal from users, proving the effectiveness of the proposed CUBI-C2B user content needs model.
4.2. Achieving Product Ability Goals with User Interaction Perception Data
Based on the designed process in Section 3.3, we carried out a customer insight activity in Section 4.2.1, Section 4.2.2 and Section 4.2.3.
4.2.1. User Interaction Behavior-Perception Model Design
The process model for user interaction behavior is often simply summarized as a single path [38]. Although this model has a high integrity, it does not take the impact of users’ own attributes on the experience process into full consideration. Based on the user’s historical behavior, this paper subdivides the user interaction behavior-perception model into two different types of paths as shown in Figure 8, corresponding to groups of new users and existing users. In the proposed model, there are obvious differences between the two paths of the user interaction behavior model. The interaction behavior-perception path of the new user is divided into seven segments: cognition, interaction, agreement/acquisition, consumption, support, reward, and subsequent sharing/recommendation/re-purchase/departure, while the experience behavior-perception path of an existing user starts directly from the support segment, skipping the first three segments due to previous knowledge of the product. A new user is also more likely to repeat the first three segments of their interaction behavior path to form a general impression of the product and reach the same level of product awareness as an existing user.
4.2.2. User Interaction Behavior–Perception Index System Establishment
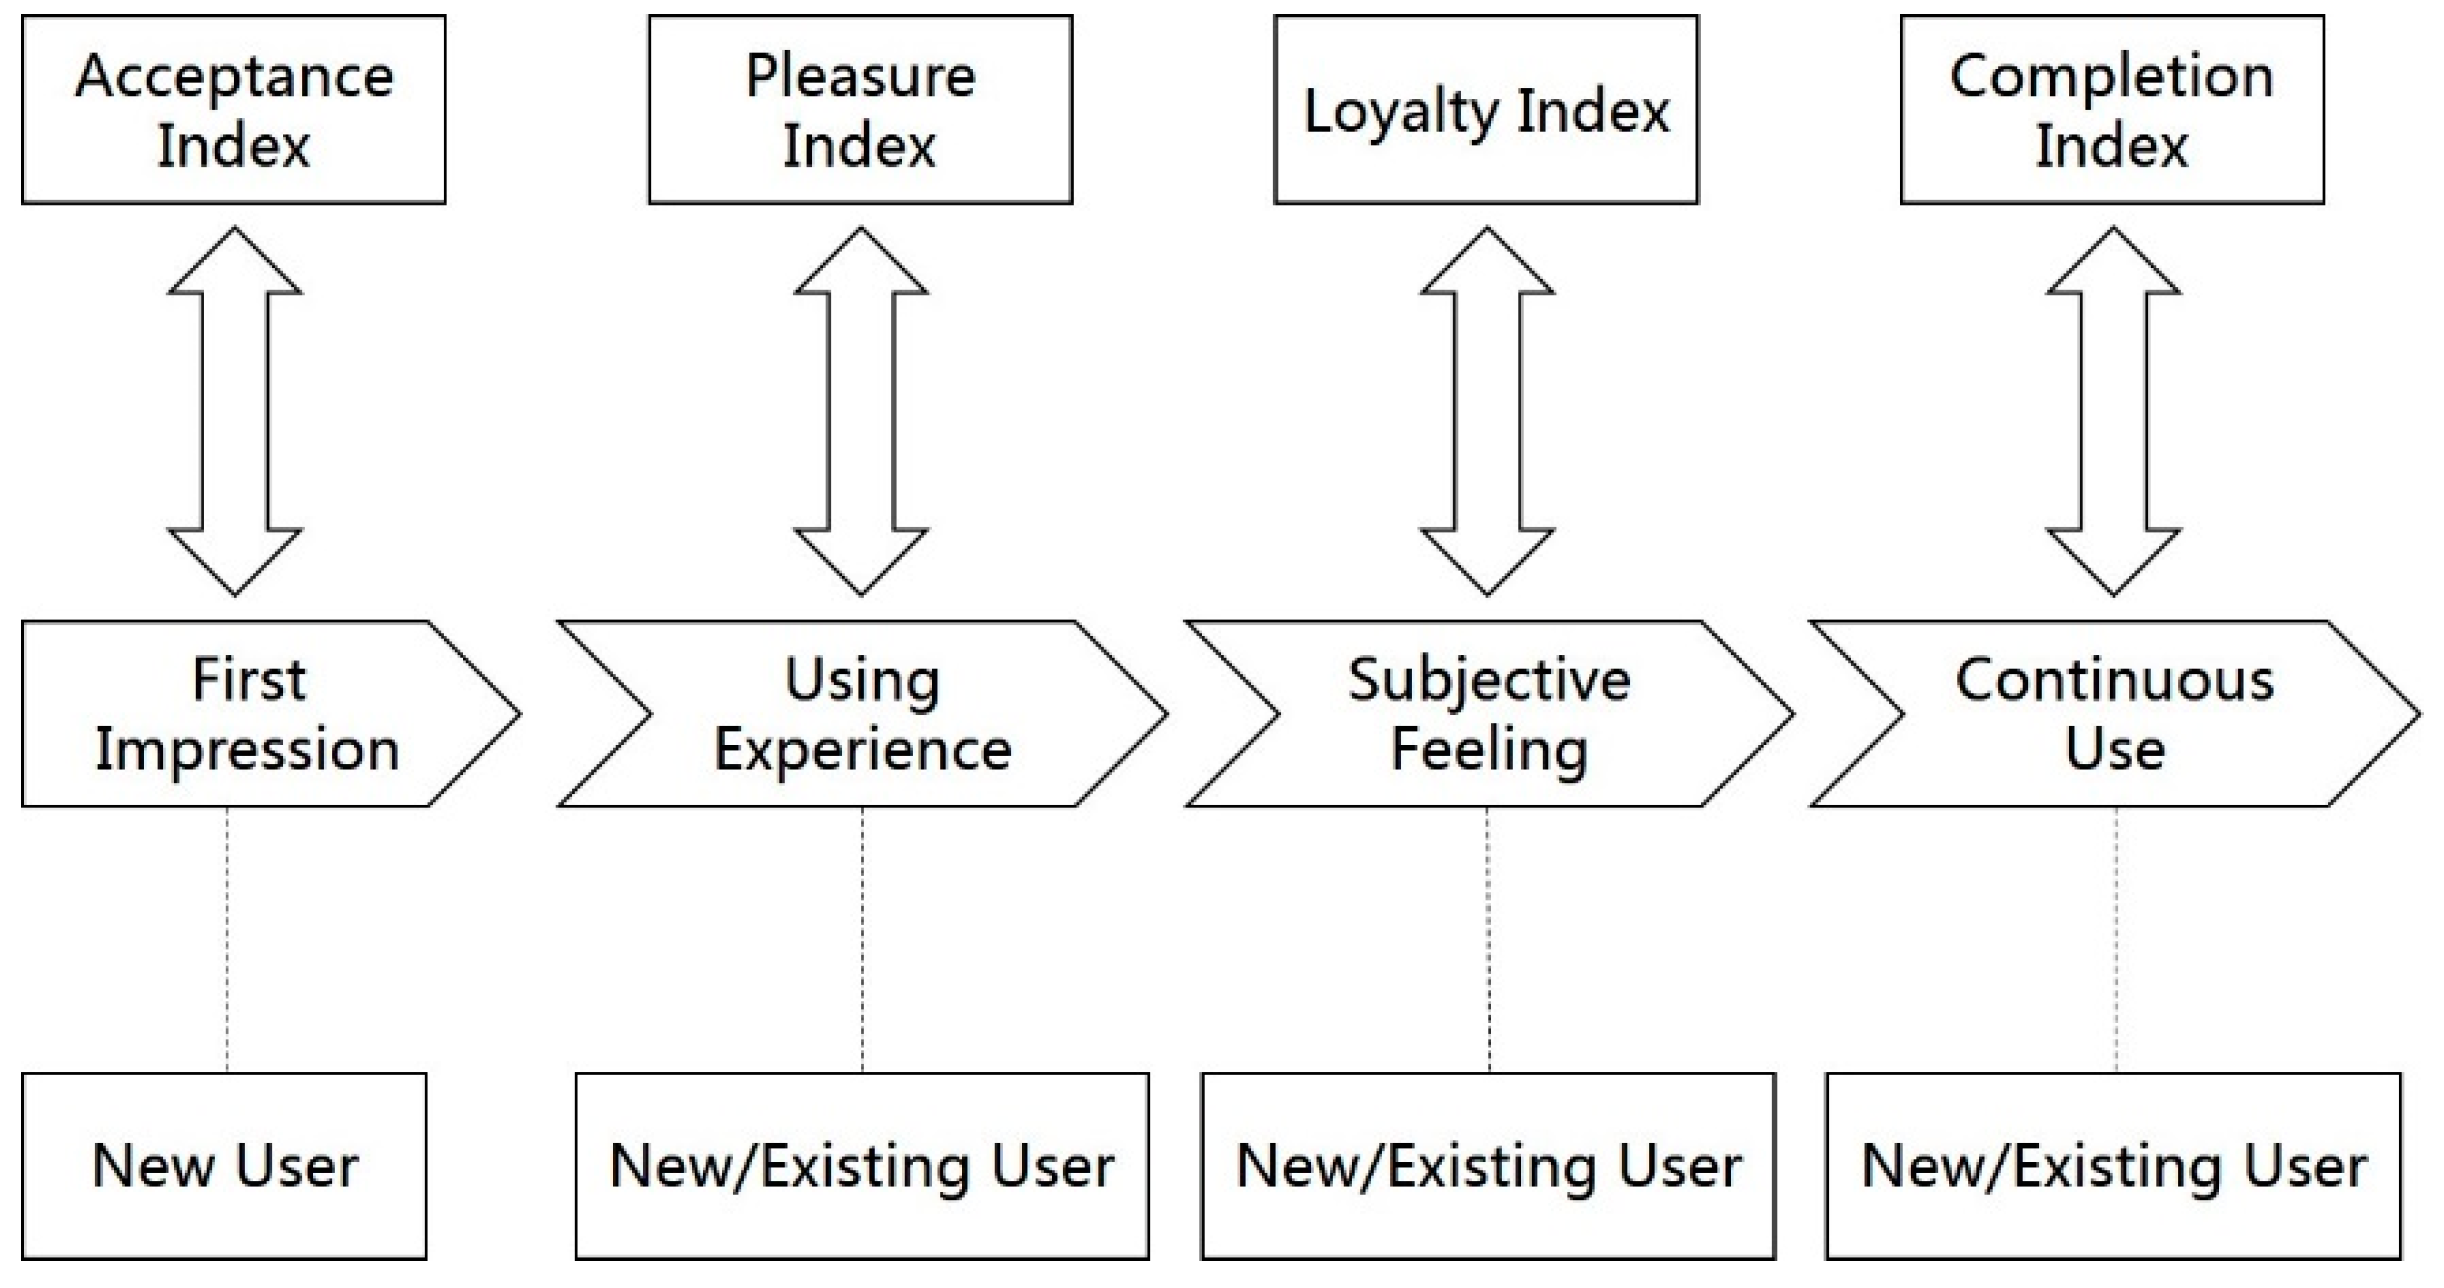
The proposed user interaction behavior-perception model consists of four indexes: acceptance index, pleasure index, the loyalty index, and the completion index. Figure 9 depicts the correlation between the four indexes, user groups, and user journey.
As shown in Figure 9, the acceptance index is designed to be collected from new users. It refers to a user’s understanding and acceptance of interactive functions. It is the new user’s first impression of the product. Data are collected during the cognitive and interactive stages of the user’s lifecycle.
The pleasure index is collected from all users. It is the subjective perception of users to buy, use, and give feedback on products and services. It usually involves product interface aesthetics, ease of use perception, value-added services, and other factors. The collection phase of this indicator includes “agree/accept”, “consumption”, “support”, “reward”, and “share/re-purchase/leave”.
Collecting from all users, the loyalty index is user’s biased behavioral response to the digital content product, the featured services, and brands. The typical performance of this index is that a user is highly active while using the product and purchases products from the company multiple times afterward. The scope of the index collection includes three segments: “support”, “reward”, and “repurchase”.
The completion index is also collected from all users. It shows the procedural experience of users completing within APP actions, including qualitative indexes such as time on the page, the probability of browse failure, etc. The index collection scope includes “agree/acquire”, “consumption”, and “support”.
4.2.3. User Interaction Behavior–Perception Data Collection and Analysis
There are two main sources of user interaction behavior data that can be collected from digital content products: one is the user’s trace data inside the product, which can be monitored by embedding the “buried point”. The breakpoints and pain points of usage can be pinpointed through the intelligent analysis of such data. The other is a user’s experience-perception data. By adopting methods such as a questionnaire survey and user interviews, companies can collect user’s experience level quantitatively and aggregate specific facts of user experience qualitatively to form a detailed insight of each user’s true experience perception.
According to the characteristics of these two sources of data, this paper proposes the following two data collection methods:
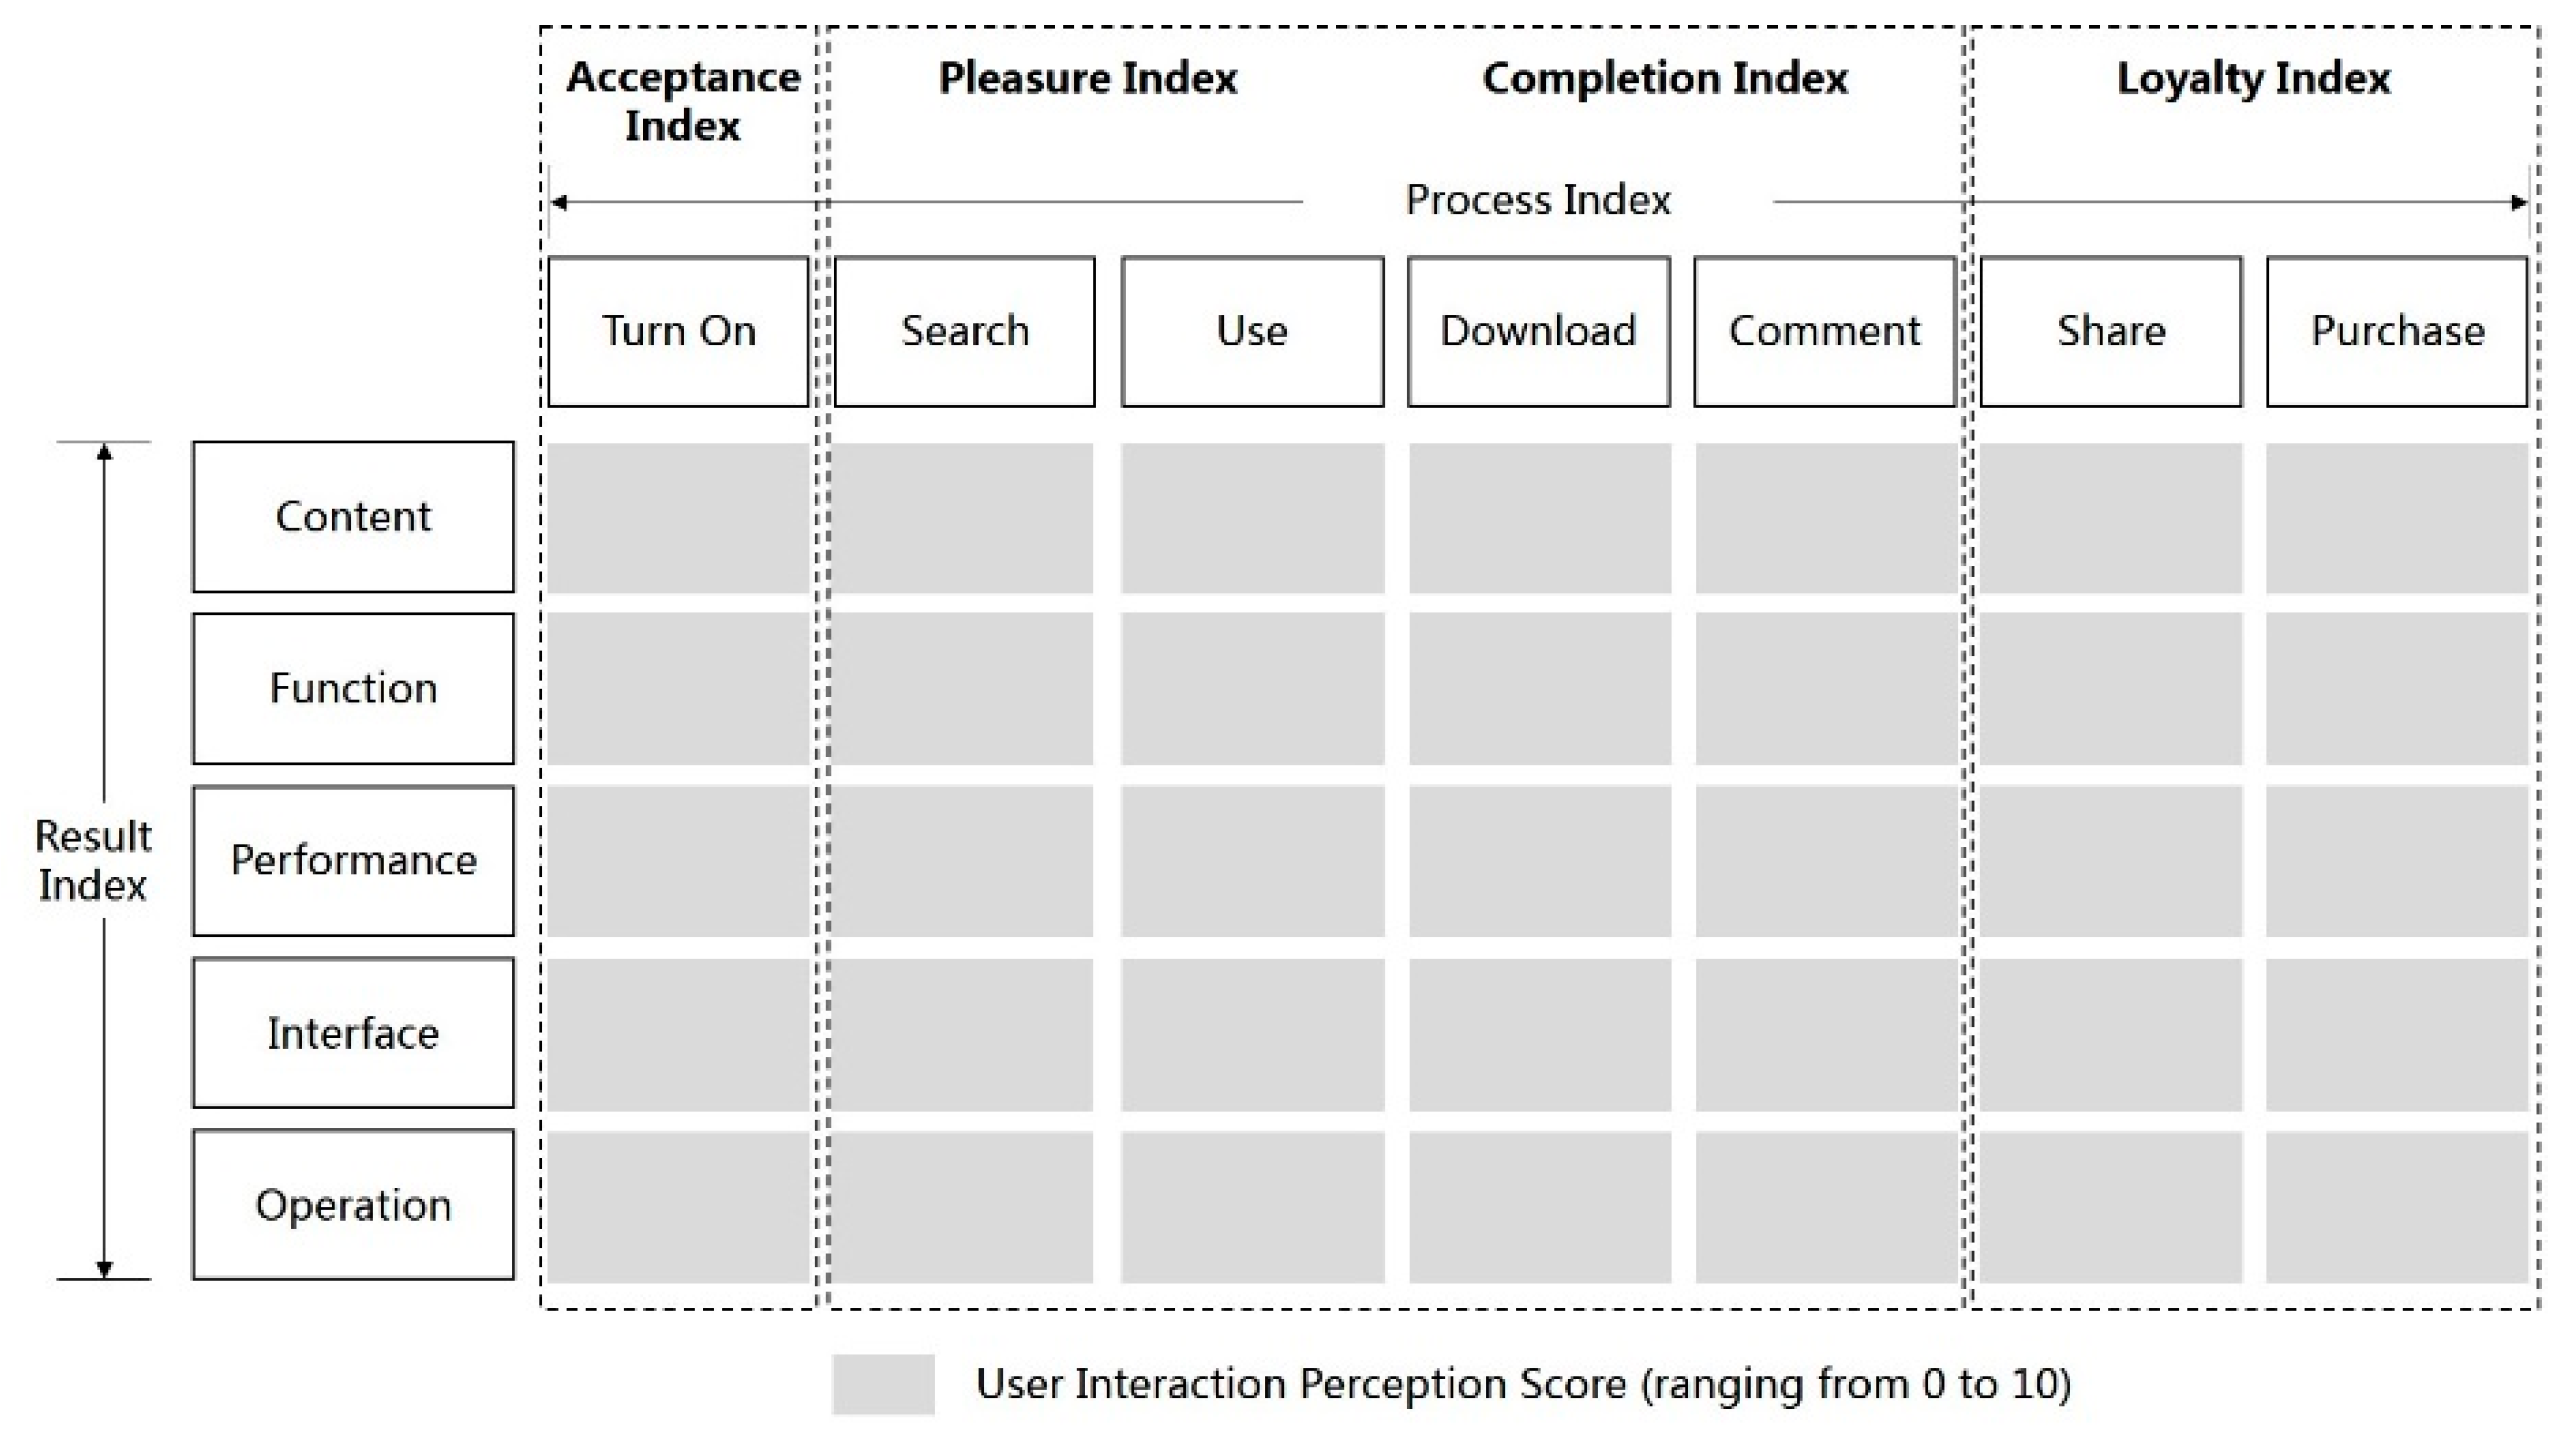
Method 1: user perception survey. The user experience survey can be conducted in two forms: a questionnaire and user interviews. By combing the user’s whole usage process “open—search—use—download—comment—share—pay” to the five dimensions of “content, performance, function, interface and operation”, a digital content product “user experience map” can be created, which quantifies each segment and dimension in the user journey with scores from 1 to 10. In this case, the company can understand how the experience of user interaction looks like and varies over time. Additionally, the “user experience map” can be converted into specific indexes in the user interaction behavior-perception model, namely, the acceptance, pleasure, loyalty, and completion indexes, as shown in Figure 10. The perception data of each dimension of the user’s “turn-on” stage can be converted to the acceptance index of the product. The perception data of each dimension of the user’s search, use, download and comment stage can be converted to the user’s pleasure and completion index. The perception data of each dimension of the users’ sharing and purchase stage can be converted to the user’s loyalty index.
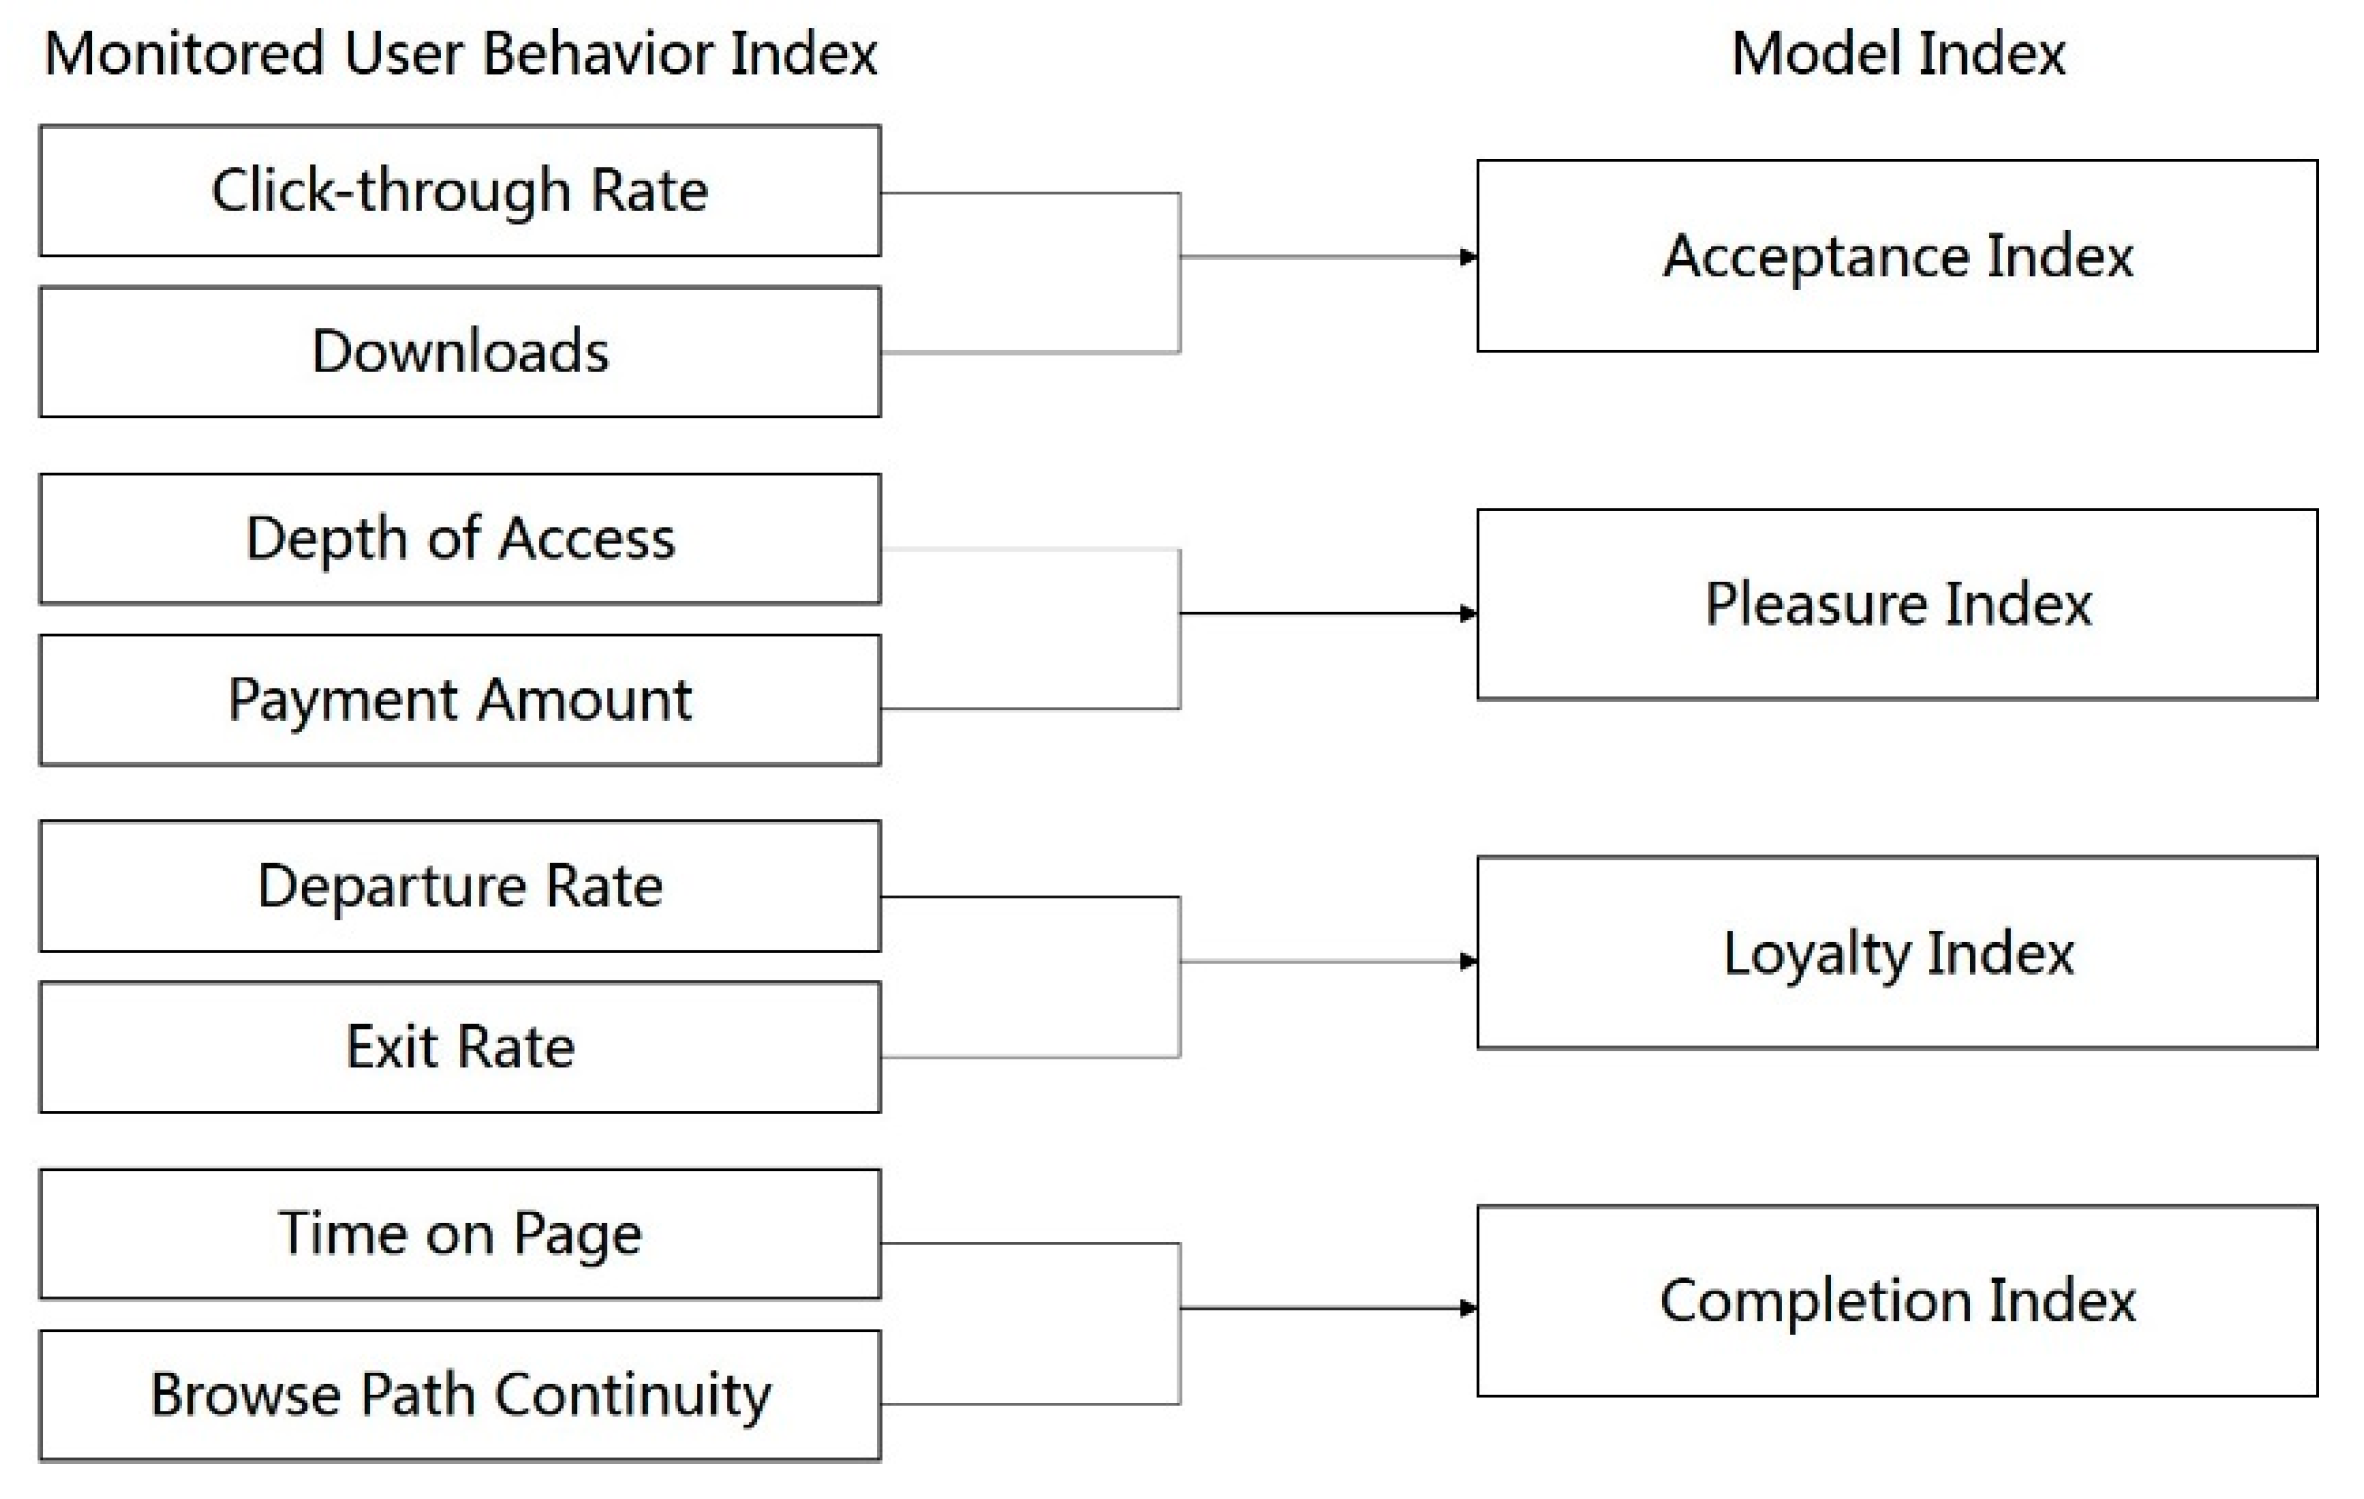
Method 2: user behavior data monitoring. By monitoring the user behavior data related indexes, the user’s real-time behavior trace can be automatically collected, which includes their click-through rate, access depth, time on page, departure rate, exit rate, download amount, payment amount, browsing path, etc. Then, the raw data collected need to be converted to the indexes in the proposed model in Section 4.2.2, namely, the acceptability, pleasure, loyalty, and completion indexes. The correlation between the indexes and the collected user data in the user behavior monitoring is shown in Figure 11. The user’s click-through rate and download data can be converted into the acceptance index. The access depth and payment value data can be converted into the pleasure index. The user’s departure rate and exit rate data can be converted into the loyalty index. The user’s time on page and browse path continuity data can be converted into the completion index.
When user behavior data and experience-perception data are integrated and the converted “acceptance, pleasure, loyalty, and completion” indexes are analyzed, the user experience pain points of their digital content products can be depicted distinctly, which requires pertinence measures to be taken for it. It is essential for companies to output user experience feedback and eliminate product experience drawbacks accordingly by upgrading products in time. In another word, companies should optimize product interaction ability goals with user interaction behavior-perception data to form an extended adoption of the C2B model, namely, the personalized customization format.
In order to verify the effectiveness of the proposed model, we teamed up with the same digital music software company in China to elevate the user experience level of their three APPs, namely, the mobile music APP, cellphone ringtone APP and karaoke APP. Voluntary and anonymous user participation was also demanded during the process of user perception data collection. Both a questionnaire survey and data monitoring were used as the data collection methods. Users were divided into two groups (new users and existing users) according to the proposed model index system shown in Figure 10, to collect the corresponding data.
The four indexes of the user interaction behavior-perception model, namely, the acceptance index, pleasure index, loyalty index, and completion index, were converted and calculated from two data sources. First, we conducted a user perception survey in March 2018, and converted the collected data into the four corresponding indexes, each with a score range of 0 to 10. It was later averaged by the converted indexes from data collected in the user behavior monitoring with the same score range, making the final index score used for analysis ranging from 0 to 10.
Questionnaire Survey: In the user perception survey, three different questionnaires were designed to collect the user’s opinion of their experience of the investigated applications. According to the user experience map proposed in Section 4.2.3, each of the three questionnaires consisted of a series of questions we designed for each segment of the user journey regarding the five aspects of user experience perception, namely, content, function, performance, interface, and operation. All participated users were asked to give a score ranging from 0 to 10 on each aspect of each user journey segment. The user experience perception level of a certain user journey segment is therefore quantified as the average score of five aspects from all users participated, which was further converted to the model index according to the correlation shown in the user experience map (Figure 10). The personal features of the online user perception survey are shown in Table 4.
Data Monitoring: In user behavior data monitoring, the data required for further index conversion was obtained from the company’ BOSS. After gaining permission via email confirmation from the targeted users, we extracted their required 8 types of data from BOSS in the time period of 1st to 31st March. The result of each type of data was calculated by averaging out all the users’ recorded behavior records. For example, we gained the average click-through rate of the company’s mobile music APP by averaging 500 targeted users’ daily click-through rate in March.
Results: The online questionnaire survey results of user perception are shown in Table 5.
The results of the average behavior data from targeted users collected from data monitoring were later converted to the model index and shown in Table 6.
In Table 6, we divided the range of each value into 10 intervals. Among them, the demarcation point value of 10 was determined by the company’s user activity target this year, while the demarcation point of 1 represented the worst user activity performance recorded in the past year (March 2017–February 2018). Once the upper and lower bounds of the fractional interval were set, we determined the remaining boundary points based on linear distribution. After converting the user’s behavior data to a linear score range of 0–10, we further transformed the linear values into model index values according to the corresponding relationship between user data and the model index shown in Figure 11. Considering that each index corresponds to two types of user behavior data, we simply adopted the same weight to each user data linear value, namely, we set the final value of the index as the average value of the two transformed user data linear scores. For example, in the company’s mobile music APP monitoring, the average click-through rate of all targeted users was 74%, which was transformed to the score band of 8 according to Table 6. The average downloads quantity per day of targeted users was 28.3 MB, which was transformed to the score band of 9 according to Table 6. The acceptance index score in user data monitoring of mobile music APP was therefore calculated as 8.5, the average value of score bands of click-through rate and downloads.
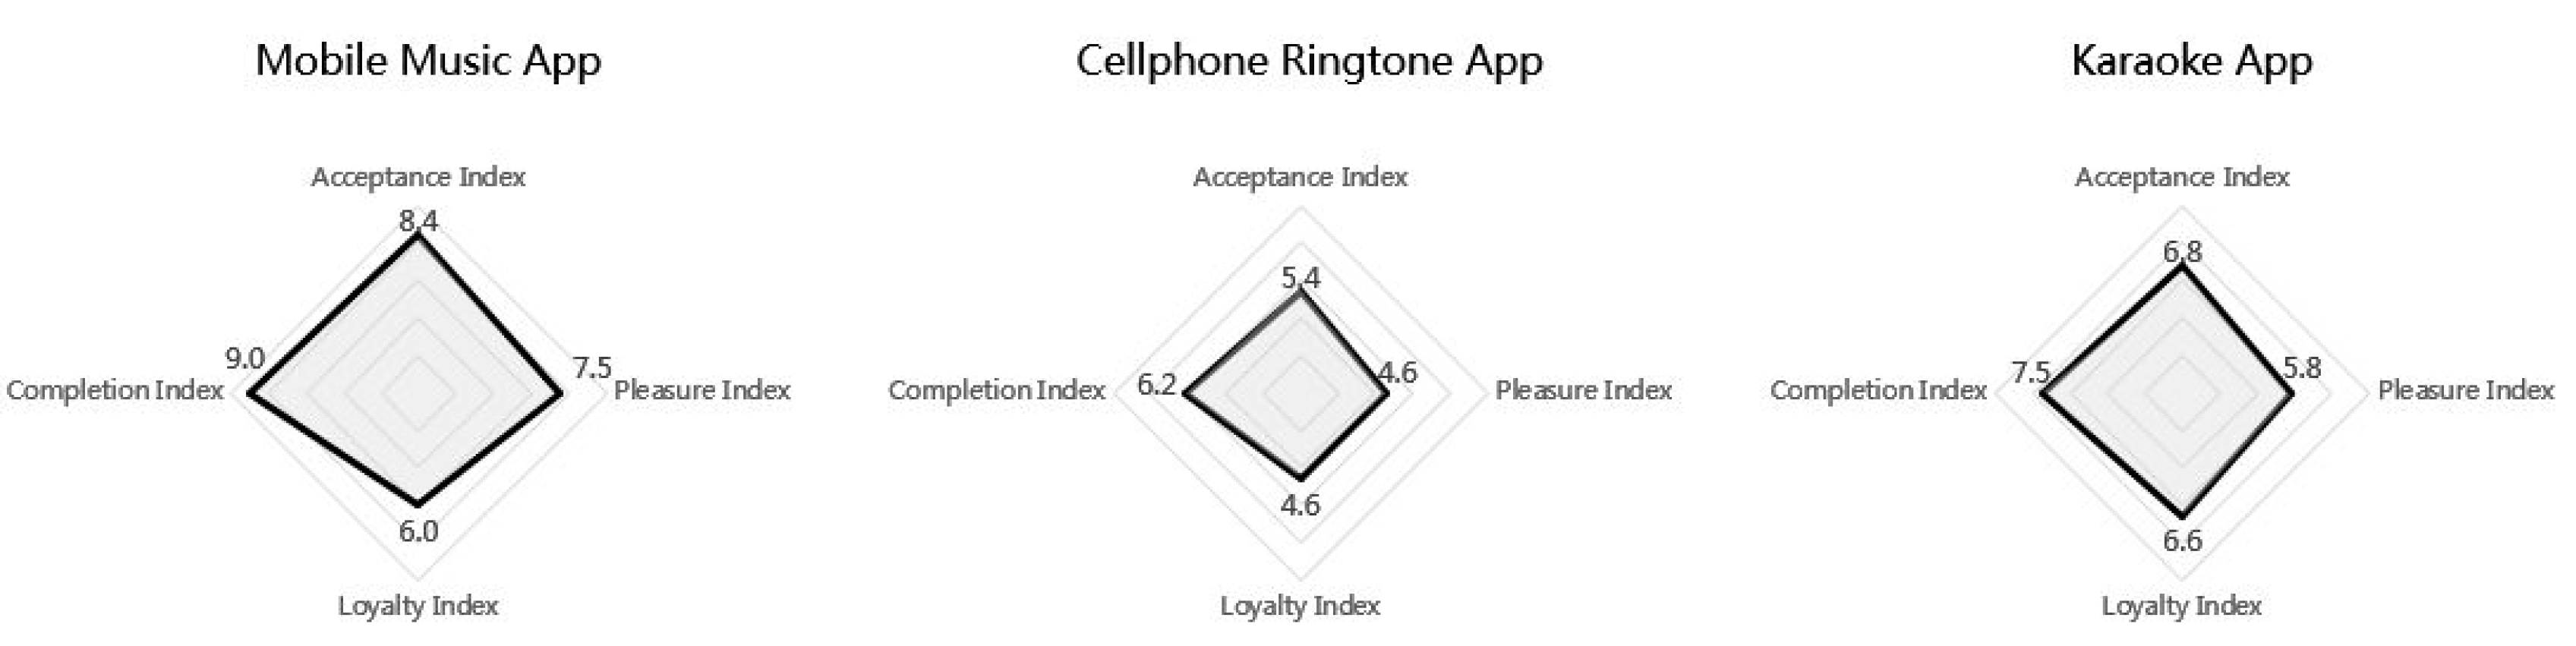
Based on the method proposed above, we quantitatively analyzed the user experience perception model index of March 2018 of the company’s 3 music APPs, as shown in Table 7, and illustrated the user experience index distribution of the 3 APPs in the form of a radar chart, as shown in Figure 12.
By combining the index scores in the user perception survey and user behavior monitoring and averaging them, the final results of the user experience of these 3 music APPs are shown in Figure 12. According to the analysis results, mobile music APP reached the highest overall user perception score among the 3 APP product, while the cellphone ringtone APP was relatively less user-friendly with an average score of only 5.2 of four perception indexes. It can also be observed that the loyalty index and pleasure index of all three APPs were lower than the other two indicators, causing a common brand image weakness in the users’ perception.
The analysis results of the user behavior perception model were adopted in the company’s product optimization process in April 2018. Taking the mobile music APP as an example, the user experience radar chart indicated that although the acceptance index and completion index were in the favorable zone, the loyalty index and pleasure index were dragging behind. Corresponding measures were taken to optimize the user experience in such segments once the drawbacks were located, such as the preferential policy for membership renewal to promote user loyalty, and the introduction of the online music instrument games between stranger users to promote the pleasure level of the APP.
5. Conclusions
Under the new situation in which the positioning and function of digital content products are becoming more and more homogeneous and the market competition is becoming increasingly fierce, user experience has become the key to create a differentiation advantage and seize the commanding height of the industry. Digital content enterprises need to change traditional business thinking, take the user experience as the fundamental starting point, and reshape key business operations such as content purchasing and product designing with the help of big data.
This paper proposed two C2B business models in the enterprises’ key operations based on the big data of user experience through the process of the user experience model design, index system establishment, data collection, and analysis. When being adopted in reality, it is necessary to choose the most suitable user experience data collection and analysis methods in consideration of the actual product strategy, market competition situation, and target user group, so as to truly cash the positive driving effect of big data on the growth of commercial value of digital content products. The following two further suggestions are put forward for digital content companies when developing their own user experience-centric, big data-driven business models.
First of all, we need to take steps towards complying with strengthened data privacy protection rules. One significant regulation that has come into effect recently is the EU General Data Protection Regulation (GDPR). The GDPR aims to build a data protection law framework that gives the control of personal data back to citizens while imposing strict rules on data hosting and processing organizations. Under GDPR rules, the individual owns the right to decline or be informed about the personal data use once he or she agrees to it. The right to access, rectify, and erase personal data is also given to users [39]. The GDPR marks the milestones that the privacy and transparency issues of user personal data have been leveraged to the highest point ever. A sound user experience strategy that complies with GDPR is in urgent need which will help companies not only cope with increased policy risk but also gain the competitive edge in the market by using personal data privacy as a differentiator to attract new customers and retain existing ones. One practical solution is to offer users a data right dashboard which illustrates the detailed information of user experience data use and allows them to manage their data privacy preferences. The privacy dashboard can be implemented by being embedded into the digital content application that enables users to effortlessly manage data privacy-related settings.
Secondly, strengthen the quality control of user experience data sources. In the actual process of the user experience survey, factors such as the survey group, method, timing, and the data processing model all have a direct impact on the results of the user experience analysis. The deviation between the analysis results and the actual circumstance can occur when the factors are improperly selected, which will lead to the misjudgment of the user behavior insight and business decision making, causing a direct revenue loss for those enterprises. Therefore, a strict data quality control standard must be deployed at the upstream of the user experience data source to guarantee the accuracy of the data collection, processing, analysis, and other processes.
Author Contributions
Writing: L.F.; B.S.; Providing case and idea: L.F.; B.S.; K.W.; Revising and Editing: S.-B.T.
Funding
This research was funded by Science and Technology Projects of Key Technology of Prevention and Control Work Safety Serious Accidents [Grant Number beijing-0002-2018AQ]; Science and Technology Research Project of Beijing Municipal Education Commission [Grant Number KM201710038002].
Conflicts of Interest
The authors declare no conflict of interest.
References
- Wang, M.; Wang, C.; Li, X. Analysis on the Characteristics and Business Model of the Digital Content Products. Sci. Technol. Prog. Policy 2009, 26, 45–48. [Google Scholar]
- Norman, D.; Miller, J.; Henderson, A. What You See, Some of What’s in the Future, and How We Go About Doing It: HI at Apple Computer. In Proceedings of the CHI, Denver, CO, USA, 7–11 May 1995. [Google Scholar]
- International Organization for Standardization. Ergonomics of Human System Interaction—Part 210: Human-Centered Design for Interactive Systems (formerly known as 13407); International Organization for Standardization: Geneva, Switzerland, 2009. [Google Scholar]
- Alban, L. Quality of Experience: Defining the Criteria for Effective Interaction Design. Interactions 1996, 3, 11–15. [Google Scholar] [CrossRef]
- Morville, P. Ambient Findability: What We Find Changes Who We Become; O’Reilly Media, Inc.: Sebastopol, CA, USA, 2005. [Google Scholar]
- Dodds, W.B.; Monroe, K.B.; Grewal, D. Effects of Price, Brand, and Store Information on Buyers’ Product Evaluations. J. Mark. Res. 1991, 28, 307–319. [Google Scholar] [CrossRef]
- Mattelmäki, T. Applying probes —From inspirational notes to collaborative insights. Codesign 2005, 1, 83–102. [Google Scholar]
- Shin, C.B. A Study on the Pyramid Model for Finding User Value—Focus on the Goods as an User Experience System. J. Korean Soc. Des. Cult. 2017, 23, 473–482. [Google Scholar]
- Venkatraman, M. IT-Enabled Business Transformation: From Automation to Business Scope Redefinition. MIT Sloan Manag. Rev. 1994, 35, 73–87. [Google Scholar]
- Pateli, A.G.; Giaglis, G.M. A Framework for Understanding and Analysing eBusiness Modells. In Proceedings of the 16th Bled Electronic Commerce Conference: eTransformation, Bled, Slovenia, 9–11 June 2003; pp. 329–348. [Google Scholar]
- Li, C. Innovations of Business Model Caused by the Next Generation of Information Technology. China Soft Sci. 2012, 4, 167–176. [Google Scholar]
- Jiang, W.; Chai, H. Research on big data in business model innovation based on GA-BP modell. In Proceedings of the IEEE International Conference on Service Operations and Logistics, and Informatics, Beijing, China, 10–12 July 2016. [Google Scholar]
- Kim, H.; Choi, M.; Jeon, B.; Kim, H. A Study on the Big Data Business Modell for the Entrepreneurial Ecosystem of the Creative Economy. In Advances in Parallel and Distributed Computing and Ubiquitous Services; Springer: Singapore, 2016. [Google Scholar]
- Chen, H.M.; Kazman, R.; Garbajosa, J.; González, E. Big Data Value Engineering for Business Modell Innovation. In Proceedings of the Hawaii International Conference on System Sciences, Hilton Waikoloa Village, HI, USA, 4–7 January 2017. [Google Scholar]
- Hao, J. Research on Business Model Innovation for the Era of Big Data. Sci. Technol. Prog. Policy 2014, 07, 15–19. [Google Scholar]
- Corey Stern. A User Experience Model for Project Success [N/OL]. Available online: http://uxmag.com/articles/cubi-a-user-experience-modell-for-project-success (accessed on 25 September 2014).
- Anderl, E.; Becker, I.; Wangenheim, F.V.; Schumann, J.H. Mapping the Customer Journey: Lessons Learned from Graph-based Online Attribution Modeling. Int. J. Res. Mark. 2016, 33, 457–474. [Google Scholar] [CrossRef]
- Zhu, J.; Zhang, G.; Liu, X. Clarity of a Philosophy of Data Analysis during the Age of Big Data. Stat. Res. 2014, 31, 10–19. [Google Scholar]
- Zi, W. Research on the Evolution and Construction of Business Ecosystem in Big Data Era. J. Soc. Sci. 2013, 12, 55–62. [Google Scholar]
- Homburg, C.; Jozić, D.; Kuehnl, C. Customer Experience Management: Toward Implementing an Evolving Marketing Concept. J. Acad. Mark. Sci. 2017, 45, 377–401. [Google Scholar] [CrossRef]
- Allada, V.K.; dubey, R. Investigating the Online Banking Customer Satisfaction Model under the Controlled Effect of Demographic Variables. Int. J. Serv. Oper. Manag. 2014, 18, 281–304. [Google Scholar] [CrossRef]
- Ju, C.; Wang, S. User-Mood Incorporated Hybrid Music-Recommendation Method. J. China Soc. Sci. Tech. Inf. 2017, 36, 578–589. [Google Scholar]
- Tsai, S. Using the DEMATEL Model to Explore the Job Satisfaction of Research and Development Professionals in China’s Photovoltaic Cell Industry. Renew. Sustain. Energy Rev. 2018, 81, 62–68. [Google Scholar] [CrossRef]
- Lee, Y.; Hsiao, Y.; Peng, C.; Tsai, S.; Wu, C.; Chen, Q. Using Mahalanobis-Taguchi System, Logistic Regression and Neural Network Method to Evaluate Purchasing Audit Quality. Proc. Inst. Mech. Eng. Part B 2015, 229, 3–12. [Google Scholar] [CrossRef]
- Lee, Y.; Chen, C.; Tsai, S.; Wang, C. Discussing green environmental performance and competitive strategies. Pensee 2014, 76, 190–198. [Google Scholar]
- Liu, B.; Li, T.; Tsai, S. Low carbon strategy analysis of competing supply chains with different power structures. Sustainability 2017, 9, 835. [Google Scholar] [CrossRef]
- Qu, Q.; Tsai, S.; Tang, M.; Xu, C.; Dong, W. Marine ecological environment management based on ecological compensation mechanisms. Sustainability 2016, 8, 1267. [Google Scholar] [CrossRef]
- Lee, Y.; Wang, Y.; Chien, C.; Wu, C.; Lu, S.; Tsai, S.; Dong, W. Applying revised gap analysis model in measuring hotel service quality. SpringerPlus 2016, 5, 1191. [Google Scholar] [CrossRef] [PubMed]
- Wang, J.; Yang, J.; Chen, Q.; Tsai, S. Collaborative Production Structure of Knowledge Sharing Behavior in Internet Communities. Mob. Inf. Syst. 2016, 2016, 8269474. [Google Scholar] [CrossRef]
- Tsai, S.; Lee, Y.; Guo, J. Using modified grey forecasting models to forecast the growth trends of green materials. Proc. Inst. Mech. Eng. Part B 2014, 228, 931–940. [Google Scholar] [CrossRef]
- Tsai, S.; Zhou, J.; Gao, Y.; Wang, J.; Li, G.; Zheng, Y.; Ren, P.; Xu, W. Combining FMEA with DEMATEL Models to Solve Production Process Problems. PLoS ONE 2017, 12, e0183634. [Google Scholar] [CrossRef] [PubMed]
- Ge, B.; Jiang, D.; Gao, Y.; Tsai, S. The influence of legitimacy on a proactive green orientation and green performance: A study based on transitional economy scenarios in china. Sustainability 2016, 8, 1344. [Google Scholar] [CrossRef]
- Lee, S.; Su, J.; Tsai, S.; Lu, T.; Dong, W. A comprehensive survey of government auditors’ self-efficacy and professional Development for improving audit quality. SpringerPlus 2016, 5, 1263. [Google Scholar] [CrossRef] [PubMed]
- Chen, H.; Wu, C.; Tsai, S.; Yu, J.; Wang, J.; Zheng, Y. Exploring key factors in online shopping with a hybrid model. SpringerPlus 2016, 5, 2046. [Google Scholar] [CrossRef] [PubMed]
- Lee, Y.; Wang, Y.; Lu, S.; Hsieh, Y.; Chien, C.; Tsai, S.; Dong, W. An empirical research on customer satisfaction study: A consideration of different levels of performance. SpringerPlus 2016, 5, 1577. [Google Scholar] [CrossRef] [PubMed]
- Wang, J.; Yang, J.; Chen, Q.; Tsai, S. Creating the sustainable conditions for knowledge information sharing in virtual community. SpringerPlus 2016, 5, 1019. [Google Scholar] [CrossRef] [PubMed]
- Chang, L.; Lu, W. Influencing Factors of Subscriber’s Responsive Expectation to Operator. Res. Econ. Manag. 2015, 36, 120–126. [Google Scholar]
- Rosenbaum, M.S.; Otalora, M.L.; Ramírez, G.C. How to Create A Realistic Customer Journey Map. Bus. Horiz. 2016. [Google Scholar] [CrossRef]
- Voigt, P.; Bussche, A.V.D. The EU General Data Protection Regulation (GDPR); Springer International Publishing: Cham, Switzerland, 2017. [Google Scholar]
Figure 1.
Corey Stern’s CUBI user experience model.

Figure 2.
The CUBI-C2B model of digital content products.

Figure 3.
The driving effects of big data for digital content enterprises.

Figure 4.
The roadmap of the CUBI-C2B Model adoption in digital content companies.

Figure 5.
The user need collection methods in the digital content product design stage.

Figure 6.
A content needs profile example based on the CUBI-C2B model.

Figure 7.
The newly released album download records in May 2018 of the company after introducing the users’ content needs model.
Figure 7.
The newly released album download records in May 2018 of the company after introducing the users’ content needs model.

Figure 8.
The user interaction behavior–perception model for digital content products.

Figure 9.
The user interaction behavior–perception model index system.

Figure 10.
The user experience data analysis and index conversion.

Figure 11.
The monitoring index and index transformation of user behavior data.

Figure 12.
The user experience radar chart based on user interaction behavior-perception model.


Table 1.
The users’ basic features (user content needs survey).
| Feature | User Distribution |
|---|---|
| Gender | 45.1% Male |
| 54.9% Female | |
| Age | 13.1% Under 20 years old |
| 47.6% 20–29 years old | |
| 23.3% 30–39 years old | |
| 11.2% 40–49 years old | |
| 3.4% 50–59 years old | |
| 0.3% 60 years old and above | |
| Education | 5.1% Elementary school |
| 6.3% Middle school | |
| 26.9% High school | |
| 38.3% Bachelor’s degree | |
| 22.1% Master’s degree | |
| 5.9% Other (Ph.D., Professional Course, Uneducated, etc.) | |
| Occupation | 35.2% Employee |
| 20.4% Freelance | |
| 31.6% Student | |
| 12.1% Unemployed | |
| 0.7% Retired | |
| Phone OS | 23.0% iOS |
| 75.0% Android | |
| 2.0% Other (Windows, Symbian OS, etc.) |
Table 2.
The online questionnaire survey results (user content needs survey).
| Question | User Distribution |
|---|---|
| Which of the following region’s music do you listen to most often? | 36.7% Mainland China |
| 22.8% Taiwan | |
| 18.0% Japan & South Korea | |
| 17.2% North America, Europe & Australia | |
| 1.9% Latin America | |
| 3.4% Other (Malaysia, India, Africa, etc.) | |
| Which of the following music genre do you usually listen to? (No more than 3 choices) | 48.0% Pop |
| 20.4% Ballad | |
| 17.9% Hip Hop | |
| 14.8% Electronic Music | |
| 11.2% R&B | |
| 9.7% Country & Folk Music | |
| 5.6% Rock & Roll | |
| 4.3% Latin | |
| 2.2% Classical Music | |
| 0.7% Jazz |
Table 3.
The users’ interest level scores of pop music artists from mainland China.
| Question | User Score |
|---|---|
| From 0 to 10, how interested are you in the following music artists? 0 means with absolutely no interest, 10 means extremely interested. | 8.7/10 Hua Chenyu |
| 8.1/10 Li Ronghao | |
| 6.4/10 Jane Zhang | |
| 5.2/10 Zhang Jie | |
| 4.5/10 Yuan Yawei |
Table 4.
The users’ basic features (user perception questionnaire survey).
| Feature | Option | User Distribution | ||
|---|---|---|---|---|
| Mobile Music APP Survey | Cellphone Ringtone APP Survey | Karaoke APP Survey | ||
| Gender | Male | 46.6% | 43.6% | 40.6% |
| Female | 53.4% | 56.4% | 59.4% | |
| Age | Under 20 | 20.2% | 8.4% | 21.6% |
| 20–29 | 45.4% | 37.8% | 49.8% | |
| 30–39 | 28.2% | 38.6% | 26.6% | |
| 40–49 | 5.2% | 12.8% | 1.6% | |
| 50–59 | 0.6% | 2.0% | 0.4% | |
| 60 and above | 0.2% | 0.4% | 0.0% | |
| Education | Elementary School | 4.0% | 7.8% | 4.8% |
| Middle School | 6.8% | 13.6% | 7.4% | |
| High School | 28.8% | 39.8% | 33.6% | |
| Bachelor’s Degree | 38.4% | 15.0% | 36.8% | |
| Master’s Degree | 13.6% | 3.4% | 11.0% | |
| Other (Ph. D, Professional Course, Uneducated, etc.) | 8.4% | 20.4% | 6.4% | |
| Occupation | Employee | 42.8% | 47.2% | 39.6% |
| Freelance | 16.6% | 29.8% | 20.8% | |
| Student | 32.4% | 15.2% | 33.0% | |
| Unemployed | 8.0% | 7.0% | 6.4% | |
| Retired | 0.2% | 0.8% | 0.2% | |
| Phone OS | iOS | 21.6% | 16.2% | 20.2% |
| Android | 76.8% | 83.2% | 79.6% | |
| Other (Windows, Symbian OS, etc.) | 1.6% | 0.6% | 0.8% | |
Table 5.
The online questionnaire survey results (user perception survey).
| Mobile Music APP | Cellphone Ringtone APP | Karaoke APP | ||
|---|---|---|---|---|
| Acceptance Index | Number of Questions | 4 | 4 | 4 |
| Average Score | 8.3 | 6.3 | 8.0 | |
| Pleasure Index | Number of Questions | 6 | 6 | 6 |
| Average Score | 7.4 | 7.1 | 8.1 | |
| Loyalty Index | Number of Questions | 4 | 4 | 4 |
| Average Score | 7.9 | 6.1 | 6.6 | |
| Completion Index | Number of Questions | 5 | 5 | 5 |
| Average Score | 8.6 | 7.8 | 6.9 |
Table 6.
The model index score bands and the corresponding value of 8 types of collected user behavior data.
Table 6.
The model index score bands and the corresponding value of 8 types of collected user behavior data.
| Model Index Score Band | Click-through Rate (%) | Downloads (MB per Day) | Depth of Access (Layers) | Payment Amount (RMB per Month) | Departure Rate (%) | Exit Rate (%) | Time on Page (Seconds Each Visit) | Browse Path Continuity (%) | |
|---|---|---|---|---|---|---|---|---|---|
| 10 | 91–100 | Above 30.0 | Above 10 | Above 30 | Below 5.0 | Below 8.0 | Above 600 | Above 97 | |
| 9 | 81–90 | 27.1–30.0 | 9 | 27–30 | 5.1–10.0 | 8.1–16.0 | 541–600 | 94–96 | |
| 8 | 71–80 | 24.1–27.0 | 8 | 24–26 | 10.1–15.0 | 16.1–24.0 | 481–540 | 91–93 | |
| 7 | 61–70 | 21.1–24.0 | 7 | 21–23 | 15.1–20.0 | 24.1–32.0 | 421–480 | 88–90 | |
| 6 | 51–60 | 18.1–21.0 | 5 | 18–20 | 20.1–25.0 | 32.1–40.0 | 361–420 | 85–87 | |
| 5 | 41–50 | 15.1–18.0 | 6 | 15–17 | 25.1–30.0 | 40.1–48.0 | 301–360 | 82–84 | |
| 4 | 31–40 | 12.1–15.0 | 4 | 12–14 | 30.1–35.0 | 48.1–56.0 | 241–300 | 79–81 | |
| 3 | 21–30 | 9.1–12.0 | 3 | 9–11 | 35.1–40.0 | 56.1–64.0 | 181–240 | 76–78 | |
| 2 | 11–20 | 6.1–9.0 | 2 | 6–8 | 40.1–45.0 | 64.1–72.0 | 121–180 | 73–75 | |
| 1 | 1–10 | 3.1–6.0 | 1 | 3–5 | 45.1–50.0 | 72.1–80.0 | 61–120 | 72–74 | |
| 0 | Below 1 | Below 3.1 | 0 | Below 3 | Above 50.0 | Above 80.0 | Below 60 | Below 72 |
Table 7.
The user behavior data collected from the monitoring and corresponding index score.
| Acquired Data | Mobile Music APP | Cellphone Ringtone APP | Karaoke APP | |
|---|---|---|---|---|
| Click-through Rate | Value (%) | 74 | 66 | 53 |
| Model Index Score Band | 8 | 7 | 6 | |
| Downloads | Value (MB per day) | 28.3 | 8.0 | 17.7 |
| Model Index Score Band | 9 | 2 | 5 | |
| Acceptance Index Score | 8.5 | 4.5 | 5.5 | |
| Depth of Access | Value (Layers) | 7 | 3 | 3 |
| Model Index Score Band | 7 | 3 | 3 | |
| Payment Amount | Value (RMB per month) | 26 | 5 | 12 |
| Model Index Score Band | 8 | 1 | 4 | |
| Pleasure Index Score | 7.5 | 2.0 | 3.5 | |
| Departure Rate | Value (%) | 37.3 | 46.2 | 21.0 |
| Model Index Score Band | 3 | 1 | 6 | |
| Exit Rate | Value (%) | 41.4 | 46.9 | 27.8 |
| Model Index Score Band | 5 | 5 | 7 | |
| Loyalty Index | 4.0 | 3.0 | 6.5 | |
| Time on Page | Value (seconds each visit) | 394 | 178 | 560 |
| Model Index Score Band | 6 | 2 | 9 | |
| Browse Path Continuity | Value (%) | 95 | 88 | 91 |
| Model Index Score Band | 9 | 7 | 8 | |
| Completion Index | 7.5 | 4.5 | 8.5 | |
© 2018 by the authors. Licensee MDPI, Basel, Switzerland. This article is an open access article distributed under the terms and conditions of the Creative Commons Attribution (CC BY) license (http://creativecommons.org/licenses/by/4.0/).
Share and Cite
MDPI and ACS Style
Feng, L.; Sun, B.; Wang, K.; Tsai, S.-B. An Empirical Study on the Design of Digital Content Products from a Big Data Perspective. Sustainability 2018, 10, 3092. https://doi.org/10.3390/su10093092
AMA Style
Feng L, Sun B, Wang K, Tsai S-B. An Empirical Study on the Design of Digital Content Products from a Big Data Perspective. Sustainability. 2018; 10(9):3092. https://doi.org/10.3390/su10093092
Chicago/Turabian StyleFeng, Lin, Baoping Sun, Kai Wang, and Sang-Bing Tsai. 2018. "An Empirical Study on the Design of Digital Content Products from a Big Data Perspective" Sustainability 10, no. 9: 3092. https://doi.org/10.3390/su10093092
Note that from the first issue of 2016, this journal uses article numbers instead of page numbers. See further details here.